User login
The term “academic hospitalist” has come to mean more than a mere affiliation to an academic medical center (AMC). Academic hospitalists perform various clinical roles like staffing house staff teams, covering nonteaching services, critical care services, procedure teams, night services, medical consultation, and comanagement services.

Over the last decade, academic hospitalists have successfully managed many nonclinical roles in areas like research, medical unit leadership, faculty development, faculty affairs, quality, safety, informatics, utilization review, clinical documentation, throughput, group management, hospital administration, and educational leadership. The role of an academic hospital is as clear as a chocolate martini these days. Here we present some recent trends in academic hospital medicine.
Compensation
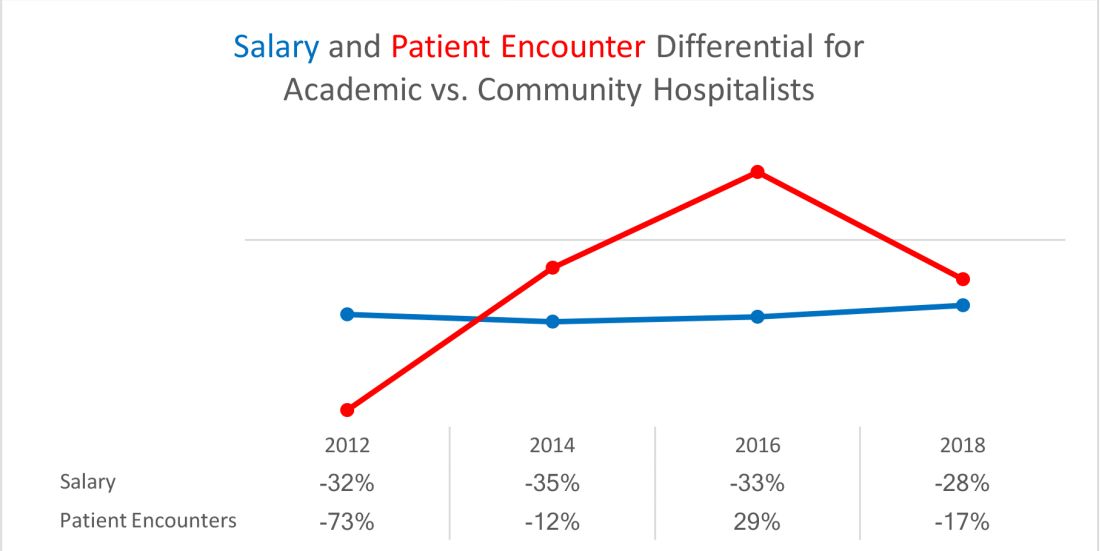
From SHM’s State of Hospital Medicine report (SoHM)2014 to 2018 data, the median compensation for U.S. academic hospitalists has risen by an average of 5.15% every year, although increases vary by rank.1 From 2016 to 2018, clinical instructors saw the most significant growth, 11.23% per year, suggesting a need to remain competitive for junior hospitalists. Compensation also varies by geographic area, with the Southern region reporting the highest compensation. Over the last decade, academic hospitalists received, on average, a 28%-35% lower salary, compared with community hospitalists.
Patient population and census
Lower patient encounters and compensation of the academic hospitalists poses the chicken or the egg dilemma. In the 2018 SoHM report, academic hospitalists had an average of 17% fewer encounters. Of note, AMC patients tend to have higher complexity, as measured by the Case Mix Index (CMI – the average diagnosis-related group weight of a hospital).2 A higher CMI is a surrogate marker for the diagnostic diversity, clinical complexity, and resource needs of the patient population in the hospital.
Productivity and financial metrics
The financial bottom line is a critical aspect, and as a report in the Journal of Hospital Medicine described, all health care executives look at business metrics while making decisions.3 Below are some significant academic and community comparisons from SoHM 2018.
- Collections, encounters, and wRVUs (work relative value units) were highly correlated. All of them were lower for academic hospitalists, corroborating the fact that they see a smaller number of patients. Clinical full-time equivalents (cFTE) is a vernacular of how much of the faculty time is devoted to clinical activities. The academic data from SoHM achieves the same target, as it is standardized to 100% billable clinical activity, so the fact that many academic hospitalists do not work a full-time clinical schedule is not a factor in their lower production.
- Charges had a smaller gap likely because of sicker patients in AMCs. The higher acuity difference can also explain 12% higher wRVU/encounter for academic hospitalists.
- The wRVU/encounter ratio can indicate a few patterns: high acuity of patients in AMCs, higher levels of evaluation and management documentation, or both. As the encounters and charges have the same percentage differences, we would place our bets on the former.
- Compensation per encounter and compensation per wRVU showed that academic hospitalists do get a slight advantage.
CMI and wRVUs
Although the SoHM does not capture information on patient acuity or CMI, we speculate that the relationship between CMI and wRVUs may be more or less linear at lower levels of acuity. However, once level III E/M billing is achieved (assuming there is no critical care provided), wRVUs/encounter plateau, even as acuity continues to increase. This plateau effect may be seen more often in high-acuity AMC settings than in community hospitals.
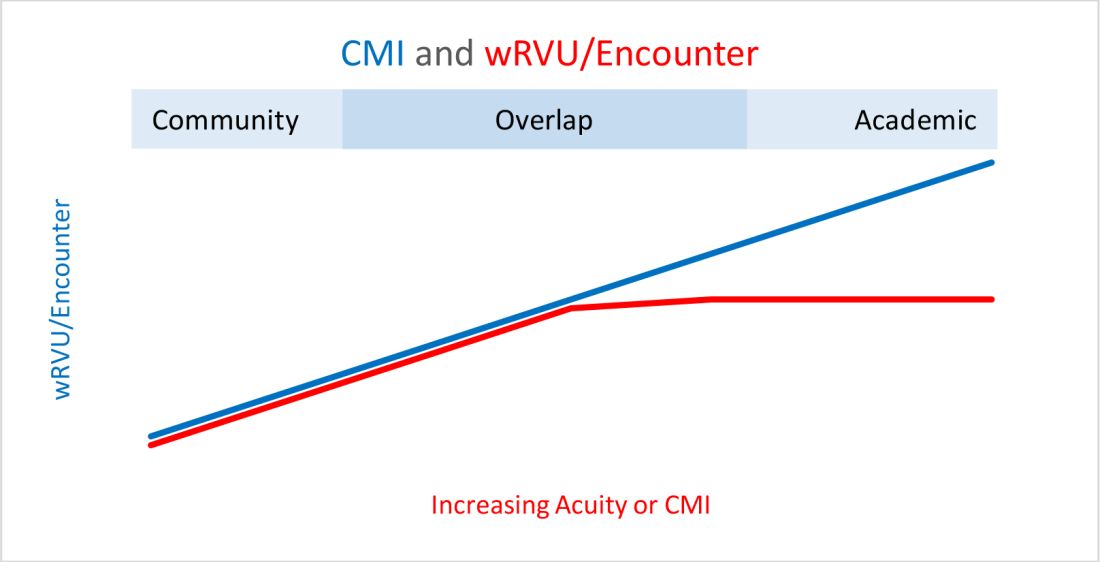
So, in our opinion, compensation models based solely on wRVU production would not do justice for hospitalists in AMC settings since these models would fail to capture the extra work involved with very-high-acuity patients. SoHM 2018 shows the financial support per wRVU for AMC is $45.81, and for the community is $41.28, an 11% difference. We think the higher financial support per wRVU for academic practices may be related to the lost wRVU potential of caring for very-high-acuity patients.
Conclusion
In an academic setting, hospitalists are reforming the field of hospital medicine and defining the ways we could deliver care. They are the pillars of collaboration, education, research, innovation, quality, and safety. It would be increasingly crucial for academic hospitalist leaders to use comparative metrics from SoHM to advocate for their group. The bottom line can be explained by the title of the qualitative study in JHM referenced above: “Collaboration, not calculation.”3
Dr. Chadha is division chief for the division of hospital medicine at the University of Kentucky Healthcare, Lexington. He actively leads efforts of recruiting, scheduling, practice analysis, and operation of the group. He is a first-time member of the practice analysis committee. Ms. Dede is division administrator for the division of hospital medicine at the University of Kentucky Healthcare. She prepares and manages budgets, liaisons with the downstream revenue teams, and contributes to the building of academic compensation models. She is serving in the practice administrators committee for the second year and is currently vice chair of the Executive Council for the Practice Administrators special interest group.
References
1. State of Hospital Medicine Report. https://www.hospitalmedicine.org/practice-management/shms-state-of-hospital-medicine/
2. Deloitte Center for Health Solutions. Academic Medical Centers: Joining forces with community providers for broad benefits and positive outcomes. 2015. https://www2.deloitte.com/us/en/pages/life-sciences-and-health-care/articles/academic-medical-centers-consolidation.html
3. White AA et al. Collaboration, not calculation: A qualitative study of how hospital executives value hospital medicine groups. J Hosp Med. 2019;14(10):662‐7.
The term “academic hospitalist” has come to mean more than a mere affiliation to an academic medical center (AMC). Academic hospitalists perform various clinical roles like staffing house staff teams, covering nonteaching services, critical care services, procedure teams, night services, medical consultation, and comanagement services.
Over the last decade, academic hospitalists have successfully managed many nonclinical roles in areas like research, medical unit leadership, faculty development, faculty affairs, quality, safety, informatics, utilization review, clinical documentation, throughput, group management, hospital administration, and educational leadership. The role of an academic hospital is as clear as a chocolate martini these days. Here we present some recent trends in academic hospital medicine.
Compensation
From SHM’s State of Hospital Medicine report (SoHM)2014 to 2018 data, the median compensation for U.S. academic hospitalists has risen by an average of 5.15% every year, although increases vary by rank.1 From 2016 to 2018, clinical instructors saw the most significant growth, 11.23% per year, suggesting a need to remain competitive for junior hospitalists. Compensation also varies by geographic area, with the Southern region reporting the highest compensation. Over the last decade, academic hospitalists received, on average, a 28%-35% lower salary, compared with community hospitalists.
Patient population and census
Lower patient encounters and compensation of the academic hospitalists poses the chicken or the egg dilemma. In the 2018 SoHM report, academic hospitalists had an average of 17% fewer encounters. Of note, AMC patients tend to have higher complexity, as measured by the Case Mix Index (CMI – the average diagnosis-related group weight of a hospital).2 A higher CMI is a surrogate marker for the diagnostic diversity, clinical complexity, and resource needs of the patient population in the hospital.
Productivity and financial metrics
The financial bottom line is a critical aspect, and as a report in the Journal of Hospital Medicine described, all health care executives look at business metrics while making decisions.3 Below are some significant academic and community comparisons from SoHM 2018.
- Collections, encounters, and wRVUs (work relative value units) were highly correlated. All of them were lower for academic hospitalists, corroborating the fact that they see a smaller number of patients. Clinical full-time equivalents (cFTE) is a vernacular of how much of the faculty time is devoted to clinical activities. The academic data from SoHM achieves the same target, as it is standardized to 100% billable clinical activity, so the fact that many academic hospitalists do not work a full-time clinical schedule is not a factor in their lower production.
- Charges had a smaller gap likely because of sicker patients in AMCs. The higher acuity difference can also explain 12% higher wRVU/encounter for academic hospitalists.
- The wRVU/encounter ratio can indicate a few patterns: high acuity of patients in AMCs, higher levels of evaluation and management documentation, or both. As the encounters and charges have the same percentage differences, we would place our bets on the former.
- Compensation per encounter and compensation per wRVU showed that academic hospitalists do get a slight advantage.
CMI and wRVUs
Although the SoHM does not capture information on patient acuity or CMI, we speculate that the relationship between CMI and wRVUs may be more or less linear at lower levels of acuity. However, once level III E/M billing is achieved (assuming there is no critical care provided), wRVUs/encounter plateau, even as acuity continues to increase. This plateau effect may be seen more often in high-acuity AMC settings than in community hospitals.
So, in our opinion, compensation models based solely on wRVU production would not do justice for hospitalists in AMC settings since these models would fail to capture the extra work involved with very-high-acuity patients. SoHM 2018 shows the financial support per wRVU for AMC is $45.81, and for the community is $41.28, an 11% difference. We think the higher financial support per wRVU for academic practices may be related to the lost wRVU potential of caring for very-high-acuity patients.
Conclusion
In an academic setting, hospitalists are reforming the field of hospital medicine and defining the ways we could deliver care. They are the pillars of collaboration, education, research, innovation, quality, and safety. It would be increasingly crucial for academic hospitalist leaders to use comparative metrics from SoHM to advocate for their group. The bottom line can be explained by the title of the qualitative study in JHM referenced above: “Collaboration, not calculation.”3
Dr. Chadha is division chief for the division of hospital medicine at the University of Kentucky Healthcare, Lexington. He actively leads efforts of recruiting, scheduling, practice analysis, and operation of the group. He is a first-time member of the practice analysis committee. Ms. Dede is division administrator for the division of hospital medicine at the University of Kentucky Healthcare. She prepares and manages budgets, liaisons with the downstream revenue teams, and contributes to the building of academic compensation models. She is serving in the practice administrators committee for the second year and is currently vice chair of the Executive Council for the Practice Administrators special interest group.
References
1. State of Hospital Medicine Report. https://www.hospitalmedicine.org/practice-management/shms-state-of-hospital-medicine/
2. Deloitte Center for Health Solutions. Academic Medical Centers: Joining forces with community providers for broad benefits and positive outcomes. 2015. https://www2.deloitte.com/us/en/pages/life-sciences-and-health-care/articles/academic-medical-centers-consolidation.html
3. White AA et al. Collaboration, not calculation: A qualitative study of how hospital executives value hospital medicine groups. J Hosp Med. 2019;14(10):662‐7.