User login
The prevalence of diabetes mellitus continues to increase, now affecting almost 26 million people in the United States alone.[1] Hospitalizations associated with diabetes also continue to rise,[2] and nearly 50% of the $174 billion annual costs related to diabetes care in the United States are for inpatient hospital stays.[3] In recent years, inpatient glucose control has received considerable attention, and consensus statements for glucose targets have been published.[4, 5, 6]
A number of developments support the rationale for tracking and reporting inpatient glucose control. For instance, there are clinical scenarios where treatment of hyperglycemia has been shown to lead to better patient outcomes.[6, 7, 8, 9] Second, several organizations have recognized the value of better inpatient glucose management and have developed educational resources to assist practitioners and their institutions toward achieving that goal.[10, 11, 12, 13, 14] Finally, pay‐for‐performance requirements are emerging that are relevant to inpatient diabetes management.[15, 16]
Reports on the status of inpatient glucose control in large samples of US hospitals are now becoming available, and their findings suggest differences on the basis of hospital size, hospital type, and geographic location.[17, 18] However, these reports represent cross‐sectional studies, and little is known about trends in hospital glucose control over time. To determine whether changes were occurring, we obtained inpatient point‐of‐care blood glucose (POC‐BG) data from 126 hospitals for January to December 2009 and compared these with glycemic control data collected from the same hospitals for January to December 2007,[19] separately analyzing measurements from the intensive care unit (ICU) and the non‐intensive care unit (non‐ICU).
METHODS
Data Collection
The methods we used for data collection have been described previously.[18, 19, 20] Hospitals in the study used standard bedside glucose meters downloaded to the Remote Automated Laboratory System‐Plus (RALS‐Plus) (Medical Automation Systems, Charlottesville, VA). We originally evaluated data for adult inpatients for the period from January to December 2007[19]; for this study, we extracted POC‐BG from the same hospitals for the period from January to December 2009. Data excluded measurements obtained in emergency departments. Patient‐specific data (age, sex, race, and diagnoses) were not provided by hospitals, but individual patients could be distinguished by a unique identifier and also by location (ICU vs non‐ICU).
Hospital Selection
The characteristics of the 126 hospitals have been published previously.[19] However, hospital characteristics for 2009 were reevaluated for this analysis using the same methods already described for 2007[19] to determine whether any changes had occurred. Briefly, hospital characteristics during 2009 were determined via a combination of accessing the hospital Web site, consulting the Hospital Blue Book (Billian's HealthDATA; Billian Publishing Inc., Atlanta, Georgia), and determining membership in the Council of Teaching Hospitals and Health Systems of the Association of American Medical Colleges. The characteristics of the hospitals were size (number of beds), type (academic, urban community, or rural), and geographic region (Northeast, Midwest, South, or West). Per the Hospital Blue Book, a rural hospital is a hospital that operates outside of a metropolitan statistical area, typically with fewer than 100 beds, whereas an urban hospital is located within a metropolitan statistical area, typically with more than 100 beds. Institutions provided written permission to remotely access their glucose data and combine it with other hospitals into a single database for analysis. Patient data were deidentified, and consent to retrospective analysis and reporting was waived. The analysis was considered exempt by the Mayo Clinic Institutional Review Board. Participating hospitals were guaranteed confidentiality regarding their data.
Statistical Analysis
ICU and non‐ICU glucose datasets were differentiated on the basis of the download location designated by the RALS‐Plus database. As previously described, patient‐day‐weighted mean POC‐BG values were calculated as means of daily POC‐BG averaged per patient across all days during the hospital stay.[18, 19] We determined the overall patient‐day‐weighted mean values, and also the proportion of patient‐day‐weighted mean values greater than 180, 200, 250, 300, 350, and 400 mg/dL.[18, 19] We also examined the data to determine if there were any changes in the proportion of patient hospital days when there was at least 1 value <70 mg/dL or <40 mg/dL.
Differences in patient‐day‐weighted mean POC‐BG values between the years 2007 and 2009 were assessed in a mixed‐effects model with the term of year as the fixed effect and hospital characteristics as the random effect. The glucose trends between years 2007 and 2009 were examined to identify any differentiation by hospital characteristics by conducting mixed‐effects models using the terms of year, hospital characteristics (hospital size by bed capacity, hospital type, or geographic region), and interaction between year as the fixed effects and hospital characteristics as the random effect. These analyses were performed separately for ICU patients and non‐ICU patients. Values were compared between data obtained in 2009 and that obtained previously in 2007 using the Pearson [2] test. The means within the same category of hospital characteristics were compared for the years 2007 and 2009.
RESULTS
Characteristics of Participating Hospitals
Fewer than half of the 126 hospitals had changes in characteristics from 2007 to 2009 (size and type [Table 1]). There were 71 hospitals whose characteristics did not change compared to when the previous analysis was performed. The rest (n = 55) had changes in their characteristics that resulted in a net redistribution in the number of beds in the <200 and 200 to 299 categories, and a change in the rural/urban categories. These changes slightly altered the distributions by hospital size and hospital type compared to those in the previous analysis (Table 1). The regional distribution of the 126 hospitals was 41 (32.5%) in the South, 37 (29.4%) in the Midwest, 28 (22.2%) in the West, and 20 (15.9%) in the Northeast.[19]
| Characteristic | 2007, No. (%) [N = 126] | 2009, No. (%) [N = 126] |
|---|---|---|
| Hospital size, no. of beds | ||
| <200 | 48 (38.1) | 45 (35.7) |
| 200299 | 25 (19.8) | 28 (22.2) |
| 300399 | 17 (13.5) | 17 (13.5) |
| 400 | 36 (28.6) | 36 (28.6) |
| Hospital type | ||
| Academic | 11 (8.7) | 11 (8.7) |
| Urban | 69 (54.8) | 79 (62.7) |
| Rural | 46 (36.5) | 36 (28.6) |
Changes in Glycemic Control
For 2007, we analyzed a total of 12,541,929 POC‐BG measurements for 1,010,705 patients, and for 2009, we analyzed a total of 10,659,418 measurements for 656,206 patients. For ICU patients, a mean of 4.6 POC‐BG measurements per day was obtained in 2009 compared to a mean of 4.7 POC‐BG measurements per day in 2007. For non‐ICU patients, the POC‐BG mean was 3.1 per day in 2009 vs 2.9 per day in 2007.
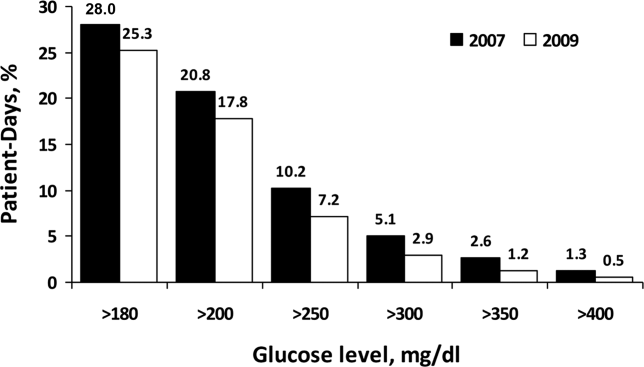
For non‐ICU data, the patient‐day‐weighted mean POC‐BG values decreased in 2009 by 5 mg/dL compared with the 2007 values (154 mg/dL vs 159 mg/dL, respectively; P < 0.001), and were clinically unchanged in the ICU data (167 mg/dL vs 166 mg/dL, respectively; P < 0.001). For non‐ICU data, the proportion of patient‐day‐weighted mean POC‐BG values in any hyperglycemia category decreased in 2009 compared with those in 2007 among all patients (all P < 0.001) (Figure 1). For the ICU data, there was no significant difference (all P > 0.20; not shown) from 2007 to 2009.

In the ICU data, 2.9% of patient days on average had at least 1 POC‐BG value <70 mg/dL in both 2007 and 2009 (P = 0.67). There were fewer patient days with values <40 mg/dL in 2009 (1.1%) compared to 2007 (1.4%) in the ICU (P < 0.001). In the non‐ICU data, the mean percentage of patient days with a value <70 mg/dL was higher in 2009 (5.1%) than in 2007 (4.7%) (P < 0.001); however, there were actually fewer patient days in 2009 on average with a value <40 mg/dL (0.84% vs 1.1% for 2009 vs 2007; P < 0.001).
Changes in Glycemic Control by Hospital Characteristics
Next, changes in glucose levels between the 2 analytic periods were evaluated according to hospital characteristics. Significant interactions were found between the year and each of the hospital characteristics both for the ICU group (Table 2) and for the non‐ICU group (Table 3) (all P < 0.001 for interaction terms). In the ICU data, changes were generally small but significant on the basis of hospital size, hospital type, and geographic region, and these changes were not necessarily in the same direction, because there were increases in patient‐day‐weighted mean glucose values in some categories, whereas there were decreases in others. For instance, hospitals with <200 inpatient beds experienced no significant change in ICU glycemic control, whereas those with 200 to 299 beds or >400 beds had an increase in patient‐day‐weighted mean values, and ones with 300 to 399 beds had a decrease. In regard to hospital type, only ICUs in academic medical institutions had a significant change over time in patient‐day‐weighted mean glucose levels, and these changes were toward higher values. ICUs in institutions in the Northeast and West had significantly higher glucose levels between the 2 periods, whereas those in the Midwest and South demonstrated lower glucose levels. In contrast to the different trends in ICU data by hospital characteristics, non‐ICU glucose control improved for hospitals of all sizes and types, and in all regions, over time.
| Characteristic | Year 2007, mg/dL | Year 2009, mg/dL | P Value |
|---|---|---|---|
| |||
| Overall | 166 (1) | 167 (1) | <0.001 |
| Hospital size, no. of beds | |||
| <200 | 175 (2) | 174 (2) | 0.19 |
| 200299 | 164 (2) | 165 (2) | 0.009 |
| 300399 | 166 (3) | 164 (3) | <0.002 |
| 400 | 157 (2) | 160 (2) | <0.001 |
| Hospital type | |||
| Academic | 150 (3) | 156 (4) | <0.001 |
| Rural | 172 (2) | 172 (2) | 0.94 |
| Urban | 166 (1) | 166 (1) | 0.61 |
| Region | |||
| Northeast | 165 (3) | 167 (3) | 0.003 |
| Midwest | 169 (2) | 168 (2) | 0.007 |
| South | 168 (2) | 167 (2) | <0.001 |
| West | 160 (2) | 165 (2) | <0.001 |
| Characteristic | Year 2007, mg/dL | Year 2009, mg/dL | P Value |
|---|---|---|---|
| |||
| Overall | 159 (1) | 154 (1) | <0.001 |
| Hospital size, no. of beds | |||
| <200 | 162 (2) | 158 (2) | <0.001 |
| 200299 | 156 (2) | 152 (2) | <0.001 |
| 300399 | 158 (3) | 151 (3) | <0.001 |
| 400 | 156 (2) | 151 (2) | < 0.001 |
| Hospital type | |||
| Academic | 162 (3) | 159 (3) | <0.001 |
| Rural | 161 (2) | 156 (2) | <0.001 |
| Urban | 157 (1) | 152 (1) | <0.001 |
| Region | |||
| Northeast | 162 (3) | 158 (3) | <0.001 |
| Midwest | 157 (2) | 149 (2) | <0.001 |
| South | 160 (2) | 157 (2) | <0.001 |
| West | 156 (2) | 151 (2) | <0.001 |
DISCUSSION
Optimal management of hospital hyperglycemia is now advocated by a number of professional societies and organizations.[10, 11, 12, 13] One of the next major tasks in the area of inpatient diabetes management will be how to identify and evaluate changes in glycemic control among US hospitals over time. Respondents to a recent survey of hospitals indicated that most institutions are now attempting to initiate quality improvement programs for the management of inpatients with diabetes.[21] These initiatives may translate into objective changes that could be monitored on a national level. However, few data exist on trends in glucose control in US hospitals. In our analysis, POC‐BG data from 126 hospitals collected in 2009 were compared to data obtained from the same hospitals in 2007. Our findings, and the methods of data collection and analysis described previously,[18, 19] demonstrate how such data can be used as a national benchmarking process for inpatient glucose control.
At all levels of hyperglycemia, significant decreases in patient‐day‐weighted mean values were found in non‐ICU data but not in ICU data. During the time these data were collected, recommendations about glucose targets in the critically ill were in a state of flux.[22, 23, 24, 25, 26, 27] Thus, the lack of hyperglycemia improvement in the ICU data between 2007 and 2009 may reflect the reluctance of providers to aggressively manage hyperglycemia because of recent reports linking increased mortality to tight glucose control.[25, 28, 29, 30] The differences in patient‐day‐weighted mean glucose values detected in the non‐ICU data between the 2 analytic periods were statistically significant, but were otherwise small and may not have clinical implications as far as an association with improved patient outcomes. Ongoing longitudinal analysis is required to establish whether these improvements in non‐ICU glucose control will persist over time.
Changes in glycemic control between the 2 periods were also noted when data were stratified according to hospital characteristics. Differences in glucose control in ICU data were not consistently better or worse, but varied by category of hospital characteristics (hospital size, hospital type, and geographic region). Other than academic hospitals and hospitals in the West, changes in the ICU data were small and likely do not have clinical importance. Analysis of non‐ICU data, however, showed consistent improvement within all 3 categories. Some hospital characteristics did change between the 2 study periods: there were fewer hospitals with <200 beds, more hospitals with 200 to 299 beds, a decrease in hospitals identified as rural, and an increase in hospitals designated as urban. Our previous analyses have indicated that hospital characteristics should be considered when examining national inpatient glucose data.[18, 19] In this analysis there was a statistically significant interaction between the year for which data were analyzed and each category of hospital characteristics. It is unclear how these evolving characteristics could have impacted inpatient glucose control. A change in hospital characteristics may in fact represent a change in resources to manage inpatient hyperglycemia. Future studies with nationally aggregated inpatient glucose data that assess longitudinal changes in glucose data may also have to account for variations in hospital characteristics over time in addition to the characteristics of the hospitals themselves.
Differences in hypoglycemia frequency, as calculated as the proportion of patient hospital days, were also detected. In the ICU data, the percentage of days with at least 1 value <70 mg/dL was similar between 2007 and 2009, but the proportion of days with at least 1 value <40 mg/dL was less in 2009, suggesting that institutions as a whole in this analysis may have been more focused on reducing the frequency of severe hypoglycemia. However, in the non‐ICU, there were more days in 2009 with a value <70 mg/dL, but fewer with a value <40 mg/dL. In noncritically ill patients, institutions likely continue to attempt to find the best balance between optimizing glycemic control while minimizing the risk of hypoglycemia. It should be pointed out, however, that overall, the frequency of hypoglycemia, particularly severe hypoglycemia, was quite low in this analysis, as it has been in our previous reports.[18, 19] An examination of hypoglycemia frequency by hospital characteristic to evaluate differences in this metric would be of interest in a future analysis.
The limitations of these data have been previously outlined,[18, 19] and they include the lack of patient‐level data such as demographics and the lack of information on diagnoses that allow adjustment of comparisons by the severity of illness. Moreover, without detailed treatment‐specific information (such as type of insulin protocol), one cannot establish the basis for longitudinal differences in glucose control. Volunteer‐dependent hospital involvement that creates selection bias may skew data toward those who are aware that they are witnessing a successful reduction in hyperglycemia. Finally, POC‐BG may not be the optimal method for assessing glycemic control. The limitations of current methods of evaluating inpatient glycemic control were recently reviewed.[31] Nonetheless, POC‐BG measurements remain the richest source of data on hospital hyperglycemia because of their widespread use and large sample size. A data warehouse of nearly 600 hospitals now exists,[18] which will permit future longitudinal analyses of glucose control in even larger samples.
Despite such limitations, our findings do represent the first analysis of trends in glucose control in a large cross‐section of US hospitals. Over 2 years, non‐ICU hyperglycemia improved among hospitals of all sizes and types and in all regions, whereas similar improvement did not occur in ICU hyperglycemia. Continued analysis will determine whether these trends continue. For those hospitals that are achieving better glucose control in non‐ICU patients, more information is needed on how they are accomplishing this so that protocols can be standardized and disseminated.
Acknowledgments
Disclosures: This project was supported entirely by The Epsilon Group Virginia, LLC, Charlottesville, Virginia, and a contractual arrangement is in place between the Mayo Clinic, Scottsdale, Arizona, and The Epsilon Group. The Mayo Clinic does not endorse the products mentioned in this article. The authors report no conflicts of interest.
- 2011 National Diabetes Fact Sheet.Diagnosed and undiagnosed diabetes in the United States, all ages, 2010.Atlanta, GA:Centers for Disease Control and Prevention;2011 [updated 2011]. Available at: http://www.cdc.gov/diabetes/pubs/estimates11.htm#2. Accessed November 23, 2012.
- Diabetes Data and Trends.Atlanta, GA:Centers for Disease Control and Prevention;2009 [updated 2009]. Available at: http://www.cdc.gov/diabetes/statistics/dmany/fig1.htm. Accessed November 23, 2012.
- American Diabetes Association. Economic costs of diabetes in the U.S. In 2007 [published correction appears in Diabetes Care. 2008;31(6):1271.]. Diabetes Care. 2008;31(3):596–615.
- , , , et al.;American College of Endocrinology Task Force on Inpatient Diabetes Metabolic Control. American College of Endocrinology position statement on inpatient diabetes and metabolic control. Endocr Pract. 2004;10(1):77–82.
- ACE/ADA Task Force on Inpatient Diabetes. American College of Endocrinology and American Diabetes Association consensus statement on inpatient diabetes and glycemic control. Endocr Pract. 2006;12(4):458–468.
- , , , et al.;American Association of Clinical Endocrinologists; American Diabetes Association. American Association of Clinical Endocrinologists and American Diabetes Association consensus statement on inpatient glycemic control. Diabetes Care. 2009;32(6):1119–1131.
- ;DIGAMI (Diabetes Mellitus, Insulin Glucose Infusion in Acute Myocardial Infarction) Study Group. Prospective randomised study of intensive insulin treatment on long term survival after acute myocardial infarction in patients with diabetes mellitus. BMJ. 1997;314(7093):1512–1515.
- , , , et al.;American Diabetes Association Diabetes in Hospitals Writing Committee. Management of diabetes and hyperglycemia in hospitals [published correction appears in Diabetes Care. 2004;27(5):1255; Diabetes Care. 2004;27(3):856]. Diabetes Care. 2004;27(2):553–591.
- , , , , . Inpatient management of diabetes and hyperglycemia among general medicine patients at a large teaching hospital. J Hosp Med. 2006;1(3):145–150.
- , , , , ;Society of Hospital Medicine Glycemic Control Task Force. Society of Hospital Medicine Glycemic Control Task Force summary: practical recommendations for assessing the impact of glycemic control efforts. J Hosp Med. 2008;3(5 suppl):66–75.
- , , , , , . Adherence to surgical care improvement project measures and the association with postoperative infections. JAMA. 2010;303(24):2479–2485.
- Glycemic Control Resource Room.Philadelphia, PA:Society of Hospital Medicine;2008. Available at: http://www.hospitalmedicine.org/ResourceRoomRedesign/GlycemicControl.cfm. Accessed November 23, 2012.
- Inpatient Glycemic Control Resource Center.Jacksonville, FL:American Association of Clinical Endocrinologists;2011. Available at: http://resources.aace.com. Accessed November 23, 2012.
- , , , et al.;Endocrine Society. Management of hyperglycemia in hospitalized patients in non‐critical care setting: an endocrine society clinical practice guideline. J Clin Endocrinol Metab. 2012;97(1):16–38.
- Hospital Quality Initiative.Baltimore, MD:Centers for Medicare and Medicaid Services;2012 [updated 2012]. Available at: http://www.cms.gov/HospitalQualityInits/08_HospitalRHQDAPU.asp. Accessed November 23, 2012.
- Hospital‐Acquired Conditions (Present on Admission Indicator).Baltimore, MD:Centers for Medicare and Medicaid Services;2012 [updated 2012]. Available at: http://www.cms.gov/hospitalacqcond/06_hospital‐acquired_conditions.asp. Accessed November 23, 2012.
- , , , et al. Evaluation of hospital glycemic control at US academic medical centers. J Hosp Med. 2009;4(1):35–44.
- , , , . Update on inpatient glycemic control in hospitals in the United States. Endocr Pract. 2011;17(6):853–861.
- , , , , , . Inpatient glucose control: a glycemic survey of 126 U.S. hospitals. J Hosp Med. 2009;4(9):E7–E14.
- , , , , . Inpatient point‐of‐care bedside glucose testing: preliminary data on use of connectivity informatics to measure hospital glycemic control. Diabetes Technol Ther. 2007;9(6):493–500.
- , , , , , . Diabetes and hyperglycemia quality improvement efforts in hospitals in the United States: current status, practice variation, and barriers to implementation. Endocr Pract. 2010;16(2):219–230.
- , , , et al. Intensive insulin therapy in critically ill patients. N Engl J Med. 2001;345(19):1359–1367.
- , , , et al. Intensive insulin therapy in the medical ICU. N Engl J Med. 2006;354(5):449–461.
- , , , et al.;German Competence Network Sepsis (SepNet). Intensive insulin therapy and pentastarch resuscitation in severe sepsis. N Engl J Med. 2008;358(2):125–139.
- , , , et al.;NICE‐SUGAR Study Investigators. Intensive versus conventional glucose control in critically ill patients. N Engl J Med. 2009;360(13):1283–1297.
- , , , et al. A prospective randomised multi‐centre controlled trial on tight glucose control by intensive insulin therapy in adult intensive care units: the Glucontrol study. Intensive Care Med. 2009;35(10):1738–1748.
- , , . Benefits and risks of tight glucose control in critically ill adults: a meta‐analysis [published correction appears in JAMA. 2009;301(9):936]. JAMA. 2008;300(8):933–944.
- , . Severe hypoglycemia in critically ill patients: risk factors and outcomes. Crit Care Med. 2007;35(10):2262–2267.
- , , , et al. Relationship between spontaneous and iatrogenic hypoglycemia and mortality in patients hospitalized with acute myocardial infarction. JAMA. 2009;301(15):1556–1564.
- , , , et al. Hypoglycemia and outcome in critically ill patients. Mayo Clin Proc. 2010;85(3):217–224.
- , , , . Assessing inpatient glycemic control: what are the next steps?J Diabetes Sci Technol. 2012;6(2):421–427.
The prevalence of diabetes mellitus continues to increase, now affecting almost 26 million people in the United States alone.[1] Hospitalizations associated with diabetes also continue to rise,[2] and nearly 50% of the $174 billion annual costs related to diabetes care in the United States are for inpatient hospital stays.[3] In recent years, inpatient glucose control has received considerable attention, and consensus statements for glucose targets have been published.[4, 5, 6]
A number of developments support the rationale for tracking and reporting inpatient glucose control. For instance, there are clinical scenarios where treatment of hyperglycemia has been shown to lead to better patient outcomes.[6, 7, 8, 9] Second, several organizations have recognized the value of better inpatient glucose management and have developed educational resources to assist practitioners and their institutions toward achieving that goal.[10, 11, 12, 13, 14] Finally, pay‐for‐performance requirements are emerging that are relevant to inpatient diabetes management.[15, 16]
Reports on the status of inpatient glucose control in large samples of US hospitals are now becoming available, and their findings suggest differences on the basis of hospital size, hospital type, and geographic location.[17, 18] However, these reports represent cross‐sectional studies, and little is known about trends in hospital glucose control over time. To determine whether changes were occurring, we obtained inpatient point‐of‐care blood glucose (POC‐BG) data from 126 hospitals for January to December 2009 and compared these with glycemic control data collected from the same hospitals for January to December 2007,[19] separately analyzing measurements from the intensive care unit (ICU) and the non‐intensive care unit (non‐ICU).
METHODS
Data Collection
The methods we used for data collection have been described previously.[18, 19, 20] Hospitals in the study used standard bedside glucose meters downloaded to the Remote Automated Laboratory System‐Plus (RALS‐Plus) (Medical Automation Systems, Charlottesville, VA). We originally evaluated data for adult inpatients for the period from January to December 2007[19]; for this study, we extracted POC‐BG from the same hospitals for the period from January to December 2009. Data excluded measurements obtained in emergency departments. Patient‐specific data (age, sex, race, and diagnoses) were not provided by hospitals, but individual patients could be distinguished by a unique identifier and also by location (ICU vs non‐ICU).
Hospital Selection
The characteristics of the 126 hospitals have been published previously.[19] However, hospital characteristics for 2009 were reevaluated for this analysis using the same methods already described for 2007[19] to determine whether any changes had occurred. Briefly, hospital characteristics during 2009 were determined via a combination of accessing the hospital Web site, consulting the Hospital Blue Book (Billian's HealthDATA; Billian Publishing Inc., Atlanta, Georgia), and determining membership in the Council of Teaching Hospitals and Health Systems of the Association of American Medical Colleges. The characteristics of the hospitals were size (number of beds), type (academic, urban community, or rural), and geographic region (Northeast, Midwest, South, or West). Per the Hospital Blue Book, a rural hospital is a hospital that operates outside of a metropolitan statistical area, typically with fewer than 100 beds, whereas an urban hospital is located within a metropolitan statistical area, typically with more than 100 beds. Institutions provided written permission to remotely access their glucose data and combine it with other hospitals into a single database for analysis. Patient data were deidentified, and consent to retrospective analysis and reporting was waived. The analysis was considered exempt by the Mayo Clinic Institutional Review Board. Participating hospitals were guaranteed confidentiality regarding their data.
Statistical Analysis
ICU and non‐ICU glucose datasets were differentiated on the basis of the download location designated by the RALS‐Plus database. As previously described, patient‐day‐weighted mean POC‐BG values were calculated as means of daily POC‐BG averaged per patient across all days during the hospital stay.[18, 19] We determined the overall patient‐day‐weighted mean values, and also the proportion of patient‐day‐weighted mean values greater than 180, 200, 250, 300, 350, and 400 mg/dL.[18, 19] We also examined the data to determine if there were any changes in the proportion of patient hospital days when there was at least 1 value <70 mg/dL or <40 mg/dL.
Differences in patient‐day‐weighted mean POC‐BG values between the years 2007 and 2009 were assessed in a mixed‐effects model with the term of year as the fixed effect and hospital characteristics as the random effect. The glucose trends between years 2007 and 2009 were examined to identify any differentiation by hospital characteristics by conducting mixed‐effects models using the terms of year, hospital characteristics (hospital size by bed capacity, hospital type, or geographic region), and interaction between year as the fixed effects and hospital characteristics as the random effect. These analyses were performed separately for ICU patients and non‐ICU patients. Values were compared between data obtained in 2009 and that obtained previously in 2007 using the Pearson [2] test. The means within the same category of hospital characteristics were compared for the years 2007 and 2009.
RESULTS
Characteristics of Participating Hospitals
Fewer than half of the 126 hospitals had changes in characteristics from 2007 to 2009 (size and type [Table 1]). There were 71 hospitals whose characteristics did not change compared to when the previous analysis was performed. The rest (n = 55) had changes in their characteristics that resulted in a net redistribution in the number of beds in the <200 and 200 to 299 categories, and a change in the rural/urban categories. These changes slightly altered the distributions by hospital size and hospital type compared to those in the previous analysis (Table 1). The regional distribution of the 126 hospitals was 41 (32.5%) in the South, 37 (29.4%) in the Midwest, 28 (22.2%) in the West, and 20 (15.9%) in the Northeast.[19]
| Characteristic | 2007, No. (%) [N = 126] | 2009, No. (%) [N = 126] |
|---|---|---|
| Hospital size, no. of beds | ||
| <200 | 48 (38.1) | 45 (35.7) |
| 200299 | 25 (19.8) | 28 (22.2) |
| 300399 | 17 (13.5) | 17 (13.5) |
| 400 | 36 (28.6) | 36 (28.6) |
| Hospital type | ||
| Academic | 11 (8.7) | 11 (8.7) |
| Urban | 69 (54.8) | 79 (62.7) |
| Rural | 46 (36.5) | 36 (28.6) |
Changes in Glycemic Control
For 2007, we analyzed a total of 12,541,929 POC‐BG measurements for 1,010,705 patients, and for 2009, we analyzed a total of 10,659,418 measurements for 656,206 patients. For ICU patients, a mean of 4.6 POC‐BG measurements per day was obtained in 2009 compared to a mean of 4.7 POC‐BG measurements per day in 2007. For non‐ICU patients, the POC‐BG mean was 3.1 per day in 2009 vs 2.9 per day in 2007.
For non‐ICU data, the patient‐day‐weighted mean POC‐BG values decreased in 2009 by 5 mg/dL compared with the 2007 values (154 mg/dL vs 159 mg/dL, respectively; P < 0.001), and were clinically unchanged in the ICU data (167 mg/dL vs 166 mg/dL, respectively; P < 0.001). For non‐ICU data, the proportion of patient‐day‐weighted mean POC‐BG values in any hyperglycemia category decreased in 2009 compared with those in 2007 among all patients (all P < 0.001) (Figure 1). For the ICU data, there was no significant difference (all P > 0.20; not shown) from 2007 to 2009.
In the ICU data, 2.9% of patient days on average had at least 1 POC‐BG value <70 mg/dL in both 2007 and 2009 (P = 0.67). There were fewer patient days with values <40 mg/dL in 2009 (1.1%) compared to 2007 (1.4%) in the ICU (P < 0.001). In the non‐ICU data, the mean percentage of patient days with a value <70 mg/dL was higher in 2009 (5.1%) than in 2007 (4.7%) (P < 0.001); however, there were actually fewer patient days in 2009 on average with a value <40 mg/dL (0.84% vs 1.1% for 2009 vs 2007; P < 0.001).
Changes in Glycemic Control by Hospital Characteristics
Next, changes in glucose levels between the 2 analytic periods were evaluated according to hospital characteristics. Significant interactions were found between the year and each of the hospital characteristics both for the ICU group (Table 2) and for the non‐ICU group (Table 3) (all P < 0.001 for interaction terms). In the ICU data, changes were generally small but significant on the basis of hospital size, hospital type, and geographic region, and these changes were not necessarily in the same direction, because there were increases in patient‐day‐weighted mean glucose values in some categories, whereas there were decreases in others. For instance, hospitals with <200 inpatient beds experienced no significant change in ICU glycemic control, whereas those with 200 to 299 beds or >400 beds had an increase in patient‐day‐weighted mean values, and ones with 300 to 399 beds had a decrease. In regard to hospital type, only ICUs in academic medical institutions had a significant change over time in patient‐day‐weighted mean glucose levels, and these changes were toward higher values. ICUs in institutions in the Northeast and West had significantly higher glucose levels between the 2 periods, whereas those in the Midwest and South demonstrated lower glucose levels. In contrast to the different trends in ICU data by hospital characteristics, non‐ICU glucose control improved for hospitals of all sizes and types, and in all regions, over time.
| Characteristic | Year 2007, mg/dL | Year 2009, mg/dL | P Value |
|---|---|---|---|
| |||
| Overall | 166 (1) | 167 (1) | <0.001 |
| Hospital size, no. of beds | |||
| <200 | 175 (2) | 174 (2) | 0.19 |
| 200299 | 164 (2) | 165 (2) | 0.009 |
| 300399 | 166 (3) | 164 (3) | <0.002 |
| 400 | 157 (2) | 160 (2) | <0.001 |
| Hospital type | |||
| Academic | 150 (3) | 156 (4) | <0.001 |
| Rural | 172 (2) | 172 (2) | 0.94 |
| Urban | 166 (1) | 166 (1) | 0.61 |
| Region | |||
| Northeast | 165 (3) | 167 (3) | 0.003 |
| Midwest | 169 (2) | 168 (2) | 0.007 |
| South | 168 (2) | 167 (2) | <0.001 |
| West | 160 (2) | 165 (2) | <0.001 |
| Characteristic | Year 2007, mg/dL | Year 2009, mg/dL | P Value |
|---|---|---|---|
| |||
| Overall | 159 (1) | 154 (1) | <0.001 |
| Hospital size, no. of beds | |||
| <200 | 162 (2) | 158 (2) | <0.001 |
| 200299 | 156 (2) | 152 (2) | <0.001 |
| 300399 | 158 (3) | 151 (3) | <0.001 |
| 400 | 156 (2) | 151 (2) | < 0.001 |
| Hospital type | |||
| Academic | 162 (3) | 159 (3) | <0.001 |
| Rural | 161 (2) | 156 (2) | <0.001 |
| Urban | 157 (1) | 152 (1) | <0.001 |
| Region | |||
| Northeast | 162 (3) | 158 (3) | <0.001 |
| Midwest | 157 (2) | 149 (2) | <0.001 |
| South | 160 (2) | 157 (2) | <0.001 |
| West | 156 (2) | 151 (2) | <0.001 |
DISCUSSION
Optimal management of hospital hyperglycemia is now advocated by a number of professional societies and organizations.[10, 11, 12, 13] One of the next major tasks in the area of inpatient diabetes management will be how to identify and evaluate changes in glycemic control among US hospitals over time. Respondents to a recent survey of hospitals indicated that most institutions are now attempting to initiate quality improvement programs for the management of inpatients with diabetes.[21] These initiatives may translate into objective changes that could be monitored on a national level. However, few data exist on trends in glucose control in US hospitals. In our analysis, POC‐BG data from 126 hospitals collected in 2009 were compared to data obtained from the same hospitals in 2007. Our findings, and the methods of data collection and analysis described previously,[18, 19] demonstrate how such data can be used as a national benchmarking process for inpatient glucose control.
At all levels of hyperglycemia, significant decreases in patient‐day‐weighted mean values were found in non‐ICU data but not in ICU data. During the time these data were collected, recommendations about glucose targets in the critically ill were in a state of flux.[22, 23, 24, 25, 26, 27] Thus, the lack of hyperglycemia improvement in the ICU data between 2007 and 2009 may reflect the reluctance of providers to aggressively manage hyperglycemia because of recent reports linking increased mortality to tight glucose control.[25, 28, 29, 30] The differences in patient‐day‐weighted mean glucose values detected in the non‐ICU data between the 2 analytic periods were statistically significant, but were otherwise small and may not have clinical implications as far as an association with improved patient outcomes. Ongoing longitudinal analysis is required to establish whether these improvements in non‐ICU glucose control will persist over time.
Changes in glycemic control between the 2 periods were also noted when data were stratified according to hospital characteristics. Differences in glucose control in ICU data were not consistently better or worse, but varied by category of hospital characteristics (hospital size, hospital type, and geographic region). Other than academic hospitals and hospitals in the West, changes in the ICU data were small and likely do not have clinical importance. Analysis of non‐ICU data, however, showed consistent improvement within all 3 categories. Some hospital characteristics did change between the 2 study periods: there were fewer hospitals with <200 beds, more hospitals with 200 to 299 beds, a decrease in hospitals identified as rural, and an increase in hospitals designated as urban. Our previous analyses have indicated that hospital characteristics should be considered when examining national inpatient glucose data.[18, 19] In this analysis there was a statistically significant interaction between the year for which data were analyzed and each category of hospital characteristics. It is unclear how these evolving characteristics could have impacted inpatient glucose control. A change in hospital characteristics may in fact represent a change in resources to manage inpatient hyperglycemia. Future studies with nationally aggregated inpatient glucose data that assess longitudinal changes in glucose data may also have to account for variations in hospital characteristics over time in addition to the characteristics of the hospitals themselves.
Differences in hypoglycemia frequency, as calculated as the proportion of patient hospital days, were also detected. In the ICU data, the percentage of days with at least 1 value <70 mg/dL was similar between 2007 and 2009, but the proportion of days with at least 1 value <40 mg/dL was less in 2009, suggesting that institutions as a whole in this analysis may have been more focused on reducing the frequency of severe hypoglycemia. However, in the non‐ICU, there were more days in 2009 with a value <70 mg/dL, but fewer with a value <40 mg/dL. In noncritically ill patients, institutions likely continue to attempt to find the best balance between optimizing glycemic control while minimizing the risk of hypoglycemia. It should be pointed out, however, that overall, the frequency of hypoglycemia, particularly severe hypoglycemia, was quite low in this analysis, as it has been in our previous reports.[18, 19] An examination of hypoglycemia frequency by hospital characteristic to evaluate differences in this metric would be of interest in a future analysis.
The limitations of these data have been previously outlined,[18, 19] and they include the lack of patient‐level data such as demographics and the lack of information on diagnoses that allow adjustment of comparisons by the severity of illness. Moreover, without detailed treatment‐specific information (such as type of insulin protocol), one cannot establish the basis for longitudinal differences in glucose control. Volunteer‐dependent hospital involvement that creates selection bias may skew data toward those who are aware that they are witnessing a successful reduction in hyperglycemia. Finally, POC‐BG may not be the optimal method for assessing glycemic control. The limitations of current methods of evaluating inpatient glycemic control were recently reviewed.[31] Nonetheless, POC‐BG measurements remain the richest source of data on hospital hyperglycemia because of their widespread use and large sample size. A data warehouse of nearly 600 hospitals now exists,[18] which will permit future longitudinal analyses of glucose control in even larger samples.
Despite such limitations, our findings do represent the first analysis of trends in glucose control in a large cross‐section of US hospitals. Over 2 years, non‐ICU hyperglycemia improved among hospitals of all sizes and types and in all regions, whereas similar improvement did not occur in ICU hyperglycemia. Continued analysis will determine whether these trends continue. For those hospitals that are achieving better glucose control in non‐ICU patients, more information is needed on how they are accomplishing this so that protocols can be standardized and disseminated.
Acknowledgments
Disclosures: This project was supported entirely by The Epsilon Group Virginia, LLC, Charlottesville, Virginia, and a contractual arrangement is in place between the Mayo Clinic, Scottsdale, Arizona, and The Epsilon Group. The Mayo Clinic does not endorse the products mentioned in this article. The authors report no conflicts of interest.
- 2011 National Diabetes Fact Sheet.Diagnosed and undiagnosed diabetes in the United States, all ages, 2010.Atlanta, GA:Centers for Disease Control and Prevention;2011 [updated 2011]. Available at: http://www.cdc.gov/diabetes/pubs/estimates11.htm#2. Accessed November 23, 2012.
- Diabetes Data and Trends.Atlanta, GA:Centers for Disease Control and Prevention;2009 [updated 2009]. Available at: http://www.cdc.gov/diabetes/statistics/dmany/fig1.htm. Accessed November 23, 2012.
- American Diabetes Association. Economic costs of diabetes in the U.S. In 2007 [published correction appears in Diabetes Care. 2008;31(6):1271.]. Diabetes Care. 2008;31(3):596–615.
- , , , et al.;American College of Endocrinology Task Force on Inpatient Diabetes Metabolic Control. American College of Endocrinology position statement on inpatient diabetes and metabolic control. Endocr Pract. 2004;10(1):77–82.
- ACE/ADA Task Force on Inpatient Diabetes. American College of Endocrinology and American Diabetes Association consensus statement on inpatient diabetes and glycemic control. Endocr Pract. 2006;12(4):458–468.
- , , , et al.;American Association of Clinical Endocrinologists; American Diabetes Association. American Association of Clinical Endocrinologists and American Diabetes Association consensus statement on inpatient glycemic control. Diabetes Care. 2009;32(6):1119–1131.
- ;DIGAMI (Diabetes Mellitus, Insulin Glucose Infusion in Acute Myocardial Infarction) Study Group. Prospective randomised study of intensive insulin treatment on long term survival after acute myocardial infarction in patients with diabetes mellitus. BMJ. 1997;314(7093):1512–1515.
- , , , et al.;American Diabetes Association Diabetes in Hospitals Writing Committee. Management of diabetes and hyperglycemia in hospitals [published correction appears in Diabetes Care. 2004;27(5):1255; Diabetes Care. 2004;27(3):856]. Diabetes Care. 2004;27(2):553–591.
- , , , , . Inpatient management of diabetes and hyperglycemia among general medicine patients at a large teaching hospital. J Hosp Med. 2006;1(3):145–150.
- , , , , ;Society of Hospital Medicine Glycemic Control Task Force. Society of Hospital Medicine Glycemic Control Task Force summary: practical recommendations for assessing the impact of glycemic control efforts. J Hosp Med. 2008;3(5 suppl):66–75.
- , , , , , . Adherence to surgical care improvement project measures and the association with postoperative infections. JAMA. 2010;303(24):2479–2485.
- Glycemic Control Resource Room.Philadelphia, PA:Society of Hospital Medicine;2008. Available at: http://www.hospitalmedicine.org/ResourceRoomRedesign/GlycemicControl.cfm. Accessed November 23, 2012.
- Inpatient Glycemic Control Resource Center.Jacksonville, FL:American Association of Clinical Endocrinologists;2011. Available at: http://resources.aace.com. Accessed November 23, 2012.
- , , , et al.;Endocrine Society. Management of hyperglycemia in hospitalized patients in non‐critical care setting: an endocrine society clinical practice guideline. J Clin Endocrinol Metab. 2012;97(1):16–38.
- Hospital Quality Initiative.Baltimore, MD:Centers for Medicare and Medicaid Services;2012 [updated 2012]. Available at: http://www.cms.gov/HospitalQualityInits/08_HospitalRHQDAPU.asp. Accessed November 23, 2012.
- Hospital‐Acquired Conditions (Present on Admission Indicator).Baltimore, MD:Centers for Medicare and Medicaid Services;2012 [updated 2012]. Available at: http://www.cms.gov/hospitalacqcond/06_hospital‐acquired_conditions.asp. Accessed November 23, 2012.
- , , , et al. Evaluation of hospital glycemic control at US academic medical centers. J Hosp Med. 2009;4(1):35–44.
- , , , . Update on inpatient glycemic control in hospitals in the United States. Endocr Pract. 2011;17(6):853–861.
- , , , , , . Inpatient glucose control: a glycemic survey of 126 U.S. hospitals. J Hosp Med. 2009;4(9):E7–E14.
- , , , , . Inpatient point‐of‐care bedside glucose testing: preliminary data on use of connectivity informatics to measure hospital glycemic control. Diabetes Technol Ther. 2007;9(6):493–500.
- , , , , , . Diabetes and hyperglycemia quality improvement efforts in hospitals in the United States: current status, practice variation, and barriers to implementation. Endocr Pract. 2010;16(2):219–230.
- , , , et al. Intensive insulin therapy in critically ill patients. N Engl J Med. 2001;345(19):1359–1367.
- , , , et al. Intensive insulin therapy in the medical ICU. N Engl J Med. 2006;354(5):449–461.
- , , , et al.;German Competence Network Sepsis (SepNet). Intensive insulin therapy and pentastarch resuscitation in severe sepsis. N Engl J Med. 2008;358(2):125–139.
- , , , et al.;NICE‐SUGAR Study Investigators. Intensive versus conventional glucose control in critically ill patients. N Engl J Med. 2009;360(13):1283–1297.
- , , , et al. A prospective randomised multi‐centre controlled trial on tight glucose control by intensive insulin therapy in adult intensive care units: the Glucontrol study. Intensive Care Med. 2009;35(10):1738–1748.
- , , . Benefits and risks of tight glucose control in critically ill adults: a meta‐analysis [published correction appears in JAMA. 2009;301(9):936]. JAMA. 2008;300(8):933–944.
- , . Severe hypoglycemia in critically ill patients: risk factors and outcomes. Crit Care Med. 2007;35(10):2262–2267.
- , , , et al. Relationship between spontaneous and iatrogenic hypoglycemia and mortality in patients hospitalized with acute myocardial infarction. JAMA. 2009;301(15):1556–1564.
- , , , et al. Hypoglycemia and outcome in critically ill patients. Mayo Clin Proc. 2010;85(3):217–224.
- , , , . Assessing inpatient glycemic control: what are the next steps?J Diabetes Sci Technol. 2012;6(2):421–427.
Copyright © 2012 Society of Hospital Medicine