User login
Changes in Hospital Glycemic Control
The prevalence of diabetes mellitus continues to increase, now affecting almost 26 million people in the United States alone.[1] Hospitalizations associated with diabetes also continue to rise,[2] and nearly 50% of the $174 billion annual costs related to diabetes care in the United States are for inpatient hospital stays.[3] In recent years, inpatient glucose control has received considerable attention, and consensus statements for glucose targets have been published.[4, 5, 6]
A number of developments support the rationale for tracking and reporting inpatient glucose control. For instance, there are clinical scenarios where treatment of hyperglycemia has been shown to lead to better patient outcomes.[6, 7, 8, 9] Second, several organizations have recognized the value of better inpatient glucose management and have developed educational resources to assist practitioners and their institutions toward achieving that goal.[10, 11, 12, 13, 14] Finally, pay‐for‐performance requirements are emerging that are relevant to inpatient diabetes management.[15, 16]
Reports on the status of inpatient glucose control in large samples of US hospitals are now becoming available, and their findings suggest differences on the basis of hospital size, hospital type, and geographic location.[17, 18] However, these reports represent cross‐sectional studies, and little is known about trends in hospital glucose control over time. To determine whether changes were occurring, we obtained inpatient point‐of‐care blood glucose (POC‐BG) data from 126 hospitals for January to December 2009 and compared these with glycemic control data collected from the same hospitals for January to December 2007,[19] separately analyzing measurements from the intensive care unit (ICU) and the non‐intensive care unit (non‐ICU).
METHODS
Data Collection
The methods we used for data collection have been described previously.[18, 19, 20] Hospitals in the study used standard bedside glucose meters downloaded to the Remote Automated Laboratory System‐Plus (RALS‐Plus) (Medical Automation Systems, Charlottesville, VA). We originally evaluated data for adult inpatients for the period from January to December 2007[19]; for this study, we extracted POC‐BG from the same hospitals for the period from January to December 2009. Data excluded measurements obtained in emergency departments. Patient‐specific data (age, sex, race, and diagnoses) were not provided by hospitals, but individual patients could be distinguished by a unique identifier and also by location (ICU vs non‐ICU).
Hospital Selection
The characteristics of the 126 hospitals have been published previously.[19] However, hospital characteristics for 2009 were reevaluated for this analysis using the same methods already described for 2007[19] to determine whether any changes had occurred. Briefly, hospital characteristics during 2009 were determined via a combination of accessing the hospital Web site, consulting the Hospital Blue Book (Billian's HealthDATA; Billian Publishing Inc., Atlanta, Georgia), and determining membership in the Council of Teaching Hospitals and Health Systems of the Association of American Medical Colleges. The characteristics of the hospitals were size (number of beds), type (academic, urban community, or rural), and geographic region (Northeast, Midwest, South, or West). Per the Hospital Blue Book, a rural hospital is a hospital that operates outside of a metropolitan statistical area, typically with fewer than 100 beds, whereas an urban hospital is located within a metropolitan statistical area, typically with more than 100 beds. Institutions provided written permission to remotely access their glucose data and combine it with other hospitals into a single database for analysis. Patient data were deidentified, and consent to retrospective analysis and reporting was waived. The analysis was considered exempt by the Mayo Clinic Institutional Review Board. Participating hospitals were guaranteed confidentiality regarding their data.
Statistical Analysis
ICU and non‐ICU glucose datasets were differentiated on the basis of the download location designated by the RALS‐Plus database. As previously described, patient‐day‐weighted mean POC‐BG values were calculated as means of daily POC‐BG averaged per patient across all days during the hospital stay.[18, 19] We determined the overall patient‐day‐weighted mean values, and also the proportion of patient‐day‐weighted mean values greater than 180, 200, 250, 300, 350, and 400 mg/dL.[18, 19] We also examined the data to determine if there were any changes in the proportion of patient hospital days when there was at least 1 value <70 mg/dL or <40 mg/dL.
Differences in patient‐day‐weighted mean POC‐BG values between the years 2007 and 2009 were assessed in a mixed‐effects model with the term of year as the fixed effect and hospital characteristics as the random effect. The glucose trends between years 2007 and 2009 were examined to identify any differentiation by hospital characteristics by conducting mixed‐effects models using the terms of year, hospital characteristics (hospital size by bed capacity, hospital type, or geographic region), and interaction between year as the fixed effects and hospital characteristics as the random effect. These analyses were performed separately for ICU patients and non‐ICU patients. Values were compared between data obtained in 2009 and that obtained previously in 2007 using the Pearson [2] test. The means within the same category of hospital characteristics were compared for the years 2007 and 2009.
RESULTS
Characteristics of Participating Hospitals
Fewer than half of the 126 hospitals had changes in characteristics from 2007 to 2009 (size and type [Table 1]). There were 71 hospitals whose characteristics did not change compared to when the previous analysis was performed. The rest (n = 55) had changes in their characteristics that resulted in a net redistribution in the number of beds in the <200 and 200 to 299 categories, and a change in the rural/urban categories. These changes slightly altered the distributions by hospital size and hospital type compared to those in the previous analysis (Table 1). The regional distribution of the 126 hospitals was 41 (32.5%) in the South, 37 (29.4%) in the Midwest, 28 (22.2%) in the West, and 20 (15.9%) in the Northeast.[19]
| Characteristic | 2007, No. (%) [N = 126] | 2009, No. (%) [N = 126] |
|---|---|---|
| Hospital size, no. of beds | ||
| <200 | 48 (38.1) | 45 (35.7) |
| 200299 | 25 (19.8) | 28 (22.2) |
| 300399 | 17 (13.5) | 17 (13.5) |
| 400 | 36 (28.6) | 36 (28.6) |
| Hospital type | ||
| Academic | 11 (8.7) | 11 (8.7) |
| Urban | 69 (54.8) | 79 (62.7) |
| Rural | 46 (36.5) | 36 (28.6) |
Changes in Glycemic Control
For 2007, we analyzed a total of 12,541,929 POC‐BG measurements for 1,010,705 patients, and for 2009, we analyzed a total of 10,659,418 measurements for 656,206 patients. For ICU patients, a mean of 4.6 POC‐BG measurements per day was obtained in 2009 compared to a mean of 4.7 POC‐BG measurements per day in 2007. For non‐ICU patients, the POC‐BG mean was 3.1 per day in 2009 vs 2.9 per day in 2007.
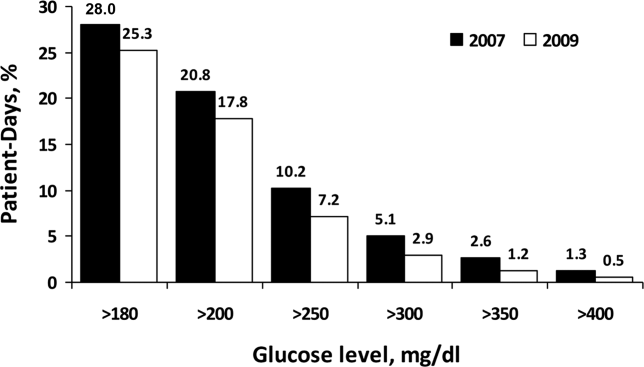
For non‐ICU data, the patient‐day‐weighted mean POC‐BG values decreased in 2009 by 5 mg/dL compared with the 2007 values (154 mg/dL vs 159 mg/dL, respectively; P < 0.001), and were clinically unchanged in the ICU data (167 mg/dL vs 166 mg/dL, respectively; P < 0.001). For non‐ICU data, the proportion of patient‐day‐weighted mean POC‐BG values in any hyperglycemia category decreased in 2009 compared with those in 2007 among all patients (all P < 0.001) (Figure 1). For the ICU data, there was no significant difference (all P > 0.20; not shown) from 2007 to 2009.

In the ICU data, 2.9% of patient days on average had at least 1 POC‐BG value <70 mg/dL in both 2007 and 2009 (P = 0.67). There were fewer patient days with values <40 mg/dL in 2009 (1.1%) compared to 2007 (1.4%) in the ICU (P < 0.001). In the non‐ICU data, the mean percentage of patient days with a value <70 mg/dL was higher in 2009 (5.1%) than in 2007 (4.7%) (P < 0.001); however, there were actually fewer patient days in 2009 on average with a value <40 mg/dL (0.84% vs 1.1% for 2009 vs 2007; P < 0.001).
Changes in Glycemic Control by Hospital Characteristics
Next, changes in glucose levels between the 2 analytic periods were evaluated according to hospital characteristics. Significant interactions were found between the year and each of the hospital characteristics both for the ICU group (Table 2) and for the non‐ICU group (Table 3) (all P < 0.001 for interaction terms). In the ICU data, changes were generally small but significant on the basis of hospital size, hospital type, and geographic region, and these changes were not necessarily in the same direction, because there were increases in patient‐day‐weighted mean glucose values in some categories, whereas there were decreases in others. For instance, hospitals with <200 inpatient beds experienced no significant change in ICU glycemic control, whereas those with 200 to 299 beds or >400 beds had an increase in patient‐day‐weighted mean values, and ones with 300 to 399 beds had a decrease. In regard to hospital type, only ICUs in academic medical institutions had a significant change over time in patient‐day‐weighted mean glucose levels, and these changes were toward higher values. ICUs in institutions in the Northeast and West had significantly higher glucose levels between the 2 periods, whereas those in the Midwest and South demonstrated lower glucose levels. In contrast to the different trends in ICU data by hospital characteristics, non‐ICU glucose control improved for hospitals of all sizes and types, and in all regions, over time.
| Characteristic | Year 2007, mg/dL | Year 2009, mg/dL | P Value |
|---|---|---|---|
| |||
| Overall | 166 (1) | 167 (1) | <0.001 |
| Hospital size, no. of beds | |||
| <200 | 175 (2) | 174 (2) | 0.19 |
| 200299 | 164 (2) | 165 (2) | 0.009 |
| 300399 | 166 (3) | 164 (3) | <0.002 |
| 400 | 157 (2) | 160 (2) | <0.001 |
| Hospital type | |||
| Academic | 150 (3) | 156 (4) | <0.001 |
| Rural | 172 (2) | 172 (2) | 0.94 |
| Urban | 166 (1) | 166 (1) | 0.61 |
| Region | |||
| Northeast | 165 (3) | 167 (3) | 0.003 |
| Midwest | 169 (2) | 168 (2) | 0.007 |
| South | 168 (2) | 167 (2) | <0.001 |
| West | 160 (2) | 165 (2) | <0.001 |
| Characteristic | Year 2007, mg/dL | Year 2009, mg/dL | P Value |
|---|---|---|---|
| |||
| Overall | 159 (1) | 154 (1) | <0.001 |
| Hospital size, no. of beds | |||
| <200 | 162 (2) | 158 (2) | <0.001 |
| 200299 | 156 (2) | 152 (2) | <0.001 |
| 300399 | 158 (3) | 151 (3) | <0.001 |
| 400 | 156 (2) | 151 (2) | < 0.001 |
| Hospital type | |||
| Academic | 162 (3) | 159 (3) | <0.001 |
| Rural | 161 (2) | 156 (2) | <0.001 |
| Urban | 157 (1) | 152 (1) | <0.001 |
| Region | |||
| Northeast | 162 (3) | 158 (3) | <0.001 |
| Midwest | 157 (2) | 149 (2) | <0.001 |
| South | 160 (2) | 157 (2) | <0.001 |
| West | 156 (2) | 151 (2) | <0.001 |
DISCUSSION
Optimal management of hospital hyperglycemia is now advocated by a number of professional societies and organizations.[10, 11, 12, 13] One of the next major tasks in the area of inpatient diabetes management will be how to identify and evaluate changes in glycemic control among US hospitals over time. Respondents to a recent survey of hospitals indicated that most institutions are now attempting to initiate quality improvement programs for the management of inpatients with diabetes.[21] These initiatives may translate into objective changes that could be monitored on a national level. However, few data exist on trends in glucose control in US hospitals. In our analysis, POC‐BG data from 126 hospitals collected in 2009 were compared to data obtained from the same hospitals in 2007. Our findings, and the methods of data collection and analysis described previously,[18, 19] demonstrate how such data can be used as a national benchmarking process for inpatient glucose control.
At all levels of hyperglycemia, significant decreases in patient‐day‐weighted mean values were found in non‐ICU data but not in ICU data. During the time these data were collected, recommendations about glucose targets in the critically ill were in a state of flux.[22, 23, 24, 25, 26, 27] Thus, the lack of hyperglycemia improvement in the ICU data between 2007 and 2009 may reflect the reluctance of providers to aggressively manage hyperglycemia because of recent reports linking increased mortality to tight glucose control.[25, 28, 29, 30] The differences in patient‐day‐weighted mean glucose values detected in the non‐ICU data between the 2 analytic periods were statistically significant, but were otherwise small and may not have clinical implications as far as an association with improved patient outcomes. Ongoing longitudinal analysis is required to establish whether these improvements in non‐ICU glucose control will persist over time.
Changes in glycemic control between the 2 periods were also noted when data were stratified according to hospital characteristics. Differences in glucose control in ICU data were not consistently better or worse, but varied by category of hospital characteristics (hospital size, hospital type, and geographic region). Other than academic hospitals and hospitals in the West, changes in the ICU data were small and likely do not have clinical importance. Analysis of non‐ICU data, however, showed consistent improvement within all 3 categories. Some hospital characteristics did change between the 2 study periods: there were fewer hospitals with <200 beds, more hospitals with 200 to 299 beds, a decrease in hospitals identified as rural, and an increase in hospitals designated as urban. Our previous analyses have indicated that hospital characteristics should be considered when examining national inpatient glucose data.[18, 19] In this analysis there was a statistically significant interaction between the year for which data were analyzed and each category of hospital characteristics. It is unclear how these evolving characteristics could have impacted inpatient glucose control. A change in hospital characteristics may in fact represent a change in resources to manage inpatient hyperglycemia. Future studies with nationally aggregated inpatient glucose data that assess longitudinal changes in glucose data may also have to account for variations in hospital characteristics over time in addition to the characteristics of the hospitals themselves.
Differences in hypoglycemia frequency, as calculated as the proportion of patient hospital days, were also detected. In the ICU data, the percentage of days with at least 1 value <70 mg/dL was similar between 2007 and 2009, but the proportion of days with at least 1 value <40 mg/dL was less in 2009, suggesting that institutions as a whole in this analysis may have been more focused on reducing the frequency of severe hypoglycemia. However, in the non‐ICU, there were more days in 2009 with a value <70 mg/dL, but fewer with a value <40 mg/dL. In noncritically ill patients, institutions likely continue to attempt to find the best balance between optimizing glycemic control while minimizing the risk of hypoglycemia. It should be pointed out, however, that overall, the frequency of hypoglycemia, particularly severe hypoglycemia, was quite low in this analysis, as it has been in our previous reports.[18, 19] An examination of hypoglycemia frequency by hospital characteristic to evaluate differences in this metric would be of interest in a future analysis.
The limitations of these data have been previously outlined,[18, 19] and they include the lack of patient‐level data such as demographics and the lack of information on diagnoses that allow adjustment of comparisons by the severity of illness. Moreover, without detailed treatment‐specific information (such as type of insulin protocol), one cannot establish the basis for longitudinal differences in glucose control. Volunteer‐dependent hospital involvement that creates selection bias may skew data toward those who are aware that they are witnessing a successful reduction in hyperglycemia. Finally, POC‐BG may not be the optimal method for assessing glycemic control. The limitations of current methods of evaluating inpatient glycemic control were recently reviewed.[31] Nonetheless, POC‐BG measurements remain the richest source of data on hospital hyperglycemia because of their widespread use and large sample size. A data warehouse of nearly 600 hospitals now exists,[18] which will permit future longitudinal analyses of glucose control in even larger samples.
Despite such limitations, our findings do represent the first analysis of trends in glucose control in a large cross‐section of US hospitals. Over 2 years, non‐ICU hyperglycemia improved among hospitals of all sizes and types and in all regions, whereas similar improvement did not occur in ICU hyperglycemia. Continued analysis will determine whether these trends continue. For those hospitals that are achieving better glucose control in non‐ICU patients, more information is needed on how they are accomplishing this so that protocols can be standardized and disseminated.
Acknowledgments
Disclosures: This project was supported entirely by The Epsilon Group Virginia, LLC, Charlottesville, Virginia, and a contractual arrangement is in place between the Mayo Clinic, Scottsdale, Arizona, and The Epsilon Group. The Mayo Clinic does not endorse the products mentioned in this article. The authors report no conflicts of interest.
- 2011 National Diabetes Fact Sheet.Diagnosed and undiagnosed diabetes in the United States, all ages, 2010.Atlanta, GA:Centers for Disease Control and Prevention;2011 [updated 2011]. Available at: http://www.cdc.gov/diabetes/pubs/estimates11.htm#2. Accessed November 23, 2012.
- Diabetes Data and Trends.Atlanta, GA:Centers for Disease Control and Prevention;2009 [updated 2009]. Available at: http://www.cdc.gov/diabetes/statistics/dmany/fig1.htm. Accessed November 23, 2012.
- American Diabetes Association. Economic costs of diabetes in the U.S. In 2007 [published correction appears in Diabetes Care. 2008;31(6):1271.]. Diabetes Care. 2008;31(3):596–615.
- , , , et al.;American College of Endocrinology Task Force on Inpatient Diabetes Metabolic Control. American College of Endocrinology position statement on inpatient diabetes and metabolic control. Endocr Pract. 2004;10(1):77–82.
- ACE/ADA Task Force on Inpatient Diabetes. American College of Endocrinology and American Diabetes Association consensus statement on inpatient diabetes and glycemic control. Endocr Pract. 2006;12(4):458–468.
- , , , et al.;American Association of Clinical Endocrinologists; American Diabetes Association. American Association of Clinical Endocrinologists and American Diabetes Association consensus statement on inpatient glycemic control. Diabetes Care. 2009;32(6):1119–1131.
- ;DIGAMI (Diabetes Mellitus, Insulin Glucose Infusion in Acute Myocardial Infarction) Study Group. Prospective randomised study of intensive insulin treatment on long term survival after acute myocardial infarction in patients with diabetes mellitus. BMJ. 1997;314(7093):1512–1515.
- , , , et al.;American Diabetes Association Diabetes in Hospitals Writing Committee. Management of diabetes and hyperglycemia in hospitals [published correction appears in Diabetes Care. 2004;27(5):1255; Diabetes Care. 2004;27(3):856]. Diabetes Care. 2004;27(2):553–591.
- , , , , . Inpatient management of diabetes and hyperglycemia among general medicine patients at a large teaching hospital. J Hosp Med. 2006;1(3):145–150.
- , , , , ;Society of Hospital Medicine Glycemic Control Task Force. Society of Hospital Medicine Glycemic Control Task Force summary: practical recommendations for assessing the impact of glycemic control efforts. J Hosp Med. 2008;3(5 suppl):66–75.
- , , , , , . Adherence to surgical care improvement project measures and the association with postoperative infections. JAMA. 2010;303(24):2479–2485.
- Glycemic Control Resource Room.Philadelphia, PA:Society of Hospital Medicine;2008. Available at: http://www.hospitalmedicine.org/ResourceRoomRedesign/GlycemicControl.cfm. Accessed November 23, 2012.
- Inpatient Glycemic Control Resource Center.Jacksonville, FL:American Association of Clinical Endocrinologists;2011. Available at: http://resources.aace.com. Accessed November 23, 2012.
- , , , et al.;Endocrine Society. Management of hyperglycemia in hospitalized patients in non‐critical care setting: an endocrine society clinical practice guideline. J Clin Endocrinol Metab. 2012;97(1):16–38.
- Hospital Quality Initiative.Baltimore, MD:Centers for Medicare and Medicaid Services;2012 [updated 2012]. Available at: http://www.cms.gov/HospitalQualityInits/08_HospitalRHQDAPU.asp. Accessed November 23, 2012.
- Hospital‐Acquired Conditions (Present on Admission Indicator).Baltimore, MD:Centers for Medicare and Medicaid Services;2012 [updated 2012]. Available at: http://www.cms.gov/hospitalacqcond/06_hospital‐acquired_conditions.asp. Accessed November 23, 2012.
- , , , et al. Evaluation of hospital glycemic control at US academic medical centers. J Hosp Med. 2009;4(1):35–44.
- , , , . Update on inpatient glycemic control in hospitals in the United States. Endocr Pract. 2011;17(6):853–861.
- , , , , , . Inpatient glucose control: a glycemic survey of 126 U.S. hospitals. J Hosp Med. 2009;4(9):E7–E14.
- , , , , . Inpatient point‐of‐care bedside glucose testing: preliminary data on use of connectivity informatics to measure hospital glycemic control. Diabetes Technol Ther. 2007;9(6):493–500.
- , , , , , . Diabetes and hyperglycemia quality improvement efforts in hospitals in the United States: current status, practice variation, and barriers to implementation. Endocr Pract. 2010;16(2):219–230.
- , , , et al. Intensive insulin therapy in critically ill patients. N Engl J Med. 2001;345(19):1359–1367.
- , , , et al. Intensive insulin therapy in the medical ICU. N Engl J Med. 2006;354(5):449–461.
- , , , et al.;German Competence Network Sepsis (SepNet). Intensive insulin therapy and pentastarch resuscitation in severe sepsis. N Engl J Med. 2008;358(2):125–139.
- , , , et al.;NICE‐SUGAR Study Investigators. Intensive versus conventional glucose control in critically ill patients. N Engl J Med. 2009;360(13):1283–1297.
- , , , et al. A prospective randomised multi‐centre controlled trial on tight glucose control by intensive insulin therapy in adult intensive care units: the Glucontrol study. Intensive Care Med. 2009;35(10):1738–1748.
- , , . Benefits and risks of tight glucose control in critically ill adults: a meta‐analysis [published correction appears in JAMA. 2009;301(9):936]. JAMA. 2008;300(8):933–944.
- , . Severe hypoglycemia in critically ill patients: risk factors and outcomes. Crit Care Med. 2007;35(10):2262–2267.
- , , , et al. Relationship between spontaneous and iatrogenic hypoglycemia and mortality in patients hospitalized with acute myocardial infarction. JAMA. 2009;301(15):1556–1564.
- , , , et al. Hypoglycemia and outcome in critically ill patients. Mayo Clin Proc. 2010;85(3):217–224.
- , , , . Assessing inpatient glycemic control: what are the next steps?J Diabetes Sci Technol. 2012;6(2):421–427.
The prevalence of diabetes mellitus continues to increase, now affecting almost 26 million people in the United States alone.[1] Hospitalizations associated with diabetes also continue to rise,[2] and nearly 50% of the $174 billion annual costs related to diabetes care in the United States are for inpatient hospital stays.[3] In recent years, inpatient glucose control has received considerable attention, and consensus statements for glucose targets have been published.[4, 5, 6]
A number of developments support the rationale for tracking and reporting inpatient glucose control. For instance, there are clinical scenarios where treatment of hyperglycemia has been shown to lead to better patient outcomes.[6, 7, 8, 9] Second, several organizations have recognized the value of better inpatient glucose management and have developed educational resources to assist practitioners and their institutions toward achieving that goal.[10, 11, 12, 13, 14] Finally, pay‐for‐performance requirements are emerging that are relevant to inpatient diabetes management.[15, 16]
Reports on the status of inpatient glucose control in large samples of US hospitals are now becoming available, and their findings suggest differences on the basis of hospital size, hospital type, and geographic location.[17, 18] However, these reports represent cross‐sectional studies, and little is known about trends in hospital glucose control over time. To determine whether changes were occurring, we obtained inpatient point‐of‐care blood glucose (POC‐BG) data from 126 hospitals for January to December 2009 and compared these with glycemic control data collected from the same hospitals for January to December 2007,[19] separately analyzing measurements from the intensive care unit (ICU) and the non‐intensive care unit (non‐ICU).
METHODS
Data Collection
The methods we used for data collection have been described previously.[18, 19, 20] Hospitals in the study used standard bedside glucose meters downloaded to the Remote Automated Laboratory System‐Plus (RALS‐Plus) (Medical Automation Systems, Charlottesville, VA). We originally evaluated data for adult inpatients for the period from January to December 2007[19]; for this study, we extracted POC‐BG from the same hospitals for the period from January to December 2009. Data excluded measurements obtained in emergency departments. Patient‐specific data (age, sex, race, and diagnoses) were not provided by hospitals, but individual patients could be distinguished by a unique identifier and also by location (ICU vs non‐ICU).
Hospital Selection
The characteristics of the 126 hospitals have been published previously.[19] However, hospital characteristics for 2009 were reevaluated for this analysis using the same methods already described for 2007[19] to determine whether any changes had occurred. Briefly, hospital characteristics during 2009 were determined via a combination of accessing the hospital Web site, consulting the Hospital Blue Book (Billian's HealthDATA; Billian Publishing Inc., Atlanta, Georgia), and determining membership in the Council of Teaching Hospitals and Health Systems of the Association of American Medical Colleges. The characteristics of the hospitals were size (number of beds), type (academic, urban community, or rural), and geographic region (Northeast, Midwest, South, or West). Per the Hospital Blue Book, a rural hospital is a hospital that operates outside of a metropolitan statistical area, typically with fewer than 100 beds, whereas an urban hospital is located within a metropolitan statistical area, typically with more than 100 beds. Institutions provided written permission to remotely access their glucose data and combine it with other hospitals into a single database for analysis. Patient data were deidentified, and consent to retrospective analysis and reporting was waived. The analysis was considered exempt by the Mayo Clinic Institutional Review Board. Participating hospitals were guaranteed confidentiality regarding their data.
Statistical Analysis
ICU and non‐ICU glucose datasets were differentiated on the basis of the download location designated by the RALS‐Plus database. As previously described, patient‐day‐weighted mean POC‐BG values were calculated as means of daily POC‐BG averaged per patient across all days during the hospital stay.[18, 19] We determined the overall patient‐day‐weighted mean values, and also the proportion of patient‐day‐weighted mean values greater than 180, 200, 250, 300, 350, and 400 mg/dL.[18, 19] We also examined the data to determine if there were any changes in the proportion of patient hospital days when there was at least 1 value <70 mg/dL or <40 mg/dL.
Differences in patient‐day‐weighted mean POC‐BG values between the years 2007 and 2009 were assessed in a mixed‐effects model with the term of year as the fixed effect and hospital characteristics as the random effect. The glucose trends between years 2007 and 2009 were examined to identify any differentiation by hospital characteristics by conducting mixed‐effects models using the terms of year, hospital characteristics (hospital size by bed capacity, hospital type, or geographic region), and interaction between year as the fixed effects and hospital characteristics as the random effect. These analyses were performed separately for ICU patients and non‐ICU patients. Values were compared between data obtained in 2009 and that obtained previously in 2007 using the Pearson [2] test. The means within the same category of hospital characteristics were compared for the years 2007 and 2009.
RESULTS
Characteristics of Participating Hospitals
Fewer than half of the 126 hospitals had changes in characteristics from 2007 to 2009 (size and type [Table 1]). There were 71 hospitals whose characteristics did not change compared to when the previous analysis was performed. The rest (n = 55) had changes in their characteristics that resulted in a net redistribution in the number of beds in the <200 and 200 to 299 categories, and a change in the rural/urban categories. These changes slightly altered the distributions by hospital size and hospital type compared to those in the previous analysis (Table 1). The regional distribution of the 126 hospitals was 41 (32.5%) in the South, 37 (29.4%) in the Midwest, 28 (22.2%) in the West, and 20 (15.9%) in the Northeast.[19]
| Characteristic | 2007, No. (%) [N = 126] | 2009, No. (%) [N = 126] |
|---|---|---|
| Hospital size, no. of beds | ||
| <200 | 48 (38.1) | 45 (35.7) |
| 200299 | 25 (19.8) | 28 (22.2) |
| 300399 | 17 (13.5) | 17 (13.5) |
| 400 | 36 (28.6) | 36 (28.6) |
| Hospital type | ||
| Academic | 11 (8.7) | 11 (8.7) |
| Urban | 69 (54.8) | 79 (62.7) |
| Rural | 46 (36.5) | 36 (28.6) |
Changes in Glycemic Control
For 2007, we analyzed a total of 12,541,929 POC‐BG measurements for 1,010,705 patients, and for 2009, we analyzed a total of 10,659,418 measurements for 656,206 patients. For ICU patients, a mean of 4.6 POC‐BG measurements per day was obtained in 2009 compared to a mean of 4.7 POC‐BG measurements per day in 2007. For non‐ICU patients, the POC‐BG mean was 3.1 per day in 2009 vs 2.9 per day in 2007.
For non‐ICU data, the patient‐day‐weighted mean POC‐BG values decreased in 2009 by 5 mg/dL compared with the 2007 values (154 mg/dL vs 159 mg/dL, respectively; P < 0.001), and were clinically unchanged in the ICU data (167 mg/dL vs 166 mg/dL, respectively; P < 0.001). For non‐ICU data, the proportion of patient‐day‐weighted mean POC‐BG values in any hyperglycemia category decreased in 2009 compared with those in 2007 among all patients (all P < 0.001) (Figure 1). For the ICU data, there was no significant difference (all P > 0.20; not shown) from 2007 to 2009.
In the ICU data, 2.9% of patient days on average had at least 1 POC‐BG value <70 mg/dL in both 2007 and 2009 (P = 0.67). There were fewer patient days with values <40 mg/dL in 2009 (1.1%) compared to 2007 (1.4%) in the ICU (P < 0.001). In the non‐ICU data, the mean percentage of patient days with a value <70 mg/dL was higher in 2009 (5.1%) than in 2007 (4.7%) (P < 0.001); however, there were actually fewer patient days in 2009 on average with a value <40 mg/dL (0.84% vs 1.1% for 2009 vs 2007; P < 0.001).
Changes in Glycemic Control by Hospital Characteristics
Next, changes in glucose levels between the 2 analytic periods were evaluated according to hospital characteristics. Significant interactions were found between the year and each of the hospital characteristics both for the ICU group (Table 2) and for the non‐ICU group (Table 3) (all P < 0.001 for interaction terms). In the ICU data, changes were generally small but significant on the basis of hospital size, hospital type, and geographic region, and these changes were not necessarily in the same direction, because there were increases in patient‐day‐weighted mean glucose values in some categories, whereas there were decreases in others. For instance, hospitals with <200 inpatient beds experienced no significant change in ICU glycemic control, whereas those with 200 to 299 beds or >400 beds had an increase in patient‐day‐weighted mean values, and ones with 300 to 399 beds had a decrease. In regard to hospital type, only ICUs in academic medical institutions had a significant change over time in patient‐day‐weighted mean glucose levels, and these changes were toward higher values. ICUs in institutions in the Northeast and West had significantly higher glucose levels between the 2 periods, whereas those in the Midwest and South demonstrated lower glucose levels. In contrast to the different trends in ICU data by hospital characteristics, non‐ICU glucose control improved for hospitals of all sizes and types, and in all regions, over time.
| Characteristic | Year 2007, mg/dL | Year 2009, mg/dL | P Value |
|---|---|---|---|
| |||
| Overall | 166 (1) | 167 (1) | <0.001 |
| Hospital size, no. of beds | |||
| <200 | 175 (2) | 174 (2) | 0.19 |
| 200299 | 164 (2) | 165 (2) | 0.009 |
| 300399 | 166 (3) | 164 (3) | <0.002 |
| 400 | 157 (2) | 160 (2) | <0.001 |
| Hospital type | |||
| Academic | 150 (3) | 156 (4) | <0.001 |
| Rural | 172 (2) | 172 (2) | 0.94 |
| Urban | 166 (1) | 166 (1) | 0.61 |
| Region | |||
| Northeast | 165 (3) | 167 (3) | 0.003 |
| Midwest | 169 (2) | 168 (2) | 0.007 |
| South | 168 (2) | 167 (2) | <0.001 |
| West | 160 (2) | 165 (2) | <0.001 |
| Characteristic | Year 2007, mg/dL | Year 2009, mg/dL | P Value |
|---|---|---|---|
| |||
| Overall | 159 (1) | 154 (1) | <0.001 |
| Hospital size, no. of beds | |||
| <200 | 162 (2) | 158 (2) | <0.001 |
| 200299 | 156 (2) | 152 (2) | <0.001 |
| 300399 | 158 (3) | 151 (3) | <0.001 |
| 400 | 156 (2) | 151 (2) | < 0.001 |
| Hospital type | |||
| Academic | 162 (3) | 159 (3) | <0.001 |
| Rural | 161 (2) | 156 (2) | <0.001 |
| Urban | 157 (1) | 152 (1) | <0.001 |
| Region | |||
| Northeast | 162 (3) | 158 (3) | <0.001 |
| Midwest | 157 (2) | 149 (2) | <0.001 |
| South | 160 (2) | 157 (2) | <0.001 |
| West | 156 (2) | 151 (2) | <0.001 |
DISCUSSION
Optimal management of hospital hyperglycemia is now advocated by a number of professional societies and organizations.[10, 11, 12, 13] One of the next major tasks in the area of inpatient diabetes management will be how to identify and evaluate changes in glycemic control among US hospitals over time. Respondents to a recent survey of hospitals indicated that most institutions are now attempting to initiate quality improvement programs for the management of inpatients with diabetes.[21] These initiatives may translate into objective changes that could be monitored on a national level. However, few data exist on trends in glucose control in US hospitals. In our analysis, POC‐BG data from 126 hospitals collected in 2009 were compared to data obtained from the same hospitals in 2007. Our findings, and the methods of data collection and analysis described previously,[18, 19] demonstrate how such data can be used as a national benchmarking process for inpatient glucose control.
At all levels of hyperglycemia, significant decreases in patient‐day‐weighted mean values were found in non‐ICU data but not in ICU data. During the time these data were collected, recommendations about glucose targets in the critically ill were in a state of flux.[22, 23, 24, 25, 26, 27] Thus, the lack of hyperglycemia improvement in the ICU data between 2007 and 2009 may reflect the reluctance of providers to aggressively manage hyperglycemia because of recent reports linking increased mortality to tight glucose control.[25, 28, 29, 30] The differences in patient‐day‐weighted mean glucose values detected in the non‐ICU data between the 2 analytic periods were statistically significant, but were otherwise small and may not have clinical implications as far as an association with improved patient outcomes. Ongoing longitudinal analysis is required to establish whether these improvements in non‐ICU glucose control will persist over time.
Changes in glycemic control between the 2 periods were also noted when data were stratified according to hospital characteristics. Differences in glucose control in ICU data were not consistently better or worse, but varied by category of hospital characteristics (hospital size, hospital type, and geographic region). Other than academic hospitals and hospitals in the West, changes in the ICU data were small and likely do not have clinical importance. Analysis of non‐ICU data, however, showed consistent improvement within all 3 categories. Some hospital characteristics did change between the 2 study periods: there were fewer hospitals with <200 beds, more hospitals with 200 to 299 beds, a decrease in hospitals identified as rural, and an increase in hospitals designated as urban. Our previous analyses have indicated that hospital characteristics should be considered when examining national inpatient glucose data.[18, 19] In this analysis there was a statistically significant interaction between the year for which data were analyzed and each category of hospital characteristics. It is unclear how these evolving characteristics could have impacted inpatient glucose control. A change in hospital characteristics may in fact represent a change in resources to manage inpatient hyperglycemia. Future studies with nationally aggregated inpatient glucose data that assess longitudinal changes in glucose data may also have to account for variations in hospital characteristics over time in addition to the characteristics of the hospitals themselves.
Differences in hypoglycemia frequency, as calculated as the proportion of patient hospital days, were also detected. In the ICU data, the percentage of days with at least 1 value <70 mg/dL was similar between 2007 and 2009, but the proportion of days with at least 1 value <40 mg/dL was less in 2009, suggesting that institutions as a whole in this analysis may have been more focused on reducing the frequency of severe hypoglycemia. However, in the non‐ICU, there were more days in 2009 with a value <70 mg/dL, but fewer with a value <40 mg/dL. In noncritically ill patients, institutions likely continue to attempt to find the best balance between optimizing glycemic control while minimizing the risk of hypoglycemia. It should be pointed out, however, that overall, the frequency of hypoglycemia, particularly severe hypoglycemia, was quite low in this analysis, as it has been in our previous reports.[18, 19] An examination of hypoglycemia frequency by hospital characteristic to evaluate differences in this metric would be of interest in a future analysis.
The limitations of these data have been previously outlined,[18, 19] and they include the lack of patient‐level data such as demographics and the lack of information on diagnoses that allow adjustment of comparisons by the severity of illness. Moreover, without detailed treatment‐specific information (such as type of insulin protocol), one cannot establish the basis for longitudinal differences in glucose control. Volunteer‐dependent hospital involvement that creates selection bias may skew data toward those who are aware that they are witnessing a successful reduction in hyperglycemia. Finally, POC‐BG may not be the optimal method for assessing glycemic control. The limitations of current methods of evaluating inpatient glycemic control were recently reviewed.[31] Nonetheless, POC‐BG measurements remain the richest source of data on hospital hyperglycemia because of their widespread use and large sample size. A data warehouse of nearly 600 hospitals now exists,[18] which will permit future longitudinal analyses of glucose control in even larger samples.
Despite such limitations, our findings do represent the first analysis of trends in glucose control in a large cross‐section of US hospitals. Over 2 years, non‐ICU hyperglycemia improved among hospitals of all sizes and types and in all regions, whereas similar improvement did not occur in ICU hyperglycemia. Continued analysis will determine whether these trends continue. For those hospitals that are achieving better glucose control in non‐ICU patients, more information is needed on how they are accomplishing this so that protocols can be standardized and disseminated.
Acknowledgments
Disclosures: This project was supported entirely by The Epsilon Group Virginia, LLC, Charlottesville, Virginia, and a contractual arrangement is in place between the Mayo Clinic, Scottsdale, Arizona, and The Epsilon Group. The Mayo Clinic does not endorse the products mentioned in this article. The authors report no conflicts of interest.
- 2011 National Diabetes Fact Sheet.Diagnosed and undiagnosed diabetes in the United States, all ages, 2010.Atlanta, GA:Centers for Disease Control and Prevention;2011 [updated 2011]. Available at: http://www.cdc.gov/diabetes/pubs/estimates11.htm#2. Accessed November 23, 2012.
- Diabetes Data and Trends.Atlanta, GA:Centers for Disease Control and Prevention;2009 [updated 2009]. Available at: http://www.cdc.gov/diabetes/statistics/dmany/fig1.htm. Accessed November 23, 2012.
- American Diabetes Association. Economic costs of diabetes in the U.S. In 2007 [published correction appears in Diabetes Care. 2008;31(6):1271.]. Diabetes Care. 2008;31(3):596–615.
- , , , et al.;American College of Endocrinology Task Force on Inpatient Diabetes Metabolic Control. American College of Endocrinology position statement on inpatient diabetes and metabolic control. Endocr Pract. 2004;10(1):77–82.
- ACE/ADA Task Force on Inpatient Diabetes. American College of Endocrinology and American Diabetes Association consensus statement on inpatient diabetes and glycemic control. Endocr Pract. 2006;12(4):458–468.
- , , , et al.;American Association of Clinical Endocrinologists; American Diabetes Association. American Association of Clinical Endocrinologists and American Diabetes Association consensus statement on inpatient glycemic control. Diabetes Care. 2009;32(6):1119–1131.
- ;DIGAMI (Diabetes Mellitus, Insulin Glucose Infusion in Acute Myocardial Infarction) Study Group. Prospective randomised study of intensive insulin treatment on long term survival after acute myocardial infarction in patients with diabetes mellitus. BMJ. 1997;314(7093):1512–1515.
- , , , et al.;American Diabetes Association Diabetes in Hospitals Writing Committee. Management of diabetes and hyperglycemia in hospitals [published correction appears in Diabetes Care. 2004;27(5):1255; Diabetes Care. 2004;27(3):856]. Diabetes Care. 2004;27(2):553–591.
- , , , , . Inpatient management of diabetes and hyperglycemia among general medicine patients at a large teaching hospital. J Hosp Med. 2006;1(3):145–150.
- , , , , ;Society of Hospital Medicine Glycemic Control Task Force. Society of Hospital Medicine Glycemic Control Task Force summary: practical recommendations for assessing the impact of glycemic control efforts. J Hosp Med. 2008;3(5 suppl):66–75.
- , , , , , . Adherence to surgical care improvement project measures and the association with postoperative infections. JAMA. 2010;303(24):2479–2485.
- Glycemic Control Resource Room.Philadelphia, PA:Society of Hospital Medicine;2008. Available at: http://www.hospitalmedicine.org/ResourceRoomRedesign/GlycemicControl.cfm. Accessed November 23, 2012.
- Inpatient Glycemic Control Resource Center.Jacksonville, FL:American Association of Clinical Endocrinologists;2011. Available at: http://resources.aace.com. Accessed November 23, 2012.
- , , , et al.;Endocrine Society. Management of hyperglycemia in hospitalized patients in non‐critical care setting: an endocrine society clinical practice guideline. J Clin Endocrinol Metab. 2012;97(1):16–38.
- Hospital Quality Initiative.Baltimore, MD:Centers for Medicare and Medicaid Services;2012 [updated 2012]. Available at: http://www.cms.gov/HospitalQualityInits/08_HospitalRHQDAPU.asp. Accessed November 23, 2012.
- Hospital‐Acquired Conditions (Present on Admission Indicator).Baltimore, MD:Centers for Medicare and Medicaid Services;2012 [updated 2012]. Available at: http://www.cms.gov/hospitalacqcond/06_hospital‐acquired_conditions.asp. Accessed November 23, 2012.
- , , , et al. Evaluation of hospital glycemic control at US academic medical centers. J Hosp Med. 2009;4(1):35–44.
- , , , . Update on inpatient glycemic control in hospitals in the United States. Endocr Pract. 2011;17(6):853–861.
- , , , , , . Inpatient glucose control: a glycemic survey of 126 U.S. hospitals. J Hosp Med. 2009;4(9):E7–E14.
- , , , , . Inpatient point‐of‐care bedside glucose testing: preliminary data on use of connectivity informatics to measure hospital glycemic control. Diabetes Technol Ther. 2007;9(6):493–500.
- , , , , , . Diabetes and hyperglycemia quality improvement efforts in hospitals in the United States: current status, practice variation, and barriers to implementation. Endocr Pract. 2010;16(2):219–230.
- , , , et al. Intensive insulin therapy in critically ill patients. N Engl J Med. 2001;345(19):1359–1367.
- , , , et al. Intensive insulin therapy in the medical ICU. N Engl J Med. 2006;354(5):449–461.
- , , , et al.;German Competence Network Sepsis (SepNet). Intensive insulin therapy and pentastarch resuscitation in severe sepsis. N Engl J Med. 2008;358(2):125–139.
- , , , et al.;NICE‐SUGAR Study Investigators. Intensive versus conventional glucose control in critically ill patients. N Engl J Med. 2009;360(13):1283–1297.
- , , , et al. A prospective randomised multi‐centre controlled trial on tight glucose control by intensive insulin therapy in adult intensive care units: the Glucontrol study. Intensive Care Med. 2009;35(10):1738–1748.
- , , . Benefits and risks of tight glucose control in critically ill adults: a meta‐analysis [published correction appears in JAMA. 2009;301(9):936]. JAMA. 2008;300(8):933–944.
- , . Severe hypoglycemia in critically ill patients: risk factors and outcomes. Crit Care Med. 2007;35(10):2262–2267.
- , , , et al. Relationship between spontaneous and iatrogenic hypoglycemia and mortality in patients hospitalized with acute myocardial infarction. JAMA. 2009;301(15):1556–1564.
- , , , et al. Hypoglycemia and outcome in critically ill patients. Mayo Clin Proc. 2010;85(3):217–224.
- , , , . Assessing inpatient glycemic control: what are the next steps?J Diabetes Sci Technol. 2012;6(2):421–427.
Copyright © 2012 Society of Hospital Medicine
Inpatient Glucose Control
The past decade has seen an increase in the number of hospital discharges associated with a diabetes diagnosis.1, 2 Diabetes is the fourth leading comorbid condition associated with any hospital discharge in the United States.3 Nearly one‐third of diabetes patients require 2 or more hospitalizations in any given year,4 and inpatient stays account for the largest proportion of direct medical expenses incurred by persons with the disease.5
The hospital component of diabetes care has been receiving considerable attention. The advantage of effective inpatient diabetes managementwith particular attention to improving glycemic controlis evident for a number of clinical situations (eg, acute myocardial infarction, critically ill patients).68 National and regional organizations,912 and professional societies68, 12 have developed guidelines about management of inpatient hyperglycemia.
Despite increased awareness of the value of treating inpatient hyperglycemia, little is known about glucose control in U.S. hospitals. As hospitals begin to develop programs to improve inpatient glucose management, some method of standardized benchmarking should be put in place. Using information systems solutions to obtain point‐of‐care bedside glucose (POC‐BG) data, we previously reported on inpatient glucose control from a smaller number of U.S. hospitals.13, 14 We now provide data on a larger, more representative number of U.S. hospitals that gives a broader national view of the current status of inpatient glycemic control.
Patients and Methods
Data Collection
The hospitals in this study employed standard bedside glucose meters (ACCU‐CHEK Inform, Roche Diagnostics, Indianapolis, IN), downloaded to the Remote Automated Laboratory System‐Plus (RALS‐Plus; Medical Automation Systems, Charlottesville, VA), a well‐established POC test information management system.1315 Participating hospitals do not provide patient specific data (eg, age, sex, race, diagnosis codes), but individual patients can be selected based on a unique anonymous identifier. Data also includes date and time of the POC‐BG test, download location (nursing unit), and the test result. Patient‐level POC‐BG data was extracted by linking the POC‐BG data to the unique patient identifier. Adult inpatient data from January to December 2007 were collected. Out‐of‐range values of LO (<10 mg/dL) and HI (>600 mg/dL) were discarded. The number of HI/LO values totaled less than 0.4% of the measurements. Repeat measures, largely performed to verify hypoglycemia were found to be present for <3% of the measures and were retained in this analyses.
Hospital Selection
Participating hospitals were included through self‐selection based on interest and a willingness to complete a business agreement prior to a data collection deadline. All of the more than 1300 hospitals with RALS‐Plus capability were invited to participate in the RALS‐Annual Report,16 an ongoing benchmarking project of inpatient glucose control in U.S. hospitals; 126 hospitals agreed to participate. Hospitals provided written permission to remotely access their RALS‐Plus glucose data and combine it with other participating hospitals into an aggregate database. Confidentiality was guaranteed for the identity of participating hospitals and their data.
Characteristics of participating hospitals, including number of beds, type (academic, urban community, rural community), and region, were obtained via completion of a questionnaire. This information was verified by accessing the hospital website or consulting the 2008 Hospital Blue Book (Official National Edition; Billian Publishing, Inc., Atlanta, GA). For academic status, we used membership in the Association of American Medical Colleges' Council of Teaching Hospitals, which is limited to organizations having a documented affiliation agreement with a medical school. Our definition of hospital types for the 126 study hospitals was based on first selecting the academic hospitals as a separate subgroup. The remaining hospitals were then classified as urban community or rural community.
Statistical Analysis
Glucose data were normalized to patient‐day, and expressed according to the number of patient‐days during which measurements were obtained. Patient‐day analyses were conducted by first constructing a patient‐day POC‐BG mean. An average POC‐BG level was computed for each patient‐day by summing together the measurement occasions for a given patient‐day and dividing by the number of measurements that occurred on that day. These patient‐day averages were then aggregated to the hospital level, and averaged to compute the patient‐day‐weighted mean POC‐BG level for each hospital, using the patient‐day as the unit of analysis.
Because of variations in the definition of maximal recommended inpatient glucose levels,8, 9 we calculated proportion of patient‐days with a patient‐day‐weighted mean POC‐BG value above the cut points of >180, >200, >250, >300, >350, and >400 mg/dL.14, 17 Published studies on hypoglycemia also use various biochemical definitions of low glucose;1824 therefore, we determined percentages of patient days with at least 1 POC‐BG value below the different cut points (<70, <60, <50, and <40 mg/dL) as previously described.14, 17
Finally, we evaluated the relationship between hospital patient‐day‐weighted mean POC‐BG values (normalized to patient day as above) and specific hospital characteristics: number of hospital beds, hospital type (academic, urban community, rural community), and U.S. geographic region. Hospital groups were compared for continuous variables using Mann‐Whitney tests and categorical variables (hospital characteristics) by chi‐square tests. All analyses were done using SPSS 15.0 (SPSS, Chicago, IL). Statistics were calculated for intensive care unit (ICU) and non‐ICU locations separately.
Results
Characteristics of Participating Hospitals
Of the 126 participating hospitals (Table 1), 38.1% were <200 beds, 19.8% were 200 to 299 beds, 13.5% were 300 to 399 beds, and 28.6% were 400 beds; 54.8% were urban community hospitals, 36.5% were rural community, 8.7% were academic, 32.5% were located in the South, 29.4% in the Midwest, 22.2% in the West, and 15.9% in the Northeast. Using chi‐square comparison our study sample was found to be representative of the larger sample of hospitals that use RALS‐Plus with regards to bed number, hospital type, and region (P = not significant [NS]), but not representative of hospitals nationally in these categories (P < 0.05). The most notable difference was seen in hospital size, where the sample hospitals were disproportionately larger; a trait shared by RALS hospitals more generally.
| Study Hospitals | RALS‐Plus Hospitals | U.S. Hospitals | |
|---|---|---|---|
| |||
| Total | 126 | 1225 | 4936 |
| Number of beds, n (%) | |||
| <200 | 48 (38.1) | 510 (41.6) | 3532 (71.6) |
| 200‐299 | 25 (19.8) | 284 (23.2) | 619 (12.5) |
| 300‐399 | 17 (13.5) | 193 (15.8) | 368 (7.5) |
| 400 | 36 (28.6) | 238 (19.4) | 417 (8.4) |
| Hospital type, n (%) | |||
| Academic | 11 (8.7) | 74 (6.0) | 413 (8.4) |
| Urban | 69 (54.8) | 835 (68.2) | 2514 (50.9) |
| Rural | 46 (36.5) | 316 (25.8) | 2009 (40.7) |
| Region, n (%) | |||
| Northeast | 20 (15.9) | 206 (16.8) | 680 (13.8) |
| Midwest | 37 (29.4) | 520 (42.4) | 1422 (28.8) |
| South | 41 (32.5) | 259 (21.1) | 1919 (38.9) |
| West | 28 (22.2) | 239 (19.5) | 915 (18.5) |
Overall Glycemic Control
A total of 12,559,305 POC‐BG measurements (2,935,167 from the ICU and 9,624,138 from the non‐ICU) from 1,010,705 patients with 3,973,460 patient days were analyzed from 126 hospitals. The mean number of measurements was 20 per ICU patient and 9.5 for non‐ICU patients. The average number of measurements taken per patient‐day was 5 for the ICU patient and 3 for the non‐ICU patient.
Hospital hyperglycemia (>180 mg/dL) was 46.0% for ICU and 31.7% for non‐ICU. The patient‐day‐weighted mean POC‐BG for ICU measurements was 165 mg/dL (median = 164 mg/dL, SD 14.5) and 166 mg/dL (median = 167 mg/dL, SD 8) for non‐ICU. The distributions of patient‐day‐weighted mean POC‐BG values for ICU and non‐ICU settings are shown in Figure 1. The range of patient‐day‐weighted mean values was much wider for the ICU (126‐203 mg/dL) than in the non‐ICU (139‐186 mg/dL).
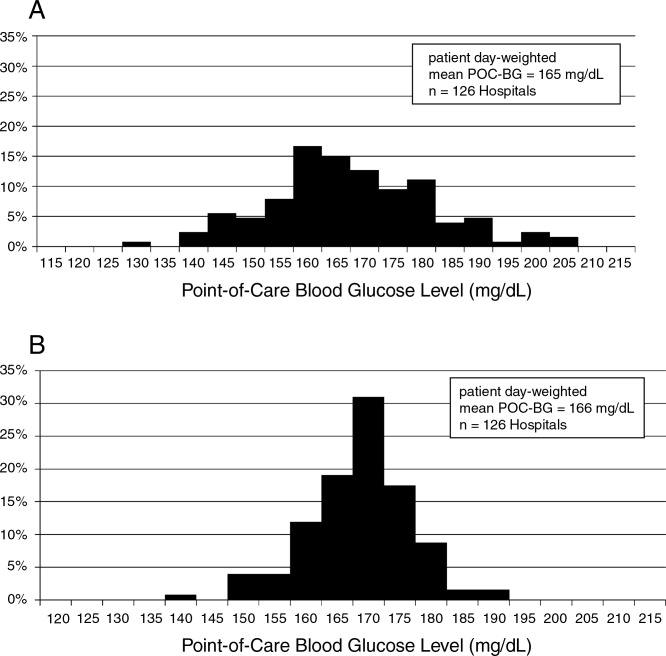
Hyperglycemia Prevalence
Of ICU patients, 60.6% had at least 1 POC‐BG value >180 mg/dL, as did 46.4% of non‐ICU patients. The proportion of patient‐days with a patient‐day‐weighted mean POC‐BG >180 mg/dL was 26.3% in the ICU setting (Figure 2A) and 31.3% in the non‐ICU (Figure 2B); the other cut points are also shown in Figure 2. The prevalence of patient‐days where hyperglycemia was more severe (>300 mg/dL) was low but nonetheless still detected in both the ICU and non‐ICU settings, although these differences appear to be less pronounced than in the ICU.
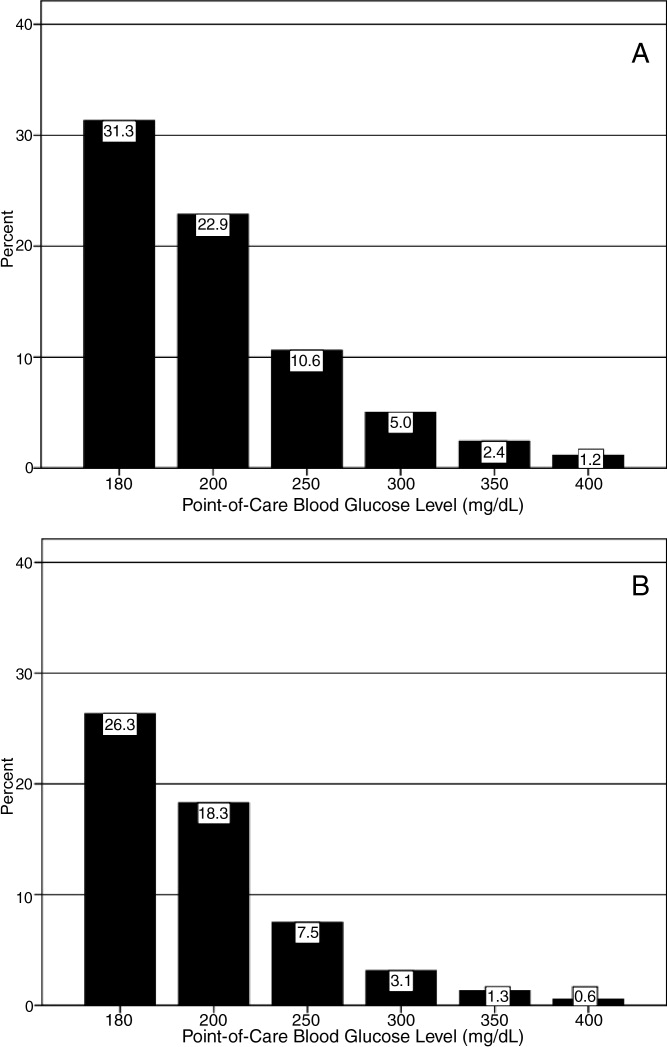
Hypoglycemia Rates
There were 21.3% of patients who had at least 1 POC‐BG value <70 mg/dL. Hospital hypoglycemia was low in both the ICU and non‐ICU measurement data, although the proportion of patient days with POC‐BG <70 mg/dL was higher in the ICU vs. the non‐ICU setting (Figure 3A,B). Hypoglycemia (<70 mg/dL) was detected in 10.1% of patient‐days (3.2% of all measures) in the ICU setting (Figure 3A) and 3.5% of patient‐days (4.2% of all measures) in the non‐ICU (Figure 3B). Moderate (<60 mg/dL) and more severe (<50 mg/dL and <40 mg/dL) hypoglycemia were very uncommon in both the ICU and non‐ICU.
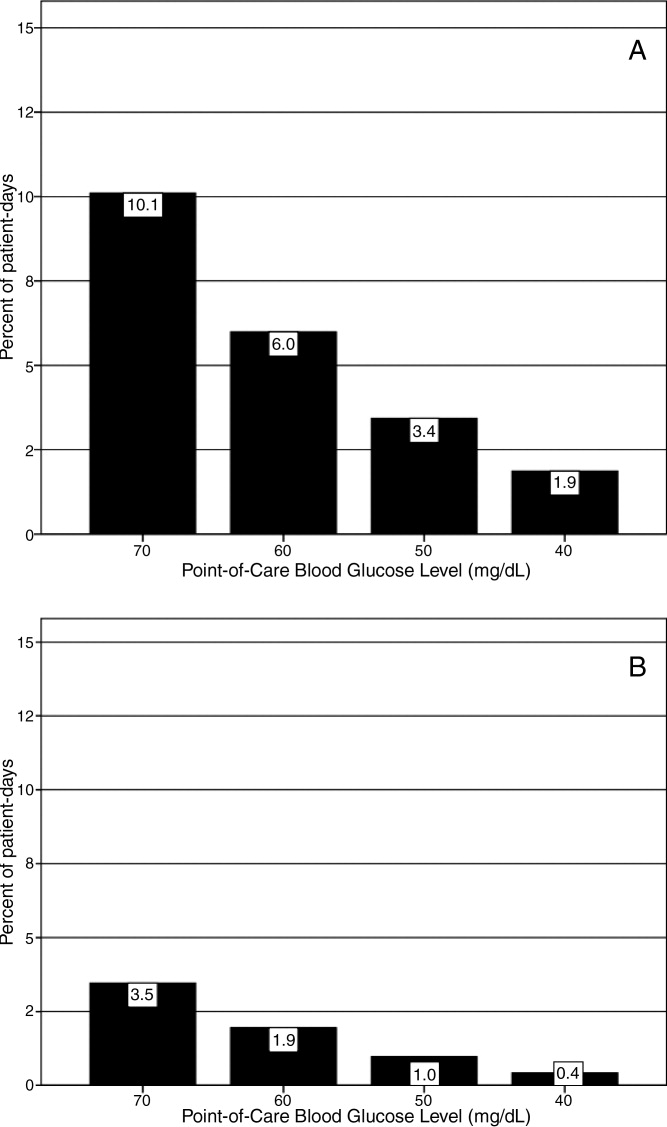
Relationship of Glucose Control with Hospital Characteristics
There was a significant relationship between the total number of hospital beds and patient‐day‐weighted mean POC‐BG values in the ICU (Figure 4A). In the ICU, hospitals with <200 beds had significantly higher patient‐day‐weighted mean POC‐BG levels than those with 200 to 299 beds (P < 0.05), 300 to 399 beds (P < 0.01), and 400 beds (P < 0.001). Rural hospitals (Figure 4B) also had higher patient‐day‐weighted mean POC‐BG values compared to urban community and academic hospitals (both P < 0.001). Finally, ICUs in hospitals in the West (Figure 4C, bottom panel) had significantly lower values than those in the Midwest and South (both P < 0.01).
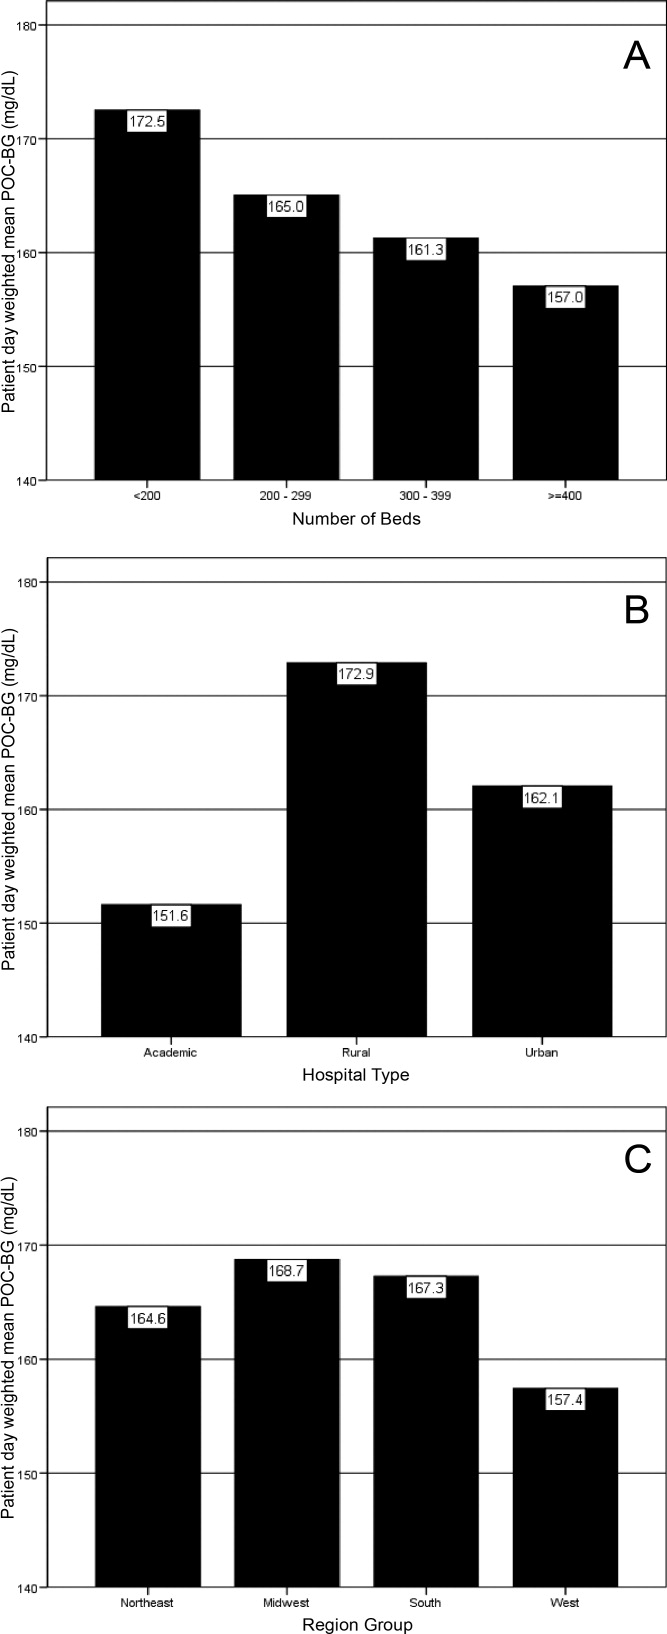
Differences in patient‐day‐weighted mean POC‐BG levels based on hospital characteristics were also observed for the non‐ICU (Figure 5), although these differences appear to be less pronounced than in the ICU. Hospitals with <200 beds (Figure 5A) had significantly higher patient‐day‐weighted mean POC‐BG values compared to hospitals with 300 to 399 beds (P < 0.05) and 400 beds (P < 0.001). Rural hospitals (Figure 5B) had significantly higher values than academic (P < 0.05) and urban community (P < 0.001) hospitals, and hospitals in the West (Figure 5C) had significantly lower values than those in the South and Northeast (both P < 0.05).
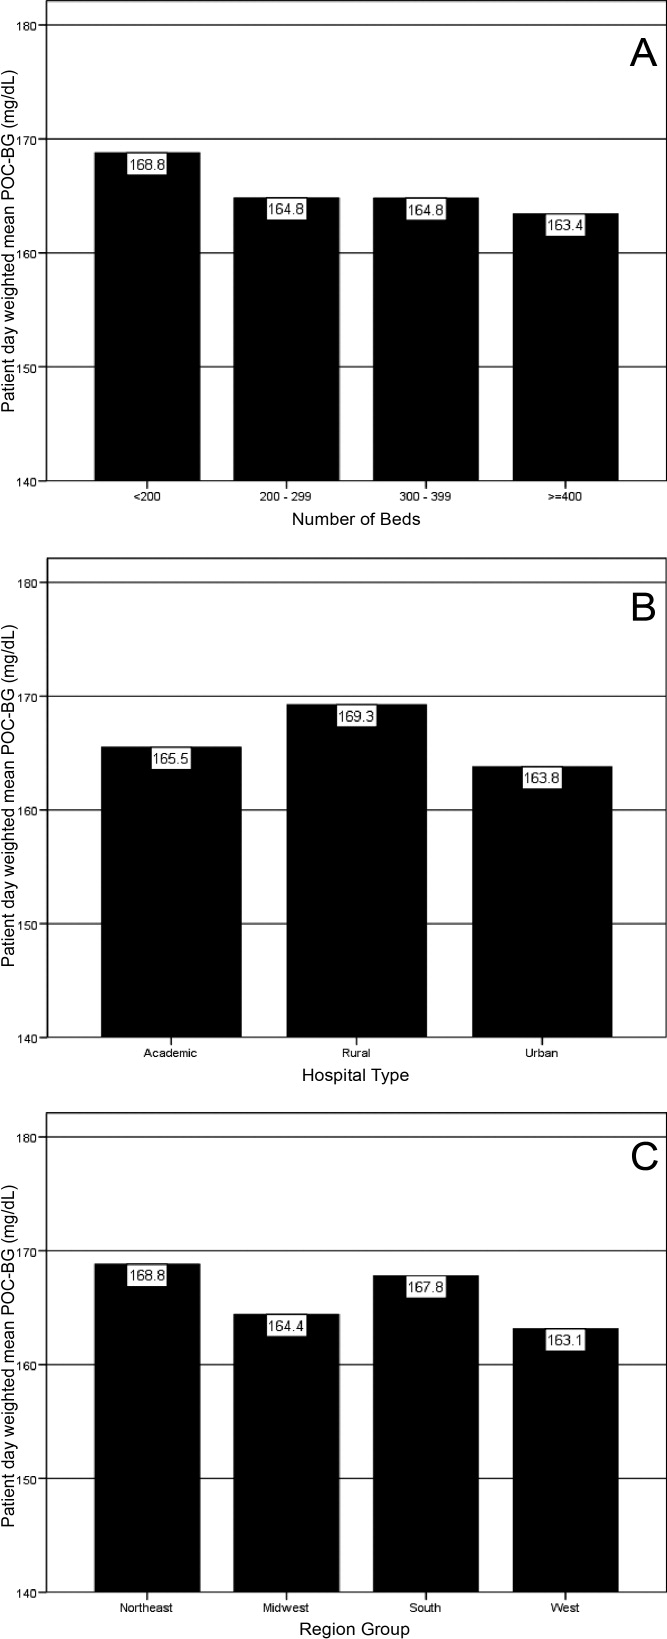
Discussion
Hospitalizations associated with diabetes pose a substantial burden on the U.S. health system.15 Recent consensus advocates good glucose control in the hospital to optimize outcomes for a number of clinical scenarios.68 Aside from a few institution‐specific studies,2527 the quality of diabetes treatment in U.S. hospitals is mostly unknown, but assessing the level of glycemic control will be a key metric that hospitals will need to track as they implement improvement programs targeting hospital hyperglycemia. Hospitals will need a way not just to track overall glucose levels, but also to monitor whether hypoglycemic events rise as they implement tight glycemic control initiatives. To our knowledge this is the first report on glycemic control from a large number of U.S. hospitals with diverse characteristics and from different geographic regions.
Debate continues as to what glucose targets for inpatients should be attained.28, 29 The overall patient‐day‐weighted mean POC‐BG was 170 mg/dL for the non‐ICU, and only a moderately lower 162 mg/dL in the ICU, despite much lower thresholds for ICU measurements in current suggested guidelines.8, 30 For the average hospital, over one‐third of non‐ICUs had patient‐day‐weighted mean POC‐BG levels that were >180 mg/dL and nearly one‐quarter had values >200 mg/dL. Similarly, nearly 40% of ICUs had patient‐day‐weighted mean POC‐BGs >180 mg/dL and over 30% were >200 mg/dL, indicating room for improvement in hospital ICU glucose control, at least in the hospitals sampled here. The range of patient‐day‐weighted mean POC‐BG levels for the ICU was broader than what was seen in the non‐ICU data, with the ICU data containing lower weighted mean POC‐BG values, and may indicate that hospitals are concentrating their efforts on adopting stricter glucose control measures in their ICUs.
Whether examining data from a single institution,17 from a larger group of hospitals,14 or now from 126 hospitals, one consistent finding has been the low prevalence of hypoglycemiaparticularly severe hypoglycemia (glucose <50 mg/dL or <40 mg/dL). Based on this larger sampling, however, hypoglycemia in the ICU, while still uncommon with respect to hyperglycemia, is more than double that of the non‐ICU. Fear of hypoglycemia is frequently mentioned as a barrier to attaining lower inpatient glucose levels.31 Although hypoglycemia frequency in the hospital is low, and even though recent data indicates that hypoglycemia is not perceived by practitioners as the number 1 barrier to successful inpatient diabetes management,3234 the possible association of severe low glucose levels to inpatient mortality18, 19, 21, 22, 24, 35 makes hypoglycemia a key counterbalance metric that hospitals will need to track as they implement glycemic control programs. In the ICU, higher glycemic targets may be needed to allay practitioner fears, and insulin administration protocols that have the best track record for minimizing hypoglycemia should be identified and promulgated.
Recent data showing increased risk of hospital hypoglycemia with attempts to better control hyperglycemia may unjustifiably deter practitioners and hospitals from implementing programs to better control inpatient glucose levels.24, 36 Unlike the outpatient setting, where patients can take measures to prevent hypoglycemia, hospitalized patients surrender control of their diabetes management to staff. Inpatient tight glycemic control initiatives cannot be instituted unless they are coupled with efforts to understand and correct system‐based problems that increase the risk of hypoglycemia. Recently published reports demonstrate that hypoglycemic events can be kept very low during treatment with an intensive insulin infusion protocol if expert rules are built into the algorithm that address hypoglycemia.37, 38 Thus, rather than abandon efforts at improving inpatient hyperglycemia over concerns about hypoglycemia, hospitals will need to develop methods to change their hypoglycemia policies from ones that typically just guide treatment to ones that incorporate preventive strategies.
Our data suggest a relationship between POC‐BG levels and hospital characteristics. Rural hospitals and hospitals with the least number of beds had higher POC‐BG levels compared to urban, academic, or larger hospitals, especially in the ICU setting. The reasons underlying these findings cannot be determined from this analysis, but it is possible that smaller hospitals and those located in rural areas do not have access to the diabetes experts (eg, endocrinologists or diabetes educators) to assist them in developing tight glycemic control programs. We also detected differences in patient‐day‐weighted mean POC‐BG data based on geographic region. Whether considering ICU or non‐ICU data, hospitals located in the West had lower glucose values compared to other regions. As with the other hospital characteristics, the explanation underlying these observations cannot be determined. It is possible that hospitals in the West are earlier‐adopters of tight glycemic control programs compared to other U.S. geographic regions. Further study is needed in a larger number of hospitals to confirm these findings.
These findings should be considered in light of the following limitations: unavailability to us of specific patient‐level information that would allow adjustment of data for such as variables as comorbidity; the fact that recommendations about glycemic targets in the hospital vary by organization,810, 30 which may result in hospitals aiming for different targets in different populations; and the controversy that continues on the benefits of glycemic control in the ICU, which may be dissuading facilities from implementing glucose control programs.39, 40 All that can be concluded from our analysis is that there is variation in the POC‐BG data based on hospital characteristics. We cannot state that one type of hospital is performing glycemic control better than another, particularly as some hospital types are underrepresented in our sample, and we cannot control for patient‐level data. Moreover, this statistical variation seen between different hospital types may not be of clinical importance in terms of being associated with different outcomes, or may simply be a result of different patterns of glucose monitoring in individual hospitals. However, the observed variation should prompt further investigation into the basis of differences (eg, some hospital types or regions may be further ahead in inpatient diabetes quality improvement initiatives than others).
There is no consensus about how best to summarize and report glycemic control in the hospital (so called glucometrics),41 and a variety of reporting measures have been suggested.20, 4245 We show data using one method: with the mean BG normalized to patient‐day as the unit of analysis; however, we found similar results when we used the patient or the glucose reading as the unit of analysis. As organizations move to develop standards for summarizing inpatient glucose data, consideration must be given to which measure is best correlated with hospital outcomes. In addition, when developing standards, it will be important to determine what type of data hospitals will find most clinically useful to track the impact of glucose control interventions. For instance, hospitals may wish to see data on the frequencies of glucose measurements that are above and below certain desired thresholds, which is one of the approaches that we have used in previous publications,14, 17, 26, 46 and which is currently provided as feedback to hospitals participating in RALS reporting.
The other issue to address in development of standards in inpatient glycemic control reporting is what method of glucose measurement should be used. Correlation between whole‐blood vs. POC‐BG values can be imprecise in the intensive care setting.41, 47 We have previously utilized bedside glucose measurements as our means of evaluating the status of inpatient glucose control,14, 17, 26 and bedside glucose measurements remain the mainstay of how practitioners judge the status of inpatient hyperglycemia and make therapeutic decisions about management. The hospitals participating in the process reviewed here all use the same system of bedside glucose monitoring and glucometer‐laboratory electronic interface. Until alternative clinical methods are developed to frequently sample glucose levels in a convenient and minimally invasive way at the bedside, current POC‐BG technology will continue to be the most utilized means of assessing hospital glucose management in the inpatient setting.
Electronic data warehouses such as RALS‐Plus are convenient sources of information in which to store data on the quality of inpatient diabetes care. Unlike chart abstraction which requires extensive man‐hours to extract data on a few patients, use of electronic data allows examination of large numbers of hospital cases. Queries of information systems could be automated, report cards potentially generated, and feedback given to providers and hospitals on the status of inpatient glycemic control.
Nonetheless, there are limitations to using electronic records as the sole method to assess inpatient diabetes care. Analysis of electronic records does not allow assessment of reasons underlying decision‐making behavior of clinicians (eg, why they did or did not change hyperglycemic therapy). Moreover, our electronic data does not permit an assessment of who had preexisting diabetes, who was admitted with new onset diabetes, or who developed hyperglycemia as a result of the hospital stay.
In addition to the above, while our sample was representative of other RALs participating hospitals, it was not entirely representative of all U.S. hospitals. Hospitals contributing data to this report were chosen by self‐selection rather than by random methods. Expanding hospital participation in this inpatient glucose assessment benchmarking process will be needed to determine if findings in this work can be generalized. Finally, our study was conducted using the hospital, rather than the patient, as the unit of analysis, as patient‐level characteristics (age, sex, race/ethnicity) were not provided by participating hospitals.
Despite these limitations and issues noted above, to our knowledge this report is the most extensive review of the state of blood glucose control in hospitals across the United States. While other commercial laboratory data management systems may exist in hospitals, their data has not been reported to date. Additionally, our analysis provides a first glimpse of inpatient glycemic control of a large number of U.S. hospitals of varying characteristics and different national regions. Increased hospital participation in data collection may allow the creation of a national benchmarking process for the development of best practices and improved inpatient hyperglycemia management.
- Centers for Disease Control and Prevention. Hospitalization for Diabetes as First‐Listed Diagnosis. Available at: http://www.cdc.gov/diabetes/statistics/dmfirst/index.htm. Accessed April2009.
- Centers for Disease Control and Prevention. Hospitalizations for Diabetes as Any‐Listed Diagnosis. Available at: http://www.cdc.gov/diabetes/statistics/dmany/index.htm. Accessed April2009.
- ,,,.Hospitalization in the United States, 1997.Rockville, MD:Agency for Healthcare Research and Quality;2000. HCUP Fact Book No. 1; AHRQ Publication No. 00‐0031.
- ,,,.Multiple hospitalizations for patients with diabetes.Diabetes Care.2003;26(5):1421–1426.
- American Diabetes Association.Economic costs of diabetes in the US in 2007.Diabetes Care.2008;31(3):596–615.
- ,,, et al.American Diabetes Association Diabetes in Hospitals Writing Committee: Management of diabetes and hyperglycemia in hospitals.Diabetes Care.2004;27:553–591.
- ACE Task Force on Inpatient Diabetes and Metabolic Control.American College of Endocrinology Position Statement on Inpatient Diabetes and Metabolic Control.Endocr Pract.2004;10:77–82.
- ACE/ADA Task Force on Inpatient Diabetes.American College of Endocrinology and American Diabetes Association consensus statement on inpatient diabetes and glycemic control.Endocr Pract.2006;12(4):459–468.
- Institute for Healthcare Improvement. Getting started kit: prevent surgical site infections. Available at: http://www.ihi.org/NR/rdonlyres/00EBAF1F‐A29F‐4822‐ABCE‐829573255AB8/0/SSIHowtoGuideFINAL.pdf. Accessed April2009.
- Institute for Healthcare Improvement. Implement Effective Glucose Control. Available at: http://www.ihi.org/IHI/Topics/CriticalCare/IntensiveCare/Changes/ImplementEffectiveGlucoseControl.htm. Accessed April2009.
- Joint Commission on Accreditation of Healthcare Organizations. Inpatient Diabetes Certification Addendum. Available at: http://www.jointcommission.org/CertificationPrograms/Inpatient+Diabetes. Accessed April2009.
- ,,, et al.Working to improve care of hospital hyperglycemia through statewide collaboration: the Georgia Hospital Association Diabetes Special Interest Group.Endocr Pract.2007;13:45–50.
- ,,,.Current state of inpatient diabetes burden and care, and goal of the conference.Endocr Pract.2006;12:S1–S10.
- ,,,,.Inpatient point‐of‐care bedside glucose testing: preliminary data on use of connectivity informatics to measure hospital glycemic control.Diabetes Technol Ther.2007;9:493–500.
- .Medical automation systems and a brief history of point‐of‐care informatics.Point Care.2007;6:154–159.
- Medical Automation Systems. RALS‐Report. Available at: http://www.rals.com/RALS‐Report.html. Accessed April2009.
- ,,, et al.Diabetes care in hospitalized non‐critically ill patients: more evidence for clinical inertia and negative therapeutic momentum.J Hosp Med.2007;2:203–211.
- ,,.Hypoglycemia in hospitalized patients. Causes and outcomes.N Engl J Med.1986;315(20):1245–1250.
- ,,,,,.Mortality in hospitalized patients with hypoglycemia and severe hyperglycemia.Mt Sinai J Med.1995;62(6):422–426.
- ,,.Glycemic control and sliding scale insulin use in medical inpatients with diabetes mellitus.Arch Intern Med.1997;157(5):545–552.
- ,,,,.Influence of individual characteristics on outcome of glycemic control in intensive care unit patients with or without diabetes mellitus.Mayo Clin Proc.2005;80(12):1558–1567.
- ,,, et al.Evaluation of short‐term consequences of hypoglycemia in an intensive care unit. [see Comment].Crit Care Med.2006;34(11):2714–2718.
- ,,, et al.Predisposing factors for hypoglycemia in the intensive care unit. [see Comment].Crit Care Med.2006;34(1):96–101.
- .Severe hypoglycemia in critically ill patients: risk factors and outcomes.Crit Care Med.2007;35(10):2262–2267.
- ,,,,.Unrecognized diabetes among hospitalized patients.Diabetes Care.1998;21(2):246–249.
- ,,, et al.Diabetes care in the non‐ICU setting: is there clinical inertia in the hospital?J Hosp Med.2006;1(3):151–160.
- ,,,,.Inpatient management of diabetes and hyperglycemia among general medicine patients at a large teaching hospital.J Hosp Med.2006;1(3):145–150.
- ,.Counterpoint: inpatient glucose management. A premature call to arms?Diabetes Care.2005;28:976–979.
- ,.Point: inpatient glucose management. The emperor finally has clothes.Diabetes Care.2005;28(4):973–975.
- ,,, et al.Surviving Sepsis Campaign: international guidelines for management of severe sepsis and septic shock: 2008.Crit Care Med.2008;36(1):296–327.
- ,,, et al.Hospital hypoglycemia: not only treatment but also prevention. American College of Endocrinology (ACE) Inpatient Diabetes and Metabolic Control Consensus Conference.Endocr Pract.2004;10(suppl 2):89–99.
- ,,, et al.Management of inpatient hyperglycemia: assessing perceptions and barriers to care among resident physicians.Endoc Pract.2007;13:117–125.
- ,,, et al.Beliefs about hospital diabetes and perceived barriers to glucose management among inpatient midlevel practitioners.Diabetes Educ.2008;34(1):75–83.
- ,,,.Perceptions of resident physicians about management of inpatient hyperglycemia in an urban hospital.J Hosp Med.2009;4(1):E1–E8.
- ,,.Hypoglycemia in hospitalized adult patients without diabetes.Endocr Pract.2005;11(2):91–96.
- ,,, et al.Intensive insulin therapy and pentastarch resuscitation in severe sepsis.N Engl J Med.2008;358(2):125–139.
- ,,, et al.Development and implementation of evidence‐based, IV insulin guidelines: a statewide collaborative approach.Insulin.2008;3:67–77.
- ,,, et al.Outcomes of a cardiothoracic intensive care web‐based online intravenous insulin infusion calculator study at a Medical University Hospital.Diabetes Technol Ther.2007;9(6):523–534.
- ,,.Benefits and risks of tight glucose control in critically ill adults. A meta‐analysis.JAMA.2008;300(8):933–944.
- ,.Tight glycemic control in critically ill adults.JAMA.2008;300(8):963–965.
- ,,, et al.“Glucometrics”—assessing the quality of inpatient glucose management.Diabetes Technol Ther.2006;8(5):560–569.
- ,,, et al.Glucometrics in patients hospitalized with acute myocardial infarction: defining the optimal outcomes‐based measure of risk. [see Comment].Circulation.2008;117(8):1018–1027.
- ,,.Hyperglycaemic index as a tool to assess glucose control: a retrospective study.Crit Care.2004;8(3):R122–R127.
- ,,,,.SHM glycemic control task force summary: practical recommendations for assessing the impact of glycemic control efforts.J Hosp Med.2008;3(S5):66–75.
- ,,, et al.Understanding and improving management of inpatient diabetes mellitus: The Mayo Clinic Arizona Experience.J Diabetes Sci Technol.2008;2:925–931.
- ,,, et al.Reliability of point‐of‐care testing for glucose measurement in critically ill adults.Crit Care Med.2005;33(12):2778–2785.
- ,,, et al.Accuracy of bedside glucometry in critically ill patients: influence of clinical characteristics and perfusion index.Mayo Clin Proc.2008;83:400–405.
The past decade has seen an increase in the number of hospital discharges associated with a diabetes diagnosis.1, 2 Diabetes is the fourth leading comorbid condition associated with any hospital discharge in the United States.3 Nearly one‐third of diabetes patients require 2 or more hospitalizations in any given year,4 and inpatient stays account for the largest proportion of direct medical expenses incurred by persons with the disease.5
The hospital component of diabetes care has been receiving considerable attention. The advantage of effective inpatient diabetes managementwith particular attention to improving glycemic controlis evident for a number of clinical situations (eg, acute myocardial infarction, critically ill patients).68 National and regional organizations,912 and professional societies68, 12 have developed guidelines about management of inpatient hyperglycemia.
Despite increased awareness of the value of treating inpatient hyperglycemia, little is known about glucose control in U.S. hospitals. As hospitals begin to develop programs to improve inpatient glucose management, some method of standardized benchmarking should be put in place. Using information systems solutions to obtain point‐of‐care bedside glucose (POC‐BG) data, we previously reported on inpatient glucose control from a smaller number of U.S. hospitals.13, 14 We now provide data on a larger, more representative number of U.S. hospitals that gives a broader national view of the current status of inpatient glycemic control.
Patients and Methods
Data Collection
The hospitals in this study employed standard bedside glucose meters (ACCU‐CHEK Inform, Roche Diagnostics, Indianapolis, IN), downloaded to the Remote Automated Laboratory System‐Plus (RALS‐Plus; Medical Automation Systems, Charlottesville, VA), a well‐established POC test information management system.1315 Participating hospitals do not provide patient specific data (eg, age, sex, race, diagnosis codes), but individual patients can be selected based on a unique anonymous identifier. Data also includes date and time of the POC‐BG test, download location (nursing unit), and the test result. Patient‐level POC‐BG data was extracted by linking the POC‐BG data to the unique patient identifier. Adult inpatient data from January to December 2007 were collected. Out‐of‐range values of LO (<10 mg/dL) and HI (>600 mg/dL) were discarded. The number of HI/LO values totaled less than 0.4% of the measurements. Repeat measures, largely performed to verify hypoglycemia were found to be present for <3% of the measures and were retained in this analyses.
Hospital Selection
Participating hospitals were included through self‐selection based on interest and a willingness to complete a business agreement prior to a data collection deadline. All of the more than 1300 hospitals with RALS‐Plus capability were invited to participate in the RALS‐Annual Report,16 an ongoing benchmarking project of inpatient glucose control in U.S. hospitals; 126 hospitals agreed to participate. Hospitals provided written permission to remotely access their RALS‐Plus glucose data and combine it with other participating hospitals into an aggregate database. Confidentiality was guaranteed for the identity of participating hospitals and their data.
Characteristics of participating hospitals, including number of beds, type (academic, urban community, rural community), and region, were obtained via completion of a questionnaire. This information was verified by accessing the hospital website or consulting the 2008 Hospital Blue Book (Official National Edition; Billian Publishing, Inc., Atlanta, GA). For academic status, we used membership in the Association of American Medical Colleges' Council of Teaching Hospitals, which is limited to organizations having a documented affiliation agreement with a medical school. Our definition of hospital types for the 126 study hospitals was based on first selecting the academic hospitals as a separate subgroup. The remaining hospitals were then classified as urban community or rural community.
Statistical Analysis
Glucose data were normalized to patient‐day, and expressed according to the number of patient‐days during which measurements were obtained. Patient‐day analyses were conducted by first constructing a patient‐day POC‐BG mean. An average POC‐BG level was computed for each patient‐day by summing together the measurement occasions for a given patient‐day and dividing by the number of measurements that occurred on that day. These patient‐day averages were then aggregated to the hospital level, and averaged to compute the patient‐day‐weighted mean POC‐BG level for each hospital, using the patient‐day as the unit of analysis.
Because of variations in the definition of maximal recommended inpatient glucose levels,8, 9 we calculated proportion of patient‐days with a patient‐day‐weighted mean POC‐BG value above the cut points of >180, >200, >250, >300, >350, and >400 mg/dL.14, 17 Published studies on hypoglycemia also use various biochemical definitions of low glucose;1824 therefore, we determined percentages of patient days with at least 1 POC‐BG value below the different cut points (<70, <60, <50, and <40 mg/dL) as previously described.14, 17
Finally, we evaluated the relationship between hospital patient‐day‐weighted mean POC‐BG values (normalized to patient day as above) and specific hospital characteristics: number of hospital beds, hospital type (academic, urban community, rural community), and U.S. geographic region. Hospital groups were compared for continuous variables using Mann‐Whitney tests and categorical variables (hospital characteristics) by chi‐square tests. All analyses were done using SPSS 15.0 (SPSS, Chicago, IL). Statistics were calculated for intensive care unit (ICU) and non‐ICU locations separately.
Results
Characteristics of Participating Hospitals
Of the 126 participating hospitals (Table 1), 38.1% were <200 beds, 19.8% were 200 to 299 beds, 13.5% were 300 to 399 beds, and 28.6% were 400 beds; 54.8% were urban community hospitals, 36.5% were rural community, 8.7% were academic, 32.5% were located in the South, 29.4% in the Midwest, 22.2% in the West, and 15.9% in the Northeast. Using chi‐square comparison our study sample was found to be representative of the larger sample of hospitals that use RALS‐Plus with regards to bed number, hospital type, and region (P = not significant [NS]), but not representative of hospitals nationally in these categories (P < 0.05). The most notable difference was seen in hospital size, where the sample hospitals were disproportionately larger; a trait shared by RALS hospitals more generally.
| Study Hospitals | RALS‐Plus Hospitals | U.S. Hospitals | |
|---|---|---|---|
| |||
| Total | 126 | 1225 | 4936 |
| Number of beds, n (%) | |||
| <200 | 48 (38.1) | 510 (41.6) | 3532 (71.6) |
| 200‐299 | 25 (19.8) | 284 (23.2) | 619 (12.5) |
| 300‐399 | 17 (13.5) | 193 (15.8) | 368 (7.5) |
| 400 | 36 (28.6) | 238 (19.4) | 417 (8.4) |
| Hospital type, n (%) | |||
| Academic | 11 (8.7) | 74 (6.0) | 413 (8.4) |
| Urban | 69 (54.8) | 835 (68.2) | 2514 (50.9) |
| Rural | 46 (36.5) | 316 (25.8) | 2009 (40.7) |
| Region, n (%) | |||
| Northeast | 20 (15.9) | 206 (16.8) | 680 (13.8) |
| Midwest | 37 (29.4) | 520 (42.4) | 1422 (28.8) |
| South | 41 (32.5) | 259 (21.1) | 1919 (38.9) |
| West | 28 (22.2) | 239 (19.5) | 915 (18.5) |
Overall Glycemic Control
A total of 12,559,305 POC‐BG measurements (2,935,167 from the ICU and 9,624,138 from the non‐ICU) from 1,010,705 patients with 3,973,460 patient days were analyzed from 126 hospitals. The mean number of measurements was 20 per ICU patient and 9.5 for non‐ICU patients. The average number of measurements taken per patient‐day was 5 for the ICU patient and 3 for the non‐ICU patient.
Hospital hyperglycemia (>180 mg/dL) was 46.0% for ICU and 31.7% for non‐ICU. The patient‐day‐weighted mean POC‐BG for ICU measurements was 165 mg/dL (median = 164 mg/dL, SD 14.5) and 166 mg/dL (median = 167 mg/dL, SD 8) for non‐ICU. The distributions of patient‐day‐weighted mean POC‐BG values for ICU and non‐ICU settings are shown in Figure 1. The range of patient‐day‐weighted mean values was much wider for the ICU (126‐203 mg/dL) than in the non‐ICU (139‐186 mg/dL).
Hyperglycemia Prevalence
Of ICU patients, 60.6% had at least 1 POC‐BG value >180 mg/dL, as did 46.4% of non‐ICU patients. The proportion of patient‐days with a patient‐day‐weighted mean POC‐BG >180 mg/dL was 26.3% in the ICU setting (Figure 2A) and 31.3% in the non‐ICU (Figure 2B); the other cut points are also shown in Figure 2. The prevalence of patient‐days where hyperglycemia was more severe (>300 mg/dL) was low but nonetheless still detected in both the ICU and non‐ICU settings, although these differences appear to be less pronounced than in the ICU.
Hypoglycemia Rates
There were 21.3% of patients who had at least 1 POC‐BG value <70 mg/dL. Hospital hypoglycemia was low in both the ICU and non‐ICU measurement data, although the proportion of patient days with POC‐BG <70 mg/dL was higher in the ICU vs. the non‐ICU setting (Figure 3A,B). Hypoglycemia (<70 mg/dL) was detected in 10.1% of patient‐days (3.2% of all measures) in the ICU setting (Figure 3A) and 3.5% of patient‐days (4.2% of all measures) in the non‐ICU (Figure 3B). Moderate (<60 mg/dL) and more severe (<50 mg/dL and <40 mg/dL) hypoglycemia were very uncommon in both the ICU and non‐ICU.
Relationship of Glucose Control with Hospital Characteristics
There was a significant relationship between the total number of hospital beds and patient‐day‐weighted mean POC‐BG values in the ICU (Figure 4A). In the ICU, hospitals with <200 beds had significantly higher patient‐day‐weighted mean POC‐BG levels than those with 200 to 299 beds (P < 0.05), 300 to 399 beds (P < 0.01), and 400 beds (P < 0.001). Rural hospitals (Figure 4B) also had higher patient‐day‐weighted mean POC‐BG values compared to urban community and academic hospitals (both P < 0.001). Finally, ICUs in hospitals in the West (Figure 4C, bottom panel) had significantly lower values than those in the Midwest and South (both P < 0.01).
Differences in patient‐day‐weighted mean POC‐BG levels based on hospital characteristics were also observed for the non‐ICU (Figure 5), although these differences appear to be less pronounced than in the ICU. Hospitals with <200 beds (Figure 5A) had significantly higher patient‐day‐weighted mean POC‐BG values compared to hospitals with 300 to 399 beds (P < 0.05) and 400 beds (P < 0.001). Rural hospitals (Figure 5B) had significantly higher values than academic (P < 0.05) and urban community (P < 0.001) hospitals, and hospitals in the West (Figure 5C) had significantly lower values than those in the South and Northeast (both P < 0.05).
Discussion
Hospitalizations associated with diabetes pose a substantial burden on the U.S. health system.15 Recent consensus advocates good glucose control in the hospital to optimize outcomes for a number of clinical scenarios.68 Aside from a few institution‐specific studies,2527 the quality of diabetes treatment in U.S. hospitals is mostly unknown, but assessing the level of glycemic control will be a key metric that hospitals will need to track as they implement improvement programs targeting hospital hyperglycemia. Hospitals will need a way not just to track overall glucose levels, but also to monitor whether hypoglycemic events rise as they implement tight glycemic control initiatives. To our knowledge this is the first report on glycemic control from a large number of U.S. hospitals with diverse characteristics and from different geographic regions.
Debate continues as to what glucose targets for inpatients should be attained.28, 29 The overall patient‐day‐weighted mean POC‐BG was 170 mg/dL for the non‐ICU, and only a moderately lower 162 mg/dL in the ICU, despite much lower thresholds for ICU measurements in current suggested guidelines.8, 30 For the average hospital, over one‐third of non‐ICUs had patient‐day‐weighted mean POC‐BG levels that were >180 mg/dL and nearly one‐quarter had values >200 mg/dL. Similarly, nearly 40% of ICUs had patient‐day‐weighted mean POC‐BGs >180 mg/dL and over 30% were >200 mg/dL, indicating room for improvement in hospital ICU glucose control, at least in the hospitals sampled here. The range of patient‐day‐weighted mean POC‐BG levels for the ICU was broader than what was seen in the non‐ICU data, with the ICU data containing lower weighted mean POC‐BG values, and may indicate that hospitals are concentrating their efforts on adopting stricter glucose control measures in their ICUs.
Whether examining data from a single institution,17 from a larger group of hospitals,14 or now from 126 hospitals, one consistent finding has been the low prevalence of hypoglycemiaparticularly severe hypoglycemia (glucose <50 mg/dL or <40 mg/dL). Based on this larger sampling, however, hypoglycemia in the ICU, while still uncommon with respect to hyperglycemia, is more than double that of the non‐ICU. Fear of hypoglycemia is frequently mentioned as a barrier to attaining lower inpatient glucose levels.31 Although hypoglycemia frequency in the hospital is low, and even though recent data indicates that hypoglycemia is not perceived by practitioners as the number 1 barrier to successful inpatient diabetes management,3234 the possible association of severe low glucose levels to inpatient mortality18, 19, 21, 22, 24, 35 makes hypoglycemia a key counterbalance metric that hospitals will need to track as they implement glycemic control programs. In the ICU, higher glycemic targets may be needed to allay practitioner fears, and insulin administration protocols that have the best track record for minimizing hypoglycemia should be identified and promulgated.
Recent data showing increased risk of hospital hypoglycemia with attempts to better control hyperglycemia may unjustifiably deter practitioners and hospitals from implementing programs to better control inpatient glucose levels.24, 36 Unlike the outpatient setting, where patients can take measures to prevent hypoglycemia, hospitalized patients surrender control of their diabetes management to staff. Inpatient tight glycemic control initiatives cannot be instituted unless they are coupled with efforts to understand and correct system‐based problems that increase the risk of hypoglycemia. Recently published reports demonstrate that hypoglycemic events can be kept very low during treatment with an intensive insulin infusion protocol if expert rules are built into the algorithm that address hypoglycemia.37, 38 Thus, rather than abandon efforts at improving inpatient hyperglycemia over concerns about hypoglycemia, hospitals will need to develop methods to change their hypoglycemia policies from ones that typically just guide treatment to ones that incorporate preventive strategies.
Our data suggest a relationship between POC‐BG levels and hospital characteristics. Rural hospitals and hospitals with the least number of beds had higher POC‐BG levels compared to urban, academic, or larger hospitals, especially in the ICU setting. The reasons underlying these findings cannot be determined from this analysis, but it is possible that smaller hospitals and those located in rural areas do not have access to the diabetes experts (eg, endocrinologists or diabetes educators) to assist them in developing tight glycemic control programs. We also detected differences in patient‐day‐weighted mean POC‐BG data based on geographic region. Whether considering ICU or non‐ICU data, hospitals located in the West had lower glucose values compared to other regions. As with the other hospital characteristics, the explanation underlying these observations cannot be determined. It is possible that hospitals in the West are earlier‐adopters of tight glycemic control programs compared to other U.S. geographic regions. Further study is needed in a larger number of hospitals to confirm these findings.
These findings should be considered in light of the following limitations: unavailability to us of specific patient‐level information that would allow adjustment of data for such as variables as comorbidity; the fact that recommendations about glycemic targets in the hospital vary by organization,810, 30 which may result in hospitals aiming for different targets in different populations; and the controversy that continues on the benefits of glycemic control in the ICU, which may be dissuading facilities from implementing glucose control programs.39, 40 All that can be concluded from our analysis is that there is variation in the POC‐BG data based on hospital characteristics. We cannot state that one type of hospital is performing glycemic control better than another, particularly as some hospital types are underrepresented in our sample, and we cannot control for patient‐level data. Moreover, this statistical variation seen between different hospital types may not be of clinical importance in terms of being associated with different outcomes, or may simply be a result of different patterns of glucose monitoring in individual hospitals. However, the observed variation should prompt further investigation into the basis of differences (eg, some hospital types or regions may be further ahead in inpatient diabetes quality improvement initiatives than others).
There is no consensus about how best to summarize and report glycemic control in the hospital (so called glucometrics),41 and a variety of reporting measures have been suggested.20, 4245 We show data using one method: with the mean BG normalized to patient‐day as the unit of analysis; however, we found similar results when we used the patient or the glucose reading as the unit of analysis. As organizations move to develop standards for summarizing inpatient glucose data, consideration must be given to which measure is best correlated with hospital outcomes. In addition, when developing standards, it will be important to determine what type of data hospitals will find most clinically useful to track the impact of glucose control interventions. For instance, hospitals may wish to see data on the frequencies of glucose measurements that are above and below certain desired thresholds, which is one of the approaches that we have used in previous publications,14, 17, 26, 46 and which is currently provided as feedback to hospitals participating in RALS reporting.
The other issue to address in development of standards in inpatient glycemic control reporting is what method of glucose measurement should be used. Correlation between whole‐blood vs. POC‐BG values can be imprecise in the intensive care setting.41, 47 We have previously utilized bedside glucose measurements as our means of evaluating the status of inpatient glucose control,14, 17, 26 and bedside glucose measurements remain the mainstay of how practitioners judge the status of inpatient hyperglycemia and make therapeutic decisions about management. The hospitals participating in the process reviewed here all use the same system of bedside glucose monitoring and glucometer‐laboratory electronic interface. Until alternative clinical methods are developed to frequently sample glucose levels in a convenient and minimally invasive way at the bedside, current POC‐BG technology will continue to be the most utilized means of assessing hospital glucose management in the inpatient setting.
Electronic data warehouses such as RALS‐Plus are convenient sources of information in which to store data on the quality of inpatient diabetes care. Unlike chart abstraction which requires extensive man‐hours to extract data on a few patients, use of electronic data allows examination of large numbers of hospital cases. Queries of information systems could be automated, report cards potentially generated, and feedback given to providers and hospitals on the status of inpatient glycemic control.
Nonetheless, there are limitations to using electronic records as the sole method to assess inpatient diabetes care. Analysis of electronic records does not allow assessment of reasons underlying decision‐making behavior of clinicians (eg, why they did or did not change hyperglycemic therapy). Moreover, our electronic data does not permit an assessment of who had preexisting diabetes, who was admitted with new onset diabetes, or who developed hyperglycemia as a result of the hospital stay.
In addition to the above, while our sample was representative of other RALs participating hospitals, it was not entirely representative of all U.S. hospitals. Hospitals contributing data to this report were chosen by self‐selection rather than by random methods. Expanding hospital participation in this inpatient glucose assessment benchmarking process will be needed to determine if findings in this work can be generalized. Finally, our study was conducted using the hospital, rather than the patient, as the unit of analysis, as patient‐level characteristics (age, sex, race/ethnicity) were not provided by participating hospitals.
Despite these limitations and issues noted above, to our knowledge this report is the most extensive review of the state of blood glucose control in hospitals across the United States. While other commercial laboratory data management systems may exist in hospitals, their data has not been reported to date. Additionally, our analysis provides a first glimpse of inpatient glycemic control of a large number of U.S. hospitals of varying characteristics and different national regions. Increased hospital participation in data collection may allow the creation of a national benchmarking process for the development of best practices and improved inpatient hyperglycemia management.
- Centers for Disease Control and Prevention. Hospitalization for Diabetes as First‐Listed Diagnosis. Available at: http://www.cdc.gov/diabetes/statistics/dmfirst/index.htm. Accessed April2009.
- Centers for Disease Control and Prevention. Hospitalizations for Diabetes as Any‐Listed Diagnosis. Available at: http://www.cdc.gov/diabetes/statistics/dmany/index.htm. Accessed April2009.
- ,,,.Hospitalization in the United States, 1997.Rockville, MD:Agency for Healthcare Research and Quality;2000. HCUP Fact Book No. 1; AHRQ Publication No. 00‐0031.
- ,,,.Multiple hospitalizations for patients with diabetes.Diabetes Care.2003;26(5):1421–1426.
- American Diabetes Association.Economic costs of diabetes in the US in 2007.Diabetes Care.2008;31(3):596–615.
- ,,, et al.American Diabetes Association Diabetes in Hospitals Writing Committee: Management of diabetes and hyperglycemia in hospitals.Diabetes Care.2004;27:553–591.
- ACE Task Force on Inpatient Diabetes and Metabolic Control.American College of Endocrinology Position Statement on Inpatient Diabetes and Metabolic Control.Endocr Pract.2004;10:77–82.
- ACE/ADA Task Force on Inpatient Diabetes.American College of Endocrinology and American Diabetes Association consensus statement on inpatient diabetes and glycemic control.Endocr Pract.2006;12(4):459–468.
- Institute for Healthcare Improvement. Getting started kit: prevent surgical site infections. Available at: http://www.ihi.org/NR/rdonlyres/00EBAF1F‐A29F‐4822‐ABCE‐829573255AB8/0/SSIHowtoGuideFINAL.pdf. Accessed April2009.
- Institute for Healthcare Improvement. Implement Effective Glucose Control. Available at: http://www.ihi.org/IHI/Topics/CriticalCare/IntensiveCare/Changes/ImplementEffectiveGlucoseControl.htm. Accessed April2009.
- Joint Commission on Accreditation of Healthcare Organizations. Inpatient Diabetes Certification Addendum. Available at: http://www.jointcommission.org/CertificationPrograms/Inpatient+Diabetes. Accessed April2009.
- ,,, et al.Working to improve care of hospital hyperglycemia through statewide collaboration: the Georgia Hospital Association Diabetes Special Interest Group.Endocr Pract.2007;13:45–50.
- ,,,.Current state of inpatient diabetes burden and care, and goal of the conference.Endocr Pract.2006;12:S1–S10.
- ,,,,.Inpatient point‐of‐care bedside glucose testing: preliminary data on use of connectivity informatics to measure hospital glycemic control.Diabetes Technol Ther.2007;9:493–500.
- .Medical automation systems and a brief history of point‐of‐care informatics.Point Care.2007;6:154–159.
- Medical Automation Systems. RALS‐Report. Available at: http://www.rals.com/RALS‐Report.html. Accessed April2009.
- ,,, et al.Diabetes care in hospitalized non‐critically ill patients: more evidence for clinical inertia and negative therapeutic momentum.J Hosp Med.2007;2:203–211.
- ,,.Hypoglycemia in hospitalized patients. Causes and outcomes.N Engl J Med.1986;315(20):1245–1250.
- ,,,,,.Mortality in hospitalized patients with hypoglycemia and severe hyperglycemia.Mt Sinai J Med.1995;62(6):422–426.
- ,,.Glycemic control and sliding scale insulin use in medical inpatients with diabetes mellitus.Arch Intern Med.1997;157(5):545–552.
- ,,,,.Influence of individual characteristics on outcome of glycemic control in intensive care unit patients with or without diabetes mellitus.Mayo Clin Proc.2005;80(12):1558–1567.
- ,,, et al.Evaluation of short‐term consequences of hypoglycemia in an intensive care unit. [see Comment].Crit Care Med.2006;34(11):2714–2718.
- ,,, et al.Predisposing factors for hypoglycemia in the intensive care unit. [see Comment].Crit Care Med.2006;34(1):96–101.
- .Severe hypoglycemia in critically ill patients: risk factors and outcomes.Crit Care Med.2007;35(10):2262–2267.
- ,,,,.Unrecognized diabetes among hospitalized patients.Diabetes Care.1998;21(2):246–249.
- ,,, et al.Diabetes care in the non‐ICU setting: is there clinical inertia in the hospital?J Hosp Med.2006;1(3):151–160.
- ,,,,.Inpatient management of diabetes and hyperglycemia among general medicine patients at a large teaching hospital.J Hosp Med.2006;1(3):145–150.
- ,.Counterpoint: inpatient glucose management. A premature call to arms?Diabetes Care.2005;28:976–979.
- ,.Point: inpatient glucose management. The emperor finally has clothes.Diabetes Care.2005;28(4):973–975.
- ,,, et al.Surviving Sepsis Campaign: international guidelines for management of severe sepsis and septic shock: 2008.Crit Care Med.2008;36(1):296–327.
- ,,, et al.Hospital hypoglycemia: not only treatment but also prevention. American College of Endocrinology (ACE) Inpatient Diabetes and Metabolic Control Consensus Conference.Endocr Pract.2004;10(suppl 2):89–99.
- ,,, et al.Management of inpatient hyperglycemia: assessing perceptions and barriers to care among resident physicians.Endoc Pract.2007;13:117–125.
- ,,, et al.Beliefs about hospital diabetes and perceived barriers to glucose management among inpatient midlevel practitioners.Diabetes Educ.2008;34(1):75–83.
- ,,,.Perceptions of resident physicians about management of inpatient hyperglycemia in an urban hospital.J Hosp Med.2009;4(1):E1–E8.
- ,,.Hypoglycemia in hospitalized adult patients without diabetes.Endocr Pract.2005;11(2):91–96.
- ,,, et al.Intensive insulin therapy and pentastarch resuscitation in severe sepsis.N Engl J Med.2008;358(2):125–139.
- ,,, et al.Development and implementation of evidence‐based, IV insulin guidelines: a statewide collaborative approach.Insulin.2008;3:67–77.
- ,,, et al.Outcomes of a cardiothoracic intensive care web‐based online intravenous insulin infusion calculator study at a Medical University Hospital.Diabetes Technol Ther.2007;9(6):523–534.
- ,,.Benefits and risks of tight glucose control in critically ill adults. A meta‐analysis.JAMA.2008;300(8):933–944.
- ,.Tight glycemic control in critically ill adults.JAMA.2008;300(8):963–965.
- ,,, et al.“Glucometrics”—assessing the quality of inpatient glucose management.Diabetes Technol Ther.2006;8(5):560–569.
- ,,, et al.Glucometrics in patients hospitalized with acute myocardial infarction: defining the optimal outcomes‐based measure of risk. [see Comment].Circulation.2008;117(8):1018–1027.
- ,,.Hyperglycaemic index as a tool to assess glucose control: a retrospective study.Crit Care.2004;8(3):R122–R127.
- ,,,,.SHM glycemic control task force summary: practical recommendations for assessing the impact of glycemic control efforts.J Hosp Med.2008;3(S5):66–75.
- ,,, et al.Understanding and improving management of inpatient diabetes mellitus: The Mayo Clinic Arizona Experience.J Diabetes Sci Technol.2008;2:925–931.
- ,,, et al.Reliability of point‐of‐care testing for glucose measurement in critically ill adults.Crit Care Med.2005;33(12):2778–2785.
- ,,, et al.Accuracy of bedside glucometry in critically ill patients: influence of clinical characteristics and perfusion index.Mayo Clin Proc.2008;83:400–405.
Copyright © 2009 Society of Hospital Medicine
