User login
From Physicians Inpatient Care Specialists (MDICS), Hanover, MD (Dr. Capstack, Ms. Vollono), Versant Statistical Solutions, Raleigh, NC (Ms. Segujja), Anne Arundel Medical Center, Annapolis, MD (Dr. Moser [at the time of the study], Dr. Meisenberg), and Johns Hopkins Hospital, Baltimore, MD (Dr. Michtalik).
Abstract
- Objective: To determine whether a higher than conventional physician assistant (PA)–to-physician hospitalist staffing ratio can achieve similar clinical outcomes for inpatients at a community hospital.
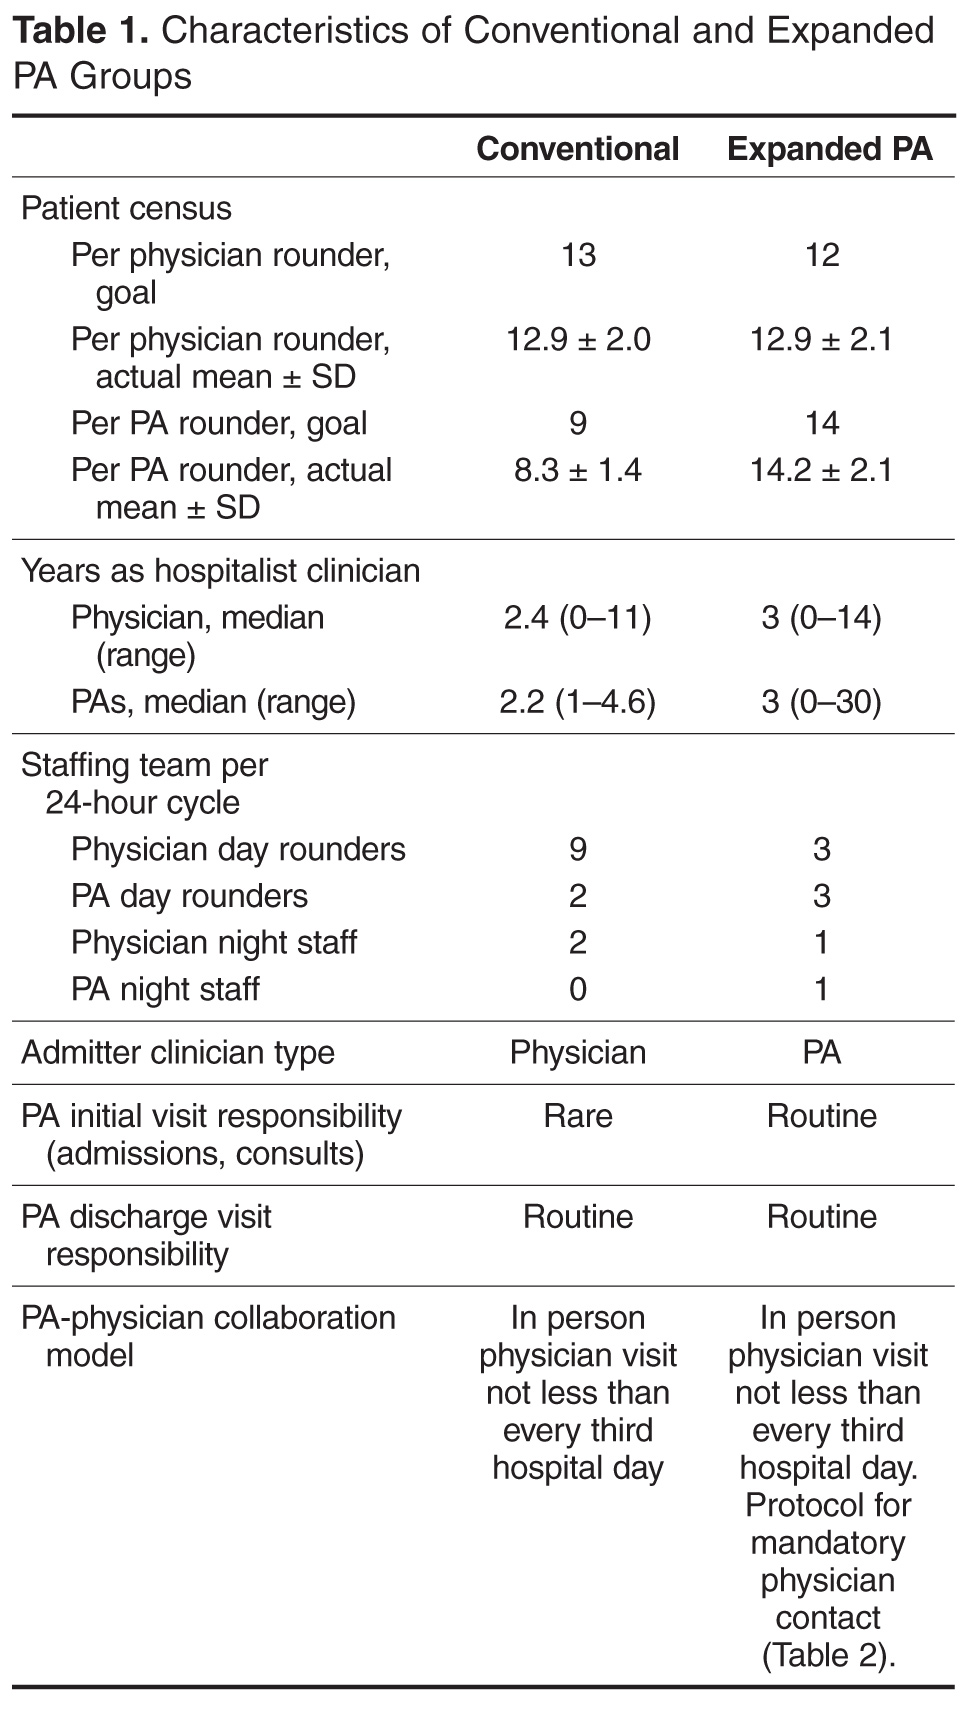
- Methods: Retrospective cohort study comparing 2 hospitalist groups at a 384-bed community hospital, one with a high PA-to-physician ratio model (“expanded PA”), with 3 physicians/3 PAs and the PAs rounding on 14 patients a day (35.73% of all visits), and the other with a low PA-to-physician ratio model (“conventional”), with 9 physicians/2 PAs and the PAs rounding on 9 patients a day (5.89% of all visits). For 16,964 adult patients discharged by the hospitalist groups with a medical principal APR-DRG code between January 2012 and June 2013, in-hospital mortality, cost of care, readmissions, length of stay (LOS) and consultant use were analyzed using logistic regression and adjusted for age, insurance status, severity of illness, and risk of mortality.
- Results: No statistically significant differences were found between the 2 groups for in-hospital mortality (odds ratio [OR], 0.89 [95% confidence interval {CI}, 0.66–1.19]; P = 0.42), readmissions (OR, 0.95 [95% CI, 0.87–1.04]; P = 0.27), length of stay (effect size 0.99 days shorter LOS in expanded PA group, 95% CI, 0.97 to 1.01 days; P = 0.34) or consultant use (OR 1.00, 95% CI 0.94–1.07, P = 0.90). Cost of care was less in the expanded PA group (effect size 3.52% less; estimated cost $2644 vs $2724; 95% CI 2.66%–4.39%, P < 0.001).
- Conclusion: An expanded PA hospitalist staffing model at a community hospital provided similar outcomes at a lower cost of care.
Hospitalist program staffing models must optimize efficiency while maintaining clinical outcomes in order to increase value and decrease costs [1]. The cost of hospitalist programs is burdensome, with nearly 94% of groups nationally requiring financial support beyond professional fees [2]. Nationally, for hospitalist groups serving adults, average institutional support is over $156,000 per physician full time equivalent (FTE) (182 twelve-hour clinical shifts per calendar year) [2]. Significant savings could be achieved if less costly physician assistants could be incorporated into clinical teams to provide similar care without sacrificing quality.
Nurse practitioners (NPs) and physician assistants (PAs) have been successfully employed on academic hospitalist services to complement physician staffing [3–10]. They perform admissions, consults, rounding visits and discharges with physician collaboration as permitted by each group’s policies and in accordance with hospital by-laws and state regulations. A median of 0.25 NP and 0.28 PA FTEs per physician FTE are employed by hospitalist groups that incorporate them, though staffing ratios vary widely [2].
Physicians Inpatient Care Specialists (MDICS) devel-oped a staffing model that deploys PAs to see a large proportion of its patients collaboratively with physicians, and with a higher patient census per PA than has been previously reported [2–5]. The group leaders believed that this would yield similar outcomes for patients at a lower cost to the supporting institution than a conventional staffing model which used fewer PAs to render patient care. Prior inpatient studies have demonstrated comparable clinical outcomes when comparing hospitalist PAs and NPs to residents and fellows [4–10], but to our knowledge no data exist directly comparing hospitalist PAs to hospitalist physicians. This study goes beyond prior work by examining the community, non-teaching setting, and directly comparing outcomes from the expanded use of PAs to those of a hospitalist group staffed with a greater proportion of attending physicians at the same hospital during the same time.
Methods
Setting
The study was performed at Anne Arundel Medical Center (AAMC), a 384-bed community hospital in Annapolis, Maryland, that serves a region of over 1 million people. Approximately 26,000 adult patients are discharged annually. During the study, more than 90% of internal medicine service inpatients were cared for by one of 2 hospitalist groups: a hospital-employed group (“conventional” group, Anne Arundel Medical Group) and a contracted hospitalist group (“expanded PA” group, Physicians Inpatient Care Specialists). The conventional group’s providers received a small incentive for Core Measures compliance for patients with stroke, myocardial infarction, congestive heart failure and pneumonia. The expanded PA group received a flat fee for providing hospitalist services and the group’s providers received a small incentive for productivity from their employer. The study was deemed exempt by the AAMC institutional review board.
Staffing Models, Patient Allocation, and Assignment
Admitted patients were designated to be admitted to one group or the other on the basis of standing arrangements with the patients’ primary care providers. Consultative referrals could also be made from subspecialists, who had discretion as to which group they wished to use.
Each morning, following sign-out report from the night team, each team of day providers determined which patients would be seen by which of their providers. Patients still on service from the previous day would be seen by the same provider again whenever possible in order to maintain continuity. Each individual provider had their own patients for the day who they rounded on independently and were responsible for. Physician involvement with patients seen primarily by PAs occurred as described below. Physicians in both groups were expected to take primary rounding responsibility for patients who were more acute or more complex based on morning sign-out report; there was no more formal mandate for patient allocation to particular provider type.
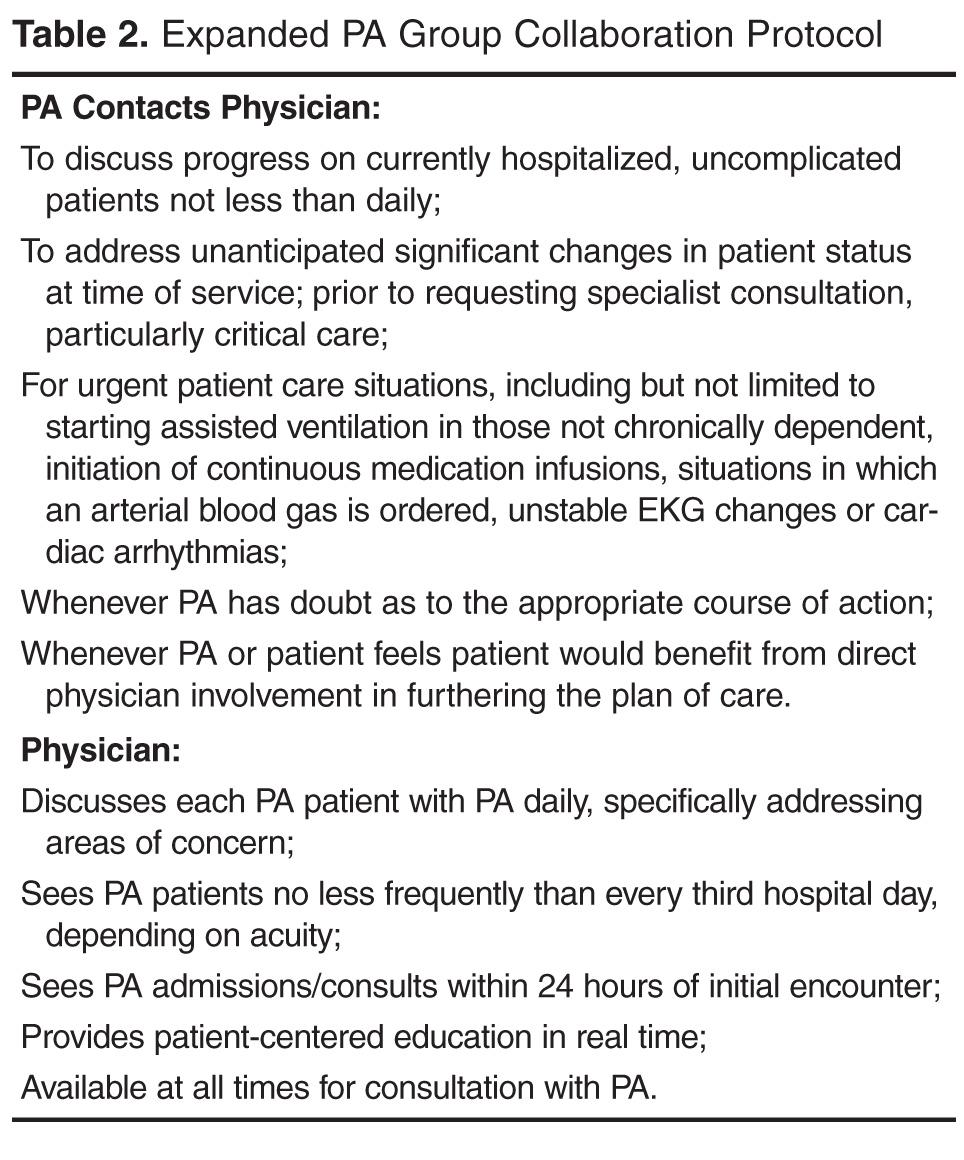
Physician-PA Collaboration
Patients
Patients discharged between 1 January 2012 and 30 June 2013 by the hospitalist groups were identified by searching AAMC’s Crimson Continuuum of Care (The Advisory Board, Washington, DC), a software analytic tool that is integrated with coded clinical data. Adult patient hospitalizations determined by Crimson to have a medical (non-surgical, non-obstetrical) APR-DRG code as the final principal diagnosis were included. Critically ill patients or those appropriate for “step-down unit” care were cared for by the in-house critical care staff; upon transfer out of critical or step-down care, patients were referred back to the admitting hospitalist team. A diagnosis (and its associated hospitalizations) was excluded for referral bias if the diagnosis was the principal diagnosis for at least 1% of a group’s discharges and the percentage of patients with that diagnosis was at least two times greater in one group than the other. Hospitalizations with a diagnosis of “ungroupable” (APR-DRG 956) were also excluded.
Measurements
Demographic, insurance status, cost of care, length of stay (LOS), APR-DRG (All Patient Refined Diagnosis-Related Group) severity of illness (SOI) and risk of mortality (ROM), consultant utilization, 30-day all-cause readmission (“readmission rate”), and mortality information was obtained from administrative data and exported into a single database for statistical analysis. Readmissions, inpatient mortality, and cost of care were the primary outcomes; consultant use and length of stay were secondary outcomes. A hospitalization was considered a readmission if the patient returned to inpatient status at AAMC for any reason within 30 days of a previous inpatient discharge. Inpatient mortality was defined as patient death during hospitalization. The cost of care was measured using the case charges associated with each encounter. Charge capture data from both groups was analyzed to classify visits as “physician-only,” “physician co-visit,” and “PA-only” visits. A co-visit consists of the physician visiting the patient after the PA has already done so on the same day, taking their own history and performing their own physical exam, and writing a brief progress note. These data were compared against the exported administrative data to find matching encounters and associated visits, with only matching visits included in the analysis. If a duplicate charge was entered on the same day for a patient, any conflict was resolved in favor of the physician visit. A total of 49,883 and 28,663 matching charges were identified for the conventional and expanded PA groups.
Statistical Methods
Odds of inpatient mortality were calculated using logistic regression and adjusted for age, insurance status, APR-DRG ROM, and LOS. Odds of readmission were calculated using logistic regression and adjusted for age, LOS, insurance and APR-DRG SOI. Cost of care (effect size) was examined using multiple linear regression and adjusted for age, APR-DRG SOI, insurance status and LOS. This model was fit using the logarithmic transformations of cost of care and LOS to correct deviation from normality. Robust regression using MM estimation was used to estimate group effects due to the existence of outliers and high leverage points. Length of stay (effect size) was assessed using the log-transformed variable and adjusted for APR-DRG SOI, age, insurance status and consultant use. Finally, category logistic regression models were fit to estimate the odds of consultant use in the study groups and adjusted for age, LOS, insurance status and APR-DRG SOI.
Results
Records review identified 17,294 adult patient hospitalizations determined by Crimson to have a medical (non-surgical, non-obstetrical) APR-DRG code as the final principal diagnosis. We excluded 15 expanded PA and 11 conventional hospitalizations that fell under APR-DRG code 956 “ungroupable.” Exclusion for referral bias resulted in the removal of 304 hospitalizations, 207 (3.03%) from the expanded PA group and 97 (0.92%) from the conventional group. These excluded hospitalizations came from 2 APR-DRG codes, urinary stones (code 465) and “other kidney and urinary tract diagnoses” (code 468). This left 6612 hospitalizations in the expanded PA group and 10,352 in the conventional group.
Charge capture data for both groups was used to determine the proportion of encounters rendered by each provider type or combination. In the expanded PA group, 35.73% of visits (10,241 of 28,663) were conducted by a PA, and 64.27% were conducted by a physician or by a PA with a billable physician “co-visit.” In the conventional group, 5.89% of visits (2938 of 49,883) were conducted by a PA, and 94.11% were conducted by a physician only or by a PA with a billable physician “co-visit”.
Readmissions
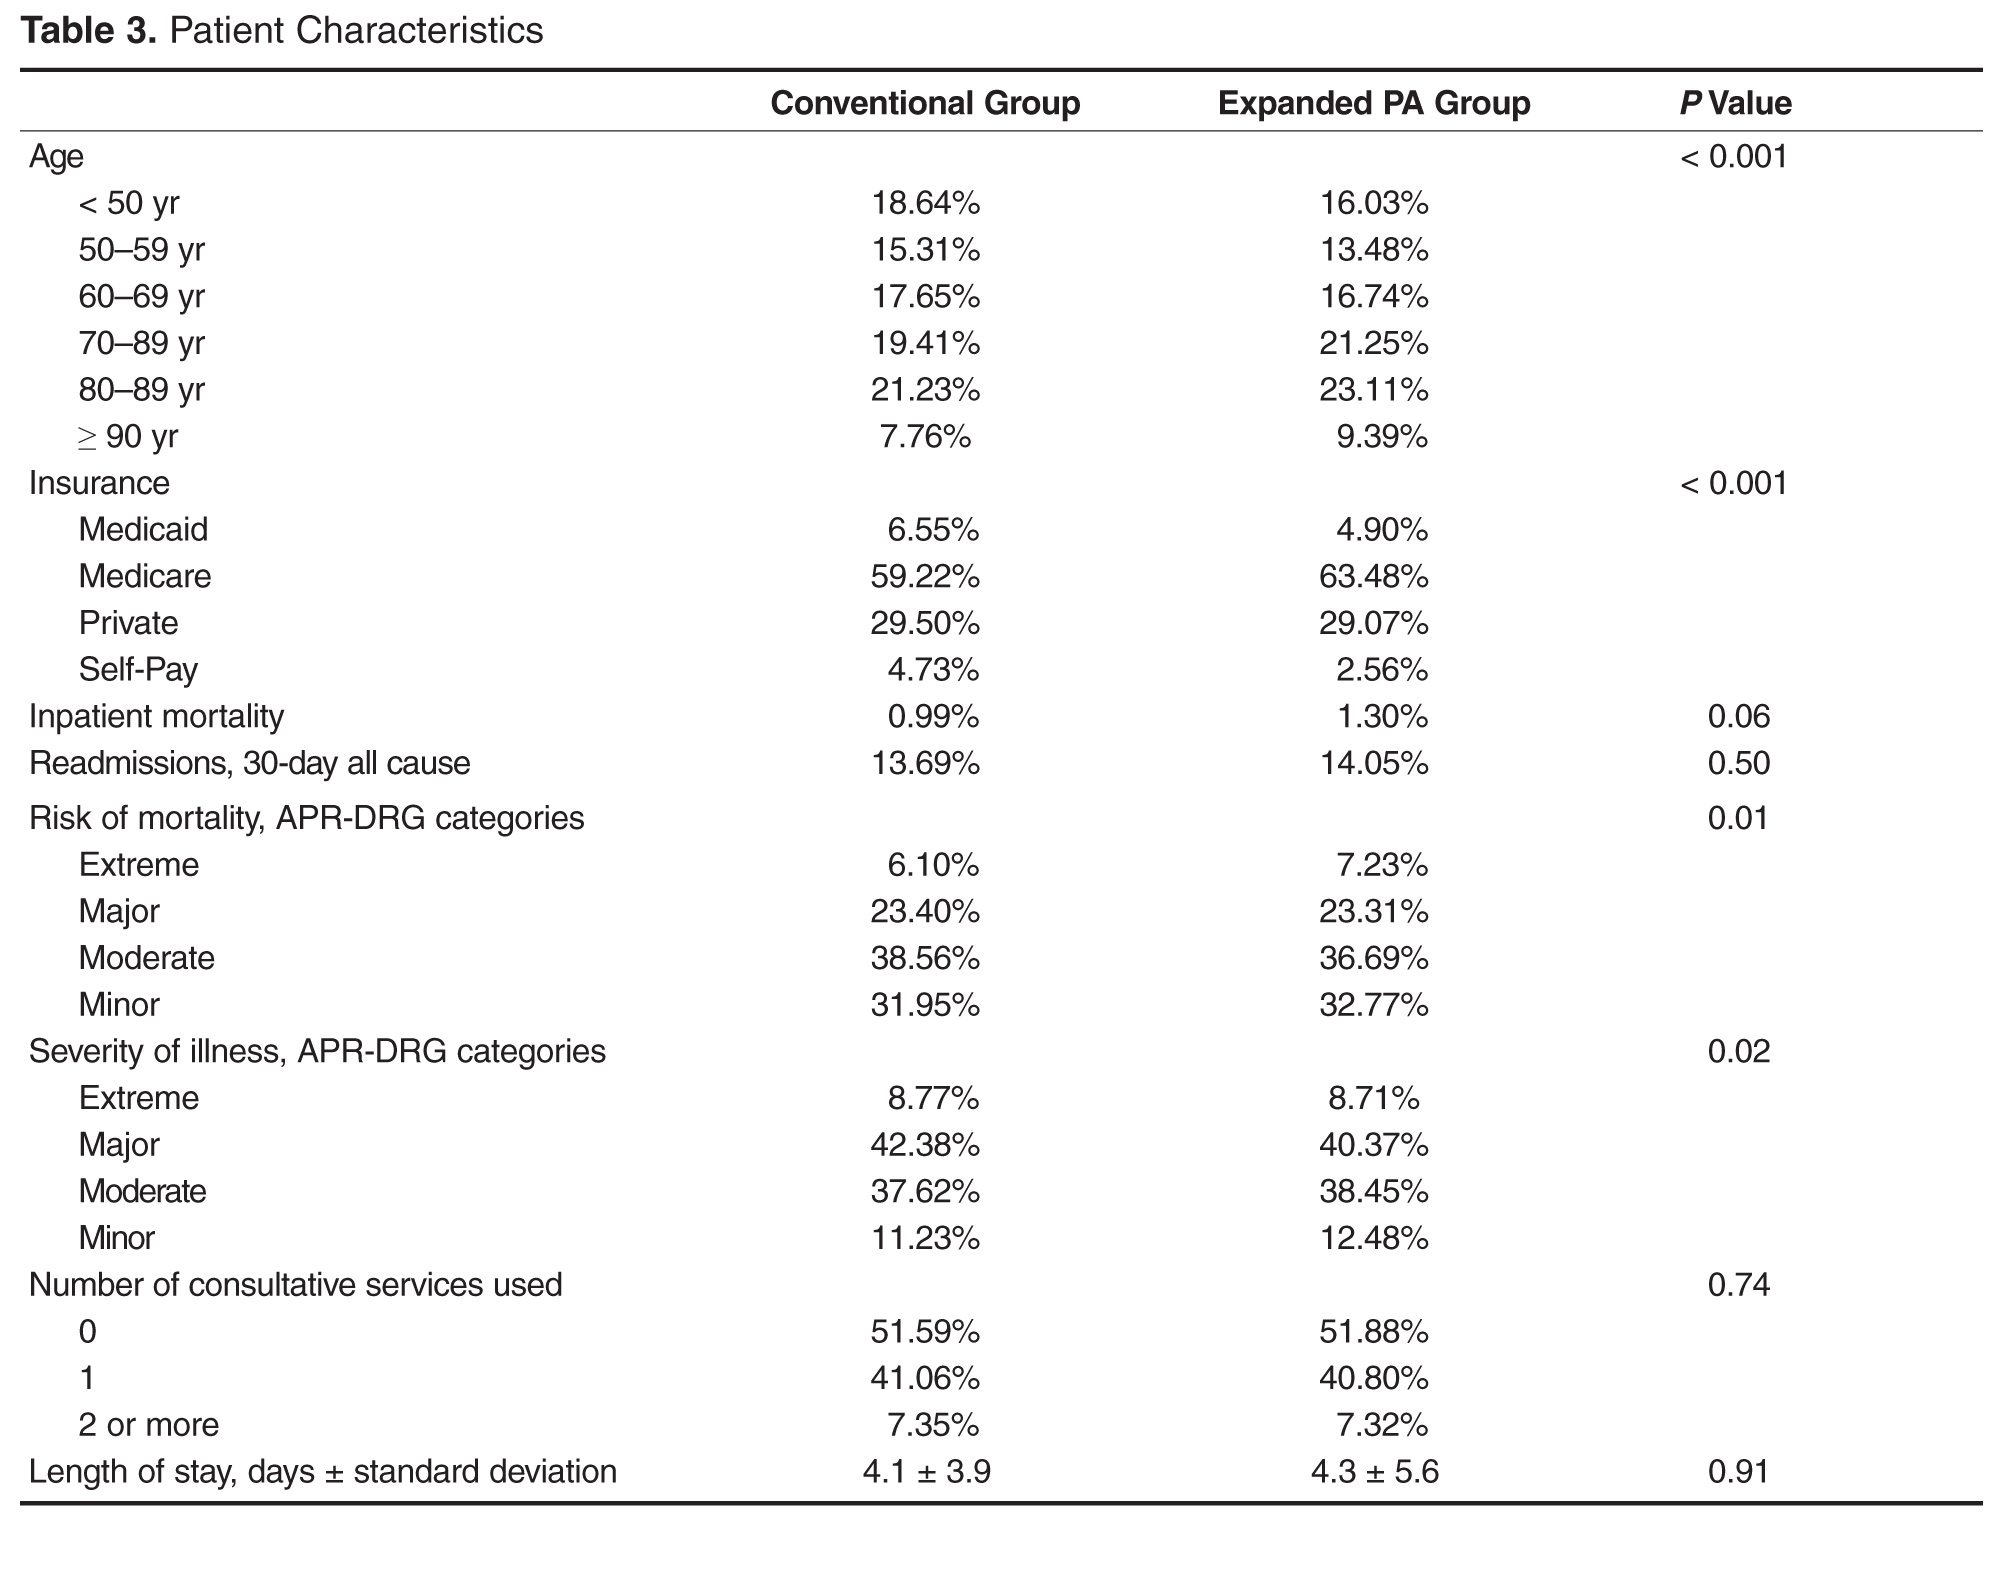
Overall, 929 of 6612 (14.05%) and 1417 of 10,352 (13.69%) patients were readmitted after being discharged by the expanded PA and conventional groups, respectively. After multivariate analysis, there was no statistically significant difference in odds of readmission between the groups (OR for conventional group, 0.95 [95% CI, 0.87–1.04]; P = 0.27).
Inpatient Mortality
Unadjusted inpatient mortality for the expanded PA group was 1.30% and 0.99% for the conventional group. After multivariate analysis, there was no statistically significant difference in odds of in-hospital mortality between the groups (OR for conventional group, 0.89 [95% CI, 0.66–1.19]; P = 0.42).
Patient Charges
The unadjusted mean patient charge in the expanded PA group was $7822 ± $7755 and in the conventional group mean patient charge was $8307 ± 10,034. Multivariate analysis found significantly lower adjusted patient charges in the expanded PA group relative to the conventional group (3.52% lower in the expanded PA group [95% CI, 2.66%–4.39%, P < 0.001). When comparing a “standard” patient who was between 80–89 and had Medicare insurance and an SOI of “major,” the cost of care was $2644 in the expanded PA group vs $2724 in the conventional group.
Length of Stay
Unadjusted mean length of stay was 4.1 ± 3.9 days and 4.3 ± 5.6 days for the expanded PA and conventional groups, respectively. After multivariate analysis, when comparing the statistical model “standard” patient, there was no significant difference in the length of stay between the 2 groups (effect size, 0.99 days shorter LOS in the expanded PA group [95% CI, 0.97–1.01 days]; P = 0.34)
Consultant Use
Utilization of consultants was also assessed. The expanded PA group used a mean of 0.55 consultants per case, and the conventional group used 0.56. After multivariate adjustment, there was no significant difference in consulting service use between groups (OR 1.00 [95% CI, 0.94–1.07]; P = 0.90).
Discussion
Maximizing value and minimizing health care costs is a national priority. To our knowledge, this is the first study to compare hospitalist PAs in a community, non-teaching practice directly and contemporaneously to peer PAs and attending physicians and examine the impact on outcomes. In our study, a much larger proportion of patient visits were conducted primarily by PAs without a same-day physician visit in the expanded PA group (35.73%, vs 5.89% in the conventional group). There was no statistically significant difference in inpatient mortality, length of stay or readmissions. In addition, costs of care measured as hospital charges to patients were lower in the expanded PA group. Consultants were not used disproportionately by the expanded PA group in order to achieve these results. Our results are consistent with studies that have compared PAs and NPs at academic centers to traditional housestaff teams and which show that services staffed with PAs or NPs that provide direct care to medical inpatients are non-inferior [4–10].
This study’s expanded PA group’s PAs rounded on 14 patients per day, close to the “magic 15” that is considered by many a good compromise for hospitalist physicians between productivity and quality [11,12]. This is substantially more than the 6 to 10 patients PAs have been responsible for in previously reported studies [3,4,6]. As the median salary for a PA hospitalist is $102,960 compared with the median internal medicine physician hospitalist salary of $253,977 [2], using hospitalist PAs in a collaboration model as described herein could result in significant savings for supporting institutions without sacrificing quality.
We recognize several limitations to this study. First, the data were obtained retrospectively from a single center and patient assignment between groups was nonrandomized. The significant differences in the baseline characteristics of patients between the study groups, however, were adjusted for in multivariate analysis, and potential referral bias was addressed through our exclusion criteria. Second, our comparison relied on coding rather than clinical data for diagnosis grouping. However, administrative data is commonly used to determine the primary diagnosis for study patients and the standard for reimbursement. Third, we recognize that there may have been unmeasured confounders that may have affected the outcomes. However, the same resources, including consultants and procedure services, were readily available to both groups and there was no significant difference in consultation rates. Fourth, “cost of care” was measured as overall charges to patients, not cost to the hospital. However, given that all the encounters occurred at the same hospital in the same time frame, the difference should be proportional and equal between groups. Finally, our readmission rates did not account for patients readmitted to other institutions. However, there should not have been a differential effect between the 2 study groups, given the shared patient catchment area and our exclusion for referral bias.
It should also be noted that the expanded PA group used a structured collaboration framework and incorporated a structured education program for its PAs. These components are integral to the expanded PA model, and our results may not be generalizable outside of a similar framework. The expanded PA group’s PAs were carefully selected at the time of hire, specifically educated, and supported through ongoing collaboration to provide efficient and appropriate care at the “top of their licenses”. Not all medical groups will be able to provide this level of support and education, and not all hospitalist PAs will want to and/or be able to reach this level of proficiency. However, successful implementation is entirely achievable for groups that invest the effort. The MDICS education process included 80 hours of didactic sessions spread over several months and is based on the Society of Hospital Medicine Core Competencies [13] as well as 6 months of supervised bedside education with escalating clinical responsibilities under the tutelage of an experienced physician or PA. Year-long academic PA fellowships have also been developed for purposes of similar training at several institutions [14].
Conclusion
Our results show that expanded use of well-educated PAs functioning within a formal collaboration arrangement with physicians provides similar clinical quality to a conventional PA staffing model with no excess patient care costs. The model also allows substantial salary savings to supporting institutions, which is important to hospital and policy stakeholders given the implications for hospitalist group staffing, increasing value, and allocation of precious time and financial resources.
Acknowledgements: The authors wish to thank Kevin Funk, MBA, of MDICS, Clarence Richardson, MBA, of GeBBs Software International, and Heather Channing, Kayla King, and Laura Knox of Anne Arundel Healthcare Enterprise, who provided invaluable help with the data aggregation used for this study.
Corresponding author: Timothy M. Capstack, MD, 7250 Parkway Dr, Suite 500, Hanover, MD 21076, tcapstack@mdics.com.
Financial disclosures: Dr. Capstack has ownership interest in Physicians Inpatient Care Specialists (MDICS). Ms. Segujja received compensation from MDICS for statistical analysis.
1. Michtalik HJ, Pronovost PJ, Marsteller JA, et al. Developing a model for attending physician workload and outcomes. JAMA Intern Med 2013;173:1026–8.
2. Society of Hospital Medicine. State of hospital medicine report. Philadelphia: Society of Hospital Medicine; 2014.
3. Kartha A, Restuccia J, Burgess J, et al. Nurse practitioner and physician assistant scope of practice in 118 acute care hospitals. J Hosp Med 2014;9:615–20.
4. Dhuper S, Choksi S. Replacing an academic internal medicine residency program with a physician assistant--hospitalist model: a comparative analysis study. Am J Med Qual 2008;24:132–9.
5. Morris D, Reilly P, Rohrbach J, et al. The influence of unit-based nurse practitioners on hospital outcomes and readmission rates for patients with trauma. J Trauma Acute Care Surg 2012;73:474–8.
6. Roy C, Liang C, Lund M, et al. Implementation of a physician assistant/hospitalist service in an academic medical center: impact on efficiency and patient outcomes. J Hosp Med 2008;3:361–8.
7. Singh S, Fletcher K, Schapira M, et al. A comparison of outcomes of general medical inpatient care provided by a hospitalist-physician assistant model vs a traditional resident-based model. J Hosp Med 2011;6:122–30.
8. Hoffman L, Tasota F, Zullo T, et al. Outcomes of care managed by an acute care nurse practitioner/attending physician team in an subacute medical intensive care unit. Am J Crit Care 2005;14:121–30.
9. Kapu A, Kleinpell R, Pilon B. Quality and financial impact of adding nurse practitioners to inpatient care teams. J Nurs Adm 2014;44:87–96.
10. Cowan M, Shapiro M, Hays R, et al. The effect of a multidisciplinary hospitalist/physician and advanced practice nurse collaboration on hospital costs. J Nurs Adm 2006;36:79–85.
11. Michtalik HJ, Yeh HC, Pronovost PJ, Brotman DJ. Impact of attending physician workload on patient care: A survey of hospitalists. JAMA Intern Med 2013;173:375–7.
12. Elliott D, Young R, Brice J, et al. Effect of hospitalist workload on the quality and efficiency of care. JAMA Internal Med 2014;174:786–93.
13. McKean S, Budnitz T, Dressler D, et al. How to use the core competencies in hospital medicine: a framework for curriculum development. J Hosp Med 2006; 1 Suppl 1:57–67.
14. Will K, Budavari A, Wilkens J, et al. A hospitalist postgraduate training program for physician assistants. J Hosp Med 2010;5:94–8.
From Physicians Inpatient Care Specialists (MDICS), Hanover, MD (Dr. Capstack, Ms. Vollono), Versant Statistical Solutions, Raleigh, NC (Ms. Segujja), Anne Arundel Medical Center, Annapolis, MD (Dr. Moser [at the time of the study], Dr. Meisenberg), and Johns Hopkins Hospital, Baltimore, MD (Dr. Michtalik).
Abstract
- Objective: To determine whether a higher than conventional physician assistant (PA)–to-physician hospitalist staffing ratio can achieve similar clinical outcomes for inpatients at a community hospital.
- Methods: Retrospective cohort study comparing 2 hospitalist groups at a 384-bed community hospital, one with a high PA-to-physician ratio model (“expanded PA”), with 3 physicians/3 PAs and the PAs rounding on 14 patients a day (35.73% of all visits), and the other with a low PA-to-physician ratio model (“conventional”), with 9 physicians/2 PAs and the PAs rounding on 9 patients a day (5.89% of all visits). For 16,964 adult patients discharged by the hospitalist groups with a medical principal APR-DRG code between January 2012 and June 2013, in-hospital mortality, cost of care, readmissions, length of stay (LOS) and consultant use were analyzed using logistic regression and adjusted for age, insurance status, severity of illness, and risk of mortality.
- Results: No statistically significant differences were found between the 2 groups for in-hospital mortality (odds ratio [OR], 0.89 [95% confidence interval {CI}, 0.66–1.19]; P = 0.42), readmissions (OR, 0.95 [95% CI, 0.87–1.04]; P = 0.27), length of stay (effect size 0.99 days shorter LOS in expanded PA group, 95% CI, 0.97 to 1.01 days; P = 0.34) or consultant use (OR 1.00, 95% CI 0.94–1.07, P = 0.90). Cost of care was less in the expanded PA group (effect size 3.52% less; estimated cost $2644 vs $2724; 95% CI 2.66%–4.39%, P < 0.001).
- Conclusion: An expanded PA hospitalist staffing model at a community hospital provided similar outcomes at a lower cost of care.
Hospitalist program staffing models must optimize efficiency while maintaining clinical outcomes in order to increase value and decrease costs [1]. The cost of hospitalist programs is burdensome, with nearly 94% of groups nationally requiring financial support beyond professional fees [2]. Nationally, for hospitalist groups serving adults, average institutional support is over $156,000 per physician full time equivalent (FTE) (182 twelve-hour clinical shifts per calendar year) [2]. Significant savings could be achieved if less costly physician assistants could be incorporated into clinical teams to provide similar care without sacrificing quality.
Nurse practitioners (NPs) and physician assistants (PAs) have been successfully employed on academic hospitalist services to complement physician staffing [3–10]. They perform admissions, consults, rounding visits and discharges with physician collaboration as permitted by each group’s policies and in accordance with hospital by-laws and state regulations. A median of 0.25 NP and 0.28 PA FTEs per physician FTE are employed by hospitalist groups that incorporate them, though staffing ratios vary widely [2].
Physicians Inpatient Care Specialists (MDICS) devel-oped a staffing model that deploys PAs to see a large proportion of its patients collaboratively with physicians, and with a higher patient census per PA than has been previously reported [2–5]. The group leaders believed that this would yield similar outcomes for patients at a lower cost to the supporting institution than a conventional staffing model which used fewer PAs to render patient care. Prior inpatient studies have demonstrated comparable clinical outcomes when comparing hospitalist PAs and NPs to residents and fellows [4–10], but to our knowledge no data exist directly comparing hospitalist PAs to hospitalist physicians. This study goes beyond prior work by examining the community, non-teaching setting, and directly comparing outcomes from the expanded use of PAs to those of a hospitalist group staffed with a greater proportion of attending physicians at the same hospital during the same time.
Methods
Setting
The study was performed at Anne Arundel Medical Center (AAMC), a 384-bed community hospital in Annapolis, Maryland, that serves a region of over 1 million people. Approximately 26,000 adult patients are discharged annually. During the study, more than 90% of internal medicine service inpatients were cared for by one of 2 hospitalist groups: a hospital-employed group (“conventional” group, Anne Arundel Medical Group) and a contracted hospitalist group (“expanded PA” group, Physicians Inpatient Care Specialists). The conventional group’s providers received a small incentive for Core Measures compliance for patients with stroke, myocardial infarction, congestive heart failure and pneumonia. The expanded PA group received a flat fee for providing hospitalist services and the group’s providers received a small incentive for productivity from their employer. The study was deemed exempt by the AAMC institutional review board.
Staffing Models, Patient Allocation, and Assignment
Admitted patients were designated to be admitted to one group or the other on the basis of standing arrangements with the patients’ primary care providers. Consultative referrals could also be made from subspecialists, who had discretion as to which group they wished to use.
Each morning, following sign-out report from the night team, each team of day providers determined which patients would be seen by which of their providers. Patients still on service from the previous day would be seen by the same provider again whenever possible in order to maintain continuity. Each individual provider had their own patients for the day who they rounded on independently and were responsible for. Physician involvement with patients seen primarily by PAs occurred as described below. Physicians in both groups were expected to take primary rounding responsibility for patients who were more acute or more complex based on morning sign-out report; there was no more formal mandate for patient allocation to particular provider type.
Physician-PA Collaboration
Patients
Patients discharged between 1 January 2012 and 30 June 2013 by the hospitalist groups were identified by searching AAMC’s Crimson Continuuum of Care (The Advisory Board, Washington, DC), a software analytic tool that is integrated with coded clinical data. Adult patient hospitalizations determined by Crimson to have a medical (non-surgical, non-obstetrical) APR-DRG code as the final principal diagnosis were included. Critically ill patients or those appropriate for “step-down unit” care were cared for by the in-house critical care staff; upon transfer out of critical or step-down care, patients were referred back to the admitting hospitalist team. A diagnosis (and its associated hospitalizations) was excluded for referral bias if the diagnosis was the principal diagnosis for at least 1% of a group’s discharges and the percentage of patients with that diagnosis was at least two times greater in one group than the other. Hospitalizations with a diagnosis of “ungroupable” (APR-DRG 956) were also excluded.
Measurements
Demographic, insurance status, cost of care, length of stay (LOS), APR-DRG (All Patient Refined Diagnosis-Related Group) severity of illness (SOI) and risk of mortality (ROM), consultant utilization, 30-day all-cause readmission (“readmission rate”), and mortality information was obtained from administrative data and exported into a single database for statistical analysis. Readmissions, inpatient mortality, and cost of care were the primary outcomes; consultant use and length of stay were secondary outcomes. A hospitalization was considered a readmission if the patient returned to inpatient status at AAMC for any reason within 30 days of a previous inpatient discharge. Inpatient mortality was defined as patient death during hospitalization. The cost of care was measured using the case charges associated with each encounter. Charge capture data from both groups was analyzed to classify visits as “physician-only,” “physician co-visit,” and “PA-only” visits. A co-visit consists of the physician visiting the patient after the PA has already done so on the same day, taking their own history and performing their own physical exam, and writing a brief progress note. These data were compared against the exported administrative data to find matching encounters and associated visits, with only matching visits included in the analysis. If a duplicate charge was entered on the same day for a patient, any conflict was resolved in favor of the physician visit. A total of 49,883 and 28,663 matching charges were identified for the conventional and expanded PA groups.
Statistical Methods
Odds of inpatient mortality were calculated using logistic regression and adjusted for age, insurance status, APR-DRG ROM, and LOS. Odds of readmission were calculated using logistic regression and adjusted for age, LOS, insurance and APR-DRG SOI. Cost of care (effect size) was examined using multiple linear regression and adjusted for age, APR-DRG SOI, insurance status and LOS. This model was fit using the logarithmic transformations of cost of care and LOS to correct deviation from normality. Robust regression using MM estimation was used to estimate group effects due to the existence of outliers and high leverage points. Length of stay (effect size) was assessed using the log-transformed variable and adjusted for APR-DRG SOI, age, insurance status and consultant use. Finally, category logistic regression models were fit to estimate the odds of consultant use in the study groups and adjusted for age, LOS, insurance status and APR-DRG SOI.
Results
Records review identified 17,294 adult patient hospitalizations determined by Crimson to have a medical (non-surgical, non-obstetrical) APR-DRG code as the final principal diagnosis. We excluded 15 expanded PA and 11 conventional hospitalizations that fell under APR-DRG code 956 “ungroupable.” Exclusion for referral bias resulted in the removal of 304 hospitalizations, 207 (3.03%) from the expanded PA group and 97 (0.92%) from the conventional group. These excluded hospitalizations came from 2 APR-DRG codes, urinary stones (code 465) and “other kidney and urinary tract diagnoses” (code 468). This left 6612 hospitalizations in the expanded PA group and 10,352 in the conventional group.
Charge capture data for both groups was used to determine the proportion of encounters rendered by each provider type or combination. In the expanded PA group, 35.73% of visits (10,241 of 28,663) were conducted by a PA, and 64.27% were conducted by a physician or by a PA with a billable physician “co-visit.” In the conventional group, 5.89% of visits (2938 of 49,883) were conducted by a PA, and 94.11% were conducted by a physician only or by a PA with a billable physician “co-visit”.
Readmissions
Overall, 929 of 6612 (14.05%) and 1417 of 10,352 (13.69%) patients were readmitted after being discharged by the expanded PA and conventional groups, respectively. After multivariate analysis, there was no statistically significant difference in odds of readmission between the groups (OR for conventional group, 0.95 [95% CI, 0.87–1.04]; P = 0.27).
Inpatient Mortality
Unadjusted inpatient mortality for the expanded PA group was 1.30% and 0.99% for the conventional group. After multivariate analysis, there was no statistically significant difference in odds of in-hospital mortality between the groups (OR for conventional group, 0.89 [95% CI, 0.66–1.19]; P = 0.42).
Patient Charges
The unadjusted mean patient charge in the expanded PA group was $7822 ± $7755 and in the conventional group mean patient charge was $8307 ± 10,034. Multivariate analysis found significantly lower adjusted patient charges in the expanded PA group relative to the conventional group (3.52% lower in the expanded PA group [95% CI, 2.66%–4.39%, P < 0.001). When comparing a “standard” patient who was between 80–89 and had Medicare insurance and an SOI of “major,” the cost of care was $2644 in the expanded PA group vs $2724 in the conventional group.
Length of Stay
Unadjusted mean length of stay was 4.1 ± 3.9 days and 4.3 ± 5.6 days for the expanded PA and conventional groups, respectively. After multivariate analysis, when comparing the statistical model “standard” patient, there was no significant difference in the length of stay between the 2 groups (effect size, 0.99 days shorter LOS in the expanded PA group [95% CI, 0.97–1.01 days]; P = 0.34)
Consultant Use
Utilization of consultants was also assessed. The expanded PA group used a mean of 0.55 consultants per case, and the conventional group used 0.56. After multivariate adjustment, there was no significant difference in consulting service use between groups (OR 1.00 [95% CI, 0.94–1.07]; P = 0.90).
Discussion
Maximizing value and minimizing health care costs is a national priority. To our knowledge, this is the first study to compare hospitalist PAs in a community, non-teaching practice directly and contemporaneously to peer PAs and attending physicians and examine the impact on outcomes. In our study, a much larger proportion of patient visits were conducted primarily by PAs without a same-day physician visit in the expanded PA group (35.73%, vs 5.89% in the conventional group). There was no statistically significant difference in inpatient mortality, length of stay or readmissions. In addition, costs of care measured as hospital charges to patients were lower in the expanded PA group. Consultants were not used disproportionately by the expanded PA group in order to achieve these results. Our results are consistent with studies that have compared PAs and NPs at academic centers to traditional housestaff teams and which show that services staffed with PAs or NPs that provide direct care to medical inpatients are non-inferior [4–10].
This study’s expanded PA group’s PAs rounded on 14 patients per day, close to the “magic 15” that is considered by many a good compromise for hospitalist physicians between productivity and quality [11,12]. This is substantially more than the 6 to 10 patients PAs have been responsible for in previously reported studies [3,4,6]. As the median salary for a PA hospitalist is $102,960 compared with the median internal medicine physician hospitalist salary of $253,977 [2], using hospitalist PAs in a collaboration model as described herein could result in significant savings for supporting institutions without sacrificing quality.
We recognize several limitations to this study. First, the data were obtained retrospectively from a single center and patient assignment between groups was nonrandomized. The significant differences in the baseline characteristics of patients between the study groups, however, were adjusted for in multivariate analysis, and potential referral bias was addressed through our exclusion criteria. Second, our comparison relied on coding rather than clinical data for diagnosis grouping. However, administrative data is commonly used to determine the primary diagnosis for study patients and the standard for reimbursement. Third, we recognize that there may have been unmeasured confounders that may have affected the outcomes. However, the same resources, including consultants and procedure services, were readily available to both groups and there was no significant difference in consultation rates. Fourth, “cost of care” was measured as overall charges to patients, not cost to the hospital. However, given that all the encounters occurred at the same hospital in the same time frame, the difference should be proportional and equal between groups. Finally, our readmission rates did not account for patients readmitted to other institutions. However, there should not have been a differential effect between the 2 study groups, given the shared patient catchment area and our exclusion for referral bias.
It should also be noted that the expanded PA group used a structured collaboration framework and incorporated a structured education program for its PAs. These components are integral to the expanded PA model, and our results may not be generalizable outside of a similar framework. The expanded PA group’s PAs were carefully selected at the time of hire, specifically educated, and supported through ongoing collaboration to provide efficient and appropriate care at the “top of their licenses”. Not all medical groups will be able to provide this level of support and education, and not all hospitalist PAs will want to and/or be able to reach this level of proficiency. However, successful implementation is entirely achievable for groups that invest the effort. The MDICS education process included 80 hours of didactic sessions spread over several months and is based on the Society of Hospital Medicine Core Competencies [13] as well as 6 months of supervised bedside education with escalating clinical responsibilities under the tutelage of an experienced physician or PA. Year-long academic PA fellowships have also been developed for purposes of similar training at several institutions [14].
Conclusion
Our results show that expanded use of well-educated PAs functioning within a formal collaboration arrangement with physicians provides similar clinical quality to a conventional PA staffing model with no excess patient care costs. The model also allows substantial salary savings to supporting institutions, which is important to hospital and policy stakeholders given the implications for hospitalist group staffing, increasing value, and allocation of precious time and financial resources.
Acknowledgements: The authors wish to thank Kevin Funk, MBA, of MDICS, Clarence Richardson, MBA, of GeBBs Software International, and Heather Channing, Kayla King, and Laura Knox of Anne Arundel Healthcare Enterprise, who provided invaluable help with the data aggregation used for this study.
Corresponding author: Timothy M. Capstack, MD, 7250 Parkway Dr, Suite 500, Hanover, MD 21076, tcapstack@mdics.com.
Financial disclosures: Dr. Capstack has ownership interest in Physicians Inpatient Care Specialists (MDICS). Ms. Segujja received compensation from MDICS for statistical analysis.
1. Michtalik HJ, Pronovost PJ, Marsteller JA, et al. Developing a model for attending physician workload and outcomes. JAMA Intern Med 2013;173:1026–8.
2. Society of Hospital Medicine. State of hospital medicine report. Philadelphia: Society of Hospital Medicine; 2014.
3. Kartha A, Restuccia J, Burgess J, et al. Nurse practitioner and physician assistant scope of practice in 118 acute care hospitals. J Hosp Med 2014;9:615–20.
4. Dhuper S, Choksi S. Replacing an academic internal medicine residency program with a physician assistant--hospitalist model: a comparative analysis study. Am J Med Qual 2008;24:132–9.
5. Morris D, Reilly P, Rohrbach J, et al. The influence of unit-based nurse practitioners on hospital outcomes and readmission rates for patients with trauma. J Trauma Acute Care Surg 2012;73:474–8.
6. Roy C, Liang C, Lund M, et al. Implementation of a physician assistant/hospitalist service in an academic medical center: impact on efficiency and patient outcomes. J Hosp Med 2008;3:361–8.
7. Singh S, Fletcher K, Schapira M, et al. A comparison of outcomes of general medical inpatient care provided by a hospitalist-physician assistant model vs a traditional resident-based model. J Hosp Med 2011;6:122–30.
8. Hoffman L, Tasota F, Zullo T, et al. Outcomes of care managed by an acute care nurse practitioner/attending physician team in an subacute medical intensive care unit. Am J Crit Care 2005;14:121–30.
9. Kapu A, Kleinpell R, Pilon B. Quality and financial impact of adding nurse practitioners to inpatient care teams. J Nurs Adm 2014;44:87–96.
10. Cowan M, Shapiro M, Hays R, et al. The effect of a multidisciplinary hospitalist/physician and advanced practice nurse collaboration on hospital costs. J Nurs Adm 2006;36:79–85.
11. Michtalik HJ, Yeh HC, Pronovost PJ, Brotman DJ. Impact of attending physician workload on patient care: A survey of hospitalists. JAMA Intern Med 2013;173:375–7.
12. Elliott D, Young R, Brice J, et al. Effect of hospitalist workload on the quality and efficiency of care. JAMA Internal Med 2014;174:786–93.
13. McKean S, Budnitz T, Dressler D, et al. How to use the core competencies in hospital medicine: a framework for curriculum development. J Hosp Med 2006; 1 Suppl 1:57–67.
14. Will K, Budavari A, Wilkens J, et al. A hospitalist postgraduate training program for physician assistants. J Hosp Med 2010;5:94–8.