User login
A COVID-19 Clinical Management Committee to Standardize Care in a 2-Hospital System
From the Department of Medicine (Drs. Meisenberg, Muganlinskaya, Sharma, Amjadi, Arnold, Barnes, Clance, Khalil, Miller, Mooradian, O’Connell, Patel, Press, Samaras, Shanmugam, Tavadze, and Thompson), Department of Pharmacy (Drs. Jiang, Jarawan, Sheth, and Trinh), Department of Nursing (Dr. Ohnmacht), and Department of Women and Children’s Services (Dr. Raji), Luminis Health, Annapolis, MD, and Lanham, MD.
Objective: The COVID-19 pandemic has been a challenge for hospital medical staffs worldwide due to high volumes of patients acutely ill with novel syndromes and prevailing uncertainty regarding optimum supportive and therapeutic interventions. Additionally, the response to this crisis was driven by a plethora of nontraditional information sources, such as email chains, websites, non–peer-reviewed preprints, and press releases. Care patterns became idiosyncratic and often incorporated unproven interventions driven by these nontraditional information sources. This report evaluates the efforts of a health system to create and empower a multidisciplinary committee to develop, implement, and monitor evidence-based, standardized protocols for patients with COVID-19.
Methods: This report describes the composition of the committee, its scope, and its important interactions with the health system pharmacy and therapeutics committee, research teams, and other work groups planning other aspects of COVID-19 management. It illustrates how the committee was used to demonstrate for trainees the process and value of critically examining evidence, even in a chaotic environment.
Results: Data show successful interventions in reducing excessive ordering of certain laboratory tests, reduction of nonrecommended therapies, and rapid uptake of evidence-based or guidelines-supported interventions.
Conclusions: A multidisciplinary committee dedicated solely to planning, implementing, and monitoring standard approaches that eventually became evidence-based decision-making led to an improved focus on treatment options and outcomes for COVID-19 patients. Data presented illustrate the attainable success that is both adaptable and suitable for similar emergencies in the future.
Keywords: COVID-19; clinical management; pharmacy and therapeutics; treatment; therapy.
The COVID-19 pandemic has spread to nearly all countries, carrying with it high morbidity, mortality, and severe impacts on both well-developed and less-well-developed health systems. Media reports of chaos within overwhelmed hospitals have been prominent.1,2 As of January 5, 2022, SARS-CoV-2 has infected more than 295 million people globally and directly caused the death of more than 5.4 million,3 though this number is likely an undercount even in countries with well-developed mortality tracking.4
Throughout the COVID-19 pandemic, hospital-based medical teams have been confronted with a flood of severely ill patients with novel syndromes. Initially, there were no standards for therapy or supportive care except for treatments borrowed from similar syndromes. In the setting of high volumes, high acuity, and public dismay, it is unsurprising that the usual deliberative methods for weighing evidence and initiating interventions were often pushed aside in favor of the solace of active intervention.5 In this milieu of limited evidence, there was a lamentable, if understandable, tendency to seek guidance from “nontraditional” sources,6 including email chains from colleagues, hospital websites, non–peer-reviewed manuscripts, advanced publication by medical journals,7 and nonscientific media presentations. In many localities, practitioners responded in idiosyncratic ways. For example, findings of high cytokine levels in COVID-19,8 along with reports of in-vitro antiviral activity with drugs like hydroxychloroquine against both SARS9 and SARS-CoV-2,10 drove laboratory test ordering and therapeutic interventions, respectively, carving shortcuts into the traditional clinical trial–dependent standards. Clinical trial results eventually emerged.11COVID-19 created a clinical dilemma for hospital medical staffs in terms of how to organize, standardize, and rapidly adapt to a flood of new information. In this report, we describe how 1 health system responded to these challenges by forming a COVID-19 Clinical Management Committee (CCMC) and empowering this interdisciplinary team to review evidence, create and adjust order sets, educate practitioners, oversee care, and collaborate across teams addressing other aspects of the COVID-19 response.
Program Overview
Health System Description
Luminis Health is a health system with 2 acute care hospitals that was formed in 2019 just before the start of the pandemic. Anne Arundel Medical Center (hospital A) is a 385-bed teaching hospital in Annapolis, MD. It has more than 23 000 discharges annually. Patients with COVID-19 were cared for by either an internal medicine teaching service or nonteaching hospitalist services on cohorted nursing units. Doctor’s Community Medical Center, in Lanham, MD (hospital B), is a 206-bed acute care hospital with more than 10 350 annual discharges. COVID-19 patients were cared for by hospitalist groups, initially in noncohorted units with transition to cohorted nursing units after a few months. The medical staffs are generally distinct, with different leadership structures, though the Luminis Health Department of Medicine has oversight responsibilities at both hospitals. More than 47 physicians attended COVID-19 patients at hospital A (with medical residents) and 30 individual physicians at hospital B, respectively, including intensivists. The nursing and pharmacy staffs are distinct, but there is a shared oversight Pharmacy and Therapeutics (P&T) Committee.
The 2 hospitals had distinct electronic medical records (EMR) until January 2021, when hospital B adopted the same EMR as hospital A (Epic).
Mission and Formation of CCMC
In order to coordinate the therapeutic approach across the health system, it was important for the CCMC to be designated by the health system P&T committee as an official subcommittee so that decisions on restrictions of medications and/or new or revised order sets could be rapidly initiated across the system without waiting for the subsequent P&T meetings. The full committee retained oversight of the CCMC. Some P&T members were also on the CCMC.
The committee reviewed new reports in medical journals and prepublication servers and consulted recommendations of professional societies, such as the National Institutes of Health (NIH) COVID-19 guidelines, Infectious Diseases Society of America, Society of Critical Care Medicine, and US Food and Drug Administration (FDA) Emergency Use Authorizations (EUA), among other sources.
Composition of the CCMC
Physician leaders from both hospitals in the following specialties were solicited for participation: critical care, epidemiology, hospital medicine (internal medicine), emergency medicine, infectious diseases, nephrology, women and children’s services, and medical informatics. Specialists in other areas, such as hematology, were invited for topic-specific discussions. Hospital pharmacists with different specialties and nursing leadership were essential contributors. The committee members were expected to use various communication channels to inform frontline clinicians of new care standards and the existence of new order sets, which were embedded in the EMR.
Clinical Research
An important connection for the CCMC was with theCOVID-19 clinical research team. Three members of the research team were also members of the CCMC. All new study proposals for therapeutics were discussed with the CCMC as they were being considered by the research team. In this way, feedback on the feasibility and acceptance of new study opportunities could be discussed with the CCMC. Occasionally, CCMC decisions impacted clinical research accrual strategies. For example, new data from randomized trials about tocilizumab1,2 demonstrated benefits in some subsets of patients and resulted in a recommendation for use by the NIH guideline committee in these populations.1 The CCMC quickly adopted this recommendation, which required a reprioritization of clinical research enrollment for studies testing other immune-modulating agents. This important dialogue was mediated within the CCMC.
Guideline Distribution, Reinforcement, and Platform for Feedback
New guidelines were disseminated to clinicians via daily brief patient huddles held on COVID units, with participation by nursing and pharmacy, and by weekly meetings with hospitalist leaders and frontline hospital physicians. Order sets and guidelines were maintained on the intranet. Adherence was reinforced by unit-based and central pharmacists. Order sets, including admission order sets, could be created only by designated informatics personnel, thus enforcing standardization. Feedback on the utility of the order sets was obtained during the weekly meetings or huddles, as described above. To ensure a sense of transparency, physicians who had interest in commenting on a particular therapy, or who wished to discuss a particular manuscript, news article, or website, were invited to attend CCMC meetings.
Scope of CCMC
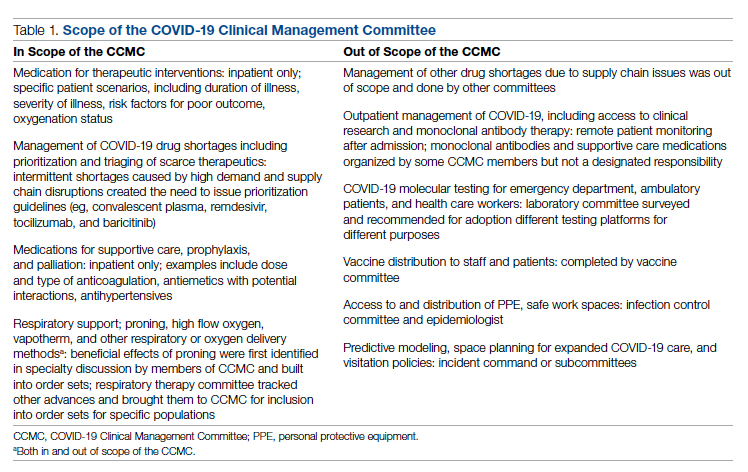
In order to be effective and timely, we limited the scope of our work to the report to the inpatient therapeutic environment, allowing other committees to work on other aspects of the pandemic response. In addition to issuing guidance and creating order sets to direct clinical practice, the CCMC also monitored COVID-19 therapeutic shortages15,16 and advised on prioritization of such treatments as convalescent plasma, remdesivir (prioritization and duration of therapy, 5 vs 10 days), baricitinib, and tocilizumab, depending upon the location of the patient (critical care or not). The CCMC was not involved in the management of non–COVID-19 shortages brought about by supply chain deficiencies.
Table 1 shows some aspects of the health system pandemic-response planning and the committee workforce that undertook that work. Though many items were out of scope for the CCMC, members of the CCMC did participate in the planning work of these other committees and therefore stayed connected to this complementary work.
A Teaching Opportunity About Making Thoughtful Choices
Another important feature of the CCMC was the contributions of residents from both pharmacy and internal medicine. The purpose and operations of the committee were recognized as an opportunity to involve learners in a curriculum based on Kern’s 6-step approach.17 Though the problem identification and general needs assessment were easily defined, the targeted needs assessment, extracted from individual and group interviews with learners and the committee members, pointed at the need to learn how to assess and analyze a rapidly growing body of literature on several relevant clinical aspects of SARS-CoV-2 and COVID-19. To achieve goals and objectives, residents were assigned to present current literature on a particular intervention during a committee meeting, specifically commenting on the merit or deficiencies of the study design, the strength of the data, and applicability to the local context with a recommendation. Prior to the presentations, the residents worked with faculty to identify the best studies or systematic analyses with potential to alter current practices. We thus used the CCMC process as a teaching tool about evidence-based medicine and the dilemma of clinical equipoise. This was imperative, since trainees thrust into the COVID-19 response have often keenly observed a movement away from deliberative decision-making.18 Indeed, including residents in the process of deliberative responses to COVID-19 addresses a recent call to adjust medical education during COVID-19 to “adapt curriculum to current issues in real time.”19
Interventions and Therapies Considered
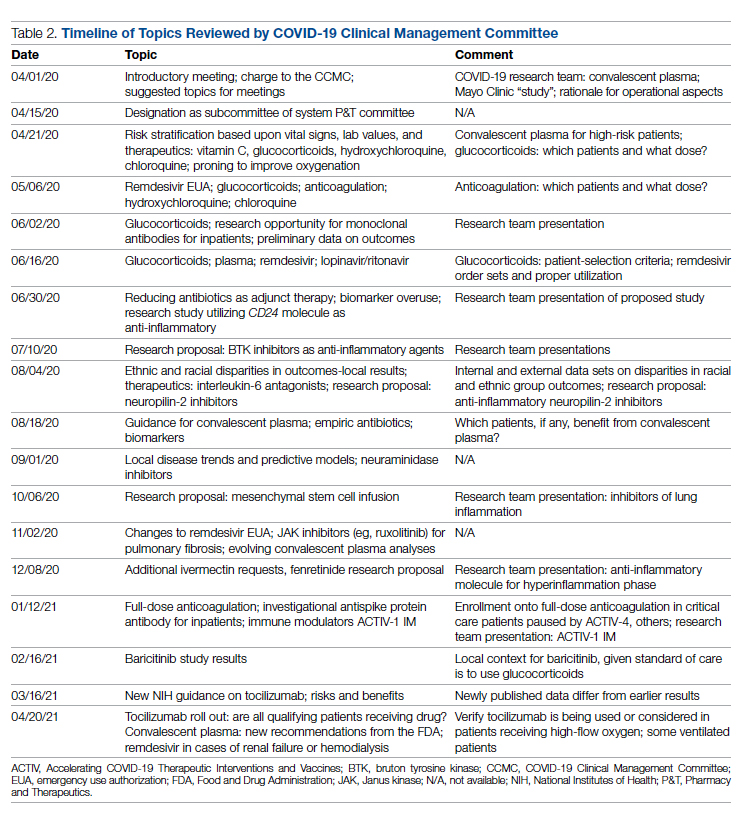
Table 2 shows the topics reviewed by the CCMC. By the time of the first meeting, nonstandardization of care was already a source of concern for clinicians. Dialogue often continued outside of the formal meetings. Many topics were considered more than once as new guidance developed, changes to EUAs occurred, and new data or new publicity arose.
Methods
The Human Protections Administrator determined that this work constituted “quality improvement, and not research” and was therefore exempt from institutional review board review.
Quantitative Analysis
All admitted patients from March 10, 2020, through April 20, 2021, were considered in the quantitative aspects of this report except as noted. Patients diagnosed with COVID-19 were identified by searching our internal data base using diagnostic codes. Patient admissions with the following diagnostic codes were included (prior to April 1, 2020): J12.89, J20.8, J40, J22, J98.8, J80, each with the additional code of B97.29. After April 1, 2020, the guideline for coding COVID-19 was U07.1.
Descriptive statistics were used to measure utilization rates of certain medications and laboratory tests of interest over time. These data were adjusted for number of unique admissions. In a few cases, not all data elements were available from both hospitals due to differences in the EMR.
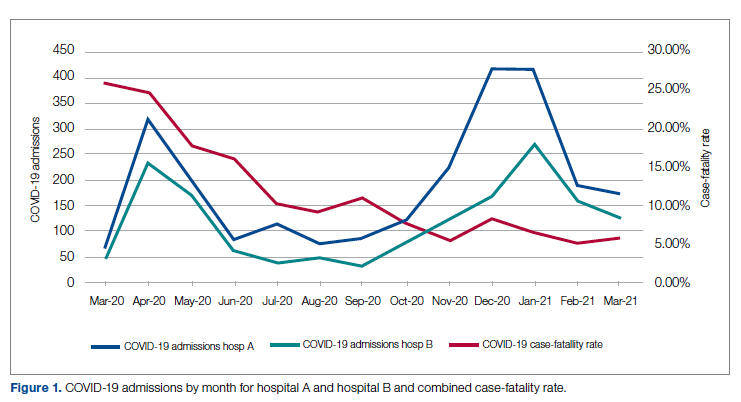
Case fatality rate was calculated based upon whether the patient died or was admitted to inpatient hospice as a result of COVID-19. Four patients transferred out of hospital A and 18 transferred out of hospital B were censored from case-fatality-rate determination.
Figure 1 shows the number of admissions for each acute care hospital in the health system and the combined COVID-19 case-fatality rate over time.
Results
A total of 5955 consecutive COVID-19 patients admitted from March 10, 2020, through April 30, 2021, were analyzed. Patients with International Statistical Classification of Diseases, Tenth Revision codes J12.89. J20.8, J40, J22, J98.8, J80, each with the additional code of B97.29 (or the code UO7.1 after April 1, 2020), were included in the analysis. The median age of admitted patients was 65 years (range 19-91 years). Using the NIH classification system for severity,20 the distribution of severity during the first 24 hours after the time of hospital admission was as follows: asymptomatic/presymptomatic, 0.5%; mild illness, 5.3%; moderate illness, 37.1%; severe illness, 55.5%; and critical illness, 1.1%.
The impact of the CCMC can be estimated by looking at care patterns over time. Since the work of the CCMC was aimed at influencing and standardizing physician ordering and therapy choices through order set creation and other forms of oversight, we measured the use of the CCMC-approved order sets at both hospitals and the use of certain laboratory tests and therapies that the CCMC sought either to limit or increase. These counts were adjusted for number of unique COVID-19 admissions. But the limits of the case collection tool meant it also collected cases that were not eligible for some of the interventions. For example, COVID-19 admissions without hypoxemia would not have been eligible for remdesivir or glucocorticoids. When admitted, some patients were already on steroids for other medical indications and did not receive the prescribed dexamethasone dose that we measured in pharmacy databases. Similarly, a few patients were hospitalized for indications unrelated to COVID-19, such as surgery or childbirth, and were found to be SARS-CoV-2-positive on routine screening.
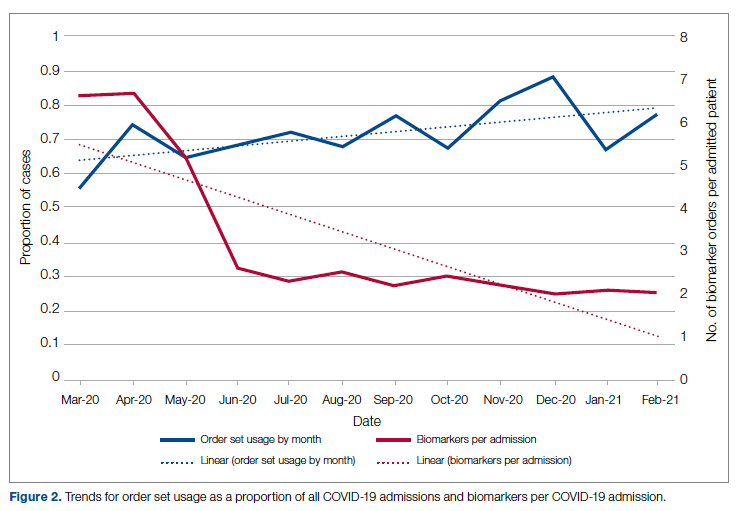
Figure 2 shows the utilization of CCMC-approved standard COVID-19 admission order sets as a proportion of all COVID-19 admissions over time. The trend reveals a modest increase in usage (R2 = 0.34), but these data do not reflect the progressive build of content into order sets over time. One of the goals of the order sets was to standardize and reduce the ordering of certain biomarkers: C-reactive protein, serum ferritin, and D-dimer, which were ordered frequently in many early patients. Orders for these 3 laboratory tests are combined and expressed as an average number of labs per COVID-19 admission in Figure 2. A downward trend, with an R2 value of 0.65, is suggestive of impact from the order sets, though other explanations are possible.
Medication guidance was also a goal of the CCMC, simultaneously discouraging poorly supported interventions and driving uptake of the recommended evidence-based interventions in appropriate patients. Figure 3 shows the utilization pattern for some drugs of interest over the course of the pandemic, specifically the proportion of patients receiving at least 1 dose of medication among all COVID-19 admissions by month. (Data for hospital B was excluded from this analysis because it did not include all admitted patients.)
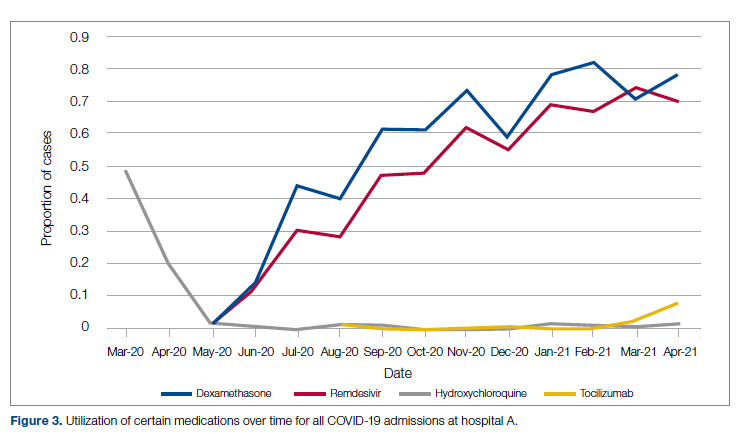
Hydroxychloroquine, which enjoyed a wave of popularity early on during the pandemic, was a target of successful order stewardship through the CCMC. Use of hydroxychloroquine as a COVID-19 therapeutic option after the first 2 months of the pandemic stopped, and subsequent use at low levels likely represented continuation therapy for outpatients who took hydroxychloroquine for rheumatologic indications.
Dexamethasone, as used in the RECOVERY trial,21 had a swift uptake among physicians after it was incorporated into order sets and its use encouraged. Similarly, uptake was immediate for remdesivir when, in May 2020, preliminary reports showed at least some benefits, confirmed by later analysis,22 and it received an FDA EUA.
Our data also show successful stewardship of the interleukin-6 antagonist toclilizumab, which was discouraged early on by the CCMC due to lack of data or negative results. But in March 2021, with new studies releasing data12,13 and new recommendations14 for its use in some subsets of patients with COVID-19, this drug was encouraged in appropriate subsets. A new order set with qualifying indications was prepared by the CCMC and new educational efforts made to encourage its use in appropriate patients.
Ivermectin was nonformulary at the start of the pandemic. This drug enjoyed much publicity from media sources and was promoted by certain physicians and on websites,23 based on in-vitro activity against coronaviruses. Eventually, the World Health Organization24 and the FDA25 found it necessary to issue advisory statements to the public against its use outside of clinical trials. The CCMC had requests from physicians to incorporate ivermectin but declined to add it to the formulary and recommended not approving nonformulary requests due to lack of data. As a result, ivermectin was not used at either hospital.
Discussion
COVID-19 represents many challenges to health systems all over the world. For Luminis Health, the high volume of acutely ill patients with novel syndromes was a particular challenge for the hospital-based care teams. A flood of information from preprints, press releases, preliminary reports, and many other nontraditional sources made deliberative management decisions difficult for individual physicians. Much commentary has appeared around the phenomenon but with less practical advice about how to make day-to-day care decisions at a time of scientific uncertainty and intense pressure to intervene.26,27 The CCMC was designed to overcome the information management dilemma. The need to coordinate, standardize, and oversee care was necessary given the large number of physicians who cared for COVID-19 patients on inpatient services.
It should be noted that creating order sets and issuing guidance is necessary, but not sufficient, to achieve our goals of being updated and consistent. This is especially true with large cadres of health care workers attending COVID-19 patients. Guidelines and recommendations were reinforced by unit-based oversight and stewardship from pharmacy and other leaders who constituted the CCMC.
The reduction in COVID-19 mortality over time experienced in this health care system was not unique and cannot necessarily be attributed to standardization of care. Similar improvements in mortality have been reported at many US hospitals in aggregate.28 Many other factors, including changes in patient characteristics, may be responsible for reduction in mortality over time.
Throughout this report we have relied upon an implicit assumption that standardization of medical therapeutics is desirable and leads to better outcomes as compared with allowing unlimited empiricism by individual physicians, either consultants or hospitalists. Our program represents a single health system with 2 acute care hospitals located 25 miles apart and which thus were similarly impacted by the different phases of the pandemic. Generalizability to health systems either smaller or larger, or in different geographical areas, has not been established. Data limitations have already been discussed.
We did not measure user satisfaction with the program either from physicians or nurses. However, the high rate of compliance suggests general agreement with the content and process.
We cannot definitively ascribe reduction in utilization of some nonrecommended treatments and increased utilization of the recommended therapies to the work of the CCMC. Individual physicians may have made these adjustments on their own or under the influence of other sources.
Finally, it should be noted that the mission to rapidly respond to data from well-conducted trials might be thwarted by too rigid a process or a committee’s lack of a sense of urgency. Organizing a committee and then empowering it to act is no guarantee of success; commitment to the mission is.
Conclusion
COVID-19 represented a challenge to medical staffs everywhere, inundating them with high volumes of acutely ill patients presenting with unfamiliar syndromes. Initial responses were characterized by idiosyncratic management approaches based on nontraditional sources of opinion and influences.
This report describes how a complex medical system brought order and standardization through a deliberative, but urgent, multidisciplinary committee with responsibility for planning, implementing, and monitoring standard approaches that eventually became evidence based. The composition of the committee and its scope of influence, limited to inpatient management, were important elements of success, allowing for better focus on the many treatment decisions. The important connection between the management committee and the system P&T committee, the clinical research effort, and teaching programs in both medicine and pharmacy are offered as exemplars of coordination. The data presented show success in achieving standardized, guideline-directed care. The approach is adoptable and suitable for similar emergencies in the future.
Acknowledgments: The authors thank Gary Scabis, Kip Waite, John Moxley, Angela Clubb, and David Woodley for their assistance in gathering data. We express appreciation and admiration for all our colleagues at the bedside.
Corresponding author: Barry R. Meisenberg, MD, Department of Medicine, Luminis Health, 2001 Medical Pkwy, Annapolis, MD 21401; meisenberg@AAHS.org.
Financial disclosures: None.
1. Gettleman J, Raj S, Kumar H. India’s health system cracks under the strain as coronavirus cases surge. The New York Times. April 22, 2021. https://www.nytimes.com/2021/04/21/world/asia/india-coronavirus-oxygen.html
2. Rappleye H, Lehren AW, Strickler L, Fitzpatrick S. ‘This system is doomed’: doctors, nurses sound off in NBC News coronavirus survey. NBC News. March 20, 2020. https://www.nbcnews.com/news/us-news/system-doomed-doctors-nurses-sound-nbc-news-coronavirus-survey-n1164841
3. Johns Hopkins Coronavirus Resource Center. Accessed January 5, 2022. https://coronavirus.jhu.edu/map.html
4. Fineberg HV. The toll of COVID-19. JAMA. 2020;324(15):1502-1503. doi:10.1001/jama.2020.20019
5. Meisenberg BR. Medical staffs response to COVID-19 ‘data’: have we misplaced our skeptic’s eye? Am J Med. 2021;134(2):151-152. doi:10.1016/j.amjmed.2020.09.013
6. McMahon JH, Lydeamore MH, Stewardson AJ. Bringing evidence from press release to the clinic in the era of COVID-19. J Antimicrob Chemother. 2021;76(3):547-549. doi:10.1093/jac/dkaa506
7. Rubin EJ, Baden LR, Morrissey S, Campion EW. Medical journals and the 2019-nCoV outbreak. N Engl J Med. 2020;382(9):866. doi:10.1056/NEJMe2001329
8. Liu F, Li L, Xu M, et al. Prognostic value of interleukin-6, C-reactive protein, and procalcitonin in patients with COVID-19. J Clin Virol. 2020;127:104370. doi:10.1016/j.jcv.2020.104370
9. Vincent MJ, Bergeron E, Benjannet S, et al. Chloroquine is a potent inhibitor of SARS coronavirus infection and spread. Virol J. 2005;2:69. doi:10.1186/1743-422X-2-69
10. Wang M, Cao R, Zhang L, et al. Remdesivir and chloroquine effectively inhibit the recently emerged novel coronavirus (2019-nCoV) in vitro. Cell Res. 2020;30:269-271. doi:10.1038/s41422-020-0282-0
11. RECOVERY Collaborative Group. Effect of hydroxychloroquine in hospitalized patients with Covid-19. N Engl J Med. 2020;383:2030-2040. doi:10.1056/NEJMoa2022926
12. RECOVERY Collaborative Group. Tocilizumab in patients admitted to hospital with COVID-19 (RECOVERY): preliminary results of a randomised, controlled, open-label, platform trial [preprint]. February 11, 2021. doi:10.1101/2021.02.11.21249258 https://www.medrxiv.org/content/10.1101/2021.02.11.21249258v1
13. REMAP-CAP Investigators. Interleukin-6 receptor antagonists in critically ill patients with COVID-19. N Engl J Med. 2021;384(16):1491-1502. doi:10.1056/NEJMoa2100433
14. National Institutes of Health. COVID-19 treatment guidelines: interleukin-6 inhibitors. https://www.covid19treatmentguidelines.nih.gov/immunomodulators/interleukin-6-inhibitors/
15. Deana C, Vetrugno L, Tonizzo A, et al. Drug supply during COVID-19 pandemic: remember not to run with your tank empty. Hosp Pharm. 2021;56(5):405-407. doi:10.1177/0018578720931749
16. Choe J, Crane M, Greene J, et al. The Pandemic and the Supply Chain: Addressing Gaps in Pharmaceutical Production and Distribution. Johns Hopkins University, November 2020. https://www.jhsph.edu/research/affiliated-programs/johns-hopkins-drug-access-and-affordability-initiative/publications/Pandemic_Supply_Chain.pdf
17. Kern DE. Overview: a six-step approach to curriculum development. In: Kern DE, Thornton PA, Hughes MT, eds. Curriculum Development for Medical Education: A Six-Step Approach. 3rd ed. Johns Hopkins University Press; 2016.
18. Rice TW, Janz DR. In defense of evidence-based medicine for the treatment of COVID-19 acute respiratory distress syndrome. Ann Am Thorac Soc. 2020;17(7):787-789. doi:10.1513/AnnalsATS.202004-325IP
19. Lucey CR, Johnston SC. The transformational effects of COVID-19 on medical education. JAMA. 2020;324(11):1033-1034. doi:10.1001/jama.2020.14136
20. National Institutes of Health. COVID-19 treatment guidelines: clinical spectrum of SARS-CoV-2 infection. https://www.covid19treatmentguidelines.nih.gov/overview/clinical-spectrum/
21. RECOVERY Collaborative Group. Dexamethasone in hospitalized patients with Covid-19. N Engl J Med. 2021;384:693-704. doi:10.1056/NEJMoa2021436
22. Beigel JH, Tomashek KM, Dodd LE, et al. Remdesivir for the treatment of Covid-19—final report. N Engl J Med. 2020;383:1813-1826. doi:10.1056/NEJMoa2007764
23. Jiminez D. Ivermectin and Covid-19: how a cheap antiparasitic became political. April 19, 2021. https://www.pharmaceutical-technology.com/features/ivermectin-covid-19-antiparasitic-political/
24. World Health Organization. WHO advises that ivermectin only be used to treat COVID-19 within clinical trials. March 31, 2021. https://www.who.int/news-room/feature-stories/detail/who-advises-that-ivermectin-only-be-used-to-treat-covid-19-within-clinical-trials
25. U.S. Food and Drug Administration. Why you should not use ivermectin to treat or prevent COVID-19. March 5, 2021. https://www.fda.gov/consumers/consumer-updates/why-you-should-not-use-ivermectin-treat-or-prevent-covid-19
26. Seymour CW, McCreary EK, Stegenga J. Sensible medicine-balancing intervention and inaction during the COVID-19 pandemic. JAMA. 2020;324(18):1827-1828. doi:10.1001/jama.2020.20271
27. Flanagin A, Fontanarosa PB, Bauchner H. Preprints involving medical research—do the benefits outweigh the challenges? JAMA. 2020;324(18):1840-1843. doi:10.1001/jama.2020.20674
28. Asch DA, Shells NE, Islam N, et al. Variation in US hospital mortality rates for patients admitted with COVID-19 during the first 6 months of the pandemic. JAMA Intern Med. 2021;181(4):471-478. doi:10.1001/jamainternmed.2020.8193
From the Department of Medicine (Drs. Meisenberg, Muganlinskaya, Sharma, Amjadi, Arnold, Barnes, Clance, Khalil, Miller, Mooradian, O’Connell, Patel, Press, Samaras, Shanmugam, Tavadze, and Thompson), Department of Pharmacy (Drs. Jiang, Jarawan, Sheth, and Trinh), Department of Nursing (Dr. Ohnmacht), and Department of Women and Children’s Services (Dr. Raji), Luminis Health, Annapolis, MD, and Lanham, MD.
Objective: The COVID-19 pandemic has been a challenge for hospital medical staffs worldwide due to high volumes of patients acutely ill with novel syndromes and prevailing uncertainty regarding optimum supportive and therapeutic interventions. Additionally, the response to this crisis was driven by a plethora of nontraditional information sources, such as email chains, websites, non–peer-reviewed preprints, and press releases. Care patterns became idiosyncratic and often incorporated unproven interventions driven by these nontraditional information sources. This report evaluates the efforts of a health system to create and empower a multidisciplinary committee to develop, implement, and monitor evidence-based, standardized protocols for patients with COVID-19.
Methods: This report describes the composition of the committee, its scope, and its important interactions with the health system pharmacy and therapeutics committee, research teams, and other work groups planning other aspects of COVID-19 management. It illustrates how the committee was used to demonstrate for trainees the process and value of critically examining evidence, even in a chaotic environment.
Results: Data show successful interventions in reducing excessive ordering of certain laboratory tests, reduction of nonrecommended therapies, and rapid uptake of evidence-based or guidelines-supported interventions.
Conclusions: A multidisciplinary committee dedicated solely to planning, implementing, and monitoring standard approaches that eventually became evidence-based decision-making led to an improved focus on treatment options and outcomes for COVID-19 patients. Data presented illustrate the attainable success that is both adaptable and suitable for similar emergencies in the future.
Keywords: COVID-19; clinical management; pharmacy and therapeutics; treatment; therapy.
The COVID-19 pandemic has spread to nearly all countries, carrying with it high morbidity, mortality, and severe impacts on both well-developed and less-well-developed health systems. Media reports of chaos within overwhelmed hospitals have been prominent.1,2 As of January 5, 2022, SARS-CoV-2 has infected more than 295 million people globally and directly caused the death of more than 5.4 million,3 though this number is likely an undercount even in countries with well-developed mortality tracking.4
Throughout the COVID-19 pandemic, hospital-based medical teams have been confronted with a flood of severely ill patients with novel syndromes. Initially, there were no standards for therapy or supportive care except for treatments borrowed from similar syndromes. In the setting of high volumes, high acuity, and public dismay, it is unsurprising that the usual deliberative methods for weighing evidence and initiating interventions were often pushed aside in favor of the solace of active intervention.5 In this milieu of limited evidence, there was a lamentable, if understandable, tendency to seek guidance from “nontraditional” sources,6 including email chains from colleagues, hospital websites, non–peer-reviewed manuscripts, advanced publication by medical journals,7 and nonscientific media presentations. In many localities, practitioners responded in idiosyncratic ways. For example, findings of high cytokine levels in COVID-19,8 along with reports of in-vitro antiviral activity with drugs like hydroxychloroquine against both SARS9 and SARS-CoV-2,10 drove laboratory test ordering and therapeutic interventions, respectively, carving shortcuts into the traditional clinical trial–dependent standards. Clinical trial results eventually emerged.11COVID-19 created a clinical dilemma for hospital medical staffs in terms of how to organize, standardize, and rapidly adapt to a flood of new information. In this report, we describe how 1 health system responded to these challenges by forming a COVID-19 Clinical Management Committee (CCMC) and empowering this interdisciplinary team to review evidence, create and adjust order sets, educate practitioners, oversee care, and collaborate across teams addressing other aspects of the COVID-19 response.
Program Overview
Health System Description
Luminis Health is a health system with 2 acute care hospitals that was formed in 2019 just before the start of the pandemic. Anne Arundel Medical Center (hospital A) is a 385-bed teaching hospital in Annapolis, MD. It has more than 23 000 discharges annually. Patients with COVID-19 were cared for by either an internal medicine teaching service or nonteaching hospitalist services on cohorted nursing units. Doctor’s Community Medical Center, in Lanham, MD (hospital B), is a 206-bed acute care hospital with more than 10 350 annual discharges. COVID-19 patients were cared for by hospitalist groups, initially in noncohorted units with transition to cohorted nursing units after a few months. The medical staffs are generally distinct, with different leadership structures, though the Luminis Health Department of Medicine has oversight responsibilities at both hospitals. More than 47 physicians attended COVID-19 patients at hospital A (with medical residents) and 30 individual physicians at hospital B, respectively, including intensivists. The nursing and pharmacy staffs are distinct, but there is a shared oversight Pharmacy and Therapeutics (P&T) Committee.
The 2 hospitals had distinct electronic medical records (EMR) until January 2021, when hospital B adopted the same EMR as hospital A (Epic).
Mission and Formation of CCMC
In order to coordinate the therapeutic approach across the health system, it was important for the CCMC to be designated by the health system P&T committee as an official subcommittee so that decisions on restrictions of medications and/or new or revised order sets could be rapidly initiated across the system without waiting for the subsequent P&T meetings. The full committee retained oversight of the CCMC. Some P&T members were also on the CCMC.
The committee reviewed new reports in medical journals and prepublication servers and consulted recommendations of professional societies, such as the National Institutes of Health (NIH) COVID-19 guidelines, Infectious Diseases Society of America, Society of Critical Care Medicine, and US Food and Drug Administration (FDA) Emergency Use Authorizations (EUA), among other sources.
Composition of the CCMC
Physician leaders from both hospitals in the following specialties were solicited for participation: critical care, epidemiology, hospital medicine (internal medicine), emergency medicine, infectious diseases, nephrology, women and children’s services, and medical informatics. Specialists in other areas, such as hematology, were invited for topic-specific discussions. Hospital pharmacists with different specialties and nursing leadership were essential contributors. The committee members were expected to use various communication channels to inform frontline clinicians of new care standards and the existence of new order sets, which were embedded in the EMR.
Clinical Research
An important connection for the CCMC was with theCOVID-19 clinical research team. Three members of the research team were also members of the CCMC. All new study proposals for therapeutics were discussed with the CCMC as they were being considered by the research team. In this way, feedback on the feasibility and acceptance of new study opportunities could be discussed with the CCMC. Occasionally, CCMC decisions impacted clinical research accrual strategies. For example, new data from randomized trials about tocilizumab1,2 demonstrated benefits in some subsets of patients and resulted in a recommendation for use by the NIH guideline committee in these populations.1 The CCMC quickly adopted this recommendation, which required a reprioritization of clinical research enrollment for studies testing other immune-modulating agents. This important dialogue was mediated within the CCMC.
Guideline Distribution, Reinforcement, and Platform for Feedback
New guidelines were disseminated to clinicians via daily brief patient huddles held on COVID units, with participation by nursing and pharmacy, and by weekly meetings with hospitalist leaders and frontline hospital physicians. Order sets and guidelines were maintained on the intranet. Adherence was reinforced by unit-based and central pharmacists. Order sets, including admission order sets, could be created only by designated informatics personnel, thus enforcing standardization. Feedback on the utility of the order sets was obtained during the weekly meetings or huddles, as described above. To ensure a sense of transparency, physicians who had interest in commenting on a particular therapy, or who wished to discuss a particular manuscript, news article, or website, were invited to attend CCMC meetings.
Scope of CCMC
In order to be effective and timely, we limited the scope of our work to the report to the inpatient therapeutic environment, allowing other committees to work on other aspects of the pandemic response. In addition to issuing guidance and creating order sets to direct clinical practice, the CCMC also monitored COVID-19 therapeutic shortages15,16 and advised on prioritization of such treatments as convalescent plasma, remdesivir (prioritization and duration of therapy, 5 vs 10 days), baricitinib, and tocilizumab, depending upon the location of the patient (critical care or not). The CCMC was not involved in the management of non–COVID-19 shortages brought about by supply chain deficiencies.
Table 1 shows some aspects of the health system pandemic-response planning and the committee workforce that undertook that work. Though many items were out of scope for the CCMC, members of the CCMC did participate in the planning work of these other committees and therefore stayed connected to this complementary work.
A Teaching Opportunity About Making Thoughtful Choices
Another important feature of the CCMC was the contributions of residents from both pharmacy and internal medicine. The purpose and operations of the committee were recognized as an opportunity to involve learners in a curriculum based on Kern’s 6-step approach.17 Though the problem identification and general needs assessment were easily defined, the targeted needs assessment, extracted from individual and group interviews with learners and the committee members, pointed at the need to learn how to assess and analyze a rapidly growing body of literature on several relevant clinical aspects of SARS-CoV-2 and COVID-19. To achieve goals and objectives, residents were assigned to present current literature on a particular intervention during a committee meeting, specifically commenting on the merit or deficiencies of the study design, the strength of the data, and applicability to the local context with a recommendation. Prior to the presentations, the residents worked with faculty to identify the best studies or systematic analyses with potential to alter current practices. We thus used the CCMC process as a teaching tool about evidence-based medicine and the dilemma of clinical equipoise. This was imperative, since trainees thrust into the COVID-19 response have often keenly observed a movement away from deliberative decision-making.18 Indeed, including residents in the process of deliberative responses to COVID-19 addresses a recent call to adjust medical education during COVID-19 to “adapt curriculum to current issues in real time.”19
Interventions and Therapies Considered
Table 2 shows the topics reviewed by the CCMC. By the time of the first meeting, nonstandardization of care was already a source of concern for clinicians. Dialogue often continued outside of the formal meetings. Many topics were considered more than once as new guidance developed, changes to EUAs occurred, and new data or new publicity arose.
Methods
The Human Protections Administrator determined that this work constituted “quality improvement, and not research” and was therefore exempt from institutional review board review.
Quantitative Analysis
All admitted patients from March 10, 2020, through April 20, 2021, were considered in the quantitative aspects of this report except as noted. Patients diagnosed with COVID-19 were identified by searching our internal data base using diagnostic codes. Patient admissions with the following diagnostic codes were included (prior to April 1, 2020): J12.89, J20.8, J40, J22, J98.8, J80, each with the additional code of B97.29. After April 1, 2020, the guideline for coding COVID-19 was U07.1.
Descriptive statistics were used to measure utilization rates of certain medications and laboratory tests of interest over time. These data were adjusted for number of unique admissions. In a few cases, not all data elements were available from both hospitals due to differences in the EMR.
Case fatality rate was calculated based upon whether the patient died or was admitted to inpatient hospice as a result of COVID-19. Four patients transferred out of hospital A and 18 transferred out of hospital B were censored from case-fatality-rate determination.
Figure 1 shows the number of admissions for each acute care hospital in the health system and the combined COVID-19 case-fatality rate over time.
Results
A total of 5955 consecutive COVID-19 patients admitted from March 10, 2020, through April 30, 2021, were analyzed. Patients with International Statistical Classification of Diseases, Tenth Revision codes J12.89. J20.8, J40, J22, J98.8, J80, each with the additional code of B97.29 (or the code UO7.1 after April 1, 2020), were included in the analysis. The median age of admitted patients was 65 years (range 19-91 years). Using the NIH classification system for severity,20 the distribution of severity during the first 24 hours after the time of hospital admission was as follows: asymptomatic/presymptomatic, 0.5%; mild illness, 5.3%; moderate illness, 37.1%; severe illness, 55.5%; and critical illness, 1.1%.
The impact of the CCMC can be estimated by looking at care patterns over time. Since the work of the CCMC was aimed at influencing and standardizing physician ordering and therapy choices through order set creation and other forms of oversight, we measured the use of the CCMC-approved order sets at both hospitals and the use of certain laboratory tests and therapies that the CCMC sought either to limit or increase. These counts were adjusted for number of unique COVID-19 admissions. But the limits of the case collection tool meant it also collected cases that were not eligible for some of the interventions. For example, COVID-19 admissions without hypoxemia would not have been eligible for remdesivir or glucocorticoids. When admitted, some patients were already on steroids for other medical indications and did not receive the prescribed dexamethasone dose that we measured in pharmacy databases. Similarly, a few patients were hospitalized for indications unrelated to COVID-19, such as surgery or childbirth, and were found to be SARS-CoV-2-positive on routine screening.
Figure 2 shows the utilization of CCMC-approved standard COVID-19 admission order sets as a proportion of all COVID-19 admissions over time. The trend reveals a modest increase in usage (R2 = 0.34), but these data do not reflect the progressive build of content into order sets over time. One of the goals of the order sets was to standardize and reduce the ordering of certain biomarkers: C-reactive protein, serum ferritin, and D-dimer, which were ordered frequently in many early patients. Orders for these 3 laboratory tests are combined and expressed as an average number of labs per COVID-19 admission in Figure 2. A downward trend, with an R2 value of 0.65, is suggestive of impact from the order sets, though other explanations are possible.
Medication guidance was also a goal of the CCMC, simultaneously discouraging poorly supported interventions and driving uptake of the recommended evidence-based interventions in appropriate patients. Figure 3 shows the utilization pattern for some drugs of interest over the course of the pandemic, specifically the proportion of patients receiving at least 1 dose of medication among all COVID-19 admissions by month. (Data for hospital B was excluded from this analysis because it did not include all admitted patients.)
Hydroxychloroquine, which enjoyed a wave of popularity early on during the pandemic, was a target of successful order stewardship through the CCMC. Use of hydroxychloroquine as a COVID-19 therapeutic option after the first 2 months of the pandemic stopped, and subsequent use at low levels likely represented continuation therapy for outpatients who took hydroxychloroquine for rheumatologic indications.
Dexamethasone, as used in the RECOVERY trial,21 had a swift uptake among physicians after it was incorporated into order sets and its use encouraged. Similarly, uptake was immediate for remdesivir when, in May 2020, preliminary reports showed at least some benefits, confirmed by later analysis,22 and it received an FDA EUA.
Our data also show successful stewardship of the interleukin-6 antagonist toclilizumab, which was discouraged early on by the CCMC due to lack of data or negative results. But in March 2021, with new studies releasing data12,13 and new recommendations14 for its use in some subsets of patients with COVID-19, this drug was encouraged in appropriate subsets. A new order set with qualifying indications was prepared by the CCMC and new educational efforts made to encourage its use in appropriate patients.
Ivermectin was nonformulary at the start of the pandemic. This drug enjoyed much publicity from media sources and was promoted by certain physicians and on websites,23 based on in-vitro activity against coronaviruses. Eventually, the World Health Organization24 and the FDA25 found it necessary to issue advisory statements to the public against its use outside of clinical trials. The CCMC had requests from physicians to incorporate ivermectin but declined to add it to the formulary and recommended not approving nonformulary requests due to lack of data. As a result, ivermectin was not used at either hospital.
Discussion
COVID-19 represents many challenges to health systems all over the world. For Luminis Health, the high volume of acutely ill patients with novel syndromes was a particular challenge for the hospital-based care teams. A flood of information from preprints, press releases, preliminary reports, and many other nontraditional sources made deliberative management decisions difficult for individual physicians. Much commentary has appeared around the phenomenon but with less practical advice about how to make day-to-day care decisions at a time of scientific uncertainty and intense pressure to intervene.26,27 The CCMC was designed to overcome the information management dilemma. The need to coordinate, standardize, and oversee care was necessary given the large number of physicians who cared for COVID-19 patients on inpatient services.
It should be noted that creating order sets and issuing guidance is necessary, but not sufficient, to achieve our goals of being updated and consistent. This is especially true with large cadres of health care workers attending COVID-19 patients. Guidelines and recommendations were reinforced by unit-based oversight and stewardship from pharmacy and other leaders who constituted the CCMC.
The reduction in COVID-19 mortality over time experienced in this health care system was not unique and cannot necessarily be attributed to standardization of care. Similar improvements in mortality have been reported at many US hospitals in aggregate.28 Many other factors, including changes in patient characteristics, may be responsible for reduction in mortality over time.
Throughout this report we have relied upon an implicit assumption that standardization of medical therapeutics is desirable and leads to better outcomes as compared with allowing unlimited empiricism by individual physicians, either consultants or hospitalists. Our program represents a single health system with 2 acute care hospitals located 25 miles apart and which thus were similarly impacted by the different phases of the pandemic. Generalizability to health systems either smaller or larger, or in different geographical areas, has not been established. Data limitations have already been discussed.
We did not measure user satisfaction with the program either from physicians or nurses. However, the high rate of compliance suggests general agreement with the content and process.
We cannot definitively ascribe reduction in utilization of some nonrecommended treatments and increased utilization of the recommended therapies to the work of the CCMC. Individual physicians may have made these adjustments on their own or under the influence of other sources.
Finally, it should be noted that the mission to rapidly respond to data from well-conducted trials might be thwarted by too rigid a process or a committee’s lack of a sense of urgency. Organizing a committee and then empowering it to act is no guarantee of success; commitment to the mission is.
Conclusion
COVID-19 represented a challenge to medical staffs everywhere, inundating them with high volumes of acutely ill patients presenting with unfamiliar syndromes. Initial responses were characterized by idiosyncratic management approaches based on nontraditional sources of opinion and influences.
This report describes how a complex medical system brought order and standardization through a deliberative, but urgent, multidisciplinary committee with responsibility for planning, implementing, and monitoring standard approaches that eventually became evidence based. The composition of the committee and its scope of influence, limited to inpatient management, were important elements of success, allowing for better focus on the many treatment decisions. The important connection between the management committee and the system P&T committee, the clinical research effort, and teaching programs in both medicine and pharmacy are offered as exemplars of coordination. The data presented show success in achieving standardized, guideline-directed care. The approach is adoptable and suitable for similar emergencies in the future.
Acknowledgments: The authors thank Gary Scabis, Kip Waite, John Moxley, Angela Clubb, and David Woodley for their assistance in gathering data. We express appreciation and admiration for all our colleagues at the bedside.
Corresponding author: Barry R. Meisenberg, MD, Department of Medicine, Luminis Health, 2001 Medical Pkwy, Annapolis, MD 21401; meisenberg@AAHS.org.
Financial disclosures: None.
1. Gettleman J, Raj S, Kumar H. India’s health system cracks under the strain as coronavirus cases surge. The New York Times. April 22, 2021. https://www.nytimes.com/2021/04/21/world/asia/india-coronavirus-oxygen.html
2. Rappleye H, Lehren AW, Strickler L, Fitzpatrick S. ‘This system is doomed’: doctors, nurses sound off in NBC News coronavirus survey. NBC News. March 20, 2020. https://www.nbcnews.com/news/us-news/system-doomed-doctors-nurses-sound-nbc-news-coronavirus-survey-n1164841
3. Johns Hopkins Coronavirus Resource Center. Accessed January 5, 2022. https://coronavirus.jhu.edu/map.html
4. Fineberg HV. The toll of COVID-19. JAMA. 2020;324(15):1502-1503. doi:10.1001/jama.2020.20019
5. Meisenberg BR. Medical staffs response to COVID-19 ‘data’: have we misplaced our skeptic’s eye? Am J Med. 2021;134(2):151-152. doi:10.1016/j.amjmed.2020.09.013
6. McMahon JH, Lydeamore MH, Stewardson AJ. Bringing evidence from press release to the clinic in the era of COVID-19. J Antimicrob Chemother. 2021;76(3):547-549. doi:10.1093/jac/dkaa506
7. Rubin EJ, Baden LR, Morrissey S, Campion EW. Medical journals and the 2019-nCoV outbreak. N Engl J Med. 2020;382(9):866. doi:10.1056/NEJMe2001329
8. Liu F, Li L, Xu M, et al. Prognostic value of interleukin-6, C-reactive protein, and procalcitonin in patients with COVID-19. J Clin Virol. 2020;127:104370. doi:10.1016/j.jcv.2020.104370
9. Vincent MJ, Bergeron E, Benjannet S, et al. Chloroquine is a potent inhibitor of SARS coronavirus infection and spread. Virol J. 2005;2:69. doi:10.1186/1743-422X-2-69
10. Wang M, Cao R, Zhang L, et al. Remdesivir and chloroquine effectively inhibit the recently emerged novel coronavirus (2019-nCoV) in vitro. Cell Res. 2020;30:269-271. doi:10.1038/s41422-020-0282-0
11. RECOVERY Collaborative Group. Effect of hydroxychloroquine in hospitalized patients with Covid-19. N Engl J Med. 2020;383:2030-2040. doi:10.1056/NEJMoa2022926
12. RECOVERY Collaborative Group. Tocilizumab in patients admitted to hospital with COVID-19 (RECOVERY): preliminary results of a randomised, controlled, open-label, platform trial [preprint]. February 11, 2021. doi:10.1101/2021.02.11.21249258 https://www.medrxiv.org/content/10.1101/2021.02.11.21249258v1
13. REMAP-CAP Investigators. Interleukin-6 receptor antagonists in critically ill patients with COVID-19. N Engl J Med. 2021;384(16):1491-1502. doi:10.1056/NEJMoa2100433
14. National Institutes of Health. COVID-19 treatment guidelines: interleukin-6 inhibitors. https://www.covid19treatmentguidelines.nih.gov/immunomodulators/interleukin-6-inhibitors/
15. Deana C, Vetrugno L, Tonizzo A, et al. Drug supply during COVID-19 pandemic: remember not to run with your tank empty. Hosp Pharm. 2021;56(5):405-407. doi:10.1177/0018578720931749
16. Choe J, Crane M, Greene J, et al. The Pandemic and the Supply Chain: Addressing Gaps in Pharmaceutical Production and Distribution. Johns Hopkins University, November 2020. https://www.jhsph.edu/research/affiliated-programs/johns-hopkins-drug-access-and-affordability-initiative/publications/Pandemic_Supply_Chain.pdf
17. Kern DE. Overview: a six-step approach to curriculum development. In: Kern DE, Thornton PA, Hughes MT, eds. Curriculum Development for Medical Education: A Six-Step Approach. 3rd ed. Johns Hopkins University Press; 2016.
18. Rice TW, Janz DR. In defense of evidence-based medicine for the treatment of COVID-19 acute respiratory distress syndrome. Ann Am Thorac Soc. 2020;17(7):787-789. doi:10.1513/AnnalsATS.202004-325IP
19. Lucey CR, Johnston SC. The transformational effects of COVID-19 on medical education. JAMA. 2020;324(11):1033-1034. doi:10.1001/jama.2020.14136
20. National Institutes of Health. COVID-19 treatment guidelines: clinical spectrum of SARS-CoV-2 infection. https://www.covid19treatmentguidelines.nih.gov/overview/clinical-spectrum/
21. RECOVERY Collaborative Group. Dexamethasone in hospitalized patients with Covid-19. N Engl J Med. 2021;384:693-704. doi:10.1056/NEJMoa2021436
22. Beigel JH, Tomashek KM, Dodd LE, et al. Remdesivir for the treatment of Covid-19—final report. N Engl J Med. 2020;383:1813-1826. doi:10.1056/NEJMoa2007764
23. Jiminez D. Ivermectin and Covid-19: how a cheap antiparasitic became political. April 19, 2021. https://www.pharmaceutical-technology.com/features/ivermectin-covid-19-antiparasitic-political/
24. World Health Organization. WHO advises that ivermectin only be used to treat COVID-19 within clinical trials. March 31, 2021. https://www.who.int/news-room/feature-stories/detail/who-advises-that-ivermectin-only-be-used-to-treat-covid-19-within-clinical-trials
25. U.S. Food and Drug Administration. Why you should not use ivermectin to treat or prevent COVID-19. March 5, 2021. https://www.fda.gov/consumers/consumer-updates/why-you-should-not-use-ivermectin-treat-or-prevent-covid-19
26. Seymour CW, McCreary EK, Stegenga J. Sensible medicine-balancing intervention and inaction during the COVID-19 pandemic. JAMA. 2020;324(18):1827-1828. doi:10.1001/jama.2020.20271
27. Flanagin A, Fontanarosa PB, Bauchner H. Preprints involving medical research—do the benefits outweigh the challenges? JAMA. 2020;324(18):1840-1843. doi:10.1001/jama.2020.20674
28. Asch DA, Shells NE, Islam N, et al. Variation in US hospital mortality rates for patients admitted with COVID-19 during the first 6 months of the pandemic. JAMA Intern Med. 2021;181(4):471-478. doi:10.1001/jamainternmed.2020.8193
Clinical Outcomes After Conversion from Low-Molecular-Weight Heparin to Unfractionated Heparin for Venous Thromboembolism Prophylaxis
From the Anne Arundel Health System Research Institute, Annapolis, MD.
Abstract
- Objective: To measure clinical outcomes associated with heparin-induced thrombocytopenia (HIT) and acquisition costs of heparin after implementing a new order set promoting unfractionated heparin (UFH) use instead of low-molecular-weight heparin (LMWH) for venous thromboembolism (VTE) prophylaxis.
- Methods: This was single-center, retrospective, pre-post intervention analysis utilizing pharmacy, laboratory, and clinical data sources. Subjects were patients receiving VTE thromboprophyalxis with heparin at an acute care hospital. Usage rates for UFH and LMWH, acquisition costs for heparins, number of HIT assays, best practice advisories for HIT, and confirmed cases of HIT and HIT with thrombosis were assessed.
- Results: After order set intervention, UFH use increased from 43% of all prophylaxis orders to 86%. Net annual savings in acquisition costs for VTE prophylaxis was $131,000. After the intervention, HIT best practice advisories and number of monthly HIT assays fell 35% and 15%, respectively. In the 9-month pre-intervention period, HIT and HITT occurred in zero of 6717 patients receiving VTE prophylaxis. In the 25 months of post-intervention follow-up, HIT occurred in 3 of 44,240 patients (P = 0.86) receiving VTE prophylaxis, 2 of whom had HITT, all after receiving UFH. The median duration of UFH and LMWH use was 3.0 and 3.5 days, respectively.
- Conclusion: UFH use in hospitals can be safely maintained or increased among patient subpopulations that are not at high risk for HIT. A more nuanced approach to prophylaxis, taking into account individual patient risk and expected duration of therapy, may provide desired cost savings without provoking HIT.
Key words: heparin; heparin-induced thrombocytopenia; venous thromboembolism prophylaxis; cost-effectiveness.
Heparin-induced thrombocytopenia (HIT) and its more severe clinical complication, HIT with thrombosis (HITT), complicate the use of heparin products for venous thromboembolic (VTE) prophylaxis. The clinical characteristics and time course of thrombocytopenia in relation to heparin are well characterized (typically 30%–50% drop in platelet count 5–10 days after exposure), if not absolute. Risk calculation tools help to judge the clinical probability and guide ordering of appropriate confirmatory tests [1]. The incidence of HIT is higher with unfractionated heparin (UFH) than with low-molecular-weight heparin (LMWH). A meta-analysis of 5 randomized or prospective nonrandomized trials indicated a risk of 2.6% (95% CI, 1.5%–3.8%) for UFH and 0.2% (95% CI, 0.1%–0.4%) for LMWH [2], though the analyzed studies were heavily weighted by studies of orthopedic surgery patients, a high-risk group. However, not all patients are at equal risk for HIT, suggesting that LMWH may not be necessary for all patients [3]. Unfortunately, LMWH is considerably more expensive for hospitals to purchase than UFH, raising costs for a prophylactic treatment that is widely utilized. However, the higher incidence of HIT and HITT associated with UFH can erode any cost savings because of the additional cost of diagnosing HIT and need for temporary or long-term treatment with even more expensive alternative anticoagulants. Indeed, a recent retrospective study suggested that the excess costs of evaluating and treating HIT were approximately $267,000 per year in Canadian dollars [4].But contrary data has also been reported. A retrospective study of the consequences of increased prophylactic UFH use found no increase in ordered HIT assays or in the results of HIT testing or of inferred positive cases despite a growth of 71% in the number of patients receiving UFH prophylaxis [5].
In 2013, the pharmacy and therapeutics committee made a decision to encourage the use of UFH over LMWH for VTE prophylaxis by making changes to order sets to favor UFH over LMWH (enoxaparin). Given the uncertainty about excess risk of HIT, a monitoring work group was created to assess for any increase of either HIT or HITT that might follow, including any patient readmitted with thrombosis within 30 days of a discharge. In this paper, we report the impact of a hospital-wide conversion to UFH for VTE prophylaxis on the incidence of VTE, HIT, and HITT and acquisition costs of UFH and LMWH and use of alternative prophylactic anticoagulant medications.
Methods
Setting
Anne Arundel Medical Center is a 383-bed acute care hospital with about 30,000 adult admissions and 10,000 inpatient surgeries annually. The average length of stay is approximately 3.6 days with a patient median age of 59 years. Caucasians comprise 75.3% of the admitted populations and African Americans 21.4%. Most patients are on Medicare (59%), while 29.5% have private insurance, 6.6% are on Medicaid, and 4.7% self-pay. The 9 most common medical principal diagnoses are sepsis, heart failure, chronic obstructive pulmonary disease, pneumonia, myocardial infarction, ischemic stroke, urinary tract infection, cardiac arrhythmia, and other infection. The 6 most common procedures include newborn delivery (with and without caesarean section), joint replacement surgery, bariatric procedures, cardiac catheterizations, other abdominal surgeries, and thoracotomy. The predominant medical care model is internal medicine and physician assistant acute care hospitalists attending both medicine and surgical patients. Obstetrical hospitalists care for admitted obstetric patients. Patients admitted to the intensive care units had only critical care trained physician specialists as attending physicians. No trainees cared for the patients described in this study.
P&T Committee
The P&T committee is a multidisciplinary group of health care professionals selected for appointment by the chairs of the committee (chair of medicine and director of pharmacy) and approved by the president of the medical staff. The committee has oversight responsibility for all medication policies, order sets involving medications, as well as the monitoring of clinical outcomes as they regard medications.
Electronic Medical Record and Best Practice Advisory
Throughout this study period both pre-and post-intervention, the EMR in use was Epic (Verona WI), used for all ordering and lab results. A best practice advisory was in place in the EMR that alerted providers to all cases of thrombocytopenia < 100,000/mm3 when there was concurrent order for any heparin. The best practice advisory highlighted the thrombocytopenia, advised the providers to consider HIT as a diagnosis and to order confirmation tests if clinically appropriate, providing a direct link to the HIT assay order screen. The best practice advisory did not access information from prior admissions where heparin might have been used nor determine the percentage drop from the baseline platelet count.
HIT Case Definition and Assays
The 2 laboratory tests for HIT on which this study is based are the heparin-induced platelet antibody test (also known as anti-PF4) and the serotonin release assay. The heparin-induced platelet antibody test is an enzyme-linked immunosorbent assay (ELISA) that detects IgG, IgM, and IgA antibodies against the platelet factor 4 (PF4/heparin complex). This test was reported as positive if the optical density was 0.4 or higher and generated an automatic request for a serotonin release assay (SRA), which is a functional assay that measures heparin-dependent platelet activation. The decision to order the SRA was therefore a “reflex” test and not made with any knowledge of clinical characteristics of the case. The HIT assays were performed by a reference lab, Quest Diagnostics, in the Chantilly, VA facility. HIT was said to be present when both a characteristic pattern of thrombocytopenia occurring after heparin use was seen [1]and when the confirmatory SRA was positive at a level of > 20% release.
Order Set Modifications
After the P&T committee decision to emphasize UFH for VTE prophylaxis in October 2013, the relevant electronic order sets were altered to highlight the fact that UFH was the first choice for VTE prophylaxis. The order sets still allowed LMWH (enoxaparin) or alternative anticoagulants at the prescribers’ discretion but indicated they were a second choice. Doses of UFH and LMWH in the order sets were standard based upon weight and estimates of creatinine clearance and, in the case of dosing frequency for UFH, based upon the risk of VTE. Order sets for the therapeutic treatment of VTE were not changed.
Data Collection and Analysis
The clinical research committee, the local oversight board for research and performance improvement analyses, reviewed this project and determined that it qualified as a performance improvement analysis based upon the standards of the U.S. Office of Human Research Protections. Some data were extracted from patient medical records and stored in a customized and password-protected database. Access to the database was limited to members of the analysis team and stripped of all patient identifiers under the HIPAA privacy rule standard for de-identification from 45 CFR 164.514(b) immediately following the collection of all data elements from the medical record.
An internal pharmacy database was used to determine the volume and actual acquisition cost of prophylactic anticoagulant doses administered during both pre- and post-intervention time periods. To determine if clinical suspicion for HIT increased after the intervention, a definitive listing of all ordered HIT assays was obtained from laboratory billing records for the 9 months (January 2013–September 2013) before the conversion and for 25 months after the intervention (beginning in November 2013 so as not to include the conversion month). To determine if the HIT assays were associated with a higher risk score, we identified all cases in which the HIT assay was ordered and retroactively measured the probability score known as the 4T score [1].Simultaneously, separate clinical work groups reviewed all cases of hospital-acquired thrombosis, whatever their cause, including patients readmitted with thrombosis up to 30 days after discharge and episodes of bleeding due to anti-coagulant use. A chi square analysis of the incidence of HIT pre- and post-intervention was performed.
Results
Heparin Use and Acquisition Costs
HIT Assays and Incidence of HIT and HITT
In the 9 months pre-intervention, HIT and HITT occurred in zero of 6717 patients receiving at least 1 dose of VTE prophylaxis. In the 25 months of post-intervention follow-up, 44,240 patients received prophylaxis with either heparin. HIT (clinical suspicion with positive antibody and confirmatory SRA) occurred in 3 patients, 2 of whom had HITT, all after UFH. This incidence was not statistically significant using chi square analysis (P = 0.86).
Discussion
Because the efficacy of UFH and LMWH for VTE prophylaxis are equivalent [6],choosing between them involves many factors including patient-level risk factors such as renal function, risk of bleeding, as well as other considerations such as nursing time, patient preference, risk of HIT, and acquisition cost. Indeed, the most recent version of the American College of Chest Physicians guidelines for prophylaxis against VTE note that both drugs are recommended with an evidence grade of IB [7].Cost is among the considerations considered appropriate in choosing among agents. The difference in acquisition costs of > $20 per patient per day can have a major financial impact on hospital’s pharmacy budget and may be decisive. But a focus only on acquisition cost is short sighted as the 2 medications have different complication rates with regard to HIT. Thus the need to track HIT incidence after protocol changes are made is paramount.
In our study, we did not measure thrombocytopenia as an endpoint because acquired thrombocytopenia is too common and multifactorial to be a meaningful. Rather, we used the clinical suspicion for HIT as measured by both the number of times the BPA fired warnings of low platelets in the setting of recent heparin use and the number of times clinicians suspected HIT enough to order a HIT assay. We also used actual outcomes (clinically adjudicated cases of HIT and HITT). Our data shows substantial compliance among clinicians with the voluntary conversion to UFH with an immediate and sustained shift to UFH so that UFH was used in 86% of patients. Corresponding cost savings were achieved in heparin acquisition. Unlike some prior reports, there was a minimal burden of HIT as measured by the unchanged number of BPAs, monthly HIT assays and the unchanged clinical risk 4T scores among those patients in whom the test was ordered pre and post intervention. HIT rates were not statistically different after the order set conversion took effect.
Our results and study design are similar but not identical to that of Zhou et al, who found that a campaign to increase VTE prophylaxis resulted in 71% increase of UFH use over 5 years but no increase in number of HIT assays ordered or in the distribution of HIT assay results-both surrogate endpoints [5].But not all analyses of heparin order interventions show similar results. A recent study of a heparin avoidance program in a Canadian tertiary care hospital showed a reduction of 79% and 91% in adjudicated cases of HIT and HITT respectively [4].Moreover, hospital-related expenditures for HIT decreased by nearly $267,000 (Canadian dollars) per year though the additional acquisition costs of LMWH were not stated.A small retrospective heparin avoidance protocol among orthopedic surgery patients showed a reduction of HIT incidence from 5.2% with UFH to 0% with LMWH after universal substitution of LMWH for UFH [8].A recent systematic review identified only 3 prospective studies involving over 1398 postoperative surgical patients that measured HIT and HITT as outcomes [9].The review authors, in pooled analysis, found a lower incidence of HIT and HITT with LMWH postoperatively but downgraded the evidence to “low quality” due to methodologic issues and concerns over bias.A nested case-control study of adult medical patients found that HIT was 6 times more common with UFH than with LMWH and the cost of admissions associated with HIT was 3.5 times higher than for those without HIT, though this increase in costs are not necessarily due to the HIT diagnosis itself but may be markers of patients with more severe illness [10].The duration of heparin therapy was not stated.
There are several potential reasons that our data differs from some of the previous reports described above. We used a strict definition of HIT, requiring the serotonin release assay to be positive in the appropriate clinical setting and did not rely solely upon antibody tests to make the diagnosis, a less rigorous standard found in some studies. Furthermore, our results may differ from previously reports because of differences in patient risk and duration of therapy. Our institution does not perform cardiac surgery and the very large orthopedic surgery programs do not generally use heparin. Another potentially important difference in our study from prior studies is that many of the patients treated at this institution did not receive heparin long enough to be considered at risk; only a quarter were treated for longer than 5 days, generally considered a minumum [11].This is less than half of the duration of the patients in the studies included in the meta-analysis of HIT incidence [2].
We do not contend that UFH is as safe as LMWH with regard to HIT for all populatons, but rather that the increased risk is not manifest in all patient populations and settings and so the increased cost may not be justified in low-risk patients. Indeed while variability in HIT risk among patients is well documented [3,12], the guidelines for prophylaxis do not generally take this into account when recommending particular VTE prophylaxis strategies.Clinical practice guidelines do recommend different degrees of monitoring the platelet count based on risk of HIT however.
Our study had limitations, chief of which is the retrospective nature of the analysis; however, the methodology we used was similar to those of previous publications [4,5,8].We may have missed some cases of HIT if a clinician did not order the assay in all appropriate patients but there is no reason to think that likelihood was any different pre- and post-intervention. In addition, though we reviewed every case of hospital-acquired thrombosis, it is possible that the clinical reviewers may have missed cases of HITT, especially if the thrombosis occurred before a substantial drop in the platelet count, which is rare but possible. Here too the chance of missing actual cases did not change between the pre-and post-intervention. Our study examined prophylaxis with heparin use and not therapeutic uses. Finally, while noting the acquisition cost reduction achieved with conversion to UFH, we were not able to calculate any excess expense attributed to the rare case of HIT and HITT that occurred. We believe our results are generalizable to hospitals with similar patient profiles.
The idea that patients with different risk factors might do well with different prophylaxis strategies needs to be better appreciated. Such information could be used as a guide to more individualized prophylaxis strategy aided by clinical decision support embedded within the EMR. In this way the benefit of LMWH in avoiding HIT could be reserved for those patients at greatest risk of HIT while simultaneously allowing hospitals not to overspend for prophylaxis in patients who will not benefit from LMWH. Such a strategy would need to be tested prospectively before widespread adoption.
As a result of our internal analysis we have altered our EMR-based best practice alert to conform to the 2013 American Society of Hematology guidelines [15],which is more informative than our original BPA. Specifically, the old guideline only warned if the platelet count was < 100,000/mm3 in association with heparin. The revision notified if there is a > 30% fall regardless of the absolute count and informed prescribers of the 4T score to encourage more optimum use of the HIT assay, avoiding its use for low risk scores and encouraging its use for moderate to high risk scores. We are also strengthening the emphasis that moderate to high risk 4T patients receive alternative anticoagulation until results of the HIT assay are available as we found this not to be a be a universal practice. We recommend similar self-inspection to other institutions.
Corresponding author: Barry R. Meisenberg, MD, Anne Arundel Medical Center, 2001 Medical Parkway, Annapolis, MD 21401, Meisenberg@aahs.org.
Financial disclosures: None.
Author contributions: conception and design, JR, BRM; analysis and interpretation of data, KW, JR, BRM; drafting of article, JR, BRM; critical revision of the article, KW, JR, BRM; statistical expertise, KW, JR; administrative or technical support, JR; collection and assembly of data, KW, JR.
1. Lo GK, Juhl D, Warkentin TE, et al. Evaluation of pretest clinical score (4T’s) for the diagnosis of heparin-induced thrombocytopenia in two clinical settings. J Thromb Haemost 2006;4:759–65.
2. Martel N, Lee J, Wells PS. Risk for heparin-induced thrombocytopenia with unfractionated and low-molecular-weight heparin thromboprophylaxis: a meta-analysis. Blood 2005; 106:2710–5.
3. Warkentin TE, Sheppard JI, Horsewood P, et al. Impact of the patient population on the risk for heparin-induced thrombocytpenia Blood 2000; 96:1703–8.
4. McGowan KE, Makari J, Diamantouros A, et al. Reducing the hospital burden of heparin-induced thrombocytopenia: impact of an avoid heparin program. Blood 2016; 127:1954–9.
5. Zhou A, Winkler A, Emamifar A, et al. Is the incidence of heparin-induced thrombocytopenia affected by the increased use of heparin for VTE prophylaxis? Chest 2012; 142:1175–8.
6. Mismetti P, Laporte-Simitsidis S, Tardy B, et al. Prevention of venous thromboembolism in internal medicine with unfractionated or low-molecular-weight heparins: a meta-analysis of randomised clinical trials. Thromb Haemost 2000;83:14–19.
7. Guyatt GH, Akl EA, Crowther M, et al; for the American College of Chest Physicians Antithrombotic Therapy and Prevention of Thrombosis Panel. Antithrombotic therapy and prevention of thrombosis. 9th ed. American College of Chest Physicians Evidence-Based Clinical Practice Guidelines. Chest 2012;141(2 Suppl):7S–47S.
8. Greinacher A, Eichler P, Lietz T, Warkentin TE. Replacement of unfractionated heparin by low-molecular-weight heparin for postorthopedic surgery antithrombotic prophylaxis lowers the overall risk of symptomatic thrombosis because of a lower frequency of heparin-induced thrombocytopenia. Blood 2005;106:2921–2.
9. Junqueira DRG, Zorzela LM, Perini E. Unfractionated heparin versus low molecular weight heparin for avoiding heparin-induced thrombocytopenia in postoperative patients. Cochrane Database Syst Rev 2017;4:CD007557.
10. Creekmore FM, Oderda GM, Pendleton RC, Brixner DI. Incidence and economic implications of heparin-induced thrombocytopenia in medical patients receiving prophylaxis for venous thromboembolism. Pharmacotherapy 2006;26:1348–445.
11. Warkentin TE, Kelton JG. Temporal aspects of heparin-induced thrombocytopenia N Engl J Med 2001;344:1286–92.
12. Warkentin TE, Sheppard JA, Sigouin CS, et al. Gender imbalance and risk factor interactions in heparin-induced thrombocytopenia. Blood 2006;108:2937–41.
13. Camden R, Ludwig S. Prophylaxis against venous thromboembolism in hospitalized medically ill patients: Update and practical approach. Am J Health Syst Pharm 2012;71:909–17.
14. Linkins LA, Dans AL, Moores LK, et al. Treatment and prevention of heparin-induced thrombocytopenia. antithrombotic therapy and prevention of thrombosis. 9th ed. American College of Chest Physicians Evidence-Based Clinical Practice Guidelines. Chest 2012;141(2 Suppl):e495s–e530s.
15. Cuker A, Crowther MA. 2013 Clinical practice guideline on the evaluation and management of adults with suspected heparin-induced thrombocytopenia. Acessed 19 May 2017 at www.hematology.org/search.aspx?q=heparin+induced+thrombocytopenia.
From the Anne Arundel Health System Research Institute, Annapolis, MD.
Abstract
- Objective: To measure clinical outcomes associated with heparin-induced thrombocytopenia (HIT) and acquisition costs of heparin after implementing a new order set promoting unfractionated heparin (UFH) use instead of low-molecular-weight heparin (LMWH) for venous thromboembolism (VTE) prophylaxis.
- Methods: This was single-center, retrospective, pre-post intervention analysis utilizing pharmacy, laboratory, and clinical data sources. Subjects were patients receiving VTE thromboprophyalxis with heparin at an acute care hospital. Usage rates for UFH and LMWH, acquisition costs for heparins, number of HIT assays, best practice advisories for HIT, and confirmed cases of HIT and HIT with thrombosis were assessed.
- Results: After order set intervention, UFH use increased from 43% of all prophylaxis orders to 86%. Net annual savings in acquisition costs for VTE prophylaxis was $131,000. After the intervention, HIT best practice advisories and number of monthly HIT assays fell 35% and 15%, respectively. In the 9-month pre-intervention period, HIT and HITT occurred in zero of 6717 patients receiving VTE prophylaxis. In the 25 months of post-intervention follow-up, HIT occurred in 3 of 44,240 patients (P = 0.86) receiving VTE prophylaxis, 2 of whom had HITT, all after receiving UFH. The median duration of UFH and LMWH use was 3.0 and 3.5 days, respectively.
- Conclusion: UFH use in hospitals can be safely maintained or increased among patient subpopulations that are not at high risk for HIT. A more nuanced approach to prophylaxis, taking into account individual patient risk and expected duration of therapy, may provide desired cost savings without provoking HIT.
Key words: heparin; heparin-induced thrombocytopenia; venous thromboembolism prophylaxis; cost-effectiveness.
Heparin-induced thrombocytopenia (HIT) and its more severe clinical complication, HIT with thrombosis (HITT), complicate the use of heparin products for venous thromboembolic (VTE) prophylaxis. The clinical characteristics and time course of thrombocytopenia in relation to heparin are well characterized (typically 30%–50% drop in platelet count 5–10 days after exposure), if not absolute. Risk calculation tools help to judge the clinical probability and guide ordering of appropriate confirmatory tests [1]. The incidence of HIT is higher with unfractionated heparin (UFH) than with low-molecular-weight heparin (LMWH). A meta-analysis of 5 randomized or prospective nonrandomized trials indicated a risk of 2.6% (95% CI, 1.5%–3.8%) for UFH and 0.2% (95% CI, 0.1%–0.4%) for LMWH [2], though the analyzed studies were heavily weighted by studies of orthopedic surgery patients, a high-risk group. However, not all patients are at equal risk for HIT, suggesting that LMWH may not be necessary for all patients [3]. Unfortunately, LMWH is considerably more expensive for hospitals to purchase than UFH, raising costs for a prophylactic treatment that is widely utilized. However, the higher incidence of HIT and HITT associated with UFH can erode any cost savings because of the additional cost of diagnosing HIT and need for temporary or long-term treatment with even more expensive alternative anticoagulants. Indeed, a recent retrospective study suggested that the excess costs of evaluating and treating HIT were approximately $267,000 per year in Canadian dollars [4].But contrary data has also been reported. A retrospective study of the consequences of increased prophylactic UFH use found no increase in ordered HIT assays or in the results of HIT testing or of inferred positive cases despite a growth of 71% in the number of patients receiving UFH prophylaxis [5].
In 2013, the pharmacy and therapeutics committee made a decision to encourage the use of UFH over LMWH for VTE prophylaxis by making changes to order sets to favor UFH over LMWH (enoxaparin). Given the uncertainty about excess risk of HIT, a monitoring work group was created to assess for any increase of either HIT or HITT that might follow, including any patient readmitted with thrombosis within 30 days of a discharge. In this paper, we report the impact of a hospital-wide conversion to UFH for VTE prophylaxis on the incidence of VTE, HIT, and HITT and acquisition costs of UFH and LMWH and use of alternative prophylactic anticoagulant medications.
Methods
Setting
Anne Arundel Medical Center is a 383-bed acute care hospital with about 30,000 adult admissions and 10,000 inpatient surgeries annually. The average length of stay is approximately 3.6 days with a patient median age of 59 years. Caucasians comprise 75.3% of the admitted populations and African Americans 21.4%. Most patients are on Medicare (59%), while 29.5% have private insurance, 6.6% are on Medicaid, and 4.7% self-pay. The 9 most common medical principal diagnoses are sepsis, heart failure, chronic obstructive pulmonary disease, pneumonia, myocardial infarction, ischemic stroke, urinary tract infection, cardiac arrhythmia, and other infection. The 6 most common procedures include newborn delivery (with and without caesarean section), joint replacement surgery, bariatric procedures, cardiac catheterizations, other abdominal surgeries, and thoracotomy. The predominant medical care model is internal medicine and physician assistant acute care hospitalists attending both medicine and surgical patients. Obstetrical hospitalists care for admitted obstetric patients. Patients admitted to the intensive care units had only critical care trained physician specialists as attending physicians. No trainees cared for the patients described in this study.
P&T Committee
The P&T committee is a multidisciplinary group of health care professionals selected for appointment by the chairs of the committee (chair of medicine and director of pharmacy) and approved by the president of the medical staff. The committee has oversight responsibility for all medication policies, order sets involving medications, as well as the monitoring of clinical outcomes as they regard medications.
Electronic Medical Record and Best Practice Advisory
Throughout this study period both pre-and post-intervention, the EMR in use was Epic (Verona WI), used for all ordering and lab results. A best practice advisory was in place in the EMR that alerted providers to all cases of thrombocytopenia < 100,000/mm3 when there was concurrent order for any heparin. The best practice advisory highlighted the thrombocytopenia, advised the providers to consider HIT as a diagnosis and to order confirmation tests if clinically appropriate, providing a direct link to the HIT assay order screen. The best practice advisory did not access information from prior admissions where heparin might have been used nor determine the percentage drop from the baseline platelet count.
HIT Case Definition and Assays
The 2 laboratory tests for HIT on which this study is based are the heparin-induced platelet antibody test (also known as anti-PF4) and the serotonin release assay. The heparin-induced platelet antibody test is an enzyme-linked immunosorbent assay (ELISA) that detects IgG, IgM, and IgA antibodies against the platelet factor 4 (PF4/heparin complex). This test was reported as positive if the optical density was 0.4 or higher and generated an automatic request for a serotonin release assay (SRA), which is a functional assay that measures heparin-dependent platelet activation. The decision to order the SRA was therefore a “reflex” test and not made with any knowledge of clinical characteristics of the case. The HIT assays were performed by a reference lab, Quest Diagnostics, in the Chantilly, VA facility. HIT was said to be present when both a characteristic pattern of thrombocytopenia occurring after heparin use was seen [1]and when the confirmatory SRA was positive at a level of > 20% release.
Order Set Modifications
After the P&T committee decision to emphasize UFH for VTE prophylaxis in October 2013, the relevant electronic order sets were altered to highlight the fact that UFH was the first choice for VTE prophylaxis. The order sets still allowed LMWH (enoxaparin) or alternative anticoagulants at the prescribers’ discretion but indicated they were a second choice. Doses of UFH and LMWH in the order sets were standard based upon weight and estimates of creatinine clearance and, in the case of dosing frequency for UFH, based upon the risk of VTE. Order sets for the therapeutic treatment of VTE were not changed.
Data Collection and Analysis
The clinical research committee, the local oversight board for research and performance improvement analyses, reviewed this project and determined that it qualified as a performance improvement analysis based upon the standards of the U.S. Office of Human Research Protections. Some data were extracted from patient medical records and stored in a customized and password-protected database. Access to the database was limited to members of the analysis team and stripped of all patient identifiers under the HIPAA privacy rule standard for de-identification from 45 CFR 164.514(b) immediately following the collection of all data elements from the medical record.
An internal pharmacy database was used to determine the volume and actual acquisition cost of prophylactic anticoagulant doses administered during both pre- and post-intervention time periods. To determine if clinical suspicion for HIT increased after the intervention, a definitive listing of all ordered HIT assays was obtained from laboratory billing records for the 9 months (January 2013–September 2013) before the conversion and for 25 months after the intervention (beginning in November 2013 so as not to include the conversion month). To determine if the HIT assays were associated with a higher risk score, we identified all cases in which the HIT assay was ordered and retroactively measured the probability score known as the 4T score [1].Simultaneously, separate clinical work groups reviewed all cases of hospital-acquired thrombosis, whatever their cause, including patients readmitted with thrombosis up to 30 days after discharge and episodes of bleeding due to anti-coagulant use. A chi square analysis of the incidence of HIT pre- and post-intervention was performed.
Results
Heparin Use and Acquisition Costs
HIT Assays and Incidence of HIT and HITT
In the 9 months pre-intervention, HIT and HITT occurred in zero of 6717 patients receiving at least 1 dose of VTE prophylaxis. In the 25 months of post-intervention follow-up, 44,240 patients received prophylaxis with either heparin. HIT (clinical suspicion with positive antibody and confirmatory SRA) occurred in 3 patients, 2 of whom had HITT, all after UFH. This incidence was not statistically significant using chi square analysis (P = 0.86).
Discussion
Because the efficacy of UFH and LMWH for VTE prophylaxis are equivalent [6],choosing between them involves many factors including patient-level risk factors such as renal function, risk of bleeding, as well as other considerations such as nursing time, patient preference, risk of HIT, and acquisition cost. Indeed, the most recent version of the American College of Chest Physicians guidelines for prophylaxis against VTE note that both drugs are recommended with an evidence grade of IB [7].Cost is among the considerations considered appropriate in choosing among agents. The difference in acquisition costs of > $20 per patient per day can have a major financial impact on hospital’s pharmacy budget and may be decisive. But a focus only on acquisition cost is short sighted as the 2 medications have different complication rates with regard to HIT. Thus the need to track HIT incidence after protocol changes are made is paramount.
In our study, we did not measure thrombocytopenia as an endpoint because acquired thrombocytopenia is too common and multifactorial to be a meaningful. Rather, we used the clinical suspicion for HIT as measured by both the number of times the BPA fired warnings of low platelets in the setting of recent heparin use and the number of times clinicians suspected HIT enough to order a HIT assay. We also used actual outcomes (clinically adjudicated cases of HIT and HITT). Our data shows substantial compliance among clinicians with the voluntary conversion to UFH with an immediate and sustained shift to UFH so that UFH was used in 86% of patients. Corresponding cost savings were achieved in heparin acquisition. Unlike some prior reports, there was a minimal burden of HIT as measured by the unchanged number of BPAs, monthly HIT assays and the unchanged clinical risk 4T scores among those patients in whom the test was ordered pre and post intervention. HIT rates were not statistically different after the order set conversion took effect.
Our results and study design are similar but not identical to that of Zhou et al, who found that a campaign to increase VTE prophylaxis resulted in 71% increase of UFH use over 5 years but no increase in number of HIT assays ordered or in the distribution of HIT assay results-both surrogate endpoints [5].But not all analyses of heparin order interventions show similar results. A recent study of a heparin avoidance program in a Canadian tertiary care hospital showed a reduction of 79% and 91% in adjudicated cases of HIT and HITT respectively [4].Moreover, hospital-related expenditures for HIT decreased by nearly $267,000 (Canadian dollars) per year though the additional acquisition costs of LMWH were not stated.A small retrospective heparin avoidance protocol among orthopedic surgery patients showed a reduction of HIT incidence from 5.2% with UFH to 0% with LMWH after universal substitution of LMWH for UFH [8].A recent systematic review identified only 3 prospective studies involving over 1398 postoperative surgical patients that measured HIT and HITT as outcomes [9].The review authors, in pooled analysis, found a lower incidence of HIT and HITT with LMWH postoperatively but downgraded the evidence to “low quality” due to methodologic issues and concerns over bias.A nested case-control study of adult medical patients found that HIT was 6 times more common with UFH than with LMWH and the cost of admissions associated with HIT was 3.5 times higher than for those without HIT, though this increase in costs are not necessarily due to the HIT diagnosis itself but may be markers of patients with more severe illness [10].The duration of heparin therapy was not stated.
There are several potential reasons that our data differs from some of the previous reports described above. We used a strict definition of HIT, requiring the serotonin release assay to be positive in the appropriate clinical setting and did not rely solely upon antibody tests to make the diagnosis, a less rigorous standard found in some studies. Furthermore, our results may differ from previously reports because of differences in patient risk and duration of therapy. Our institution does not perform cardiac surgery and the very large orthopedic surgery programs do not generally use heparin. Another potentially important difference in our study from prior studies is that many of the patients treated at this institution did not receive heparin long enough to be considered at risk; only a quarter were treated for longer than 5 days, generally considered a minumum [11].This is less than half of the duration of the patients in the studies included in the meta-analysis of HIT incidence [2].
We do not contend that UFH is as safe as LMWH with regard to HIT for all populatons, but rather that the increased risk is not manifest in all patient populations and settings and so the increased cost may not be justified in low-risk patients. Indeed while variability in HIT risk among patients is well documented [3,12], the guidelines for prophylaxis do not generally take this into account when recommending particular VTE prophylaxis strategies.Clinical practice guidelines do recommend different degrees of monitoring the platelet count based on risk of HIT however.
Our study had limitations, chief of which is the retrospective nature of the analysis; however, the methodology we used was similar to those of previous publications [4,5,8].We may have missed some cases of HIT if a clinician did not order the assay in all appropriate patients but there is no reason to think that likelihood was any different pre- and post-intervention. In addition, though we reviewed every case of hospital-acquired thrombosis, it is possible that the clinical reviewers may have missed cases of HITT, especially if the thrombosis occurred before a substantial drop in the platelet count, which is rare but possible. Here too the chance of missing actual cases did not change between the pre-and post-intervention. Our study examined prophylaxis with heparin use and not therapeutic uses. Finally, while noting the acquisition cost reduction achieved with conversion to UFH, we were not able to calculate any excess expense attributed to the rare case of HIT and HITT that occurred. We believe our results are generalizable to hospitals with similar patient profiles.
The idea that patients with different risk factors might do well with different prophylaxis strategies needs to be better appreciated. Such information could be used as a guide to more individualized prophylaxis strategy aided by clinical decision support embedded within the EMR. In this way the benefit of LMWH in avoiding HIT could be reserved for those patients at greatest risk of HIT while simultaneously allowing hospitals not to overspend for prophylaxis in patients who will not benefit from LMWH. Such a strategy would need to be tested prospectively before widespread adoption.
As a result of our internal analysis we have altered our EMR-based best practice alert to conform to the 2013 American Society of Hematology guidelines [15],which is more informative than our original BPA. Specifically, the old guideline only warned if the platelet count was < 100,000/mm3 in association with heparin. The revision notified if there is a > 30% fall regardless of the absolute count and informed prescribers of the 4T score to encourage more optimum use of the HIT assay, avoiding its use for low risk scores and encouraging its use for moderate to high risk scores. We are also strengthening the emphasis that moderate to high risk 4T patients receive alternative anticoagulation until results of the HIT assay are available as we found this not to be a be a universal practice. We recommend similar self-inspection to other institutions.
Corresponding author: Barry R. Meisenberg, MD, Anne Arundel Medical Center, 2001 Medical Parkway, Annapolis, MD 21401, Meisenberg@aahs.org.
Financial disclosures: None.
Author contributions: conception and design, JR, BRM; analysis and interpretation of data, KW, JR, BRM; drafting of article, JR, BRM; critical revision of the article, KW, JR, BRM; statistical expertise, KW, JR; administrative or technical support, JR; collection and assembly of data, KW, JR.
1. Lo GK, Juhl D, Warkentin TE, et al. Evaluation of pretest clinical score (4T’s) for the diagnosis of heparin-induced thrombocytopenia in two clinical settings. J Thromb Haemost 2006;4:759–65.
2. Martel N, Lee J, Wells PS. Risk for heparin-induced thrombocytopenia with unfractionated and low-molecular-weight heparin thromboprophylaxis: a meta-analysis. Blood 2005; 106:2710–5.
3. Warkentin TE, Sheppard JI, Horsewood P, et al. Impact of the patient population on the risk for heparin-induced thrombocytpenia Blood 2000; 96:1703–8.
4. McGowan KE, Makari J, Diamantouros A, et al. Reducing the hospital burden of heparin-induced thrombocytopenia: impact of an avoid heparin program. Blood 2016; 127:1954–9.
5. Zhou A, Winkler A, Emamifar A, et al. Is the incidence of heparin-induced thrombocytopenia affected by the increased use of heparin for VTE prophylaxis? Chest 2012; 142:1175–8.
6. Mismetti P, Laporte-Simitsidis S, Tardy B, et al. Prevention of venous thromboembolism in internal medicine with unfractionated or low-molecular-weight heparins: a meta-analysis of randomised clinical trials. Thromb Haemost 2000;83:14–19.
7. Guyatt GH, Akl EA, Crowther M, et al; for the American College of Chest Physicians Antithrombotic Therapy and Prevention of Thrombosis Panel. Antithrombotic therapy and prevention of thrombosis. 9th ed. American College of Chest Physicians Evidence-Based Clinical Practice Guidelines. Chest 2012;141(2 Suppl):7S–47S.
8. Greinacher A, Eichler P, Lietz T, Warkentin TE. Replacement of unfractionated heparin by low-molecular-weight heparin for postorthopedic surgery antithrombotic prophylaxis lowers the overall risk of symptomatic thrombosis because of a lower frequency of heparin-induced thrombocytopenia. Blood 2005;106:2921–2.
9. Junqueira DRG, Zorzela LM, Perini E. Unfractionated heparin versus low molecular weight heparin for avoiding heparin-induced thrombocytopenia in postoperative patients. Cochrane Database Syst Rev 2017;4:CD007557.
10. Creekmore FM, Oderda GM, Pendleton RC, Brixner DI. Incidence and economic implications of heparin-induced thrombocytopenia in medical patients receiving prophylaxis for venous thromboembolism. Pharmacotherapy 2006;26:1348–445.
11. Warkentin TE, Kelton JG. Temporal aspects of heparin-induced thrombocytopenia N Engl J Med 2001;344:1286–92.
12. Warkentin TE, Sheppard JA, Sigouin CS, et al. Gender imbalance and risk factor interactions in heparin-induced thrombocytopenia. Blood 2006;108:2937–41.
13. Camden R, Ludwig S. Prophylaxis against venous thromboembolism in hospitalized medically ill patients: Update and practical approach. Am J Health Syst Pharm 2012;71:909–17.
14. Linkins LA, Dans AL, Moores LK, et al. Treatment and prevention of heparin-induced thrombocytopenia. antithrombotic therapy and prevention of thrombosis. 9th ed. American College of Chest Physicians Evidence-Based Clinical Practice Guidelines. Chest 2012;141(2 Suppl):e495s–e530s.
15. Cuker A, Crowther MA. 2013 Clinical practice guideline on the evaluation and management of adults with suspected heparin-induced thrombocytopenia. Acessed 19 May 2017 at www.hematology.org/search.aspx?q=heparin+induced+thrombocytopenia.
A Comparison of Conventional and Expanded Physician Assistant Hospitalist Staffing Models at a Community Hospital
From Physicians Inpatient Care Specialists (MDICS), Hanover, MD (Dr. Capstack, Ms. Vollono), Versant Statistical Solutions, Raleigh, NC (Ms. Segujja), Anne Arundel Medical Center, Annapolis, MD (Dr. Moser [at the time of the study], Dr. Meisenberg), and Johns Hopkins Hospital, Baltimore, MD (Dr. Michtalik).
Abstract
- Objective: To determine whether a higher than conventional physician assistant (PA)–to-physician hospitalist staffing ratio can achieve similar clinical outcomes for inpatients at a community hospital.
- Methods: Retrospective cohort study comparing 2 hospitalist groups at a 384-bed community hospital, one with a high PA-to-physician ratio model (“expanded PA”), with 3 physicians/3 PAs and the PAs rounding on 14 patients a day (35.73% of all visits), and the other with a low PA-to-physician ratio model (“conventional”), with 9 physicians/2 PAs and the PAs rounding on 9 patients a day (5.89% of all visits). For 16,964 adult patients discharged by the hospitalist groups with a medical principal APR-DRG code between January 2012 and June 2013, in-hospital mortality, cost of care, readmissions, length of stay (LOS) and consultant use were analyzed using logistic regression and adjusted for age, insurance status, severity of illness, and risk of mortality.
- Results: No statistically significant differences were found between the 2 groups for in-hospital mortality (odds ratio [OR], 0.89 [95% confidence interval {CI}, 0.66–1.19]; P = 0.42), readmissions (OR, 0.95 [95% CI, 0.87–1.04]; P = 0.27), length of stay (effect size 0.99 days shorter LOS in expanded PA group, 95% CI, 0.97 to 1.01 days; P = 0.34) or consultant use (OR 1.00, 95% CI 0.94–1.07, P = 0.90). Cost of care was less in the expanded PA group (effect size 3.52% less; estimated cost $2644 vs $2724; 95% CI 2.66%–4.39%, P < 0.001).
- Conclusion: An expanded PA hospitalist staffing model at a community hospital provided similar outcomes at a lower cost of care.
Hospitalist program staffing models must optimize efficiency while maintaining clinical outcomes in order to increase value and decrease costs [1]. The cost of hospitalist programs is burdensome, with nearly 94% of groups nationally requiring financial support beyond professional fees [2]. Nationally, for hospitalist groups serving adults, average institutional support is over $156,000 per physician full time equivalent (FTE) (182 twelve-hour clinical shifts per calendar year) [2]. Significant savings could be achieved if less costly physician assistants could be incorporated into clinical teams to provide similar care without sacrificing quality.
Nurse practitioners (NPs) and physician assistants (PAs) have been successfully employed on academic hospitalist services to complement physician staffing [3–10]. They perform admissions, consults, rounding visits and discharges with physician collaboration as permitted by each group’s policies and in accordance with hospital by-laws and state regulations. A median of 0.25 NP and 0.28 PA FTEs per physician FTE are employed by hospitalist groups that incorporate them, though staffing ratios vary widely [2].
Physicians Inpatient Care Specialists (MDICS) devel-oped a staffing model that deploys PAs to see a large proportion of its patients collaboratively with physicians, and with a higher patient census per PA than has been previously reported [2–5]. The group leaders believed that this would yield similar outcomes for patients at a lower cost to the supporting institution than a conventional staffing model which used fewer PAs to render patient care. Prior inpatient studies have demonstrated comparable clinical outcomes when comparing hospitalist PAs and NPs to residents and fellows [4–10], but to our knowledge no data exist directly comparing hospitalist PAs to hospitalist physicians. This study goes beyond prior work by examining the community, non-teaching setting, and directly comparing outcomes from the expanded use of PAs to those of a hospitalist group staffed with a greater proportion of attending physicians at the same hospital during the same time.
Methods
Setting
The study was performed at Anne Arundel Medical Center (AAMC), a 384-bed community hospital in Annapolis, Maryland, that serves a region of over 1 million people. Approximately 26,000 adult patients are discharged annually. During the study, more than 90% of internal medicine service inpatients were cared for by one of 2 hospitalist groups: a hospital-employed group (“conventional” group, Anne Arundel Medical Group) and a contracted hospitalist group (“expanded PA” group, Physicians Inpatient Care Specialists). The conventional group’s providers received a small incentive for Core Measures compliance for patients with stroke, myocardial infarction, congestive heart failure and pneumonia. The expanded PA group received a flat fee for providing hospitalist services and the group’s providers received a small incentive for productivity from their employer. The study was deemed exempt by the AAMC institutional review board.
Staffing Models, Patient Allocation, and Assignment
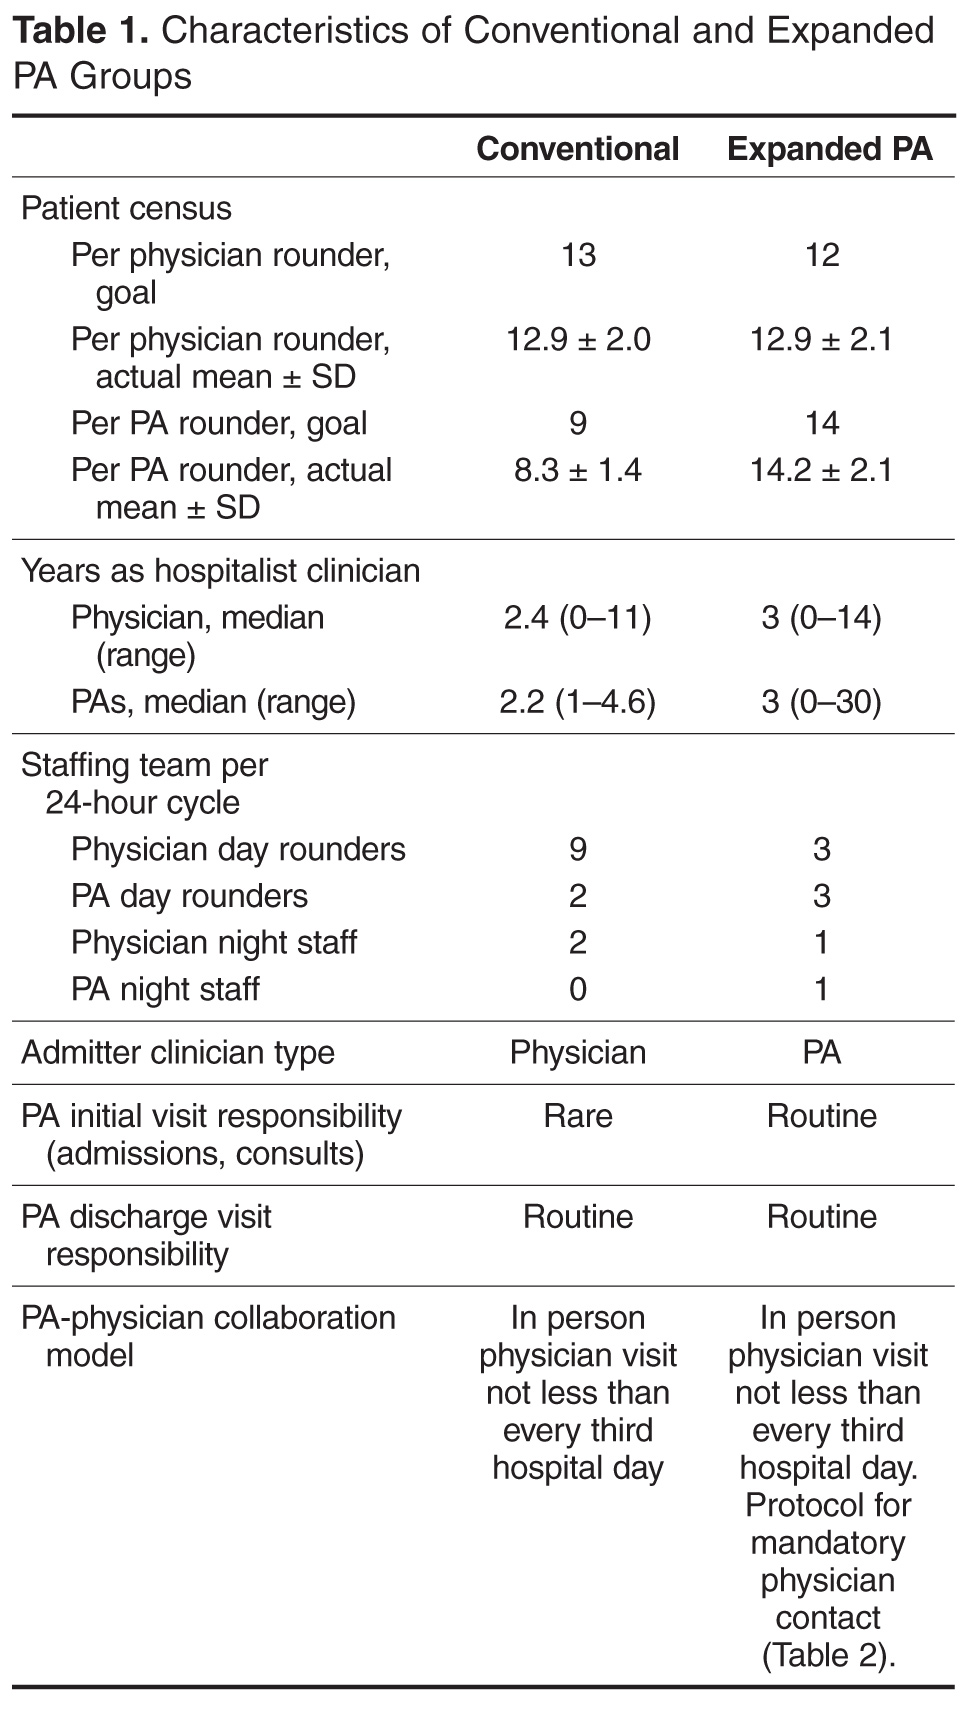
Admitted patients were designated to be admitted to one group or the other on the basis of standing arrangements with the patients’ primary care providers. Consultative referrals could also be made from subspecialists, who had discretion as to which group they wished to use.
Each morning, following sign-out report from the night team, each team of day providers determined which patients would be seen by which of their providers. Patients still on service from the previous day would be seen by the same provider again whenever possible in order to maintain continuity. Each individual provider had their own patients for the day who they rounded on independently and were responsible for. Physician involvement with patients seen primarily by PAs occurred as described below. Physicians in both groups were expected to take primary rounding responsibility for patients who were more acute or more complex based on morning sign-out report; there was no more formal mandate for patient allocation to particular provider type.
Physician-PA Collaboration
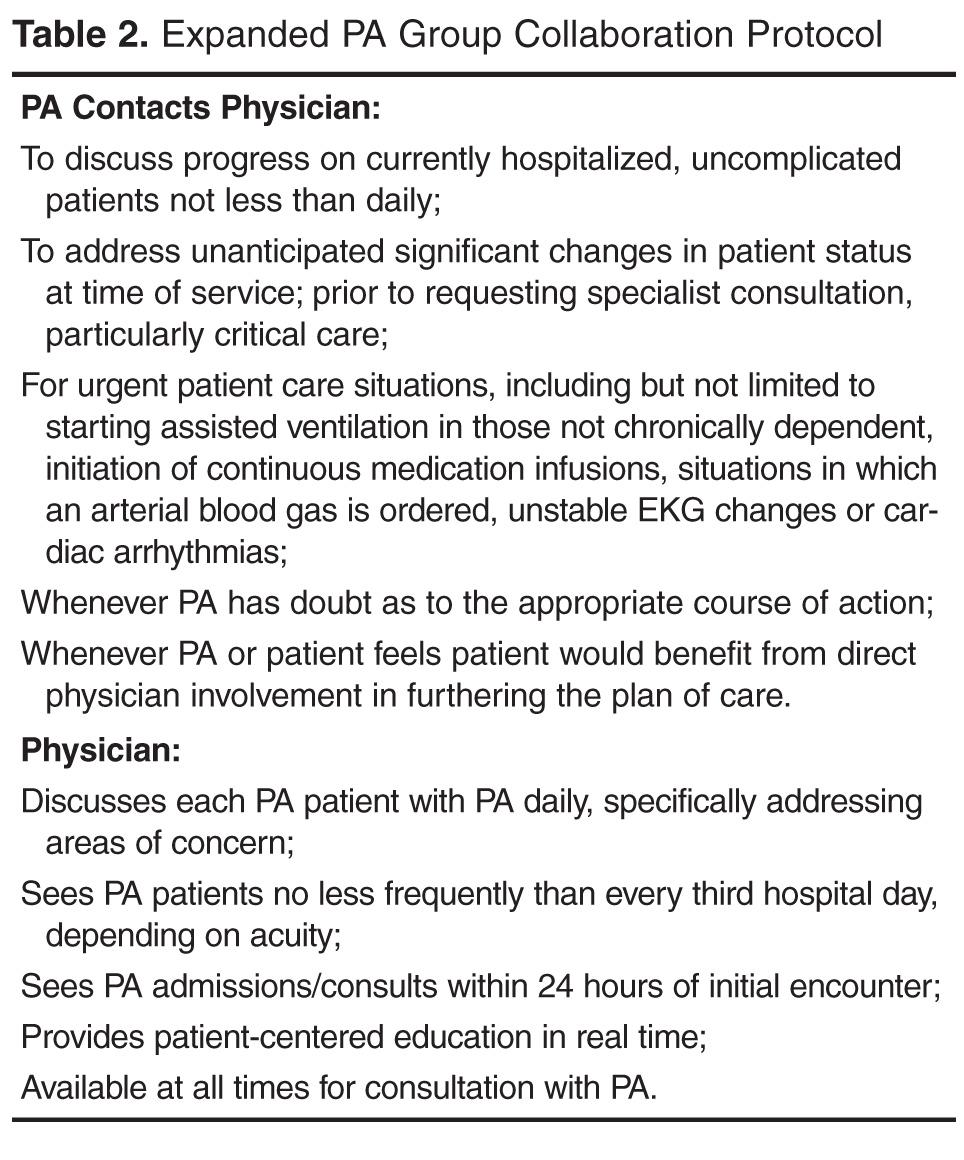
Patients
Patients discharged between 1 January 2012 and 30 June 2013 by the hospitalist groups were identified by searching AAMC’s Crimson Continuuum of Care (The Advisory Board, Washington, DC), a software analytic tool that is integrated with coded clinical data. Adult patient hospitalizations determined by Crimson to have a medical (non-surgical, non-obstetrical) APR-DRG code as the final principal diagnosis were included. Critically ill patients or those appropriate for “step-down unit” care were cared for by the in-house critical care staff; upon transfer out of critical or step-down care, patients were referred back to the admitting hospitalist team. A diagnosis (and its associated hospitalizations) was excluded for referral bias if the diagnosis was the principal diagnosis for at least 1% of a group’s discharges and the percentage of patients with that diagnosis was at least two times greater in one group than the other. Hospitalizations with a diagnosis of “ungroupable” (APR-DRG 956) were also excluded.
Measurements
Demographic, insurance status, cost of care, length of stay (LOS), APR-DRG (All Patient Refined Diagnosis-Related Group) severity of illness (SOI) and risk of mortality (ROM), consultant utilization, 30-day all-cause readmission (“readmission rate”), and mortality information was obtained from administrative data and exported into a single database for statistical analysis. Readmissions, inpatient mortality, and cost of care were the primary outcomes; consultant use and length of stay were secondary outcomes. A hospitalization was considered a readmission if the patient returned to inpatient status at AAMC for any reason within 30 days of a previous inpatient discharge. Inpatient mortality was defined as patient death during hospitalization. The cost of care was measured using the case charges associated with each encounter. Charge capture data from both groups was analyzed to classify visits as “physician-only,” “physician co-visit,” and “PA-only” visits. A co-visit consists of the physician visiting the patient after the PA has already done so on the same day, taking their own history and performing their own physical exam, and writing a brief progress note. These data were compared against the exported administrative data to find matching encounters and associated visits, with only matching visits included in the analysis. If a duplicate charge was entered on the same day for a patient, any conflict was resolved in favor of the physician visit. A total of 49,883 and 28,663 matching charges were identified for the conventional and expanded PA groups.
Statistical Methods
Odds of inpatient mortality were calculated using logistic regression and adjusted for age, insurance status, APR-DRG ROM, and LOS. Odds of readmission were calculated using logistic regression and adjusted for age, LOS, insurance and APR-DRG SOI. Cost of care (effect size) was examined using multiple linear regression and adjusted for age, APR-DRG SOI, insurance status and LOS. This model was fit using the logarithmic transformations of cost of care and LOS to correct deviation from normality. Robust regression using MM estimation was used to estimate group effects due to the existence of outliers and high leverage points. Length of stay (effect size) was assessed using the log-transformed variable and adjusted for APR-DRG SOI, age, insurance status and consultant use. Finally, category logistic regression models were fit to estimate the odds of consultant use in the study groups and adjusted for age, LOS, insurance status and APR-DRG SOI.
Results
Records review identified 17,294 adult patient hospitalizations determined by Crimson to have a medical (non-surgical, non-obstetrical) APR-DRG code as the final principal diagnosis. We excluded 15 expanded PA and 11 conventional hospitalizations that fell under APR-DRG code 956 “ungroupable.” Exclusion for referral bias resulted in the removal of 304 hospitalizations, 207 (3.03%) from the expanded PA group and 97 (0.92%) from the conventional group. These excluded hospitalizations came from 2 APR-DRG codes, urinary stones (code 465) and “other kidney and urinary tract diagnoses” (code 468). This left 6612 hospitalizations in the expanded PA group and 10,352 in the conventional group.
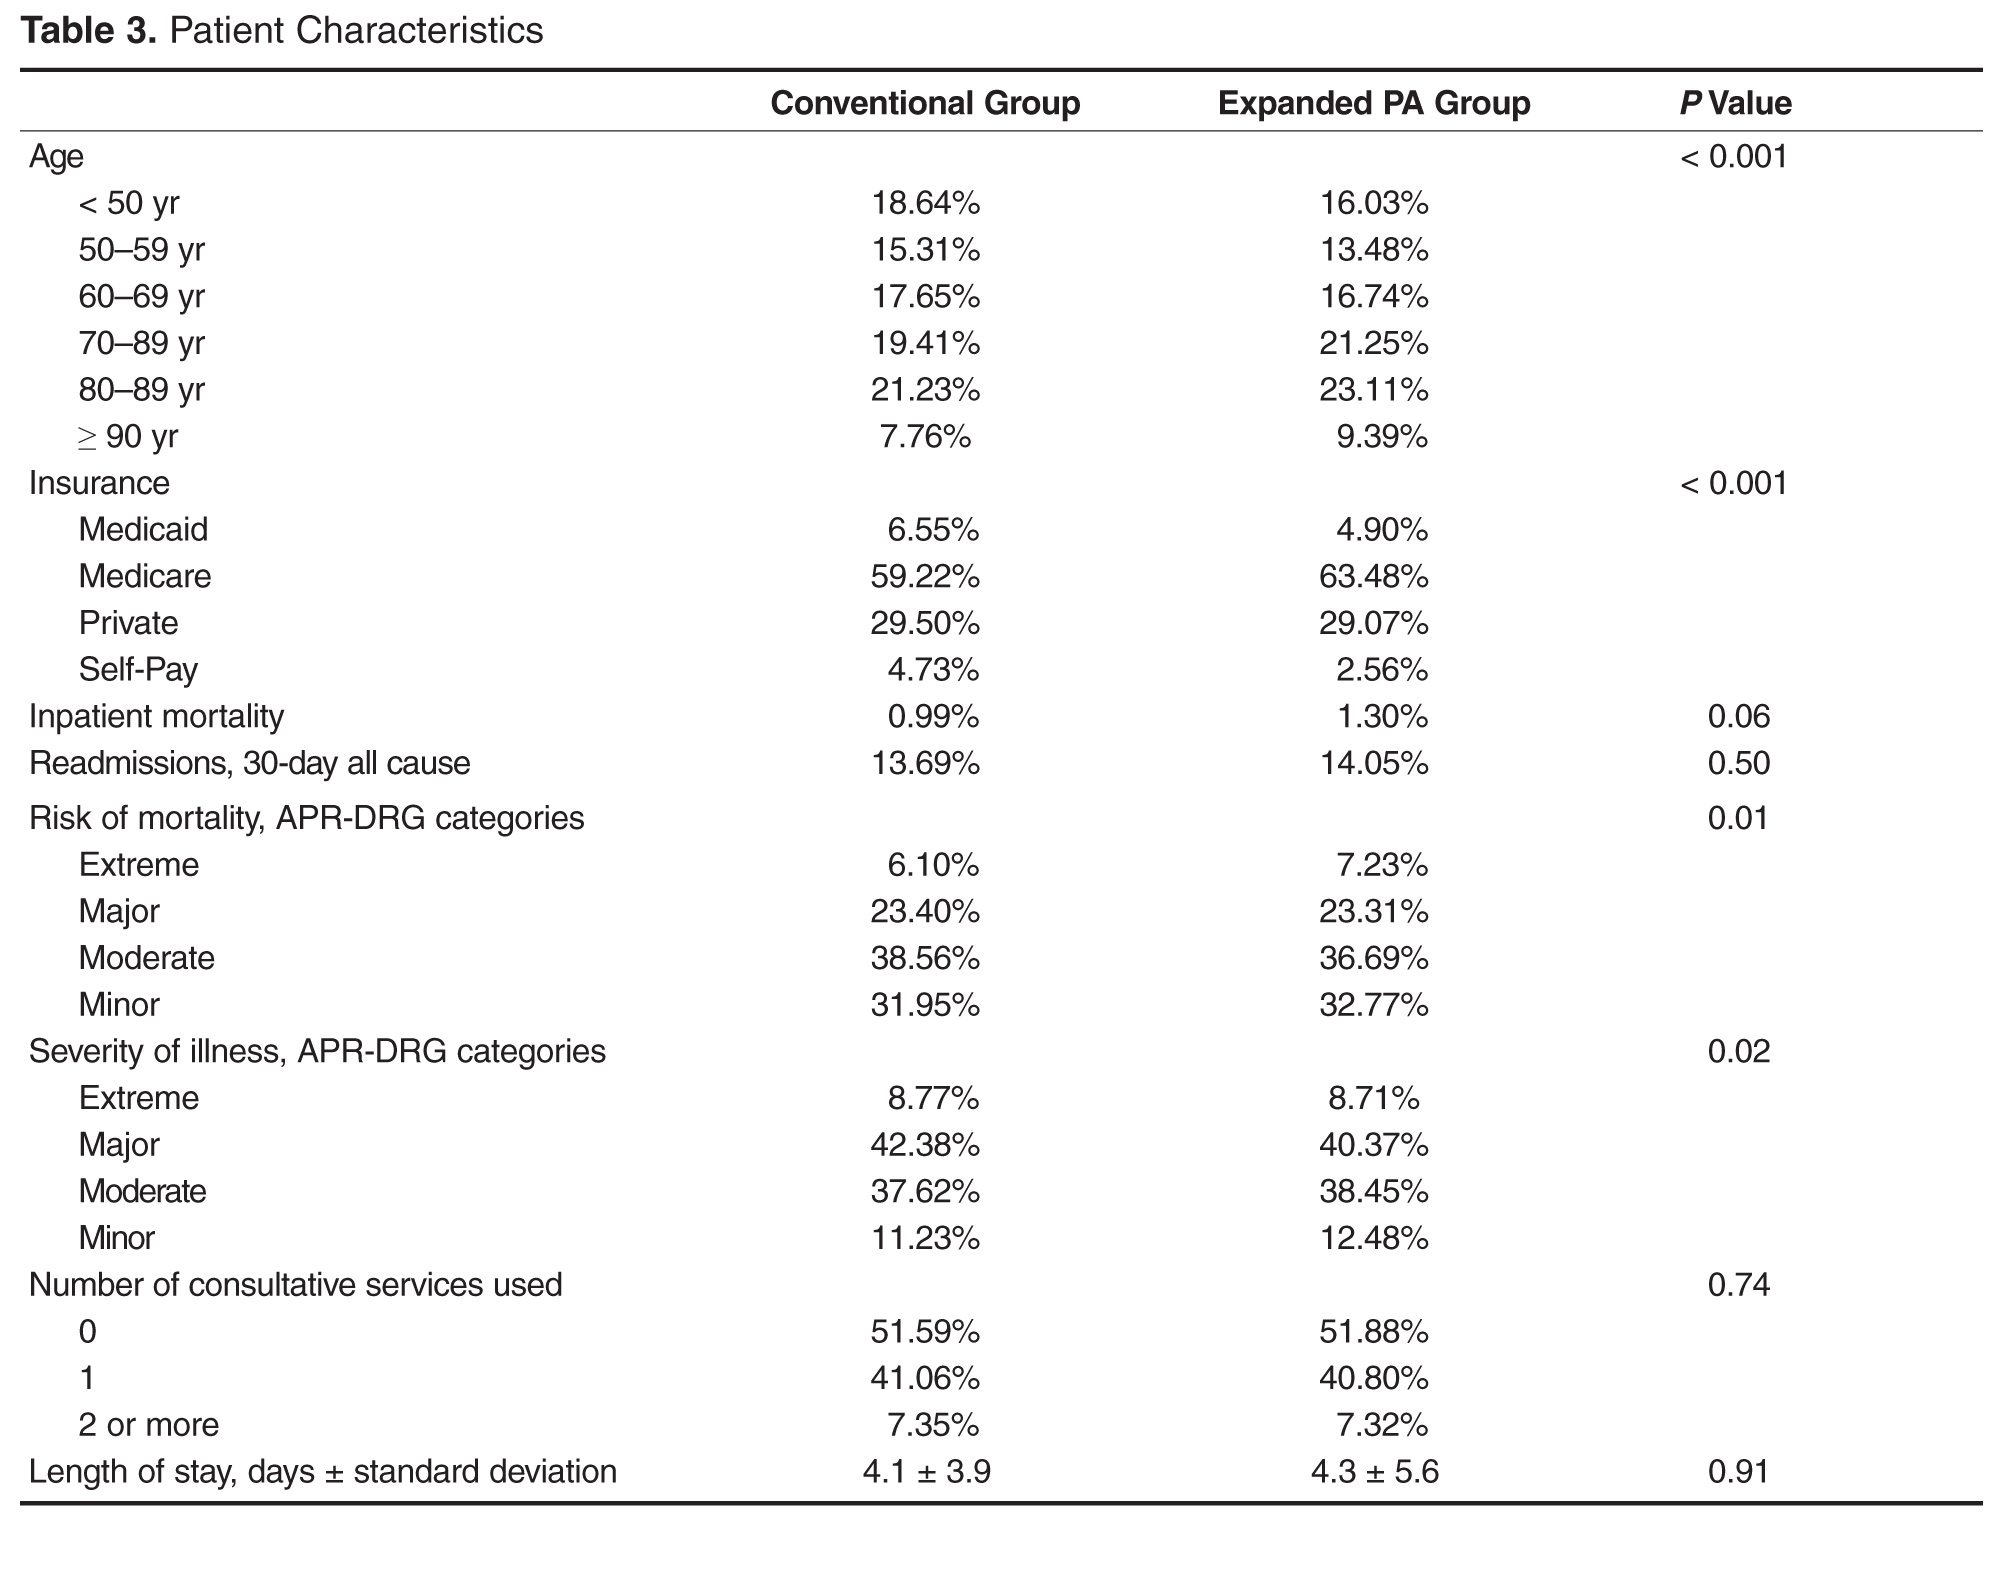
Charge capture data for both groups was used to determine the proportion of encounters rendered by each provider type or combination. In the expanded PA group, 35.73% of visits (10,241 of 28,663) were conducted by a PA, and 64.27% were conducted by a physician or by a PA with a billable physician “co-visit.” In the conventional group, 5.89% of visits (2938 of 49,883) were conducted by a PA, and 94.11% were conducted by a physician only or by a PA with a billable physician “co-visit”.
Readmissions
Overall, 929 of 6612 (14.05%) and 1417 of 10,352 (13.69%) patients were readmitted after being discharged by the expanded PA and conventional groups, respectively. After multivariate analysis, there was no statistically significant difference in odds of readmission between the groups (OR for conventional group, 0.95 [95% CI, 0.87–1.04]; P = 0.27).
Inpatient Mortality
Unadjusted inpatient mortality for the expanded PA group was 1.30% and 0.99% for the conventional group. After multivariate analysis, there was no statistically significant difference in odds of in-hospital mortality between the groups (OR for conventional group, 0.89 [95% CI, 0.66–1.19]; P = 0.42).
Patient Charges
The unadjusted mean patient charge in the expanded PA group was $7822 ± $7755 and in the conventional group mean patient charge was $8307 ± 10,034. Multivariate analysis found significantly lower adjusted patient charges in the expanded PA group relative to the conventional group (3.52% lower in the expanded PA group [95% CI, 2.66%–4.39%, P < 0.001). When comparing a “standard” patient who was between 80–89 and had Medicare insurance and an SOI of “major,” the cost of care was $2644 in the expanded PA group vs $2724 in the conventional group.
Length of Stay
Unadjusted mean length of stay was 4.1 ± 3.9 days and 4.3 ± 5.6 days for the expanded PA and conventional groups, respectively. After multivariate analysis, when comparing the statistical model “standard” patient, there was no significant difference in the length of stay between the 2 groups (effect size, 0.99 days shorter LOS in the expanded PA group [95% CI, 0.97–1.01 days]; P = 0.34)
Consultant Use
Utilization of consultants was also assessed. The expanded PA group used a mean of 0.55 consultants per case, and the conventional group used 0.56. After multivariate adjustment, there was no significant difference in consulting service use between groups (OR 1.00 [95% CI, 0.94–1.07]; P = 0.90).
Discussion
Maximizing value and minimizing health care costs is a national priority. To our knowledge, this is the first study to compare hospitalist PAs in a community, non-teaching practice directly and contemporaneously to peer PAs and attending physicians and examine the impact on outcomes. In our study, a much larger proportion of patient visits were conducted primarily by PAs without a same-day physician visit in the expanded PA group (35.73%, vs 5.89% in the conventional group). There was no statistically significant difference in inpatient mortality, length of stay or readmissions. In addition, costs of care measured as hospital charges to patients were lower in the expanded PA group. Consultants were not used disproportionately by the expanded PA group in order to achieve these results. Our results are consistent with studies that have compared PAs and NPs at academic centers to traditional housestaff teams and which show that services staffed with PAs or NPs that provide direct care to medical inpatients are non-inferior [4–10].
This study’s expanded PA group’s PAs rounded on 14 patients per day, close to the “magic 15” that is considered by many a good compromise for hospitalist physicians between productivity and quality [11,12]. This is substantially more than the 6 to 10 patients PAs have been responsible for in previously reported studies [3,4,6]. As the median salary for a PA hospitalist is $102,960 compared with the median internal medicine physician hospitalist salary of $253,977 [2], using hospitalist PAs in a collaboration model as described herein could result in significant savings for supporting institutions without sacrificing quality.
We recognize several limitations to this study. First, the data were obtained retrospectively from a single center and patient assignment between groups was nonrandomized. The significant differences in the baseline characteristics of patients between the study groups, however, were adjusted for in multivariate analysis, and potential referral bias was addressed through our exclusion criteria. Second, our comparison relied on coding rather than clinical data for diagnosis grouping. However, administrative data is commonly used to determine the primary diagnosis for study patients and the standard for reimbursement. Third, we recognize that there may have been unmeasured confounders that may have affected the outcomes. However, the same resources, including consultants and procedure services, were readily available to both groups and there was no significant difference in consultation rates. Fourth, “cost of care” was measured as overall charges to patients, not cost to the hospital. However, given that all the encounters occurred at the same hospital in the same time frame, the difference should be proportional and equal between groups. Finally, our readmission rates did not account for patients readmitted to other institutions. However, there should not have been a differential effect between the 2 study groups, given the shared patient catchment area and our exclusion for referral bias.
It should also be noted that the expanded PA group used a structured collaboration framework and incorporated a structured education program for its PAs. These components are integral to the expanded PA model, and our results may not be generalizable outside of a similar framework. The expanded PA group’s PAs were carefully selected at the time of hire, specifically educated, and supported through ongoing collaboration to provide efficient and appropriate care at the “top of their licenses”. Not all medical groups will be able to provide this level of support and education, and not all hospitalist PAs will want to and/or be able to reach this level of proficiency. However, successful implementation is entirely achievable for groups that invest the effort. The MDICS education process included 80 hours of didactic sessions spread over several months and is based on the Society of Hospital Medicine Core Competencies [13] as well as 6 months of supervised bedside education with escalating clinical responsibilities under the tutelage of an experienced physician or PA. Year-long academic PA fellowships have also been developed for purposes of similar training at several institutions [14].
Conclusion
Our results show that expanded use of well-educated PAs functioning within a formal collaboration arrangement with physicians provides similar clinical quality to a conventional PA staffing model with no excess patient care costs. The model also allows substantial salary savings to supporting institutions, which is important to hospital and policy stakeholders given the implications for hospitalist group staffing, increasing value, and allocation of precious time and financial resources.
Acknowledgements: The authors wish to thank Kevin Funk, MBA, of MDICS, Clarence Richardson, MBA, of GeBBs Software International, and Heather Channing, Kayla King, and Laura Knox of Anne Arundel Healthcare Enterprise, who provided invaluable help with the data aggregation used for this study.
Corresponding author: Timothy M. Capstack, MD, 7250 Parkway Dr, Suite 500, Hanover, MD 21076, tcapstack@mdics.com.
Financial disclosures: Dr. Capstack has ownership interest in Physicians Inpatient Care Specialists (MDICS). Ms. Segujja received compensation from MDICS for statistical analysis.
1. Michtalik HJ, Pronovost PJ, Marsteller JA, et al. Developing a model for attending physician workload and outcomes. JAMA Intern Med 2013;173:1026–8.
2. Society of Hospital Medicine. State of hospital medicine report. Philadelphia: Society of Hospital Medicine; 2014.
3. Kartha A, Restuccia J, Burgess J, et al. Nurse practitioner and physician assistant scope of practice in 118 acute care hospitals. J Hosp Med 2014;9:615–20.
4. Dhuper S, Choksi S. Replacing an academic internal medicine residency program with a physician assistant--hospitalist model: a comparative analysis study. Am J Med Qual 2008;24:132–9.
5. Morris D, Reilly P, Rohrbach J, et al. The influence of unit-based nurse practitioners on hospital outcomes and readmission rates for patients with trauma. J Trauma Acute Care Surg 2012;73:474–8.
6. Roy C, Liang C, Lund M, et al. Implementation of a physician assistant/hospitalist service in an academic medical center: impact on efficiency and patient outcomes. J Hosp Med 2008;3:361–8.
7. Singh S, Fletcher K, Schapira M, et al. A comparison of outcomes of general medical inpatient care provided by a hospitalist-physician assistant model vs a traditional resident-based model. J Hosp Med 2011;6:122–30.
8. Hoffman L, Tasota F, Zullo T, et al. Outcomes of care managed by an acute care nurse practitioner/attending physician team in an subacute medical intensive care unit. Am J Crit Care 2005;14:121–30.
9. Kapu A, Kleinpell R, Pilon B. Quality and financial impact of adding nurse practitioners to inpatient care teams. J Nurs Adm 2014;44:87–96.
10. Cowan M, Shapiro M, Hays R, et al. The effect of a multidisciplinary hospitalist/physician and advanced practice nurse collaboration on hospital costs. J Nurs Adm 2006;36:79–85.
11. Michtalik HJ, Yeh HC, Pronovost PJ, Brotman DJ. Impact of attending physician workload on patient care: A survey of hospitalists. JAMA Intern Med 2013;173:375–7.
12. Elliott D, Young R, Brice J, et al. Effect of hospitalist workload on the quality and efficiency of care. JAMA Internal Med 2014;174:786–93.
13. McKean S, Budnitz T, Dressler D, et al. How to use the core competencies in hospital medicine: a framework for curriculum development. J Hosp Med 2006; 1 Suppl 1:57–67.
14. Will K, Budavari A, Wilkens J, et al. A hospitalist postgraduate training program for physician assistants. J Hosp Med 2010;5:94–8.
From Physicians Inpatient Care Specialists (MDICS), Hanover, MD (Dr. Capstack, Ms. Vollono), Versant Statistical Solutions, Raleigh, NC (Ms. Segujja), Anne Arundel Medical Center, Annapolis, MD (Dr. Moser [at the time of the study], Dr. Meisenberg), and Johns Hopkins Hospital, Baltimore, MD (Dr. Michtalik).
Abstract
- Objective: To determine whether a higher than conventional physician assistant (PA)–to-physician hospitalist staffing ratio can achieve similar clinical outcomes for inpatients at a community hospital.
- Methods: Retrospective cohort study comparing 2 hospitalist groups at a 384-bed community hospital, one with a high PA-to-physician ratio model (“expanded PA”), with 3 physicians/3 PAs and the PAs rounding on 14 patients a day (35.73% of all visits), and the other with a low PA-to-physician ratio model (“conventional”), with 9 physicians/2 PAs and the PAs rounding on 9 patients a day (5.89% of all visits). For 16,964 adult patients discharged by the hospitalist groups with a medical principal APR-DRG code between January 2012 and June 2013, in-hospital mortality, cost of care, readmissions, length of stay (LOS) and consultant use were analyzed using logistic regression and adjusted for age, insurance status, severity of illness, and risk of mortality.
- Results: No statistically significant differences were found between the 2 groups for in-hospital mortality (odds ratio [OR], 0.89 [95% confidence interval {CI}, 0.66–1.19]; P = 0.42), readmissions (OR, 0.95 [95% CI, 0.87–1.04]; P = 0.27), length of stay (effect size 0.99 days shorter LOS in expanded PA group, 95% CI, 0.97 to 1.01 days; P = 0.34) or consultant use (OR 1.00, 95% CI 0.94–1.07, P = 0.90). Cost of care was less in the expanded PA group (effect size 3.52% less; estimated cost $2644 vs $2724; 95% CI 2.66%–4.39%, P < 0.001).
- Conclusion: An expanded PA hospitalist staffing model at a community hospital provided similar outcomes at a lower cost of care.
Hospitalist program staffing models must optimize efficiency while maintaining clinical outcomes in order to increase value and decrease costs [1]. The cost of hospitalist programs is burdensome, with nearly 94% of groups nationally requiring financial support beyond professional fees [2]. Nationally, for hospitalist groups serving adults, average institutional support is over $156,000 per physician full time equivalent (FTE) (182 twelve-hour clinical shifts per calendar year) [2]. Significant savings could be achieved if less costly physician assistants could be incorporated into clinical teams to provide similar care without sacrificing quality.
Nurse practitioners (NPs) and physician assistants (PAs) have been successfully employed on academic hospitalist services to complement physician staffing [3–10]. They perform admissions, consults, rounding visits and discharges with physician collaboration as permitted by each group’s policies and in accordance with hospital by-laws and state regulations. A median of 0.25 NP and 0.28 PA FTEs per physician FTE are employed by hospitalist groups that incorporate them, though staffing ratios vary widely [2].
Physicians Inpatient Care Specialists (MDICS) devel-oped a staffing model that deploys PAs to see a large proportion of its patients collaboratively with physicians, and with a higher patient census per PA than has been previously reported [2–5]. The group leaders believed that this would yield similar outcomes for patients at a lower cost to the supporting institution than a conventional staffing model which used fewer PAs to render patient care. Prior inpatient studies have demonstrated comparable clinical outcomes when comparing hospitalist PAs and NPs to residents and fellows [4–10], but to our knowledge no data exist directly comparing hospitalist PAs to hospitalist physicians. This study goes beyond prior work by examining the community, non-teaching setting, and directly comparing outcomes from the expanded use of PAs to those of a hospitalist group staffed with a greater proportion of attending physicians at the same hospital during the same time.
Methods
Setting
The study was performed at Anne Arundel Medical Center (AAMC), a 384-bed community hospital in Annapolis, Maryland, that serves a region of over 1 million people. Approximately 26,000 adult patients are discharged annually. During the study, more than 90% of internal medicine service inpatients were cared for by one of 2 hospitalist groups: a hospital-employed group (“conventional” group, Anne Arundel Medical Group) and a contracted hospitalist group (“expanded PA” group, Physicians Inpatient Care Specialists). The conventional group’s providers received a small incentive for Core Measures compliance for patients with stroke, myocardial infarction, congestive heart failure and pneumonia. The expanded PA group received a flat fee for providing hospitalist services and the group’s providers received a small incentive for productivity from their employer. The study was deemed exempt by the AAMC institutional review board.
Staffing Models, Patient Allocation, and Assignment
Admitted patients were designated to be admitted to one group or the other on the basis of standing arrangements with the patients’ primary care providers. Consultative referrals could also be made from subspecialists, who had discretion as to which group they wished to use.
Each morning, following sign-out report from the night team, each team of day providers determined which patients would be seen by which of their providers. Patients still on service from the previous day would be seen by the same provider again whenever possible in order to maintain continuity. Each individual provider had their own patients for the day who they rounded on independently and were responsible for. Physician involvement with patients seen primarily by PAs occurred as described below. Physicians in both groups were expected to take primary rounding responsibility for patients who were more acute or more complex based on morning sign-out report; there was no more formal mandate for patient allocation to particular provider type.
Physician-PA Collaboration
Patients
Patients discharged between 1 January 2012 and 30 June 2013 by the hospitalist groups were identified by searching AAMC’s Crimson Continuuum of Care (The Advisory Board, Washington, DC), a software analytic tool that is integrated with coded clinical data. Adult patient hospitalizations determined by Crimson to have a medical (non-surgical, non-obstetrical) APR-DRG code as the final principal diagnosis were included. Critically ill patients or those appropriate for “step-down unit” care were cared for by the in-house critical care staff; upon transfer out of critical or step-down care, patients were referred back to the admitting hospitalist team. A diagnosis (and its associated hospitalizations) was excluded for referral bias if the diagnosis was the principal diagnosis for at least 1% of a group’s discharges and the percentage of patients with that diagnosis was at least two times greater in one group than the other. Hospitalizations with a diagnosis of “ungroupable” (APR-DRG 956) were also excluded.
Measurements
Demographic, insurance status, cost of care, length of stay (LOS), APR-DRG (All Patient Refined Diagnosis-Related Group) severity of illness (SOI) and risk of mortality (ROM), consultant utilization, 30-day all-cause readmission (“readmission rate”), and mortality information was obtained from administrative data and exported into a single database for statistical analysis. Readmissions, inpatient mortality, and cost of care were the primary outcomes; consultant use and length of stay were secondary outcomes. A hospitalization was considered a readmission if the patient returned to inpatient status at AAMC for any reason within 30 days of a previous inpatient discharge. Inpatient mortality was defined as patient death during hospitalization. The cost of care was measured using the case charges associated with each encounter. Charge capture data from both groups was analyzed to classify visits as “physician-only,” “physician co-visit,” and “PA-only” visits. A co-visit consists of the physician visiting the patient after the PA has already done so on the same day, taking their own history and performing their own physical exam, and writing a brief progress note. These data were compared against the exported administrative data to find matching encounters and associated visits, with only matching visits included in the analysis. If a duplicate charge was entered on the same day for a patient, any conflict was resolved in favor of the physician visit. A total of 49,883 and 28,663 matching charges were identified for the conventional and expanded PA groups.
Statistical Methods
Odds of inpatient mortality were calculated using logistic regression and adjusted for age, insurance status, APR-DRG ROM, and LOS. Odds of readmission were calculated using logistic regression and adjusted for age, LOS, insurance and APR-DRG SOI. Cost of care (effect size) was examined using multiple linear regression and adjusted for age, APR-DRG SOI, insurance status and LOS. This model was fit using the logarithmic transformations of cost of care and LOS to correct deviation from normality. Robust regression using MM estimation was used to estimate group effects due to the existence of outliers and high leverage points. Length of stay (effect size) was assessed using the log-transformed variable and adjusted for APR-DRG SOI, age, insurance status and consultant use. Finally, category logistic regression models were fit to estimate the odds of consultant use in the study groups and adjusted for age, LOS, insurance status and APR-DRG SOI.
Results
Records review identified 17,294 adult patient hospitalizations determined by Crimson to have a medical (non-surgical, non-obstetrical) APR-DRG code as the final principal diagnosis. We excluded 15 expanded PA and 11 conventional hospitalizations that fell under APR-DRG code 956 “ungroupable.” Exclusion for referral bias resulted in the removal of 304 hospitalizations, 207 (3.03%) from the expanded PA group and 97 (0.92%) from the conventional group. These excluded hospitalizations came from 2 APR-DRG codes, urinary stones (code 465) and “other kidney and urinary tract diagnoses” (code 468). This left 6612 hospitalizations in the expanded PA group and 10,352 in the conventional group.
Charge capture data for both groups was used to determine the proportion of encounters rendered by each provider type or combination. In the expanded PA group, 35.73% of visits (10,241 of 28,663) were conducted by a PA, and 64.27% were conducted by a physician or by a PA with a billable physician “co-visit.” In the conventional group, 5.89% of visits (2938 of 49,883) were conducted by a PA, and 94.11% were conducted by a physician only or by a PA with a billable physician “co-visit”.
Readmissions
Overall, 929 of 6612 (14.05%) and 1417 of 10,352 (13.69%) patients were readmitted after being discharged by the expanded PA and conventional groups, respectively. After multivariate analysis, there was no statistically significant difference in odds of readmission between the groups (OR for conventional group, 0.95 [95% CI, 0.87–1.04]; P = 0.27).
Inpatient Mortality
Unadjusted inpatient mortality for the expanded PA group was 1.30% and 0.99% for the conventional group. After multivariate analysis, there was no statistically significant difference in odds of in-hospital mortality between the groups (OR for conventional group, 0.89 [95% CI, 0.66–1.19]; P = 0.42).
Patient Charges
The unadjusted mean patient charge in the expanded PA group was $7822 ± $7755 and in the conventional group mean patient charge was $8307 ± 10,034. Multivariate analysis found significantly lower adjusted patient charges in the expanded PA group relative to the conventional group (3.52% lower in the expanded PA group [95% CI, 2.66%–4.39%, P < 0.001). When comparing a “standard” patient who was between 80–89 and had Medicare insurance and an SOI of “major,” the cost of care was $2644 in the expanded PA group vs $2724 in the conventional group.
Length of Stay
Unadjusted mean length of stay was 4.1 ± 3.9 days and 4.3 ± 5.6 days for the expanded PA and conventional groups, respectively. After multivariate analysis, when comparing the statistical model “standard” patient, there was no significant difference in the length of stay between the 2 groups (effect size, 0.99 days shorter LOS in the expanded PA group [95% CI, 0.97–1.01 days]; P = 0.34)
Consultant Use
Utilization of consultants was also assessed. The expanded PA group used a mean of 0.55 consultants per case, and the conventional group used 0.56. After multivariate adjustment, there was no significant difference in consulting service use between groups (OR 1.00 [95% CI, 0.94–1.07]; P = 0.90).
Discussion
Maximizing value and minimizing health care costs is a national priority. To our knowledge, this is the first study to compare hospitalist PAs in a community, non-teaching practice directly and contemporaneously to peer PAs and attending physicians and examine the impact on outcomes. In our study, a much larger proportion of patient visits were conducted primarily by PAs without a same-day physician visit in the expanded PA group (35.73%, vs 5.89% in the conventional group). There was no statistically significant difference in inpatient mortality, length of stay or readmissions. In addition, costs of care measured as hospital charges to patients were lower in the expanded PA group. Consultants were not used disproportionately by the expanded PA group in order to achieve these results. Our results are consistent with studies that have compared PAs and NPs at academic centers to traditional housestaff teams and which show that services staffed with PAs or NPs that provide direct care to medical inpatients are non-inferior [4–10].
This study’s expanded PA group’s PAs rounded on 14 patients per day, close to the “magic 15” that is considered by many a good compromise for hospitalist physicians between productivity and quality [11,12]. This is substantially more than the 6 to 10 patients PAs have been responsible for in previously reported studies [3,4,6]. As the median salary for a PA hospitalist is $102,960 compared with the median internal medicine physician hospitalist salary of $253,977 [2], using hospitalist PAs in a collaboration model as described herein could result in significant savings for supporting institutions without sacrificing quality.
We recognize several limitations to this study. First, the data were obtained retrospectively from a single center and patient assignment between groups was nonrandomized. The significant differences in the baseline characteristics of patients between the study groups, however, were adjusted for in multivariate analysis, and potential referral bias was addressed through our exclusion criteria. Second, our comparison relied on coding rather than clinical data for diagnosis grouping. However, administrative data is commonly used to determine the primary diagnosis for study patients and the standard for reimbursement. Third, we recognize that there may have been unmeasured confounders that may have affected the outcomes. However, the same resources, including consultants and procedure services, were readily available to both groups and there was no significant difference in consultation rates. Fourth, “cost of care” was measured as overall charges to patients, not cost to the hospital. However, given that all the encounters occurred at the same hospital in the same time frame, the difference should be proportional and equal between groups. Finally, our readmission rates did not account for patients readmitted to other institutions. However, there should not have been a differential effect between the 2 study groups, given the shared patient catchment area and our exclusion for referral bias.
It should also be noted that the expanded PA group used a structured collaboration framework and incorporated a structured education program for its PAs. These components are integral to the expanded PA model, and our results may not be generalizable outside of a similar framework. The expanded PA group’s PAs were carefully selected at the time of hire, specifically educated, and supported through ongoing collaboration to provide efficient and appropriate care at the “top of their licenses”. Not all medical groups will be able to provide this level of support and education, and not all hospitalist PAs will want to and/or be able to reach this level of proficiency. However, successful implementation is entirely achievable for groups that invest the effort. The MDICS education process included 80 hours of didactic sessions spread over several months and is based on the Society of Hospital Medicine Core Competencies [13] as well as 6 months of supervised bedside education with escalating clinical responsibilities under the tutelage of an experienced physician or PA. Year-long academic PA fellowships have also been developed for purposes of similar training at several institutions [14].
Conclusion
Our results show that expanded use of well-educated PAs functioning within a formal collaboration arrangement with physicians provides similar clinical quality to a conventional PA staffing model with no excess patient care costs. The model also allows substantial salary savings to supporting institutions, which is important to hospital and policy stakeholders given the implications for hospitalist group staffing, increasing value, and allocation of precious time and financial resources.
Acknowledgements: The authors wish to thank Kevin Funk, MBA, of MDICS, Clarence Richardson, MBA, of GeBBs Software International, and Heather Channing, Kayla King, and Laura Knox of Anne Arundel Healthcare Enterprise, who provided invaluable help with the data aggregation used for this study.
Corresponding author: Timothy M. Capstack, MD, 7250 Parkway Dr, Suite 500, Hanover, MD 21076, tcapstack@mdics.com.
Financial disclosures: Dr. Capstack has ownership interest in Physicians Inpatient Care Specialists (MDICS). Ms. Segujja received compensation from MDICS for statistical analysis.
1. Michtalik HJ, Pronovost PJ, Marsteller JA, et al. Developing a model for attending physician workload and outcomes. JAMA Intern Med 2013;173:1026–8.
2. Society of Hospital Medicine. State of hospital medicine report. Philadelphia: Society of Hospital Medicine; 2014.
3. Kartha A, Restuccia J, Burgess J, et al. Nurse practitioner and physician assistant scope of practice in 118 acute care hospitals. J Hosp Med 2014;9:615–20.
4. Dhuper S, Choksi S. Replacing an academic internal medicine residency program with a physician assistant--hospitalist model: a comparative analysis study. Am J Med Qual 2008;24:132–9.
5. Morris D, Reilly P, Rohrbach J, et al. The influence of unit-based nurse practitioners on hospital outcomes and readmission rates for patients with trauma. J Trauma Acute Care Surg 2012;73:474–8.
6. Roy C, Liang C, Lund M, et al. Implementation of a physician assistant/hospitalist service in an academic medical center: impact on efficiency and patient outcomes. J Hosp Med 2008;3:361–8.
7. Singh S, Fletcher K, Schapira M, et al. A comparison of outcomes of general medical inpatient care provided by a hospitalist-physician assistant model vs a traditional resident-based model. J Hosp Med 2011;6:122–30.
8. Hoffman L, Tasota F, Zullo T, et al. Outcomes of care managed by an acute care nurse practitioner/attending physician team in an subacute medical intensive care unit. Am J Crit Care 2005;14:121–30.
9. Kapu A, Kleinpell R, Pilon B. Quality and financial impact of adding nurse practitioners to inpatient care teams. J Nurs Adm 2014;44:87–96.
10. Cowan M, Shapiro M, Hays R, et al. The effect of a multidisciplinary hospitalist/physician and advanced practice nurse collaboration on hospital costs. J Nurs Adm 2006;36:79–85.
11. Michtalik HJ, Yeh HC, Pronovost PJ, Brotman DJ. Impact of attending physician workload on patient care: A survey of hospitalists. JAMA Intern Med 2013;173:375–7.
12. Elliott D, Young R, Brice J, et al. Effect of hospitalist workload on the quality and efficiency of care. JAMA Internal Med 2014;174:786–93.
13. McKean S, Budnitz T, Dressler D, et al. How to use the core competencies in hospital medicine: a framework for curriculum development. J Hosp Med 2006; 1 Suppl 1:57–67.
14. Will K, Budavari A, Wilkens J, et al. A hospitalist postgraduate training program for physician assistants. J Hosp Med 2010;5:94–8.
Improved Coordination of Care for Patients with Abnormalities on Chest Imaging: The Rapid Access Chest and Lung Assessment Program
From the DeCesaris Cancer Institute, Anne Arundel Medical Center, Annapolis, MD.
Abstract
- Objective: To describe the development and outcomes of a centralized evaluation service for patients with abnormalities on thoracic imaging to allow prompt and standardized review by an experienced multidisciplinary team.
- Methods: Patients with abnormal thoracic imaging studies, whether symptom-related or incidental, were referred to a specialized multidisciplinary team by radiologists, primary care physicians, or other providers. Recommendations for immediate or delayed follow-up were made based on professional society guidelines and patient characteristics. Follow-up was maintained within the program with close communication with primary care physicians.
- Results: 238 patients were referred over a 27-month period, 227 with abnormal findings on chest imaging. 171 patients (75%) accepted participation in the program. Radiologists were the most frequent referrers. Pulmonary symptoms were present in 74% of cases but were often unrelated to the findings. Patients and primary care physicians were contacted within a median of 2 days after imaging. Lung cancer was eventually diagnosed in 72 patients (32%), 51% with stage IA-IIB, at a median time of 16 days from first imaging. Physician satisfaction with the program was high.
- Conclusion: The program provided rapid and evidence-based evaluation and management of patients with thoracic imaging abnormalities, resulting in short time to diagnosis and high referring physician satisfaction.
Nonspecific abnormalities after chest imaging are a clinical dilemma for physicians and a source of anxiety for patients concerned about the possibility of malignancy. The range of abnormal findings most often involve the parenchyma but also can include nodal tissue, mediastinum, and the bony thorax. Often these findings are incidental to the symptoms that prompted the evaluation. For example, one study of over 12,000 abdominal computed tomography (CT) scans detected pulmonary nodules in 3% [1], and a study of 586 CT angiograms ordered in an emergency room found nodules in 13% and new adenopathy in 9% [2]. Furthermore, CT imaging in various lung cancer screening trials demonstrate that the prevalence of 1 or more pulmonary nodules is 8% to 51%, but the risk of malignancy is much less: 1.1% to 12% [3]. Indeed, it is estimated that due to a high prevalence of imaging, over 150,000 Americans are diagnosed with solitary pulmonary nodules (SPN) annually [2]. Although nodule characteristics such as size, shape, and stability over time can predict the likelihood of malignancy, the risk that any of these imaging abnormalities are related to a malignancy depends upon characteristics of both the lesion and the patient.
Given the nonspecific nature of many radiographic findings, management strategies and guidelines have been developed for several different types of imaging abnormalities [4–7]. However, gaps in the guidelines exist, and they often are not followed [8,9]. Radiologists are not adherent to any set of guidelines in as many as 64% of cases, despite a high level of awareness of such guidelines [10–13]. Recommendations that are not concordant with guidelines are more likely to involve excessively frequent imaging rather than inappropriately infrequent follow-up [13].
Actual cases of under- and over-imaging in surveillance and a single case of delayed diagnosis despite a radiology report highlighting a high-risk nodule prompted us to developed a centralized program to gather all patients with pulmonary imaging abnormalities into the hands of physicians most familiar with these abnormalities and the proper use of available diagnostic tools. The goals were to rely on existing guidelines tempered with clinical experience to advise patients and their primary care physicians, and to direct the most efficient diagnostic evaluation and management.
Methods
Setting
Anne Arundel Medical Center is a 385-bed acute care hospital in Annapolis, Maryland, with a medical staff of nearly 1000 physicians and mid-level providers. There are nearly 30,000 admissions and 95,000 emergency department visits annually. The medical center operates 5 regional diagnostic imaging sites that collectively perform 159,000 imaging studies annually, including 3995 chest CT scans and 5243 abdominal CT scans in 2013. The images are interpreted by 20 radiologists from a single private practice contracted to provide services at these locations. Specialist readers are deployed in nuclear medicine, musculoskeletal, neuroradiology, and breast imaging, but not in thoracic imaging.
Program Description
The goal of the Rapid Access Chest and Lung Assessment Program (RACLAP) is to perform a rapid multidisciplinary assessment of pulmonary findings related to patient symptoms or presenting as incidental findings. First contact with the primary care provider was made by either the interpreting radiologist or the nurse navigator to obtain approval for entrance into the program. At that point, the patients were contacted and offered evaluation. Once evaluated, patients provided informed consent to have their data and outcomes collected and analyzed. The assessment team included a nurse navigator to gather elements of the history, and thoracic surgeons, pulmonologists, and radiologists to make recommendations about further follow-up based on the guidelines of the Fleishner Society [5] and American College of Radiology [6] and knowledge of patient characteristics and risk factors. Patients who were judged to have lower-risk abnormalities were followed within the program for at least 2 years to document stability.
Keeping in close contact with the patient’s primary care physician, the team designed a plan for additional evaluation as necessary. If multidisciplinary consultation was required, the nurse navigator coordinated and facilitated visits to avoid duplication and delays. The RACLAP established a dedicated phone number to receive calls and messages from radiologists at any of the 5 diagnostic facilities and from emergency department or other physicians who encounter patients with abnormal chest imaging findings. Institutional review board approval was obtained for this project.
Analysis
The percentage of RACLAP patients presenting with early stage (IA–IIB) lung cancer diagnosed in the RACLAP was compared with both concurrent controls (those diagnosed during the same time period through traditional referral patterns) and with historic controls (those diagnosed in the 24 months prior to the institution of the RACLAP). A 2-sample test for binomial proportions was used for both of these comparisons.
Physician satisfaction with the program was assessed with an online survey tool sent to the 63 individual referring physicians. The survey tool consisted of 11 questions asking respondents to rate their satisfaction with various aspects of the program on a 1–10 scale where 10 was excellent.
Results
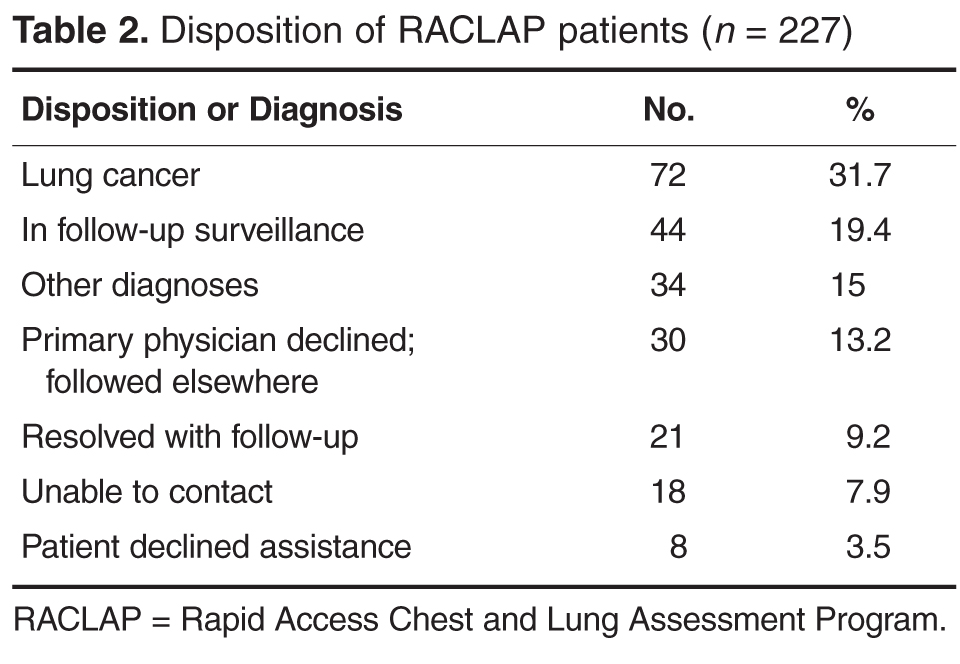
Operational metrics of the program were evaluated for the entire group. All patients were contacted within 2 business days, but data on time to evaluation is confounded by patients who had no need for urgent evaluation. However, we did quantify time to evaluation for the 72 patients who had more worrisome findings and were eventually shown to have newly diagnosed lung cancer (Table 3). 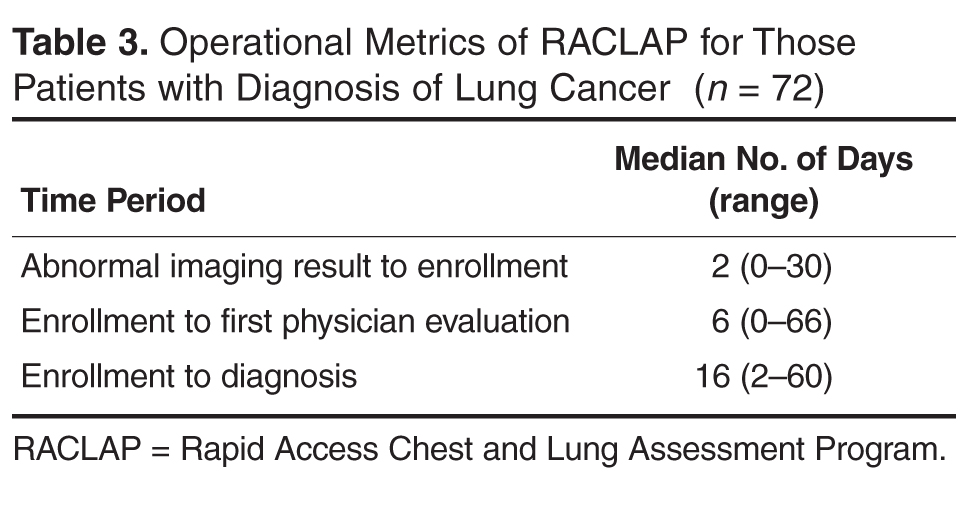
Seventy-two patients were diagnosed with lung cancer after referral (31.7%). Table 4 shows their stage at presentation and compares them to the 379 concurrent control patients diagnosed with lung cancer during these same months via traditional practice patterns and the 458 historic 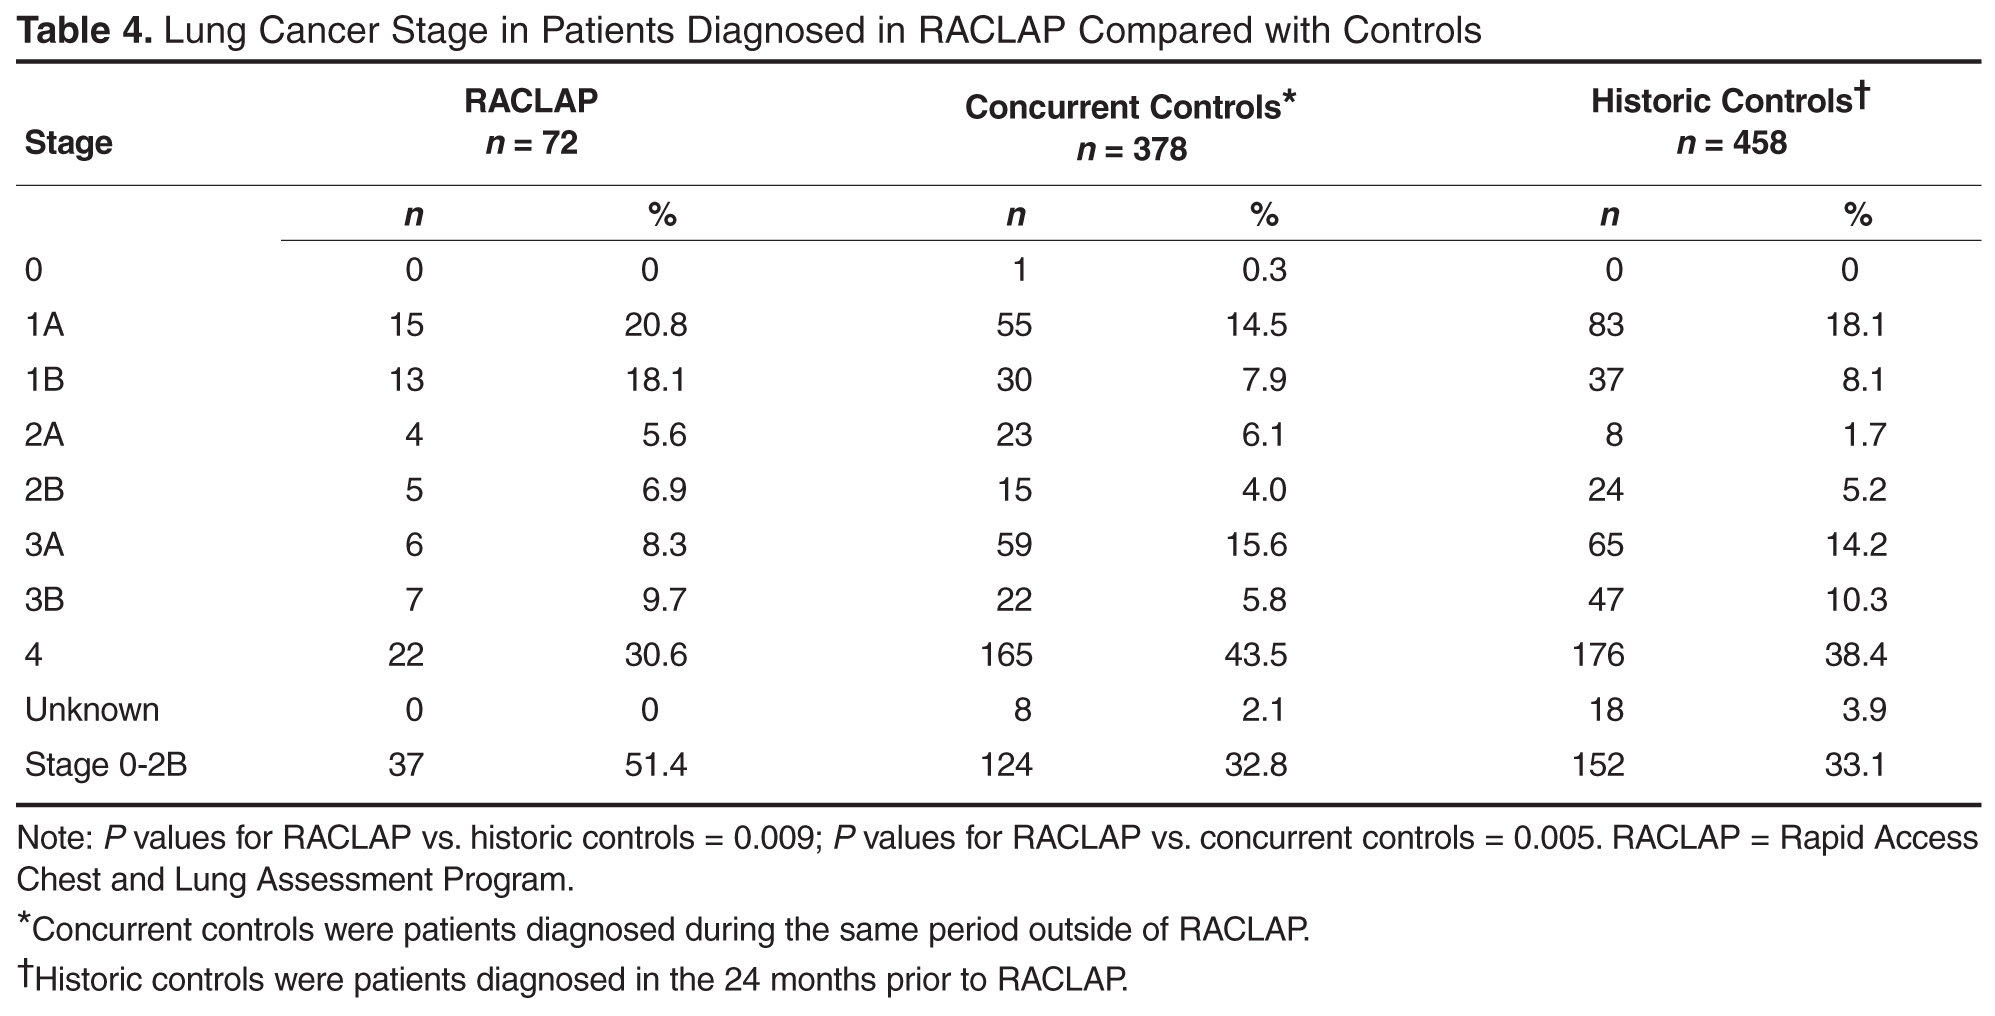
The online survey was sent to 63 referring physicians and 30 responded (47% response rate). Average overall satisfaction was 8.5 on a 1 to 10 scale with 10 being the highest level of satisfaction. Likelihood of referring another patient averaged 9.1 on the same scale. Individual comments cited ease of access, the comprehensive nature of the evaluation, and the communication to the primary care physicians as the best aspects of the program.
Discussion
The discovery of suspicious findings on imaging can have a dramatic impact on patients’ quality of life and emotional well-being, with nearly all patients fearing that they have cancer [15]. Clinical uncertainty about next steps heightens their concerns. The value of data-derived guidelines in shaping the recommendations of radiologists and primary care physicians has recently been expressed [16]. We know of no data quantifying primary care or emergency department physicians’ awareness of surveillance guidelines, but experience indicates that surveillance strategies are highly idiosyncratic, with at least a few patients getting lost to follow-up altogether. Many primary care physicians rely upon recommendations in radiologists’ reports. Unfortunately, there is ample evidence that radiologists’ recommendations are not consistently concordant with guidelines [10–13], with a tendency to over-recommend follow-up tests [13].
The RACLAP program was developed to centralize the follow-up of clinically significant pulmonary imaging abnormalities in order to standardize the approach, increase adherence to professional society guidelines, and to avoid the rare but real situation of having a patient lost to follow-up. Unlike other “nodule clinics,” it was pro-active, reaching out to primary care physicians and to patients once a radiologist notified a nurse navigator of a finding. Our findings document a high acceptance of the program with 171/227 (75%) of patients and primary care physicians opting for evaluation within the program. The fact that in only 30 of 227 (13%) of potential referrals did a primary care physician decline the service indicates that the RACLAP successfully addressed an existing need among physicians. Referring physician satisfaction with the service was high reflecting the fact that the program assisted them in making difficult management decisions and discussing clinical uncertainty with patients.
Our program bears superficial similarities to the one described by Lo et al at Toronto East General Hospital [17], where a re-design of operations lead to an increase in access to thoracic oncology specialists and resulted in a reduction of wait time to evaluation by a median of 27 days. However, the goals of the 2 programs were different and the problems being addressed were dissimilar. The Canadian program was designed to shorten time from clinical suspicion to diagnosis of lung cancer and involved improving access to specialists with the creation of “shadow” slots for CT scan and bronchoscopy to facilitate prompt consultation requests, something that was not necessary in our system. Our program was focused on inserting maximum experience into the clinical decision making about imaging abnormalities to assure guideline adherence and consistency in approach.
The short interval to patient contact and evaluation described in this report compares favorably to published data on time to evaluation in referral patterns from around the world when no special efforts are made [18–21]. Alsamari et al have shown the benefit of special efforts to coordinate care of patients with apparent lung cancer with regard to timeliness of evaluation and improved stage compared to historic controls [19]. It should be noted, that even though guidelines have been promulgated for the timeliness of evaluation of symptomatic patients, it is unclear if reducing time to evaluation improves lung cancer survival [18] though it can reduce anxiety.
Our program relied most heavily upon radiologists to make the referral to the RACLAP. We find that the ability to inform and organize a smaller number of radiologists is more effective than attempting to inform a much larger number of primary care physicians about the existence of the program. Even with the success of the program we noted that not all radiologists made referrals at the same frequency, suggesting variability in interest and/or awareness. The system could therefore be improved by making it easier for radiologists to participate by implementing electronic tools that allow radiologists to activate the RACLAP navigator via an inbox message in the electronic medical record as was described at the a program at the Veterans Affairs Connecticut Health Care System [19]. In addition, tools such as natural language processing and clinical decision support which “read” radiology reports and allow standardized templated recommendations, similar to breast imaging reports would improve standardization of recommendation.
The limitations of this study are chiefly related to questions regarding its generalizability, as this was a highly centralized, hospital-based program. The nurse navigator was a hospital employee and the involved physicians were all hospital-based, although only the surgeons were employed by the medical center. In addition, all 5 radiology centers and physicians in the program had access to the electronically stored images. Whether such a program could be recreated and thrive in communities without this degree of centralization, system collaboration, and leadership is unclear. Another feature of this program that raises questions of generalizability is that all the radiologists, the chief source of referrals, were employed in a single professional practice which facilitated communication and uniformity of practice. We are in the process of expanding the program to engage a larger number of radiology practices without the close relationships described above.
The high rate of new lung cancer diagnoses (32%) was surprising. Though most patients had some symptoms that provoked the imaging, many of these symptoms seemed to be unrelated to the findings, even among those subsequently found to have cancer. Our population did have a higher percentage of active smokers (19.7% compared with 14% of adults in our home county [22]), indicating perhaps a bias toward ordering imaging in those who smoke. It is possible that referring physicians, including radiologists, referred patients who had more worrisome characteristics more often. The program was intended to be universal, but we cannot exclude referral bias as a cause of the high rate of malignant diagnoses. Even so, the increased frequency of “early”- stage cancers stands.
Conclusion
Our study showed that in a community hospital–based practice, the care of patients with pulmonary imaging abnormalities can be coordinated and facilitated so that professional society guidelines for surveillance are utilized. The program required no capital and was only modestly labor intensive, requiring the deployment of a navigator who may be shared with other cancer programs. Referring physician satisfaction was high. As high resolution CT scans for lung cancer screening and other indications becomes more common, imaging abnormalities will be found increasingly. Health systems are increasingly focused on both costs of care and quality of care. In this setting, directing the evaluation of patient with abnormal lung imaging to those most experienced can be a means to achieve both higher quality and lower cost.
Acknowledgments: We acknowledge Professor Charles Mylander for expert statistical analysis and support. We are grateful to members of the Thoracic Oncology Steering Committee at Anne Arundel Medical Center for help in creating the program described above.
Corresponding author: Barry Meisenberg, MD, DeCesaris Cancer Institute, 2001 Medical Parkway, Annapolis, MD 21146, Meisenberg@AAHS.org.
Financial disclosures: None.
1. Alpert JB, Fantauzzi JP, Melamud K, et al. Clinical significance of lung nodules reported on abdominal CT. AJR Am J Roentgenol 2012;1998:793–9.
2. Hall WB, Truitt SG, Scheunemann LP, et al. The prevalence of clinically relevant incidental findings on chest computed tomographic angiograms ordered to diagnose pulmonary embolism. Arch Intern Med 2009;169:1961–5.
3. Wahidi MM, Govert JA, Goudar RK, et al. Evidence for the treatment of patients with pulmonary nodules: when is it lung cancer? Chest 2007;132(3 Suppl):94S–107S.
4. Ost D, Fein AM, Feinsilver SH. The solitary pulmonary nodule. N Engl J Med 2003;348:2535–42.
5. MacMahon H, Austin JH, Gamsu G, et al. Guidelines for management of small pulmonary nodules detected on CT scans: a statement from the Fleischner Society. Radiology 2005;237:395–400.
6. Ray Jr CE, English B, Funaki BS, et al. ACR appropriateness criteria radiologic management of thoracic nodules and masses. J Am Coll Radiol 2012;9:13–9.
7. Kanne JP, Jensen LE, Tan-Lucien HM, et al. ACR appropriateness criteria radiographically detected solitary pulmonary nodule. J Thorac Imaging 2013;28:W1–W3.
8. Edey AJ, Hansell DM. Incidentally detected small pulmonary nodules on CT. Clin Radiol 2009;64:872–84.
9. Nair A, Baldwin DR, Field JK, et al. Measurement methods and algorithms for the management of solid nodules. J Thorac Imaging 2012;27:230–9.
10. Eisenberg RL, Bankier, Boiselle PM. Compliance with Fleischner Society guidelines for management of small lung nodules: a survey of 834 radiologists. Radiology 2010;255:218–24.
11. Lacson, RL, Prevedello LM, Andriole KP, et al. Factors associated with radiologists’ adherence to Fleischner guidelines for management of pulmonary nodules. J Am Coll Radiol 2012; 9:468–73.
12. Esmail A, Munden RF, Muhammed TL. Small pulmonary nodule management: a survey of the members of the Society of Thoracic Radiology with comparison to the Fleischner Society guidelines. J Thorac Imaging 2011;26:27–31.
13. Masciocchi M, Wagner B, Lloyd B. Quality review: Fleischner criteria adherence by radiologists in a large community hospital. J Am Coll Radiol 2012;9:336–9.
14. National Cancer Institute Patient Information page: non-small cell lung cancer. Accessed 1 Jul 2013 at www.cancer.gov/cancertopics/pdq/treatment/non-small-cell-lung/Patient#Keypoint4.
15. Wiener RS, Gould MK, Woloshin S, et al. What do you mean, a spot? a qualitative analysis of patients’ reactions to discussion with their physicians about pulmonary nodules. Chest 2013;143:672–7.
16. McMahon H. Compliance with Fleischner Society guidelines for management of lung nodules: lessons and opportunities. Radiology 2010;255:14–5.
17. Lo DS, Zeldin RA, Skratsins R, et al. Time to treat: a system redesign focusing on decreasing the time from suspicion of lung cancer to diagnosis. J Thorac Oncol 2007;2:1001–6.
18. Brocken P, Loers BAB, Looijen-Salamon MG, et al. Timeliness of lung cancer diagnosis and treatment in a rapid outpatient diagnostic program with combined 18FDG-PET and contrast enhanced CT scanning. Lung Cancer 2012;75:336–41.
19. Alsamarai S, Xiaopan Y, Cain HC, et al. The effect of a lung cancer care coordination program on timeliness of care. Clin Lung Cancer 2013;14:527–34.
20. Leprieur EG, Labrune S, Giraud V, et al. Delay between the initial symptomsa, the diagnosis and the onset of specific treatment in elderly patients with lung cancer. Clin Lung Cancer 2012;13:363–8.
21. Cheung WY, Butler JR, Kliewer EV, et al. Analysis of wait times and costs during the peri-diagnostic period for non small cell lung cancer. Lung Cancer 2011;72:125–31.
22. Report card of community health indicators. Anne Arundel County Department of Health. Accessed 20 Jul 2013 at www.aahealth.org/pdf/aahealth-report-card-2011.pdf.
From the DeCesaris Cancer Institute, Anne Arundel Medical Center, Annapolis, MD.
Abstract
- Objective: To describe the development and outcomes of a centralized evaluation service for patients with abnormalities on thoracic imaging to allow prompt and standardized review by an experienced multidisciplinary team.
- Methods: Patients with abnormal thoracic imaging studies, whether symptom-related or incidental, were referred to a specialized multidisciplinary team by radiologists, primary care physicians, or other providers. Recommendations for immediate or delayed follow-up were made based on professional society guidelines and patient characteristics. Follow-up was maintained within the program with close communication with primary care physicians.
- Results: 238 patients were referred over a 27-month period, 227 with abnormal findings on chest imaging. 171 patients (75%) accepted participation in the program. Radiologists were the most frequent referrers. Pulmonary symptoms were present in 74% of cases but were often unrelated to the findings. Patients and primary care physicians were contacted within a median of 2 days after imaging. Lung cancer was eventually diagnosed in 72 patients (32%), 51% with stage IA-IIB, at a median time of 16 days from first imaging. Physician satisfaction with the program was high.
- Conclusion: The program provided rapid and evidence-based evaluation and management of patients with thoracic imaging abnormalities, resulting in short time to diagnosis and high referring physician satisfaction.
Nonspecific abnormalities after chest imaging are a clinical dilemma for physicians and a source of anxiety for patients concerned about the possibility of malignancy. The range of abnormal findings most often involve the parenchyma but also can include nodal tissue, mediastinum, and the bony thorax. Often these findings are incidental to the symptoms that prompted the evaluation. For example, one study of over 12,000 abdominal computed tomography (CT) scans detected pulmonary nodules in 3% [1], and a study of 586 CT angiograms ordered in an emergency room found nodules in 13% and new adenopathy in 9% [2]. Furthermore, CT imaging in various lung cancer screening trials demonstrate that the prevalence of 1 or more pulmonary nodules is 8% to 51%, but the risk of malignancy is much less: 1.1% to 12% [3]. Indeed, it is estimated that due to a high prevalence of imaging, over 150,000 Americans are diagnosed with solitary pulmonary nodules (SPN) annually [2]. Although nodule characteristics such as size, shape, and stability over time can predict the likelihood of malignancy, the risk that any of these imaging abnormalities are related to a malignancy depends upon characteristics of both the lesion and the patient.
Given the nonspecific nature of many radiographic findings, management strategies and guidelines have been developed for several different types of imaging abnormalities [4–7]. However, gaps in the guidelines exist, and they often are not followed [8,9]. Radiologists are not adherent to any set of guidelines in as many as 64% of cases, despite a high level of awareness of such guidelines [10–13]. Recommendations that are not concordant with guidelines are more likely to involve excessively frequent imaging rather than inappropriately infrequent follow-up [13].
Actual cases of under- and over-imaging in surveillance and a single case of delayed diagnosis despite a radiology report highlighting a high-risk nodule prompted us to developed a centralized program to gather all patients with pulmonary imaging abnormalities into the hands of physicians most familiar with these abnormalities and the proper use of available diagnostic tools. The goals were to rely on existing guidelines tempered with clinical experience to advise patients and their primary care physicians, and to direct the most efficient diagnostic evaluation and management.
Methods
Setting
Anne Arundel Medical Center is a 385-bed acute care hospital in Annapolis, Maryland, with a medical staff of nearly 1000 physicians and mid-level providers. There are nearly 30,000 admissions and 95,000 emergency department visits annually. The medical center operates 5 regional diagnostic imaging sites that collectively perform 159,000 imaging studies annually, including 3995 chest CT scans and 5243 abdominal CT scans in 2013. The images are interpreted by 20 radiologists from a single private practice contracted to provide services at these locations. Specialist readers are deployed in nuclear medicine, musculoskeletal, neuroradiology, and breast imaging, but not in thoracic imaging.
Program Description
The goal of the Rapid Access Chest and Lung Assessment Program (RACLAP) is to perform a rapid multidisciplinary assessment of pulmonary findings related to patient symptoms or presenting as incidental findings. First contact with the primary care provider was made by either the interpreting radiologist or the nurse navigator to obtain approval for entrance into the program. At that point, the patients were contacted and offered evaluation. Once evaluated, patients provided informed consent to have their data and outcomes collected and analyzed. The assessment team included a nurse navigator to gather elements of the history, and thoracic surgeons, pulmonologists, and radiologists to make recommendations about further follow-up based on the guidelines of the Fleishner Society [5] and American College of Radiology [6] and knowledge of patient characteristics and risk factors. Patients who were judged to have lower-risk abnormalities were followed within the program for at least 2 years to document stability.
Keeping in close contact with the patient’s primary care physician, the team designed a plan for additional evaluation as necessary. If multidisciplinary consultation was required, the nurse navigator coordinated and facilitated visits to avoid duplication and delays. The RACLAP established a dedicated phone number to receive calls and messages from radiologists at any of the 5 diagnostic facilities and from emergency department or other physicians who encounter patients with abnormal chest imaging findings. Institutional review board approval was obtained for this project.
Analysis
The percentage of RACLAP patients presenting with early stage (IA–IIB) lung cancer diagnosed in the RACLAP was compared with both concurrent controls (those diagnosed during the same time period through traditional referral patterns) and with historic controls (those diagnosed in the 24 months prior to the institution of the RACLAP). A 2-sample test for binomial proportions was used for both of these comparisons.
Physician satisfaction with the program was assessed with an online survey tool sent to the 63 individual referring physicians. The survey tool consisted of 11 questions asking respondents to rate their satisfaction with various aspects of the program on a 1–10 scale where 10 was excellent.
Results
Operational metrics of the program were evaluated for the entire group. All patients were contacted within 2 business days, but data on time to evaluation is confounded by patients who had no need for urgent evaluation. However, we did quantify time to evaluation for the 72 patients who had more worrisome findings and were eventually shown to have newly diagnosed lung cancer (Table 3).
Seventy-two patients were diagnosed with lung cancer after referral (31.7%). Table 4 shows their stage at presentation and compares them to the 379 concurrent control patients diagnosed with lung cancer during these same months via traditional practice patterns and the 458 historic
The online survey was sent to 63 referring physicians and 30 responded (47% response rate). Average overall satisfaction was 8.5 on a 1 to 10 scale with 10 being the highest level of satisfaction. Likelihood of referring another patient averaged 9.1 on the same scale. Individual comments cited ease of access, the comprehensive nature of the evaluation, and the communication to the primary care physicians as the best aspects of the program.
Discussion
The discovery of suspicious findings on imaging can have a dramatic impact on patients’ quality of life and emotional well-being, with nearly all patients fearing that they have cancer [15]. Clinical uncertainty about next steps heightens their concerns. The value of data-derived guidelines in shaping the recommendations of radiologists and primary care physicians has recently been expressed [16]. We know of no data quantifying primary care or emergency department physicians’ awareness of surveillance guidelines, but experience indicates that surveillance strategies are highly idiosyncratic, with at least a few patients getting lost to follow-up altogether. Many primary care physicians rely upon recommendations in radiologists’ reports. Unfortunately, there is ample evidence that radiologists’ recommendations are not consistently concordant with guidelines [10–13], with a tendency to over-recommend follow-up tests [13].
The RACLAP program was developed to centralize the follow-up of clinically significant pulmonary imaging abnormalities in order to standardize the approach, increase adherence to professional society guidelines, and to avoid the rare but real situation of having a patient lost to follow-up. Unlike other “nodule clinics,” it was pro-active, reaching out to primary care physicians and to patients once a radiologist notified a nurse navigator of a finding. Our findings document a high acceptance of the program with 171/227 (75%) of patients and primary care physicians opting for evaluation within the program. The fact that in only 30 of 227 (13%) of potential referrals did a primary care physician decline the service indicates that the RACLAP successfully addressed an existing need among physicians. Referring physician satisfaction with the service was high reflecting the fact that the program assisted them in making difficult management decisions and discussing clinical uncertainty with patients.
Our program bears superficial similarities to the one described by Lo et al at Toronto East General Hospital [17], where a re-design of operations lead to an increase in access to thoracic oncology specialists and resulted in a reduction of wait time to evaluation by a median of 27 days. However, the goals of the 2 programs were different and the problems being addressed were dissimilar. The Canadian program was designed to shorten time from clinical suspicion to diagnosis of lung cancer and involved improving access to specialists with the creation of “shadow” slots for CT scan and bronchoscopy to facilitate prompt consultation requests, something that was not necessary in our system. Our program was focused on inserting maximum experience into the clinical decision making about imaging abnormalities to assure guideline adherence and consistency in approach.
The short interval to patient contact and evaluation described in this report compares favorably to published data on time to evaluation in referral patterns from around the world when no special efforts are made [18–21]. Alsamari et al have shown the benefit of special efforts to coordinate care of patients with apparent lung cancer with regard to timeliness of evaluation and improved stage compared to historic controls [19]. It should be noted, that even though guidelines have been promulgated for the timeliness of evaluation of symptomatic patients, it is unclear if reducing time to evaluation improves lung cancer survival [18] though it can reduce anxiety.
Our program relied most heavily upon radiologists to make the referral to the RACLAP. We find that the ability to inform and organize a smaller number of radiologists is more effective than attempting to inform a much larger number of primary care physicians about the existence of the program. Even with the success of the program we noted that not all radiologists made referrals at the same frequency, suggesting variability in interest and/or awareness. The system could therefore be improved by making it easier for radiologists to participate by implementing electronic tools that allow radiologists to activate the RACLAP navigator via an inbox message in the electronic medical record as was described at the a program at the Veterans Affairs Connecticut Health Care System [19]. In addition, tools such as natural language processing and clinical decision support which “read” radiology reports and allow standardized templated recommendations, similar to breast imaging reports would improve standardization of recommendation.
The limitations of this study are chiefly related to questions regarding its generalizability, as this was a highly centralized, hospital-based program. The nurse navigator was a hospital employee and the involved physicians were all hospital-based, although only the surgeons were employed by the medical center. In addition, all 5 radiology centers and physicians in the program had access to the electronically stored images. Whether such a program could be recreated and thrive in communities without this degree of centralization, system collaboration, and leadership is unclear. Another feature of this program that raises questions of generalizability is that all the radiologists, the chief source of referrals, were employed in a single professional practice which facilitated communication and uniformity of practice. We are in the process of expanding the program to engage a larger number of radiology practices without the close relationships described above.
The high rate of new lung cancer diagnoses (32%) was surprising. Though most patients had some symptoms that provoked the imaging, many of these symptoms seemed to be unrelated to the findings, even among those subsequently found to have cancer. Our population did have a higher percentage of active smokers (19.7% compared with 14% of adults in our home county [22]), indicating perhaps a bias toward ordering imaging in those who smoke. It is possible that referring physicians, including radiologists, referred patients who had more worrisome characteristics more often. The program was intended to be universal, but we cannot exclude referral bias as a cause of the high rate of malignant diagnoses. Even so, the increased frequency of “early”- stage cancers stands.
Conclusion
Our study showed that in a community hospital–based practice, the care of patients with pulmonary imaging abnormalities can be coordinated and facilitated so that professional society guidelines for surveillance are utilized. The program required no capital and was only modestly labor intensive, requiring the deployment of a navigator who may be shared with other cancer programs. Referring physician satisfaction was high. As high resolution CT scans for lung cancer screening and other indications becomes more common, imaging abnormalities will be found increasingly. Health systems are increasingly focused on both costs of care and quality of care. In this setting, directing the evaluation of patient with abnormal lung imaging to those most experienced can be a means to achieve both higher quality and lower cost.
Acknowledgments: We acknowledge Professor Charles Mylander for expert statistical analysis and support. We are grateful to members of the Thoracic Oncology Steering Committee at Anne Arundel Medical Center for help in creating the program described above.
Corresponding author: Barry Meisenberg, MD, DeCesaris Cancer Institute, 2001 Medical Parkway, Annapolis, MD 21146, Meisenberg@AAHS.org.
Financial disclosures: None.
1. Alpert JB, Fantauzzi JP, Melamud K, et al. Clinical significance of lung nodules reported on abdominal CT. AJR Am J Roentgenol 2012;1998:793–9.
2. Hall WB, Truitt SG, Scheunemann LP, et al. The prevalence of clinically relevant incidental findings on chest computed tomographic angiograms ordered to diagnose pulmonary embolism. Arch Intern Med 2009;169:1961–5.
3. Wahidi MM, Govert JA, Goudar RK, et al. Evidence for the treatment of patients with pulmonary nodules: when is it lung cancer? Chest 2007;132(3 Suppl):94S–107S.
4. Ost D, Fein AM, Feinsilver SH. The solitary pulmonary nodule. N Engl J Med 2003;348:2535–42.
5. MacMahon H, Austin JH, Gamsu G, et al. Guidelines for management of small pulmonary nodules detected on CT scans: a statement from the Fleischner Society. Radiology 2005;237:395–400.
6. Ray Jr CE, English B, Funaki BS, et al. ACR appropriateness criteria radiologic management of thoracic nodules and masses. J Am Coll Radiol 2012;9:13–9.
7. Kanne JP, Jensen LE, Tan-Lucien HM, et al. ACR appropriateness criteria radiographically detected solitary pulmonary nodule. J Thorac Imaging 2013;28:W1–W3.
8. Edey AJ, Hansell DM. Incidentally detected small pulmonary nodules on CT. Clin Radiol 2009;64:872–84.
9. Nair A, Baldwin DR, Field JK, et al. Measurement methods and algorithms for the management of solid nodules. J Thorac Imaging 2012;27:230–9.
10. Eisenberg RL, Bankier, Boiselle PM. Compliance with Fleischner Society guidelines for management of small lung nodules: a survey of 834 radiologists. Radiology 2010;255:218–24.
11. Lacson, RL, Prevedello LM, Andriole KP, et al. Factors associated with radiologists’ adherence to Fleischner guidelines for management of pulmonary nodules. J Am Coll Radiol 2012; 9:468–73.
12. Esmail A, Munden RF, Muhammed TL. Small pulmonary nodule management: a survey of the members of the Society of Thoracic Radiology with comparison to the Fleischner Society guidelines. J Thorac Imaging 2011;26:27–31.
13. Masciocchi M, Wagner B, Lloyd B. Quality review: Fleischner criteria adherence by radiologists in a large community hospital. J Am Coll Radiol 2012;9:336–9.
14. National Cancer Institute Patient Information page: non-small cell lung cancer. Accessed 1 Jul 2013 at www.cancer.gov/cancertopics/pdq/treatment/non-small-cell-lung/Patient#Keypoint4.
15. Wiener RS, Gould MK, Woloshin S, et al. What do you mean, a spot? a qualitative analysis of patients’ reactions to discussion with their physicians about pulmonary nodules. Chest 2013;143:672–7.
16. McMahon H. Compliance with Fleischner Society guidelines for management of lung nodules: lessons and opportunities. Radiology 2010;255:14–5.
17. Lo DS, Zeldin RA, Skratsins R, et al. Time to treat: a system redesign focusing on decreasing the time from suspicion of lung cancer to diagnosis. J Thorac Oncol 2007;2:1001–6.
18. Brocken P, Loers BAB, Looijen-Salamon MG, et al. Timeliness of lung cancer diagnosis and treatment in a rapid outpatient diagnostic program with combined 18FDG-PET and contrast enhanced CT scanning. Lung Cancer 2012;75:336–41.
19. Alsamarai S, Xiaopan Y, Cain HC, et al. The effect of a lung cancer care coordination program on timeliness of care. Clin Lung Cancer 2013;14:527–34.
20. Leprieur EG, Labrune S, Giraud V, et al. Delay between the initial symptomsa, the diagnosis and the onset of specific treatment in elderly patients with lung cancer. Clin Lung Cancer 2012;13:363–8.
21. Cheung WY, Butler JR, Kliewer EV, et al. Analysis of wait times and costs during the peri-diagnostic period for non small cell lung cancer. Lung Cancer 2011;72:125–31.
22. Report card of community health indicators. Anne Arundel County Department of Health. Accessed 20 Jul 2013 at www.aahealth.org/pdf/aahealth-report-card-2011.pdf.