User login
Computational psychiatry is an emerging field in which artificial intelligence and machine learning are used to find hidden patterns in big data to better understand, predict, and treat mental illness. The field uses various mathematical models to predict the dependent variable y based on the independent variable x. One application of analytics in medicine was the Framingham Heart Study, which used multivariate logistic regression to predict heart disease.1
Analytics could be used to predict the number of bad outcomes associated with different psychiatric medications over time. To demonstrate this, I examined a select data set of 8 psychiatric medications (aripiprazole, ziprasidone, risperidone, olanzapine, sertraline, trazodone, amitriptyline, and lithium) accounting for 59,827 bad outcomes during a 15-year period as reported by U.S. poison control centers,2 and plotted these on the y-axis.
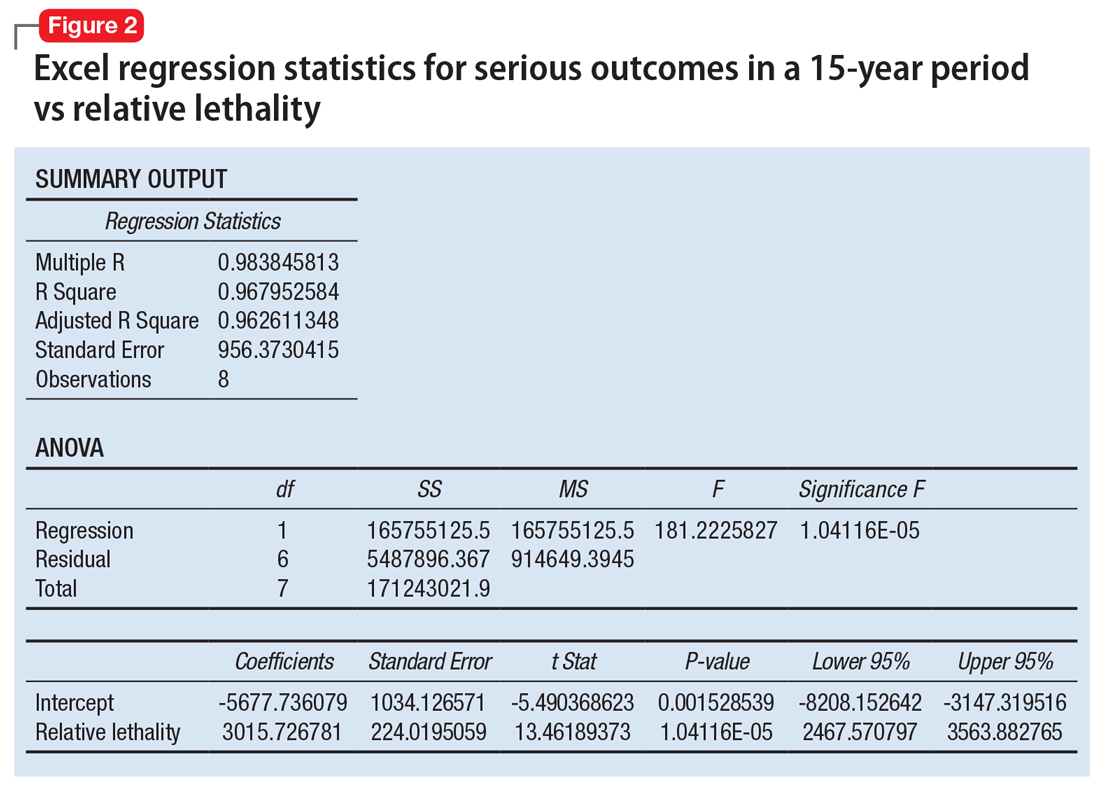
When considering the independent variable to use as a predictor for bad outcomes, I used a composite index derived with the relative lethality (RL) equation, f(x) = 310x /LD50, where x is the daily dose of a medication prescribed for 30 days, and LD50 is the rat oral lethal dose 50.3 I plotted the RL of the 8 medications on the x-axis. Then I attempted to find a mathematical function that would best fit the x and y intersection points (Figure 1). I used the Excel data analysis pack to run a logarithmic regression model (Figure 2).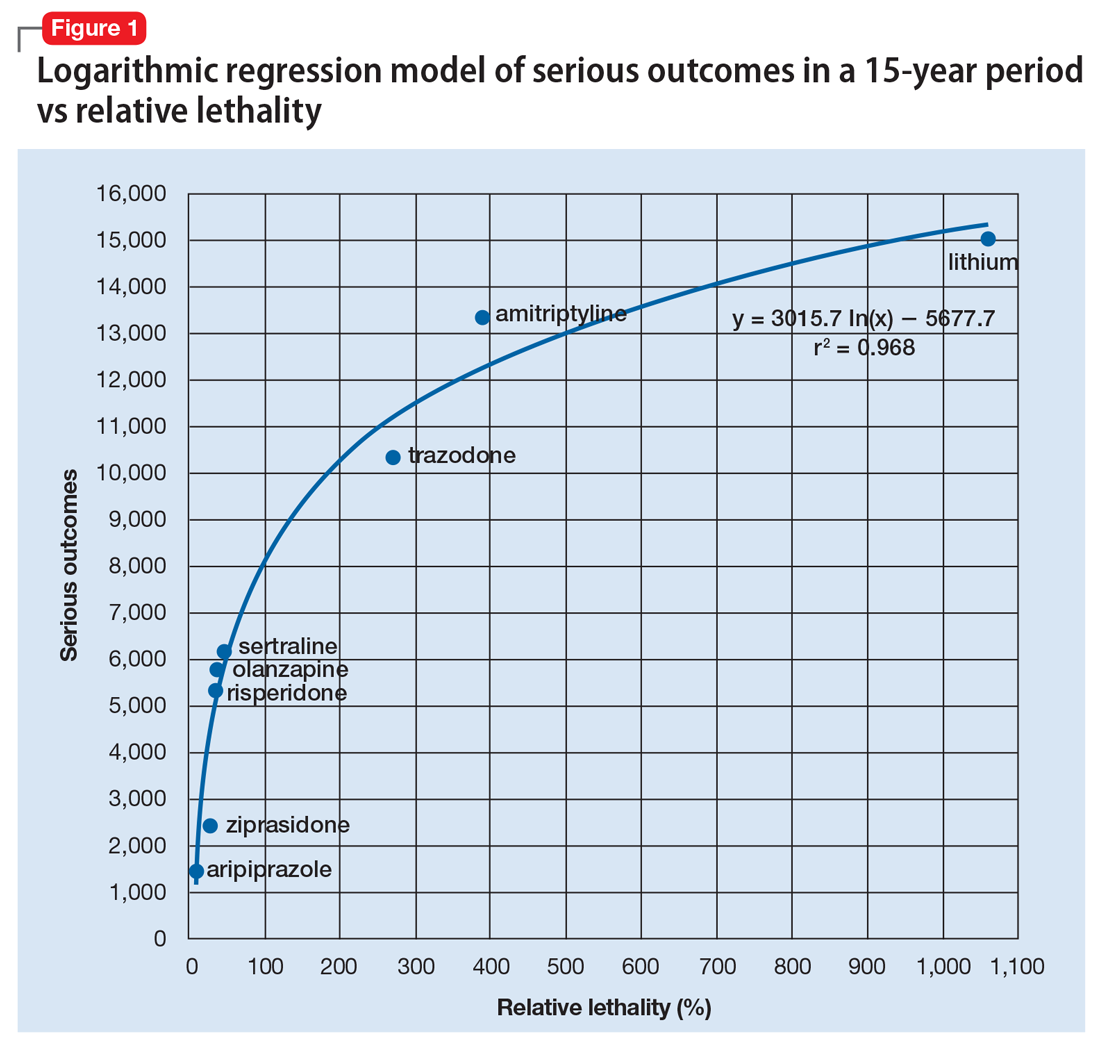
The model predicts that medications with a lower RL will have fewer serious outcomes, including mortality. The coefficient of determination r2 = 0.968, which indicates that 97% of the variation in serious outcomes is attributed to variation in RL, and 3% may be due to other factors, such as the poor quality of U.S. poison control data. This is a very significant correlation, and the causality is self-evident.
Continued to: The distribution of bad outcomes in the model was...
The distribution of bad outcomes in the model was: 1,446 for aripiprazole (RL = 9.76%), 2,387 for ziprasidone (RL = 24.80%), 5,352 for risperidone (RL = 32.63%), 5,798 for olanzapine (RL = 35.03%), 6,120 for sertraline (RL = 46.72%), 10,343 for trazodone (RL = 269.57%), 13,345 for amitriptyline (RL = 387.50%), and 15,036 for lithium (RL = 1,062.86%). The regression equation is: serious outcomes = –5,677.7 + 3,015.7 × ln (RL).
Some doctors may argue that such a data set is too small to make a meaningful model. However, the number of possible ways of ranking the drugs by bad outcomes is 8! = 40,320, so the probability of guessing the right sequence is P = .000024801. To appreciate how small this probability is, imagine trying to find a person of interest in half a football stadium on Superbowl Sunday.
The RL composite index correctly predicted the ranking order of serious outcomes for the 8 medications and may be useful for finding such outcomes in any drug class. For example, with angiotensin-converting enzyme inhibitors (n = 11) the number of possible combinations is 11! = 39,916,800. The probability of guessing the right sequence is like finding a person of interest in Poland. The model predicts the following decreasing sequence: 1) captopril, 2) fosinopril, 3) quinapril, 4) benazepril, 5) enalapril, 6) lisinopril, 7) moexipril, 8) perindopril, 9) cilazapril, 10) ramipril, 11) trandolapril. The predicted number of bad outcomes is highest for captopril, and lowest for trandolapril. The usefulness of the machine learning algorithm becomes immediately apparent.
Data can inform prescribing
Analytics can expose a critical flaw in the academic psychiatry paradigm for prescribing medications. For example, some doctors may regard lithium as the “gold standard” for treating certain mood disorders, but there is evidence that olanzapine is “significantly more effective than lithium in preventing recurrence of manic and mixed episodes.”4 Olanzapine is also 30 times safer than lithium based on its RL index, and had 9,238 fewer bad outcomes based on the 15-year data from U.S. poison control centers.2 A patient who intends to attempt suicide would easily be able to find the lethal dose of lithium from a “suicide” web site, and would quickly be able to figure out that the monthly amount of lithium his or her psychiatrist prescribed, would exceed the lethal dose.
When academia and reality collide, the use of analytics will have the final word by preventing suicide in the short term and reducing the number of bad outcomes in the long term. The irony of data science is that mathematical models can find optimal solutions to complex problems in a fraction of a second, but it may take years for a paradigm shift.
1. Bertsimas D, O’Hair AK, Pulleyblank WR. The analytics edge. Belmont, MA: Dynamic Ideas LLC; 2016.
2. Nelson JC, Spyker DA. Morbidity and mortality associated with medications used in the treatment of depression: an analysis of cases reported to U.S. poison control centers, 2000-2014. Am J Psychiatry. 2017;174(5):438-450.
3. Giurca D. Decreasing suicide risk with math. Current Psychiatry. 2018;17(2):57-59,A,B.
4. Tohen M, Greil W, Calabrese JR, et al. Olanzapine versus lithium in the maintenance treatment of bipolar disorder: a 12-month, randomized, double-blind, controlled clinical trial. Am J Psychiatry. 2005;162(7):1281-1290.
Computational psychiatry is an emerging field in which artificial intelligence and machine learning are used to find hidden patterns in big data to better understand, predict, and treat mental illness. The field uses various mathematical models to predict the dependent variable y based on the independent variable x. One application of analytics in medicine was the Framingham Heart Study, which used multivariate logistic regression to predict heart disease.1
Analytics could be used to predict the number of bad outcomes associated with different psychiatric medications over time. To demonstrate this, I examined a select data set of 8 psychiatric medications (aripiprazole, ziprasidone, risperidone, olanzapine, sertraline, trazodone, amitriptyline, and lithium) accounting for 59,827 bad outcomes during a 15-year period as reported by U.S. poison control centers,2 and plotted these on the y-axis.
When considering the independent variable to use as a predictor for bad outcomes, I used a composite index derived with the relative lethality (RL) equation, f(x) = 310x /LD50, where x is the daily dose of a medication prescribed for 30 days, and LD50 is the rat oral lethal dose 50.3 I plotted the RL of the 8 medications on the x-axis. Then I attempted to find a mathematical function that would best fit the x and y intersection points (Figure 1). I used the Excel data analysis pack to run a logarithmic regression model (Figure 2).
The model predicts that medications with a lower RL will have fewer serious outcomes, including mortality. The coefficient of determination r2 = 0.968, which indicates that 97% of the variation in serious outcomes is attributed to variation in RL, and 3% may be due to other factors, such as the poor quality of U.S. poison control data. This is a very significant correlation, and the causality is self-evident.
Continued to: The distribution of bad outcomes in the model was...
The distribution of bad outcomes in the model was: 1,446 for aripiprazole (RL = 9.76%), 2,387 for ziprasidone (RL = 24.80%), 5,352 for risperidone (RL = 32.63%), 5,798 for olanzapine (RL = 35.03%), 6,120 for sertraline (RL = 46.72%), 10,343 for trazodone (RL = 269.57%), 13,345 for amitriptyline (RL = 387.50%), and 15,036 for lithium (RL = 1,062.86%). The regression equation is: serious outcomes = –5,677.7 + 3,015.7 × ln (RL).
Some doctors may argue that such a data set is too small to make a meaningful model. However, the number of possible ways of ranking the drugs by bad outcomes is 8! = 40,320, so the probability of guessing the right sequence is P = .000024801. To appreciate how small this probability is, imagine trying to find a person of interest in half a football stadium on Superbowl Sunday.
The RL composite index correctly predicted the ranking order of serious outcomes for the 8 medications and may be useful for finding such outcomes in any drug class. For example, with angiotensin-converting enzyme inhibitors (n = 11) the number of possible combinations is 11! = 39,916,800. The probability of guessing the right sequence is like finding a person of interest in Poland. The model predicts the following decreasing sequence: 1) captopril, 2) fosinopril, 3) quinapril, 4) benazepril, 5) enalapril, 6) lisinopril, 7) moexipril, 8) perindopril, 9) cilazapril, 10) ramipril, 11) trandolapril. The predicted number of bad outcomes is highest for captopril, and lowest for trandolapril. The usefulness of the machine learning algorithm becomes immediately apparent.
Data can inform prescribing
Analytics can expose a critical flaw in the academic psychiatry paradigm for prescribing medications. For example, some doctors may regard lithium as the “gold standard” for treating certain mood disorders, but there is evidence that olanzapine is “significantly more effective than lithium in preventing recurrence of manic and mixed episodes.”4 Olanzapine is also 30 times safer than lithium based on its RL index, and had 9,238 fewer bad outcomes based on the 15-year data from U.S. poison control centers.2 A patient who intends to attempt suicide would easily be able to find the lethal dose of lithium from a “suicide” web site, and would quickly be able to figure out that the monthly amount of lithium his or her psychiatrist prescribed, would exceed the lethal dose.
When academia and reality collide, the use of analytics will have the final word by preventing suicide in the short term and reducing the number of bad outcomes in the long term. The irony of data science is that mathematical models can find optimal solutions to complex problems in a fraction of a second, but it may take years for a paradigm shift.
1. Bertsimas D, O’Hair AK, Pulleyblank WR. The analytics edge. Belmont, MA: Dynamic Ideas LLC; 2016.
2. Nelson JC, Spyker DA. Morbidity and mortality associated with medications used in the treatment of depression: an analysis of cases reported to U.S. poison control centers, 2000-2014. Am J Psychiatry. 2017;174(5):438-450.
3. Giurca D. Decreasing suicide risk with math. Current Psychiatry. 2018;17(2):57-59,A,B.
4. Tohen M, Greil W, Calabrese JR, et al. Olanzapine versus lithium in the maintenance treatment of bipolar disorder: a 12-month, randomized, double-blind, controlled clinical trial. Am J Psychiatry. 2005;162(7):1281-1290.