User login
Lithium, valproate, and suicide risk: Analysis of 98,831 cases
The current academic psychiatry paradigm reinforces that lithium reduces suicide risk, more so than other medications, including valproate. However, data from multiple sources contradict this “evidence-based” belief.
Data do not support lithium’s supposed advantage
An 8-year prospective study in Sweden by Song et al1 tracked 51,535 patients with bipolar disorder from 2005 to 2013. In their conclusions, the authors of this study omitted some surprising numbers that contradict the dominant paradigm. There were 230 (1.089%) completed suicides in the lithium group (N = 21,129), 99 (1.177%) in the valproate group (N = 8,411), and 308 (1.195%) in the “other medication” group (N = 25,780). This difference of .088% is too small (95% CI, -.180% to .358%) to substantiate the purported advantage of lithium over valproate. More important is that in terms of suicide-related events, the medication group excluding lithium and valproate had 2,018 (7.8%) events vs lithium 2,142 (10.1%) and valproate 1,105 (13.1%). The difference of 2.3% is statistically significant (95% CI, 1.8% to 2.8%). These numbers reflect fewer suicide-related events with psychiatric medications other than lithium and valproate. Compounding the problem is a design flaw in which 3,785 patients were counted twice in the lithium and valproate groups (21,129 + 8,411 + 25,780 = 55,320, which is more than the 51,535 patients in the study). By falsely inflating the denominator (N) for the lithium and valproate groups, the respective published rates are deceptively lower than the actual rates. Song et al1 did not provide an adequate explanation for these findings and omitted them from their conclusions.
In Schatzberg’s Manual of Clinical Psychopharmacology, the authors cited Song et al1 but omitted these findings as well, and stated “lithium is clearly effective in preventing suicide attempts and completions in bipolar patients.”2 In Stahl’s Essential Psychopharmacology, the author wrote “lithium actually reduces suicide in patients with bipolar disorder.”3 In a review article,
In an overlapping period, National Poison Data System (NPDS) data of single substance exposures painted a different picture in the United States.6 During 2006-2013, the lithium group (N = 26,144) had 32 deaths (all causes) (.122%), and the valproate group (N = 25,630) had 16 deaths (.062%). During 2006-2020, the lithium group (N = 52,262) had 55 deaths (.105%), and the valproate group (N = 46,569) had 31 deaths (.067%). Clearly there is a major disconnect between lithium’s advertised ability to reduce suicide risk and the actual mortality rate, as evidenced by 98,831 cases reported to NPDS during 2006-2020. One would expect a lower rate in the lithium group, but data show it is higher than in the valproate group. This underscores the common fallacy of most lithium studies: each is based on a very small sample (N < 100), and the statistical inference about the entire population is tenuous. If lithium truly reduces suicide risk 5-fold, it would be seen in a sample of 98,831. The law of large numbers and central limit theorem state that as N increases, the variability of the rate progressively decreases. This can be easily demonstrated with computer simulation models and simple Python code, or on the average fuel economy display of most cars.
What about the relative lethality?
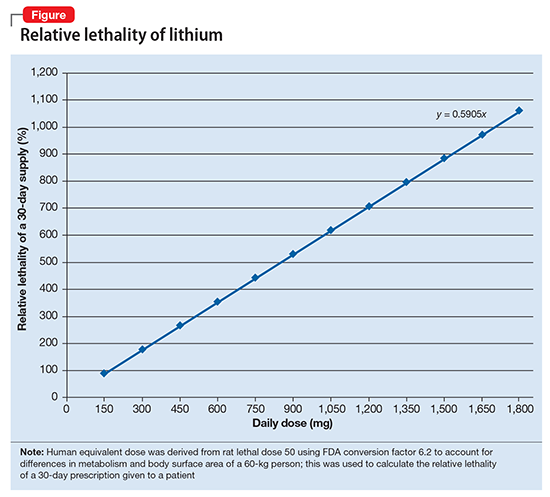
The APA Textbook of Suicide Risk Assessment and Management stated that it is important to consider the relative lethality (RL) of prescription medications.7 The RL equation (RL = 310x / LD50) represents the ratio of a 30-day supply of medication to the human equivalent LD50 for a 60-kg person (x is the daily dose and LD50 is the rat oral lethal dose 50).8 Time series analysis shows that the lithium relative morbidity (RM) is consistently double that of valproate (Figure6). Regression models have shown high correlation and causality between RL and RM.9-11 It is surprising that valproate (RL = 1,666%) has a lower RM than lithium (RL = 1,063%). This paradox can be easily explained with clinical insight. The RL equation compares medications at the maximum daily dose, but in routine practice valproate is commonly prescribed at 1,000 mg/d (28% of the maximum 3,600 mg/d). Lithium is commonly prescribed at 1,200 mg/d (67% of the maximum 1,800 mg/d). Within these dosing parameters, the effective RL is valproate 463% and lithium 709%. The 2020 RM is valproate 22% and lithium 43%.12 The COVID-19 pandemic did not affect the predicted RM. Confirming these numbers, Song et al1 acknowledged “greater safety in case of overdose for valproate in clinical practice.” Baldessarini et al4 asserted “the fatality risk of lithium overdose is only moderate, and very similar to modern antidepressants and second-generation antipsychotics.”4 This claim is contradicted by the RL equation and regression models.7-11 Lithium’s RL is 19 times higher than that of fluoxetine, and 30 times higher than that of olanzapine.8 Lithium’s RM is nearly identical to amitriptyline (42%), vs fluoxetine (12%).12

Data-driven analysis shows that lithium has higher rates of morbidity and mortality than valproate, as evidenced by 98,831 NPDS cases during 2006-2020. These hard numbers speak for themselves and contradict the dominant paradigm, which proclaims lithium’s superiority in reducing suicide risk.
1. Song J, Sjölander A, Joas E, et al. Suicidal behavior during lithium and valproate treatment: a within-individual 8-year prospective study of 50,000 patients with bipolar disorder. Am J Psychiatry. 2017;174(8):795-802.
2. Schatzberg AF, DeBattista C. Schatzberg’s Manual of Clinical Psychopharmacology. 9th ed. American Psychiatric Association Publishing; 2019:335.
3. Stahl SM. Stahl’s Essential Psychopharmacology. 4th ed. Cambridge University Press; 2013:372.
4. Baldessarini RJ, Tondo L, Davis P, et al. Decreased risk of suicides and attempts during long-term lithium treatment: a meta-analytic review. Bipolar Disord. 2006;8(5 Pt 2):625-639.
5. Oquendo MA, Galfalvy HC, Currier D, et al. Treatment of suicide attempters with bipolar disorder: a randomized clinical trial comparing lithium and valproate in the prevention of suicidal behavior. Am J Psychiatry. 2011;168(10):1050-1056.
6. American Association of Poison Control Centers. Annual reports. Accessed August 25, 2022. https://aapcc.org/annual-reports
7. Gold LH, Frierson RL (eds). The American Psychiatric Association Publishing Textbook of Suicide Risk Assessment and Management. 3rd ed. American Psychiatric Association Publishing; 2020:17-19.
8. Giurca D. Decreasing suicide risk with math. Current Psychiatry. 2018;17(2):57-59,A,B.
9. Giurca D. Data-driven prescribing. Current Psychiatry. 2018;17(10):e6-e8.
10. Giurca D. Time series analysis of poison control data. Current Psychiatry. 2020;19(6):e5-e9.
11. Giurca D, Hodgman MJ. Relative lethality of hypertension drugs. J Med Toxicol. 2022;18(2):81. 2022 American College of Medical Toxicology Annual Scientific Meeting abstract 020.
12. Gummin DD, Mowry JB, Beuhler MD, et al. 2020 Annual Report of the American Association of Poison Control Centers’ National Poison Data System (NPDS): 38th Annual Report. Clin Toxicol (Phila). 2021;59(12):1282-1501.
The current academic psychiatry paradigm reinforces that lithium reduces suicide risk, more so than other medications, including valproate. However, data from multiple sources contradict this “evidence-based” belief.
Data do not support lithium’s supposed advantage
An 8-year prospective study in Sweden by Song et al1 tracked 51,535 patients with bipolar disorder from 2005 to 2013. In their conclusions, the authors of this study omitted some surprising numbers that contradict the dominant paradigm. There were 230 (1.089%) completed suicides in the lithium group (N = 21,129), 99 (1.177%) in the valproate group (N = 8,411), and 308 (1.195%) in the “other medication” group (N = 25,780). This difference of .088% is too small (95% CI, -.180% to .358%) to substantiate the purported advantage of lithium over valproate. More important is that in terms of suicide-related events, the medication group excluding lithium and valproate had 2,018 (7.8%) events vs lithium 2,142 (10.1%) and valproate 1,105 (13.1%). The difference of 2.3% is statistically significant (95% CI, 1.8% to 2.8%). These numbers reflect fewer suicide-related events with psychiatric medications other than lithium and valproate. Compounding the problem is a design flaw in which 3,785 patients were counted twice in the lithium and valproate groups (21,129 + 8,411 + 25,780 = 55,320, which is more than the 51,535 patients in the study). By falsely inflating the denominator (N) for the lithium and valproate groups, the respective published rates are deceptively lower than the actual rates. Song et al1 did not provide an adequate explanation for these findings and omitted them from their conclusions.
In Schatzberg’s Manual of Clinical Psychopharmacology, the authors cited Song et al1 but omitted these findings as well, and stated “lithium is clearly effective in preventing suicide attempts and completions in bipolar patients.”2 In Stahl’s Essential Psychopharmacology, the author wrote “lithium actually reduces suicide in patients with bipolar disorder.”3 In a review article,
In an overlapping period, National Poison Data System (NPDS) data of single substance exposures painted a different picture in the United States.6 During 2006-2013, the lithium group (N = 26,144) had 32 deaths (all causes) (.122%), and the valproate group (N = 25,630) had 16 deaths (.062%). During 2006-2020, the lithium group (N = 52,262) had 55 deaths (.105%), and the valproate group (N = 46,569) had 31 deaths (.067%). Clearly there is a major disconnect between lithium’s advertised ability to reduce suicide risk and the actual mortality rate, as evidenced by 98,831 cases reported to NPDS during 2006-2020. One would expect a lower rate in the lithium group, but data show it is higher than in the valproate group. This underscores the common fallacy of most lithium studies: each is based on a very small sample (N < 100), and the statistical inference about the entire population is tenuous. If lithium truly reduces suicide risk 5-fold, it would be seen in a sample of 98,831. The law of large numbers and central limit theorem state that as N increases, the variability of the rate progressively decreases. This can be easily demonstrated with computer simulation models and simple Python code, or on the average fuel economy display of most cars.
What about the relative lethality?
The APA Textbook of Suicide Risk Assessment and Management stated that it is important to consider the relative lethality (RL) of prescription medications.7 The RL equation (RL = 310x / LD50) represents the ratio of a 30-day supply of medication to the human equivalent LD50 for a 60-kg person (x is the daily dose and LD50 is the rat oral lethal dose 50).8 Time series analysis shows that the lithium relative morbidity (RM) is consistently double that of valproate (Figure6). Regression models have shown high correlation and causality between RL and RM.9-11 It is surprising that valproate (RL = 1,666%) has a lower RM than lithium (RL = 1,063%). This paradox can be easily explained with clinical insight. The RL equation compares medications at the maximum daily dose, but in routine practice valproate is commonly prescribed at 1,000 mg/d (28% of the maximum 3,600 mg/d). Lithium is commonly prescribed at 1,200 mg/d (67% of the maximum 1,800 mg/d). Within these dosing parameters, the effective RL is valproate 463% and lithium 709%. The 2020 RM is valproate 22% and lithium 43%.12 The COVID-19 pandemic did not affect the predicted RM. Confirming these numbers, Song et al1 acknowledged “greater safety in case of overdose for valproate in clinical practice.” Baldessarini et al4 asserted “the fatality risk of lithium overdose is only moderate, and very similar to modern antidepressants and second-generation antipsychotics.”4 This claim is contradicted by the RL equation and regression models.7-11 Lithium’s RL is 19 times higher than that of fluoxetine, and 30 times higher than that of olanzapine.8 Lithium’s RM is nearly identical to amitriptyline (42%), vs fluoxetine (12%).12
Data-driven analysis shows that lithium has higher rates of morbidity and mortality than valproate, as evidenced by 98,831 NPDS cases during 2006-2020. These hard numbers speak for themselves and contradict the dominant paradigm, which proclaims lithium’s superiority in reducing suicide risk.
1. Song J, Sjölander A, Joas E, et al. Suicidal behavior during lithium and valproate treatment: a within-individual 8-year prospective study of 50,000 patients with bipolar disorder. Am J Psychiatry. 2017;174(8):795-802.
2. Schatzberg AF, DeBattista C. Schatzberg’s Manual of Clinical Psychopharmacology. 9th ed. American Psychiatric Association Publishing; 2019:335.
3. Stahl SM. Stahl’s Essential Psychopharmacology. 4th ed. Cambridge University Press; 2013:372.
4. Baldessarini RJ, Tondo L, Davis P, et al. Decreased risk of suicides and attempts during long-term lithium treatment: a meta-analytic review. Bipolar Disord. 2006;8(5 Pt 2):625-639.
5. Oquendo MA, Galfalvy HC, Currier D, et al. Treatment of suicide attempters with bipolar disorder: a randomized clinical trial comparing lithium and valproate in the prevention of suicidal behavior. Am J Psychiatry. 2011;168(10):1050-1056.
6. American Association of Poison Control Centers. Annual reports. Accessed August 25, 2022. https://aapcc.org/annual-reports
7. Gold LH, Frierson RL (eds). The American Psychiatric Association Publishing Textbook of Suicide Risk Assessment and Management. 3rd ed. American Psychiatric Association Publishing; 2020:17-19.
8. Giurca D. Decreasing suicide risk with math. Current Psychiatry. 2018;17(2):57-59,A,B.
9. Giurca D. Data-driven prescribing. Current Psychiatry. 2018;17(10):e6-e8.
10. Giurca D. Time series analysis of poison control data. Current Psychiatry. 2020;19(6):e5-e9.
11. Giurca D, Hodgman MJ. Relative lethality of hypertension drugs. J Med Toxicol. 2022;18(2):81. 2022 American College of Medical Toxicology Annual Scientific Meeting abstract 020.
12. Gummin DD, Mowry JB, Beuhler MD, et al. 2020 Annual Report of the American Association of Poison Control Centers’ National Poison Data System (NPDS): 38th Annual Report. Clin Toxicol (Phila). 2021;59(12):1282-1501.

Time series analysis of poison control data
The US Poison Control Centers’ National Poison Data System (NPDS) publishes annual reports describing exposures to various substances among the general population.1 Table 22B of each NPDS report shows the number of outcomes from exposures to different pharmacologic treatments in the United States, including psychotropic medications.2 In this Table, the relative morbidity (RM) of a medication is calculated as the ratio of serious outcomes (SO) to single exposures (SE), where SO = moderate + major + death. In this article, I use the NPDS data to demonstrate how time series analysis of the RM ratios for hypertension and psychiatric medications can help predict SO associated with these agents, which may help guide clinicians’ prescribing decisions.2,3
Time series analysis of hypertension medications
Due to the high prevalence of hypertension, it is not surprising that more suicide deaths occur each year from calcium channel blockers (CCB) than from lithium (37 vs 2, according to 2017 NPDS data).3 I used time series analysis to compare SO during 2006-2017 for 5 classes of hypertension medications: CCB, beta blockers (BB), angiotensin-converting enzyme inhibitors (ACEI), angiotensin receptor blockers (ARB), and diuretics (Figure 1).

Time series analysis of 2006-2017 data predicted the following number of deaths for 2018: CCB ≥33, BB ≥17, ACEI ≤2, ARB 0, and diuretics ≤1. The observed deaths in 2018 were 41, 23, 0, 0, and 1, respectively.2 The 2018 predicted RM were CCB 10.66%, BB 11.10%, ACEI 3.51%, ARB 2.04%, and diuretics 3.38%. The 2018 observed RM for these medications were 11.01%, 11.37%, 3.02%, 2.40%, and 2.88%, respectively.2
Because the NPDS data for hypertension medications was only provided by class, in order to detect differences within each class, I used the relative lethality (RL) equation: RL = 310x / LD50, where x is the maximum daily dose of a medication prescribed for 30 days, and LD50 is the rat oral lethal dose 50. The RL equation represents the ratio of a 30-day supply of medication to the human equivalent LD50 for a 60-kg person.4 The RL equation is useful for comparing the safety of various medications, and can help clinicians avoid prescribing a lethal amount of a given medication (Figure 2). For example, the equation shows that among CCB, felodipine is 466 times safer than verapamil and 101 times safer than diltiazem. Not surprisingly, 2006-2018 data shows many deaths via intentional verapamil or diltiazem overdose vs only 1 reference to felodipine. A regression model shows significant correlation and causality between RL and SO over time.5 Integrating all 3 mathematical models suggests that the higher RM of CCB and BB may be caused by the high RL of verapamil, diltiazem, nicardipine, propranolol, and labetalol.

These mathematical models can help physicians consider whether to switch the patient’s current medication to another class with a lower RM. For patients who need a BB or CCB, prescribing a medication with a lower RL within the same class may be another option. The data suggest that avoiding hypertension medications with RL >100% may significantly decrease morbidity and mortality.
Predicting serious outcomes of psychiatric medications
The 2018 NPDS data for psychiatric medications show similarly important results.2 For example, the lithium RM is predictable over time (Figure 3) and has been consistently the highest among psychiatric medications. Using 2006-2017 NPDS data,3 I predicted that the 2018 lithium RM would be 41.56%. The 2018 observed lithium RM was 41.45%.2 I created a linear regression model for each NPDS report from 2013 to 2018 to illustrate the correlation between RL and adjusted SO for 13 psychiatric medications.2,3,6,7 To account for different sample sizes among medications, the lithium SE for each respective year was used for all medications (adjusted SO = SE × RM). A time series analysis of these regression models shows that SO data points hover in the same y-axis region from year to year, with a corresponding RL on the x-axis: escitalopram 6.33%, citalopram 15.50%, mirtazapine 28.47%, paroxetine 37.35%, sertraline 46.72%, fluoxetine 54.87%, venlafaxine 99.64%, duloxetine 133.33%, trazodone 269.57%, bupropion 289.42%, amitriptyline 387.50%, doxepin 632.65%, and lithium 1062.86% (Figure 4). Every year, the scatter plot shape remains approximately the same, which suggests that both SO and RM can be predicted over time. Medications with RL >300% have SO ≈ 1500 (RM ≈ 40%), and those with RL <100% have SO ≈ 500 (RM ≈ 13%).

Time series analysis of NPDS data sheds light on hidden patterns. It may help clinicians discern patterns of potential SO associated with various hypertension and psychiatric medications. RL based on rat experimental data is highly correlated to RM based on human observational data, and the causality is self-evident. On a global scale, data-driven prescribing of medications with RL <100% could potentially help prevent millions of SO every year.

1. National Poison Data System Annual Reports. American Association of Poison Control Centers. https://www.aapcc.org/annual-reports. Updated November 2019. Accessed May 5, 2020.
2. Gummin DD, Mowry JB, Spyker DA, et al. 2018 Annual Report of the American Association of Poison Control Centers’ National Poison Data System (NPDS): 36th Annual Report. Clin Toxicol (Phila). 2019;57(12):1220-1413.
3. Gummin DD, Mowry JB, Spyker DA, et al. 2017 Annual Report of the American Association of Poison Control Centers’ National Poison Data System (NPDS): 35th Annual Report. Clin Toxicol (Phila). 2018;56(12):1213-1415.
4. Giurca D. Decreasing suicide risk with math. Current Psychiatry. 2018;17(2):57-59,A,B.
5. Giurca D. Data-driven prescribing. Current Psychiatry. 2018;17(10):e6-e8.
6. Mowry JB, Spyker DA, Brooks DE, et al. 2015 Annual Report of the American Association of Poison Control Centers’ National Poison Data System (NPDS): 33rd Annual Report. Clin Toxicol (Phila). 2016;54(10):924-1109.
7. Gummin DD, Mowry JB, Spyker DA, et al. 2016 Annual Report of the American Association of Poison Control Centers’ National Poison Data System (NPDS): 34th Annual Report. Clin Toxicol (Phila). 2017;55(10):1072-1252.
The US Poison Control Centers’ National Poison Data System (NPDS) publishes annual reports describing exposures to various substances among the general population.1 Table 22B of each NPDS report shows the number of outcomes from exposures to different pharmacologic treatments in the United States, including psychotropic medications.2 In this Table, the relative morbidity (RM) of a medication is calculated as the ratio of serious outcomes (SO) to single exposures (SE), where SO = moderate + major + death. In this article, I use the NPDS data to demonstrate how time series analysis of the RM ratios for hypertension and psychiatric medications can help predict SO associated with these agents, which may help guide clinicians’ prescribing decisions.2,3
Time series analysis of hypertension medications
Due to the high prevalence of hypertension, it is not surprising that more suicide deaths occur each year from calcium channel blockers (CCB) than from lithium (37 vs 2, according to 2017 NPDS data).3 I used time series analysis to compare SO during 2006-2017 for 5 classes of hypertension medications: CCB, beta blockers (BB), angiotensin-converting enzyme inhibitors (ACEI), angiotensin receptor blockers (ARB), and diuretics (Figure 1).
Time series analysis of 2006-2017 data predicted the following number of deaths for 2018: CCB ≥33, BB ≥17, ACEI ≤2, ARB 0, and diuretics ≤1. The observed deaths in 2018 were 41, 23, 0, 0, and 1, respectively.2 The 2018 predicted RM were CCB 10.66%, BB 11.10%, ACEI 3.51%, ARB 2.04%, and diuretics 3.38%. The 2018 observed RM for these medications were 11.01%, 11.37%, 3.02%, 2.40%, and 2.88%, respectively.2
Because the NPDS data for hypertension medications was only provided by class, in order to detect differences within each class, I used the relative lethality (RL) equation: RL = 310x / LD50, where x is the maximum daily dose of a medication prescribed for 30 days, and LD50 is the rat oral lethal dose 50. The RL equation represents the ratio of a 30-day supply of medication to the human equivalent LD50 for a 60-kg person.4 The RL equation is useful for comparing the safety of various medications, and can help clinicians avoid prescribing a lethal amount of a given medication (Figure 2). For example, the equation shows that among CCB, felodipine is 466 times safer than verapamil and 101 times safer than diltiazem. Not surprisingly, 2006-2018 data shows many deaths via intentional verapamil or diltiazem overdose vs only 1 reference to felodipine. A regression model shows significant correlation and causality between RL and SO over time.5 Integrating all 3 mathematical models suggests that the higher RM of CCB and BB may be caused by the high RL of verapamil, diltiazem, nicardipine, propranolol, and labetalol.
These mathematical models can help physicians consider whether to switch the patient’s current medication to another class with a lower RM. For patients who need a BB or CCB, prescribing a medication with a lower RL within the same class may be another option. The data suggest that avoiding hypertension medications with RL >100% may significantly decrease morbidity and mortality.
Predicting serious outcomes of psychiatric medications
The 2018 NPDS data for psychiatric medications show similarly important results.2 For example, the lithium RM is predictable over time (Figure 3) and has been consistently the highest among psychiatric medications. Using 2006-2017 NPDS data,3 I predicted that the 2018 lithium RM would be 41.56%. The 2018 observed lithium RM was 41.45%.2 I created a linear regression model for each NPDS report from 2013 to 2018 to illustrate the correlation between RL and adjusted SO for 13 psychiatric medications.2,3,6,7 To account for different sample sizes among medications, the lithium SE for each respective year was used for all medications (adjusted SO = SE × RM). A time series analysis of these regression models shows that SO data points hover in the same y-axis region from year to year, with a corresponding RL on the x-axis: escitalopram 6.33%, citalopram 15.50%, mirtazapine 28.47%, paroxetine 37.35%, sertraline 46.72%, fluoxetine 54.87%, venlafaxine 99.64%, duloxetine 133.33%, trazodone 269.57%, bupropion 289.42%, amitriptyline 387.50%, doxepin 632.65%, and lithium 1062.86% (Figure 4). Every year, the scatter plot shape remains approximately the same, which suggests that both SO and RM can be predicted over time. Medications with RL >300% have SO ≈ 1500 (RM ≈ 40%), and those with RL <100% have SO ≈ 500 (RM ≈ 13%).
Time series analysis of NPDS data sheds light on hidden patterns. It may help clinicians discern patterns of potential SO associated with various hypertension and psychiatric medications. RL based on rat experimental data is highly correlated to RM based on human observational data, and the causality is self-evident. On a global scale, data-driven prescribing of medications with RL <100% could potentially help prevent millions of SO every year.
1. National Poison Data System Annual Reports. American Association of Poison Control Centers. https://www.aapcc.org/annual-reports. Updated November 2019. Accessed May 5, 2020.
2. Gummin DD, Mowry JB, Spyker DA, et al. 2018 Annual Report of the American Association of Poison Control Centers’ National Poison Data System (NPDS): 36th Annual Report. Clin Toxicol (Phila). 2019;57(12):1220-1413.
3. Gummin DD, Mowry JB, Spyker DA, et al. 2017 Annual Report of the American Association of Poison Control Centers’ National Poison Data System (NPDS): 35th Annual Report. Clin Toxicol (Phila). 2018;56(12):1213-1415.
4. Giurca D. Decreasing suicide risk with math. Current Psychiatry. 2018;17(2):57-59,A,B.
5. Giurca D. Data-driven prescribing. Current Psychiatry. 2018;17(10):e6-e8.
6. Mowry JB, Spyker DA, Brooks DE, et al. 2015 Annual Report of the American Association of Poison Control Centers’ National Poison Data System (NPDS): 33rd Annual Report. Clin Toxicol (Phila). 2016;54(10):924-1109.
7. Gummin DD, Mowry JB, Spyker DA, et al. 2016 Annual Report of the American Association of Poison Control Centers’ National Poison Data System (NPDS): 34th Annual Report. Clin Toxicol (Phila). 2017;55(10):1072-1252.

Data-driven prescribing
Computational psychiatry is an emerging field in which artificial intelligence and machine learning are used to find hidden patterns in big data to better understand, predict, and treat mental illness. The field uses various mathematical models to predict the dependent variable y based on the independent variable x. One application of analytics in medicine was the Framingham Heart Study, which used multivariate logistic regression to predict heart disease.1
Analytics could be used to predict the number of bad outcomes associated with different psychiatric medications over time. To demonstrate this, I examined a select data set of 8 psychiatric medications (aripiprazole, ziprasidone, risperidone, olanzapine, sertraline, trazodone, amitriptyline, and lithium) accounting for 59,827 bad outcomes during a 15-year period as reported by U.S. poison control centers,2 and plotted these on the y-axis.
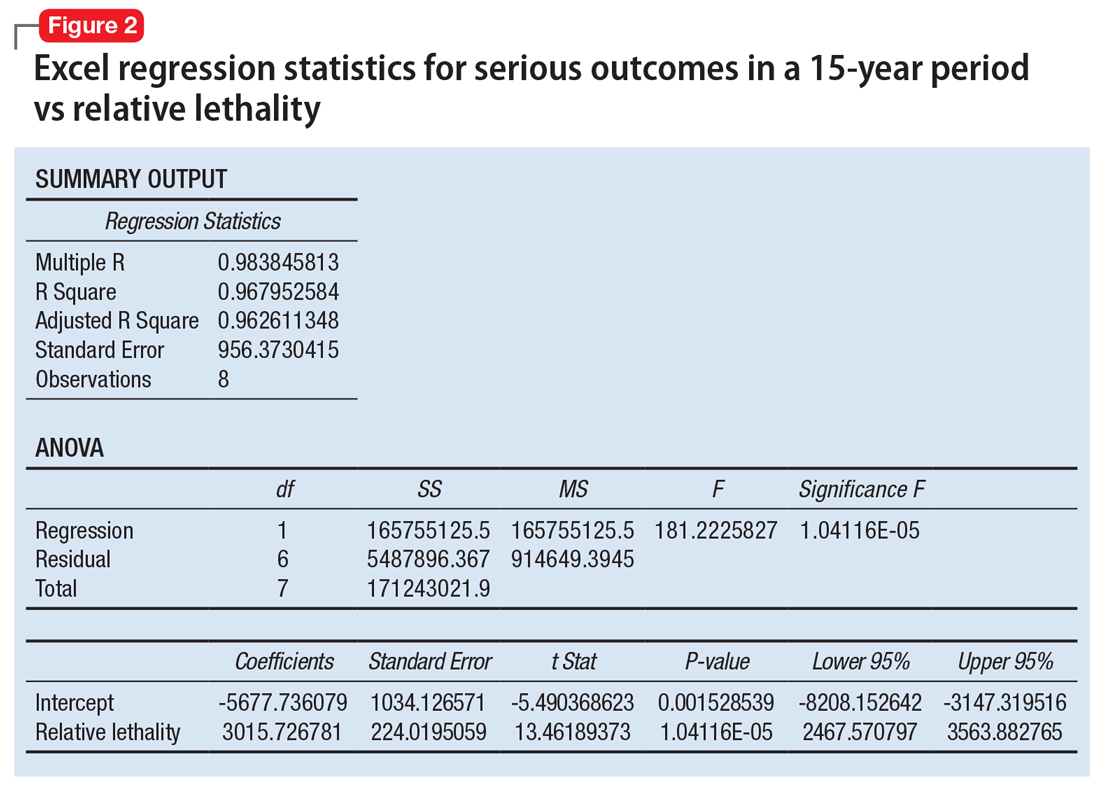
When considering the independent variable to use as a predictor for bad outcomes, I used a composite index derived with the relative lethality (RL) equation, f(x) = 310x /LD50, where x is the daily dose of a medication prescribed for 30 days, and LD50 is the rat oral lethal dose 50.3 I plotted the RL of the 8 medications on the x-axis. Then I attempted to find a mathematical function that would best fit the x and y intersection points (Figure 1). I used the Excel data analysis pack to run a logarithmic regression model (Figure 2).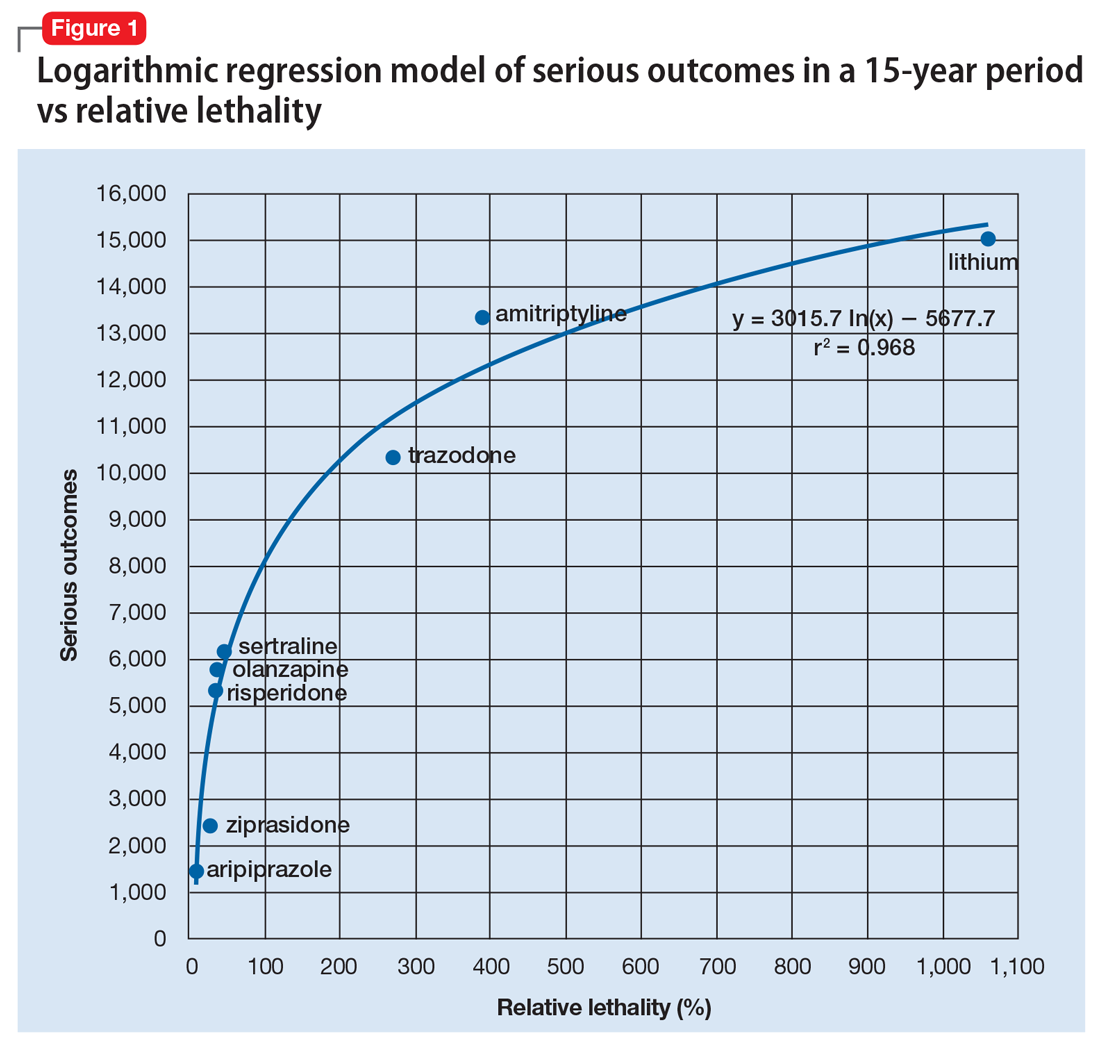
The model predicts that medications with a lower RL will have fewer serious outcomes, including mortality. The coefficient of determination r2 = 0.968, which indicates that 97% of the variation in serious outcomes is attributed to variation in RL, and 3% may be due to other factors, such as the poor quality of U.S. poison control data. This is a very significant correlation, and the causality is self-evident.
Continued to: The distribution of bad outcomes in the model was...
The distribution of bad outcomes in the model was: 1,446 for aripiprazole (RL = 9.76%), 2,387 for ziprasidone (RL = 24.80%), 5,352 for risperidone (RL = 32.63%), 5,798 for olanzapine (RL = 35.03%), 6,120 for sertraline (RL = 46.72%), 10,343 for trazodone (RL = 269.57%), 13,345 for amitriptyline (RL = 387.50%), and 15,036 for lithium (RL = 1,062.86%). The regression equation is: serious outcomes = –5,677.7 + 3,015.7 × ln (RL).
Some doctors may argue that such a data set is too small to make a meaningful model. However, the number of possible ways of ranking the drugs by bad outcomes is 8! = 40,320, so the probability of guessing the right sequence is P = .000024801. To appreciate how small this probability is, imagine trying to find a person of interest in half a football stadium on Superbowl Sunday.
The RL composite index correctly predicted the ranking order of serious outcomes for the 8 medications and may be useful for finding such outcomes in any drug class. For example, with angiotensin-converting enzyme inhibitors (n = 11) the number of possible combinations is 11! = 39,916,800. The probability of guessing the right sequence is like finding a person of interest in Poland. The model predicts the following decreasing sequence: 1) captopril, 2) fosinopril, 3) quinapril, 4) benazepril, 5) enalapril, 6) lisinopril, 7) moexipril, 8) perindopril, 9) cilazapril, 10) ramipril, 11) trandolapril. The predicted number of bad outcomes is highest for captopril, and lowest for trandolapril. The usefulness of the machine learning algorithm becomes immediately apparent.
Data can inform prescribing
Analytics can expose a critical flaw in the academic psychiatry paradigm for prescribing medications. For example, some doctors may regard lithium as the “gold standard” for treating certain mood disorders, but there is evidence that olanzapine is “significantly more effective than lithium in preventing recurrence of manic and mixed episodes.”4 Olanzapine is also 30 times safer than lithium based on its RL index, and had 9,238 fewer bad outcomes based on the 15-year data from U.S. poison control centers.2 A patient who intends to attempt suicide would easily be able to find the lethal dose of lithium from a “suicide” web site, and would quickly be able to figure out that the monthly amount of lithium his or her psychiatrist prescribed, would exceed the lethal dose.
When academia and reality collide, the use of analytics will have the final word by preventing suicide in the short term and reducing the number of bad outcomes in the long term. The irony of data science is that mathematical models can find optimal solutions to complex problems in a fraction of a second, but it may take years for a paradigm shift.
1. Bertsimas D, O’Hair AK, Pulleyblank WR. The analytics edge. Belmont, MA: Dynamic Ideas LLC; 2016.
2. Nelson JC, Spyker DA. Morbidity and mortality associated with medications used in the treatment of depression: an analysis of cases reported to U.S. poison control centers, 2000-2014. Am J Psychiatry. 2017;174(5):438-450.
3. Giurca D. Decreasing suicide risk with math. Current Psychiatry. 2018;17(2):57-59,A,B.
4. Tohen M, Greil W, Calabrese JR, et al. Olanzapine versus lithium in the maintenance treatment of bipolar disorder: a 12-month, randomized, double-blind, controlled clinical trial. Am J Psychiatry. 2005;162(7):1281-1290.
Computational psychiatry is an emerging field in which artificial intelligence and machine learning are used to find hidden patterns in big data to better understand, predict, and treat mental illness. The field uses various mathematical models to predict the dependent variable y based on the independent variable x. One application of analytics in medicine was the Framingham Heart Study, which used multivariate logistic regression to predict heart disease.1
Analytics could be used to predict the number of bad outcomes associated with different psychiatric medications over time. To demonstrate this, I examined a select data set of 8 psychiatric medications (aripiprazole, ziprasidone, risperidone, olanzapine, sertraline, trazodone, amitriptyline, and lithium) accounting for 59,827 bad outcomes during a 15-year period as reported by U.S. poison control centers,2 and plotted these on the y-axis.
When considering the independent variable to use as a predictor for bad outcomes, I used a composite index derived with the relative lethality (RL) equation, f(x) = 310x /LD50, where x is the daily dose of a medication prescribed for 30 days, and LD50 is the rat oral lethal dose 50.3 I plotted the RL of the 8 medications on the x-axis. Then I attempted to find a mathematical function that would best fit the x and y intersection points (Figure 1). I used the Excel data analysis pack to run a logarithmic regression model (Figure 2).
The model predicts that medications with a lower RL will have fewer serious outcomes, including mortality. The coefficient of determination r2 = 0.968, which indicates that 97% of the variation in serious outcomes is attributed to variation in RL, and 3% may be due to other factors, such as the poor quality of U.S. poison control data. This is a very significant correlation, and the causality is self-evident.
Continued to: The distribution of bad outcomes in the model was...
The distribution of bad outcomes in the model was: 1,446 for aripiprazole (RL = 9.76%), 2,387 for ziprasidone (RL = 24.80%), 5,352 for risperidone (RL = 32.63%), 5,798 for olanzapine (RL = 35.03%), 6,120 for sertraline (RL = 46.72%), 10,343 for trazodone (RL = 269.57%), 13,345 for amitriptyline (RL = 387.50%), and 15,036 for lithium (RL = 1,062.86%). The regression equation is: serious outcomes = –5,677.7 + 3,015.7 × ln (RL).
Some doctors may argue that such a data set is too small to make a meaningful model. However, the number of possible ways of ranking the drugs by bad outcomes is 8! = 40,320, so the probability of guessing the right sequence is P = .000024801. To appreciate how small this probability is, imagine trying to find a person of interest in half a football stadium on Superbowl Sunday.
The RL composite index correctly predicted the ranking order of serious outcomes for the 8 medications and may be useful for finding such outcomes in any drug class. For example, with angiotensin-converting enzyme inhibitors (n = 11) the number of possible combinations is 11! = 39,916,800. The probability of guessing the right sequence is like finding a person of interest in Poland. The model predicts the following decreasing sequence: 1) captopril, 2) fosinopril, 3) quinapril, 4) benazepril, 5) enalapril, 6) lisinopril, 7) moexipril, 8) perindopril, 9) cilazapril, 10) ramipril, 11) trandolapril. The predicted number of bad outcomes is highest for captopril, and lowest for trandolapril. The usefulness of the machine learning algorithm becomes immediately apparent.
Data can inform prescribing
Analytics can expose a critical flaw in the academic psychiatry paradigm for prescribing medications. For example, some doctors may regard lithium as the “gold standard” for treating certain mood disorders, but there is evidence that olanzapine is “significantly more effective than lithium in preventing recurrence of manic and mixed episodes.”4 Olanzapine is also 30 times safer than lithium based on its RL index, and had 9,238 fewer bad outcomes based on the 15-year data from U.S. poison control centers.2 A patient who intends to attempt suicide would easily be able to find the lethal dose of lithium from a “suicide” web site, and would quickly be able to figure out that the monthly amount of lithium his or her psychiatrist prescribed, would exceed the lethal dose.
When academia and reality collide, the use of analytics will have the final word by preventing suicide in the short term and reducing the number of bad outcomes in the long term. The irony of data science is that mathematical models can find optimal solutions to complex problems in a fraction of a second, but it may take years for a paradigm shift.
1. Bertsimas D, O’Hair AK, Pulleyblank WR. The analytics edge. Belmont, MA: Dynamic Ideas LLC; 2016.
2. Nelson JC, Spyker DA. Morbidity and mortality associated with medications used in the treatment of depression: an analysis of cases reported to U.S. poison control centers, 2000-2014. Am J Psychiatry. 2017;174(5):438-450.
3. Giurca D. Decreasing suicide risk with math. Current Psychiatry. 2018;17(2):57-59,A,B.
4. Tohen M, Greil W, Calabrese JR, et al. Olanzapine versus lithium in the maintenance treatment of bipolar disorder: a 12-month, randomized, double-blind, controlled clinical trial. Am J Psychiatry. 2005;162(7):1281-1290.
Decreasing suicide risk with math
Suicide is a common reality, accounting for approximately 800,000 deaths per year worldwide.1 Properly assessing and minimizing suicide risk can be challenging. We are taught that lithium and clozapine can decrease suicidality, and many psychiatrists prescribe these medications with the firm, “evidence-based” belief that doing so reduces suicide risk. Paradoxically, what they in fact might be doing is the exact opposite; they may be giving high-risk patients the opportunity and the means to attempt suicide with a lethal amount of medication.
One patient diagnosed with a mood disorder who attempted suicide had a surprising point of view. After taking a large qu
Operations research is a subfield of mathematics that tries to optimize one or more variables when multiple variables are in play. One example would be to maximize profit while minimizing cost. During World War II, operations research was used to decrease the number of munitions used to shoot down airplanes, and to sink submarines more efficiently.
Focusing on the patient who attempted suicide by overdose, the question was: If she was discharged from the psychiatry unit with a 30-day supply of medication, how lethal would that prescription be if deliberately taken all at once? And what can be done to minimize this suicide risk? Psychiatrists know that some medications are more dangerous than others, but few have performed quantitative analysis to determine the potential lethality of these medications. The math analysis did not involve multivariable calculus or differential equations, only multiplication and division. The results were eye-opening.
Calculating relative lethality
The lethal dose 50 (LD50) is the dose of a medication expressed in mg/kg that results in the death of 50% of the animals (usually rats) used in a controlled experiment. Open-source data for the LD50 of medications is provided by the manufacturers.
I tabulated this data for a wide range of psychiatric medications, including antipsychotics, mood stabilizers, and selective serotonin reuptake inhibitors, in a spreadsheet with columns for maximum daily dose, 30-day supply of the medication, LD50 in mg/kg, LD50 for a 60-kg subject, and percentage of the 30-day supply compared with LD50. I then sorted this data by relative lethality (for my complete data, see Figure 1 and the Table).
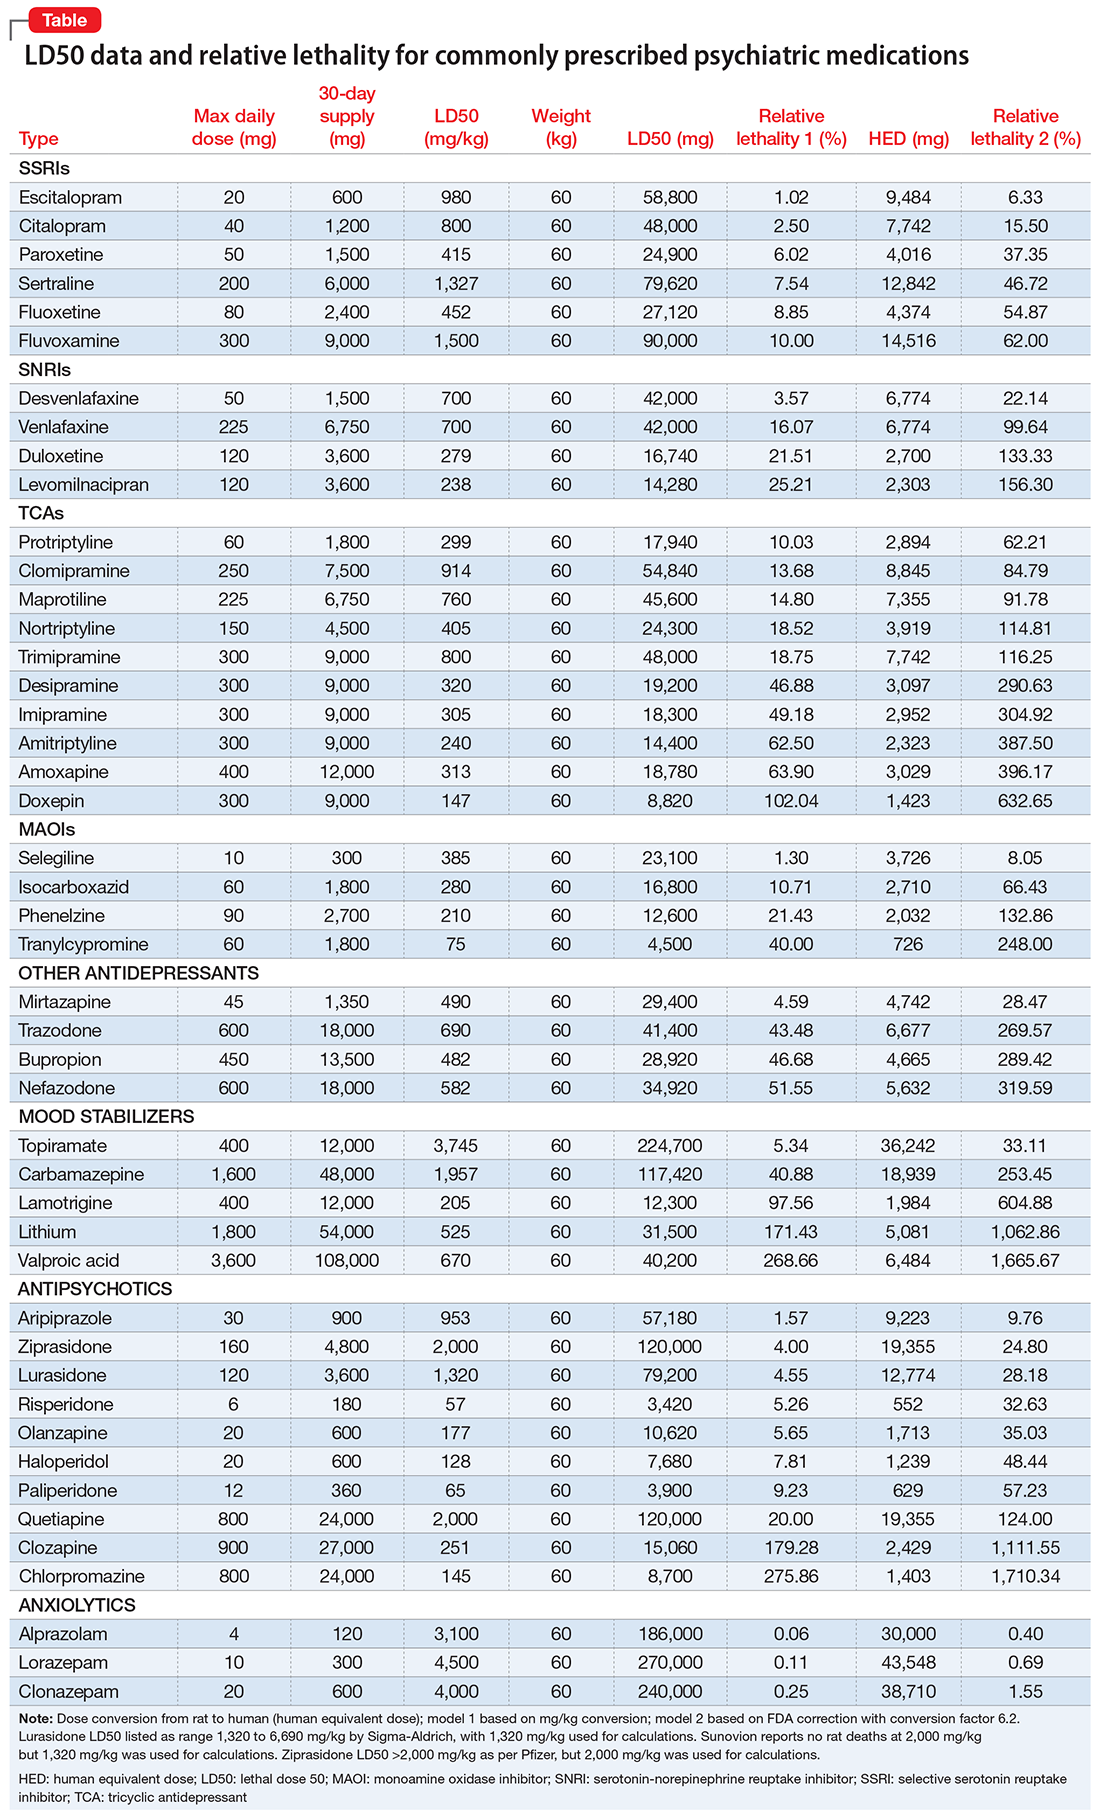
The rat dose in mg/kg was extrapolated to the human equivalent dose (HED) in mg/kg using a conversion factor of 6.2 (for a person who weighs 60 kg, the HED = LD50/6.2) as suggested by the FDA.2 The dose for the first fatality is smaller than the HED, and toxicity occurs at even smaller doses. After simplifying all the terms, the formula for the HED-relative lethality is f(x) = 310x/LD50, where x is the daily dose of a medication prescribed for 30 days. This is the equation of a straight line with a slope inversely proportional to the LD50 of each medication and a y-axis intercept of 0. Each medication line shows that any dose rising above 100% on the y-axis is a quantum higher than the lethal dose.
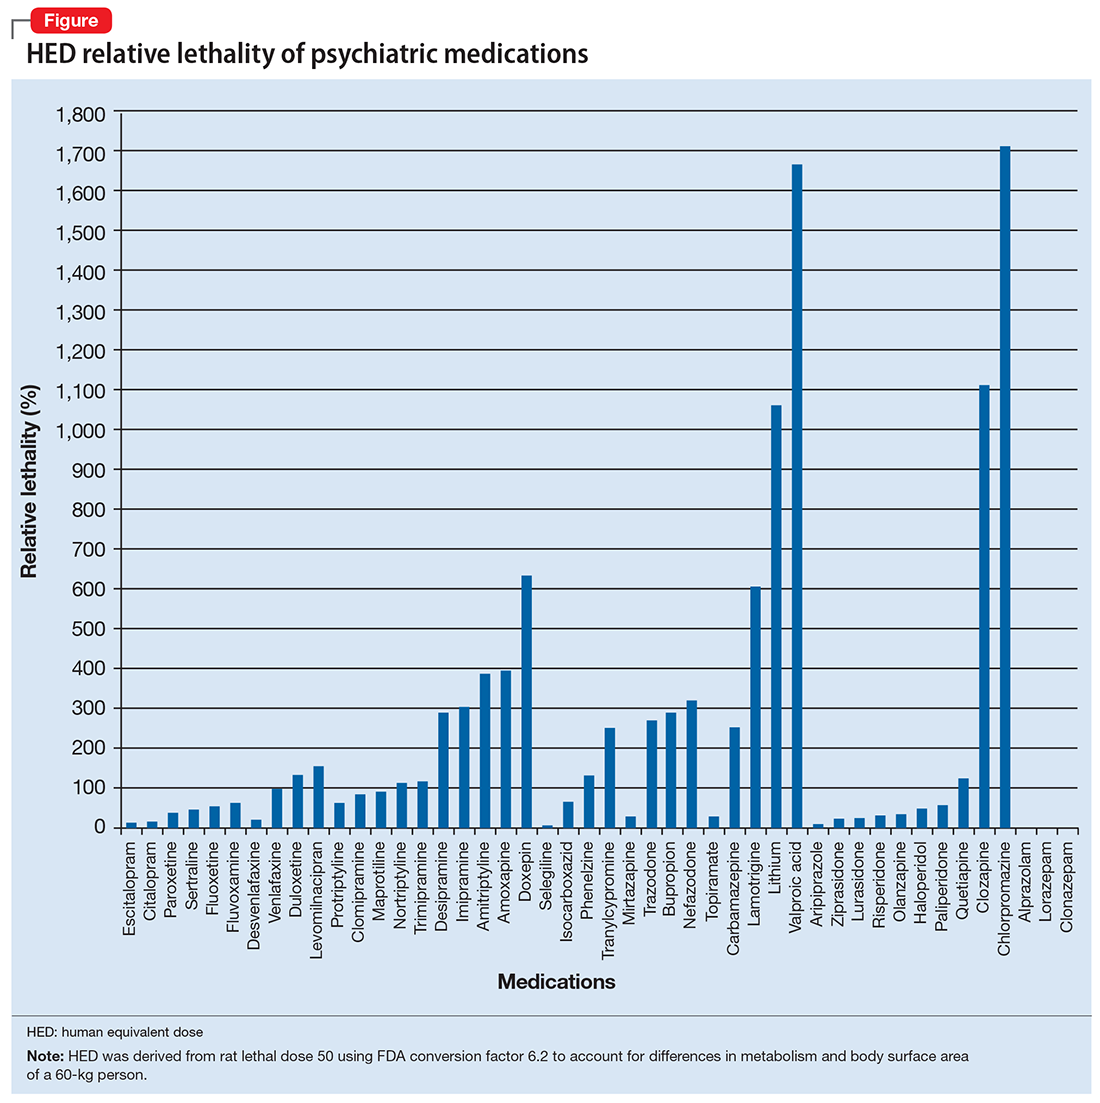
Some commonly prescribed psychotropics are highly lethal
The relative lethality of many commonly prescribed psychiatric medications, including those frequently used to reduce suicidality, varies tremendously. For example, it is widely known that the first-line mood stabilizer lithium has a narrow therapeutic window and can rapidly become toxic. If a patient becomes dehydrated, even a normal lithium dose can be toxic or lethal. Lithium has a relative lethality of 1,063% (Figure 2). Clozapine has a relative lethality of 1,112%. Valproic acid has an even higher relative lethality of 1,666%. By contrast, aripiprazole and olanzapine have a relative lethality of 10% and 35%, respectively. For preventing suicide, prescribing a second-generation antipsychotic with a lower relative lethality may be preferable over prescribing a medication with a higher relative lethality.
According to U.S. poison control centers,3 from 2000 to 2014, there were 15,036 serious outcomes, including 61 deaths, associated with lithium use, and 6,109 serious outcomes, including 37 deaths, associated with valproic acid. In contrast, there were only 1,446 serious outcomes and no deaths associated with aripiprazole use.3 These outcomes may be underreported, but they are consistent with the mathematical model predicting that medications with a higher relative lethality will have higher morbidity and mortality outcomes, regardless of a patient’s intent to overdose.
Many psychiatrists have a preferred antidepressant, mood stabilizer, or antipsychotic, and may prescribe this medication to many of their patients based on familiarity with the agent or other factors. However, simple math can give the decision process of selecting a specific medication for a given patient a more quantitative basis.
Even a small reduction in suicide would save many lives
Ultimately, the math problem comes down to 4 minutes, which is approximately how long the brain can survive without oxygen. By prescribing medications with a lower relative lethality, or by prescribing a less-than-30-day supply of the most lethal medications, it may be possible to decrease overdose morbidity and mortality, and also buy enough time for emergency personnel to save a life. If simple math can put even a 1% dent in the rate of death from suicide, approximately 8,000 lives might be saved every year.
1. World Health Organization. Suicide. Fact sheet. http://www.who.int/mediacentre/factsheets/fs398/en. Updated August 2017. Accessed January 3, 2018.
2. U.S. Food and Drug Administration. Estimating the maximum safe starting dose in initial clinical trials for therapeutics in adult healthy volunteers. https://www.fda.gov/downloads/drugs/guidances/ucm078932.pdf. Published July 6, 2005. Accessed January 8, 2018.
3. Nelson JC, Spyker DA. Morbidity and mortality associated with medications used in the treatment of depression: an analysis of cases reported to U.S. Poison Control Centers, 2000-2014. Am J Psychiatry. 2017;174(5):438-450.
Suicide is a common reality, accounting for approximately 800,000 deaths per year worldwide.1 Properly assessing and minimizing suicide risk can be challenging. We are taught that lithium and clozapine can decrease suicidality, and many psychiatrists prescribe these medications with the firm, “evidence-based” belief that doing so reduces suicide risk. Paradoxically, what they in fact might be doing is the exact opposite; they may be giving high-risk patients the opportunity and the means to attempt suicide with a lethal amount of medication.
One patient diagnosed with a mood disorder who attempted suicide had a surprising point of view. After taking a large qu
Operations research is a subfield of mathematics that tries to optimize one or more variables when multiple variables are in play. One example would be to maximize profit while minimizing cost. During World War II, operations research was used to decrease the number of munitions used to shoot down airplanes, and to sink submarines more efficiently.
Focusing on the patient who attempted suicide by overdose, the question was: If she was discharged from the psychiatry unit with a 30-day supply of medication, how lethal would that prescription be if deliberately taken all at once? And what can be done to minimize this suicide risk? Psychiatrists know that some medications are more dangerous than others, but few have performed quantitative analysis to determine the potential lethality of these medications. The math analysis did not involve multivariable calculus or differential equations, only multiplication and division. The results were eye-opening.
Calculating relative lethality
The lethal dose 50 (LD50) is the dose of a medication expressed in mg/kg that results in the death of 50% of the animals (usually rats) used in a controlled experiment. Open-source data for the LD50 of medications is provided by the manufacturers.
I tabulated this data for a wide range of psychiatric medications, including antipsychotics, mood stabilizers, and selective serotonin reuptake inhibitors, in a spreadsheet with columns for maximum daily dose, 30-day supply of the medication, LD50 in mg/kg, LD50 for a 60-kg subject, and percentage of the 30-day supply compared with LD50. I then sorted this data by relative lethality (for my complete data, see Figure 1 and the Table).
The rat dose in mg/kg was extrapolated to the human equivalent dose (HED) in mg/kg using a conversion factor of 6.2 (for a person who weighs 60 kg, the HED = LD50/6.2) as suggested by the FDA.2 The dose for the first fatality is smaller than the HED, and toxicity occurs at even smaller doses. After simplifying all the terms, the formula for the HED-relative lethality is f(x) = 310x/LD50, where x is the daily dose of a medication prescribed for 30 days. This is the equation of a straight line with a slope inversely proportional to the LD50 of each medication and a y-axis intercept of 0. Each medication line shows that any dose rising above 100% on the y-axis is a quantum higher than the lethal dose.
Some commonly prescribed psychotropics are highly lethal
The relative lethality of many commonly prescribed psychiatric medications, including those frequently used to reduce suicidality, varies tremendously. For example, it is widely known that the first-line mood stabilizer lithium has a narrow therapeutic window and can rapidly become toxic. If a patient becomes dehydrated, even a normal lithium dose can be toxic or lethal. Lithium has a relative lethality of 1,063% (Figure 2). Clozapine has a relative lethality of 1,112%. Valproic acid has an even higher relative lethality of 1,666%. By contrast, aripiprazole and olanzapine have a relative lethality of 10% and 35%, respectively. For preventing suicide, prescribing a second-generation antipsychotic with a lower relative lethality may be preferable over prescribing a medication with a higher relative lethality.
According to U.S. poison control centers,3 from 2000 to 2014, there were 15,036 serious outcomes, including 61 deaths, associated with lithium use, and 6,109 serious outcomes, including 37 deaths, associated with valproic acid. In contrast, there were only 1,446 serious outcomes and no deaths associated with aripiprazole use.3 These outcomes may be underreported, but they are consistent with the mathematical model predicting that medications with a higher relative lethality will have higher morbidity and mortality outcomes, regardless of a patient’s intent to overdose.
Many psychiatrists have a preferred antidepressant, mood stabilizer, or antipsychotic, and may prescribe this medication to many of their patients based on familiarity with the agent or other factors. However, simple math can give the decision process of selecting a specific medication for a given patient a more quantitative basis.
Even a small reduction in suicide would save many lives
Ultimately, the math problem comes down to 4 minutes, which is approximately how long the brain can survive without oxygen. By prescribing medications with a lower relative lethality, or by prescribing a less-than-30-day supply of the most lethal medications, it may be possible to decrease overdose morbidity and mortality, and also buy enough time for emergency personnel to save a life. If simple math can put even a 1% dent in the rate of death from suicide, approximately 8,000 lives might be saved every year.
1. World Health Organization. Suicide. Fact sheet. http://www.who.int/mediacentre/factsheets/fs398/en. Updated August 2017. Accessed January 3, 2018.
2. U.S. Food and Drug Administration. Estimating the maximum safe starting dose in initial clinical trials for therapeutics in adult healthy volunteers. https://www.fda.gov/downloads/drugs/guidances/ucm078932.pdf. Published July 6, 2005. Accessed January 8, 2018.
3. Nelson JC, Spyker DA. Morbidity and mortality associated with medications used in the treatment of depression: an analysis of cases reported to U.S. Poison Control Centers, 2000-2014. Am J Psychiatry. 2017;174(5):438-450.