User login
Diabetes has reached epidemic proportions in the United States, affecting over 20 million individuals,1 and further rises are expected. A disproportionate increase in diabetes has occurred in the inpatient setting.2 Furthermore, for every 2 patients in the hospital with known diabetes, there may be an additional 1 with newly observed hyperglycemia. Both are common. In 1 report, for example, 24% of inpatients with hyperglycemia had a prior diagnosis of diabetes, whereas another 12% had hyperglycemia without a prior diagnosis of diabetes.3
Although there is a paucity of high quality randomized controlled trials to support tight glycemic control in non‐critical care inpatient settings, poor glycemic control in hospitalized patients is strongly associated with undesirable outcomes for a variety of conditions, including pneumonia,4 cancer chemotherapy,5 renal transplant,6 and postsurgical wound infections.7, 8 Hyperglycemia also induces dehydration, fluid and electrolyte imbalance, gastric motility problems, and venous thromboembolism formation.9
Structured subcutaneous insulin order sets and insulin management protocols have been widely advocated as a method to encourage basal bolus insulin regimens and enhance glycemic control,2, 9, 10 but the effect of these interventions on glycemic control, hypoglycemia, and insulin use patterns in the real world setting has not been well reported. Fear of inducing hypoglycemia is often the main barrier for initiating basal insulin containing regimens and pursuing glycemic targets.2 The evidence would suggest, however, that sliding scale regimens, as opposed to more physiologic basal bolus regimens, may actually increase both hypoglycemic and hyperglycemic excursions.11 A convincing demonstration of the efficacy (improved insulin use patterns and reduced hyperglycemia) and safety (reduced hypoglycemia) of structured insulin order sets and insulin management protocols would foster a more rapid adoption of these strategies.
PATIENTS AND METHODS
In our 400‐bed university hospital, we formed a hospitalist‐led multidisciplinary team in early 2003, with the focus of improving the care delivered to non‐critical care patients with diabetes or hyperglycemia. We used a Plan‐Do‐Study‐Act (PDSA) performance improvement framework, and conducted institutional review board (IRB)‐approved prospective observational research in parallel with the performance improvement efforts, with a waiver for individual informed consent. The study population consisted of all adult inpatients on non‐critical care units with electronically reported point of care (POC) glucose testing from November 2002 through December 2005. We excluded patients who did not have either a discharge diagnosis of Diabetes (ICD 9 codes 250‐251.XX) or demonstrated hyperglycemia (fasting POC glucose >130 mg/dL 2, or a random value of >180 mg/dL) from analysis of glycemic control and hypoglycemia. Women admitted to Obstetrics were excluded. Monthly and quarterly summaries on glycemic control, hypoglycemia, and insulin use patterns (metrics described below) were reported to the improvement team and other groups on a regular basis throughout the intervention period. POC glucose data, demographics, markers of severity of illness, and diagnosis codes were retrieved from the electronic health record.
Interventions
We introduced several interventions and educational efforts throughout the course of our improvement. The 2 key interventions were as follows:
Structured subcutaneous insulin order sets (November, 2003).
An insulin management algorithm, described below (May 2005).
Key Intervention #1: Structured Subcutaneous Insulin Order Set Implementation
In November 2003, we introduced a paper‐based structured subcutaneous insulin order set. This order set encouraged the use of scheduled basal and nutritional insulin, provided guidance for monitoring glucose levels, and for insulin dosing. A hypoglycemia protocol and a standardized correction insulin table were embedded in the order set. This set was similar to examples of structured insulin ordering subsequently presented in the literature.9 In a parallel effort, the University of California, San Diego Medical Center (UCSDMC) was developing a computer physician order entry (CPOE) module for our comprehensive clinical information system, Invision (Siemens Medical Systems, Malvern, PA), that heretofore had primarily focused on result review, patient schedule management, and nursing documentation. In anticipation of CPOE and for the purpose of standardization, we removed outdated sliding scale insulin regimens from a variety preexisting order sets and inserted references to the standardized subcutaneous insulin order set in their stead. The medication administration record (MAR) was changed to reflect the basal/nutritional/correction insulin terminology. It became more difficult to order a stand‐alone insulin sliding scale even before CPOE versions became available. The standardized order set was the only preprinted correction scale insulin order available, and ordering physicians have to specifically opt out of basal and nutritional insulin choices to order sliding scale only regimens. Verbal orders for correction dose scales were deemed unacceptable by medical staff committees. Correctional insulin doses could be ordered as a 1‐time order, but the pharmacy rejected ongoing insulin orders that were not entered on the structured form.
We introduced our first standardized CPOE subcutaneous insulin order set in January 2004 at the smaller of our 2 campuses, and subsequently completed full deployment across both campuses in all adult medical‐surgical care areas by September 2004.
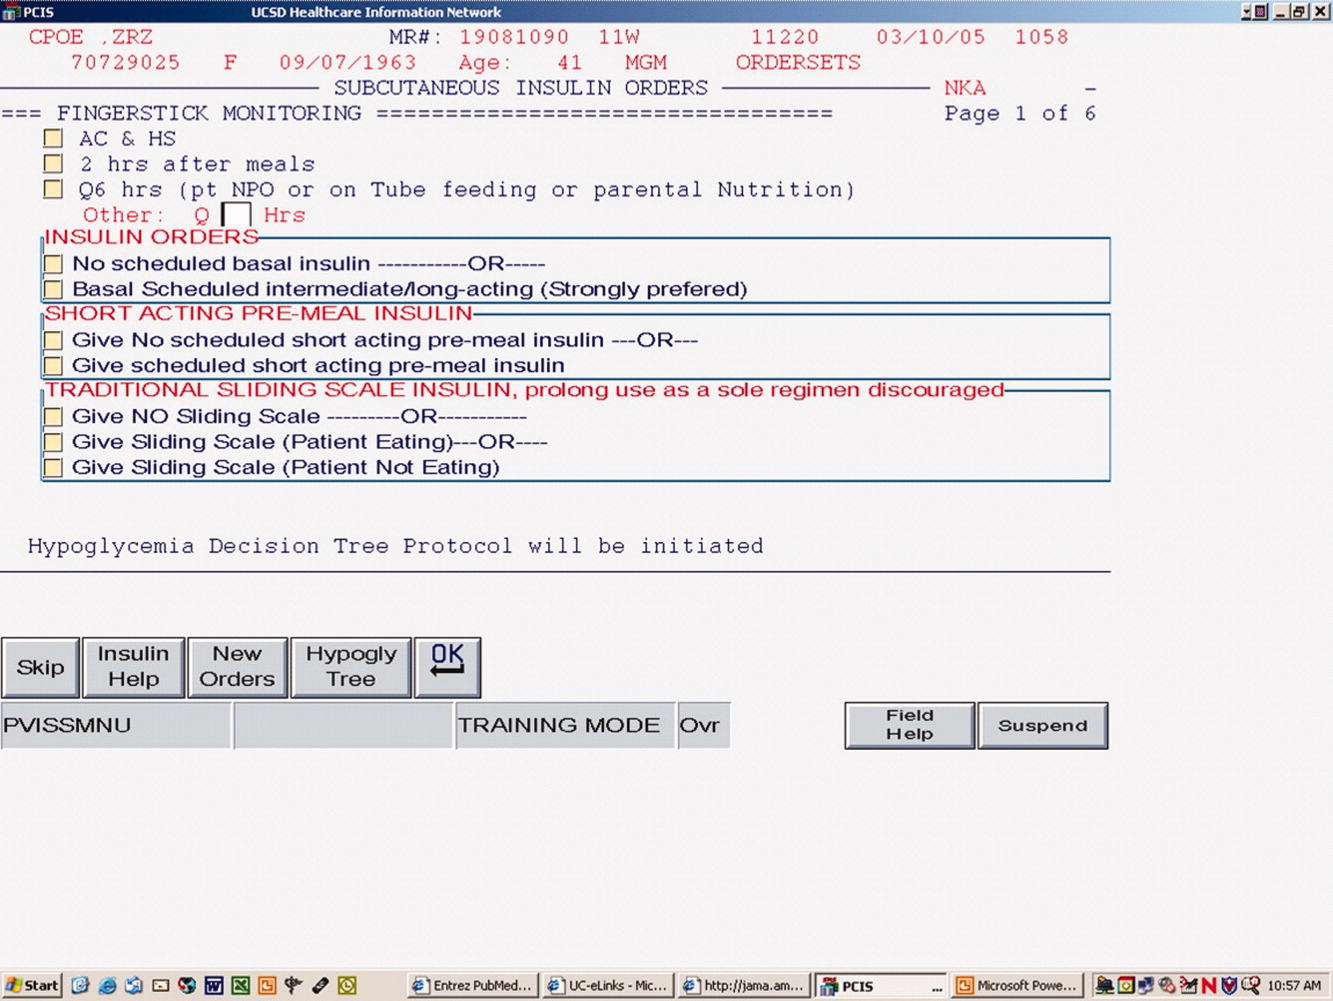
The CPOE version, like the paper version that immediately preceded it, encouraged the use of basal/bolus insulin regimens, promoted the terms basal, nutritional or premeal, and adjustment dose insulin in the order sets and the medication administration record, and was mandatory for providers wishing to order anything but a 1‐time order of insulin. Figure 1 depicts a screen shot of the CPOE version. Similar to the paper version, the ordering physician had to specifically opt out of ordering scheduled premeal and basal insulin to order a sliding scale only regimen. The first screen also ensured that appropriate POC glucose monitoring was ordered and endorsed a standing hypoglycemia protocol order. The CPOE version had only a few additional features not possible on paper. Obvious benefits included elimination of unapproved abbreviations and handwriting errors. Nutritional and correction insulin types were forced to be identical. Fundamentally, however, both the paper and online structured ordering experiences had the same degree of control over provider ordering patterns, and there was no increment in guidance for choosing insulin regimens, hence their combined analysis as structured orders.

Key Intervention #2: Insulin Management Algorithm
The structured insulin order set had many advantages, but also had many limitations. Guidance for preferred insulin regimens for patients in different nutritional situations was not inherent in the order set, and all basal and nutritional insulin options were offered as equally acceptable choices. The order set gave very general guidance for insulin dosing, but did not calculate insulin doses or assist in the apportionment of insulin between basal and nutritional components, and guidance for setting a glycemic target or adjusting insulin was lacking.
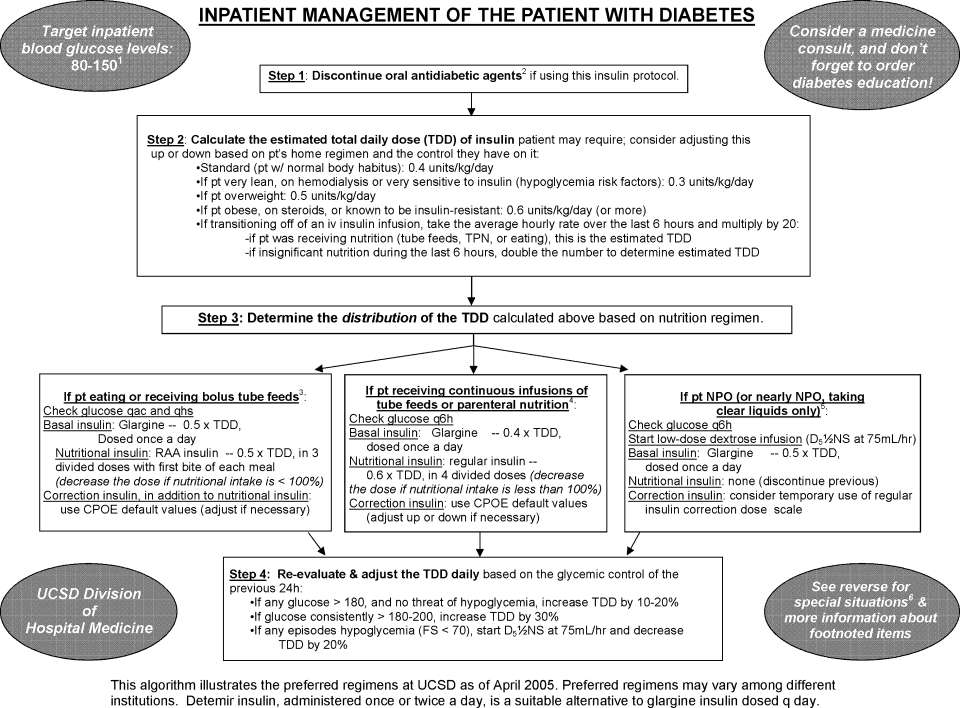
Recognizing these limitations, we devised an insulin management algorithm to provide guidance incremental to that offered in the order set. In April 2005, 3 hospitalists piloted a paper‐based insulin management algorithm (Figure 2, front; Figure 3, reverse) on their teaching services. This 1‐page algorithm provided guidance on insulin dosing and monitoring, and provided institutionally preferred insulin regimens for patients in different nutritional situations. As an example, of the several acceptable subcutaneous insulin regimens that an eating patient might use in the inpatient setting, we advocated the use of 1 preferred regimen (a relatively peakless, long‐acting basal insulin once a day, along with a rapid acting analog nutritional insulin with each meal). We introduced the concept of a ward glycemic target, provided prompts for diabetes education, and generally recommended discontinuation of oral hypoglycemic agents in the inpatient setting. The hospitalists were introduced to the concepts and the algorithm via 1 of the authors (G.M.) in a 1‐hour session. The algorithm was introduced on each teaching team during routine teaching rounds with a slide set (approximately 15 slides) that outlined the basic principles of insulin dosing, and gave example cases which modeled the proper use of the algorithm. The principles were reinforced on daily patient work rounds as they were applied on inpatients with hyperglycemia. The pilot results on 25 patients, compared to 250 historical control patients, were very promising, with markedly improved glycemic control and no increase in hypoglycemia. We therefore sought to spread the use of the algorithm. In May 2005 the insulin management algorithm and teaching slide set were promoted on all 7 hospitalist‐run services, and the results of the pilot and concepts of the algorithm were shared with a variety of house staff and service leaders in approximately a dozen sessions: educational grand rounds, assorted noon lectures, and subsequently, at new intern orientations. Easy access to the algorithm was assured by providing a link to the file within the CPOE insulin order set.
Other Attempts to Improve Care
Several other issues were addressed in the context of the larger performance improvement effort by the team. In many cases, hard data were not gathered to assess the effectiveness of the interventions, or the interventions were ongoing and could be considered the background milieu for the key interventions listed above.
During each intervention, education sessions were given throughout the hospital to staff, including physicians, residents, and nurses, using departmental grand rounds, nursing rounds, and in‐services to describe the process and goals. Patient education programs were also redesigned and implemented, using preprinted brochure. Front‐line nursing staff teaching skills were bolstered via Clinical Nurse Specialist educational sessions, and the use of a template for patient teaching. The educational template assessed patient readiness to learn, home environment, current knowledge, and other factors. Approximately 6 conferences directed at various physician staff per year became part of the regular curriculum.
We recognized that there was often poor coordination between glucose monitoring, nutrition delivery, and insulin administration. The traditional nursing practice of the 6:00 AM finger stick and insulin administration was changed to match a formalized nutrition delivery schedule. Nutrition services and nursing were engaged to address timeliness of nutrition delivery, insulin administration, and POC glucose documentation in the electronic health record.
Feedback to individual medicine resident teams on reaching glycemic targets, with movie ticket/coffee coupon rewards to high performing teams, was tried from April 2004 to September 2004.
Measures and Analyses
Assessing Insulin Use Patterns
A convenience sample gathering all subcutaneous insulin orders from 4 to 5 selected days per month yielded 70 to 90 subcutaneous insulin orders for review each month. Sampling was originally performed each month, followed by less frequent sampling once stability in insulin use patterns was reached. Regimens were categorized by pharmacy and hospitalist review as to whether basal insulin was part of the insulin regimen or not. The percentage of insulin regimens incorporating basal insulin was calculated for each sampled month and followed in run charts, and comparisons between preorder set and postorder set time periods were made using Pearson's chi square statistic.
Assessing Glycemic Control
Glycemic control and hypoglycemia parameters were monitored for the entire 38‐month observation period.
Routinely monitored POC glucose values were used to assess glycemic control. During the initial data examination, it was found after 14 days of the hospital stay, there was a notable stabilization and improvement in glucose control and fewer hypoglycemic events, therefore we examined only the first 14 days of hospitalization, thereby eliminating a potential source of bias from length of stay outliers.
A mean glucose value was recorded for each patient‐day with 1 or more recorded values. Glycemic control for each patient‐stay was calculated by averaging the patient‐day mean values, which we will refer to as the day‐weighted mean. Hypoglycemic values (60 mg/dL) were excluded from calculation of the mean glucose, to avoid equating frequent hypoglycemia with optimal glycemic control. An uncontrolled patient‐day was defined as a monitored patient‐day with a mean glucose 180 mg/dL. An uncontrolled patient‐stay is defined as a patient‐stay with a day‐weighted mean glucose value 180 mg/dL.
We theorized that the greatest impact of the interventions would be realized in patients with longer monitoring periods, and that those with only a few POC glucose values could potentially misrepresent the impact of our interventions: therefore we performed a second analysis restricted to patients with 8 POC glucose values.
Assessing Hypoglycemia
Hypoglycemia was defined as a glucose 60 mg/dL, and severe hypoglycemia was defined as a glucose 40 mg/dL. These parameters were characterized by 2 methods. First, we calculated the percentage of monitored patients suffering from 1 or more hypoglycemic events or severe hypoglycemic events over the course of their entire admission. A second method tracked the percentage of monitored patient‐days with hypoglycemia and severe hypoglycemia, thereby correcting for potential misinterpretation from clustered repeated measures or variable length of stay. As with the glycemic control analysis, we repeated the hypoglycemia analysis in the subset of patients with 8 POC glucose values.
Summary Analysis of Glycemic Control and Hypoglycemia
Pearson chi square values, with relative risks (RRs) and 95% confidence intervals (CIs) were calculated to compare glycemic control and hypoglycemia in the 2 key interventions and baseline. The interventions and data reporting were grouped as follows:
Baseline: November 2002 to October 2003) = Time Period 1 (TP1)
Structured Order Set: November 2003 to April 2005) = Time Period 2 (TP2)
Algorithm plus Structured Order Set: May 2005 to December 2005) = Time Period 3 (TP3)
A P value of less than 0.05 was determined as significant and data were analyzed using STATA, Version 8 (STATA Corp., College Station, TX).
We assigned the RR of uncontrolled hyperglycemia and the RR of hypoglycemia during the baseline time (TP1) with values of 1.0, and calculated the RR and CIs for the same parameters during TP2 and TP3.
RESULTS
Just over 11,000 patients were identified for POC glucose testing over the 38 month observation period. Of these, 9314 patients had either a diagnosis of diabetes or documented hyperglycemia. The characteristics of this study population are depicted in Table 1. There were no differences between the groups and the demographics of age, gender, or length of stay (P > 0.05 for all parameters). There was a slight increase in the percent of patients with any intensive care unit days over the 3 time periods and a similar increase in the case mix index.
| Patients Meeting Criteria of Diabetes Mellitus Diagnosis or Hyperglycemia (n = 9,314 patients) | Baseline | TP2 | TP3 |
|---|---|---|---|
| |||
| Time period (TP) | November 2002 to October 2003 | November 2003 to April 2005 | May 2005 to December 2005 |
| Monitored patient days (44,232) | 11,571 | 21,126 | 11,535 |
| Number of patients (9,314) | 2,504 | 4,515 | 2,295 |
| Males (%) | 55 | 54 | 56 |
| Average age standard deviation | 56 17 | 56 17 | 56 16 |
| Length of stay (excluding highest 1% of outliers) | 4.6 5.9 | 4.6 5.7 | 4.8 5.8 |
| % With any intensive care unit days* | 18 | 20 | 22 |
| Case mix index score (mean SD) | 1.8 2.1 | 2.0 2.3 | 2.1 2.1 |
| Case mix index (median score) | 1.1 | 1.3 | 1.3 |
Of the 9314 study patients, 5530 had 8 or more POC glucose values, and were included in a secondary analysis of glycemic control and hypoglycemia.
Insulin Use Patterns
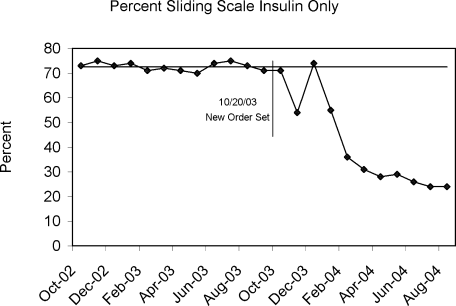
Figure 4 demonstrates the dramatic improvement that took place with the introduction of the structured order set. In the 6 months preceding the introduction of the structured insulin order set (May‐October 2003) 72% of 477 sampled patients with insulin orders were on sliding scale‐only insulin regimens (with no basal insulin), compared to just 26% of 499 patients sampled in the March to August 2004 time period subsequent to order set implementation (P < .0001, chi square statistic). Intermittent monthly checks on insulin use patterns reveal this change has been sustained.
Glycemic Control
A total of 9314 patients with 44,232 monitored patient‐days and over 120,000 POC glucose values were analyzed to assess glycemic control, which was improved with structured insulin orders and improved incrementally with the introduction of the insulin management algorithm.
The percent of patient‐days that were uncontrolled, defined as a monitored day with a mean glucose of 180 mg/dL, was reduced over the 3 time periods (37.8% versus 33.9% versus 30.1%, P < 0.005, Pearson chi square statistic), representing a 21% RR reduction of uncontrolled patient‐days from TP1 versus TP3. Table 2 shows the summary results for glycemic control, including the RR and CIs between the 3 time periods.
| Time Period (TP) | Baseline | TP2 Structured Orders | TP3 Orders Plus Algorithm | Relative Risk TP3:TP2 |
|---|---|---|---|---|
| ||||
| Patient‐day glucose | ||||
| Mean SD | 179 66 | 170 65 | 165 58 | |
| Median | 160 | 155 | 151 | |
| Uncontrolled patient‐days* | 4,372 | 7,162 | 3,465 | |
| Monitored patient‐days | 11,555 | 21,135 | 11,531 | |
| % Uncontrolled patient‐days | 37.8 | 33.9 | 30.1 | |
| RR: uncontrolled patient‐day (95% confidence interval) | 1.0 | 0.89 (0.87‐0.92) | 0.79 (0.77‐0.82) | 0.89 (0.86‐0.92) |
| Glycemic control by patient‐stay | ||||
| Day‐weighted mean SD | 177 57 | 174 54 | 170 50 | |
| Day‐weighted median | 167 | 162 | 158 | |
| Uncontrolled patient‐stay (%) | 1,038 | 1,696 | 784 | |
| Monitored patient‐stay | 2,504 | 4,515 | 2,295 | |
| % Uncontrolled patient‐stays | 41.5 | 37.6 | 34.2 | |
| RR: uncontrolled patient‐stay (95% confidence interval) | 0.91 (0.85‐0.96) | 0.84 (0.77‐0.89) | 0.91 (0.85‐0.97) | |
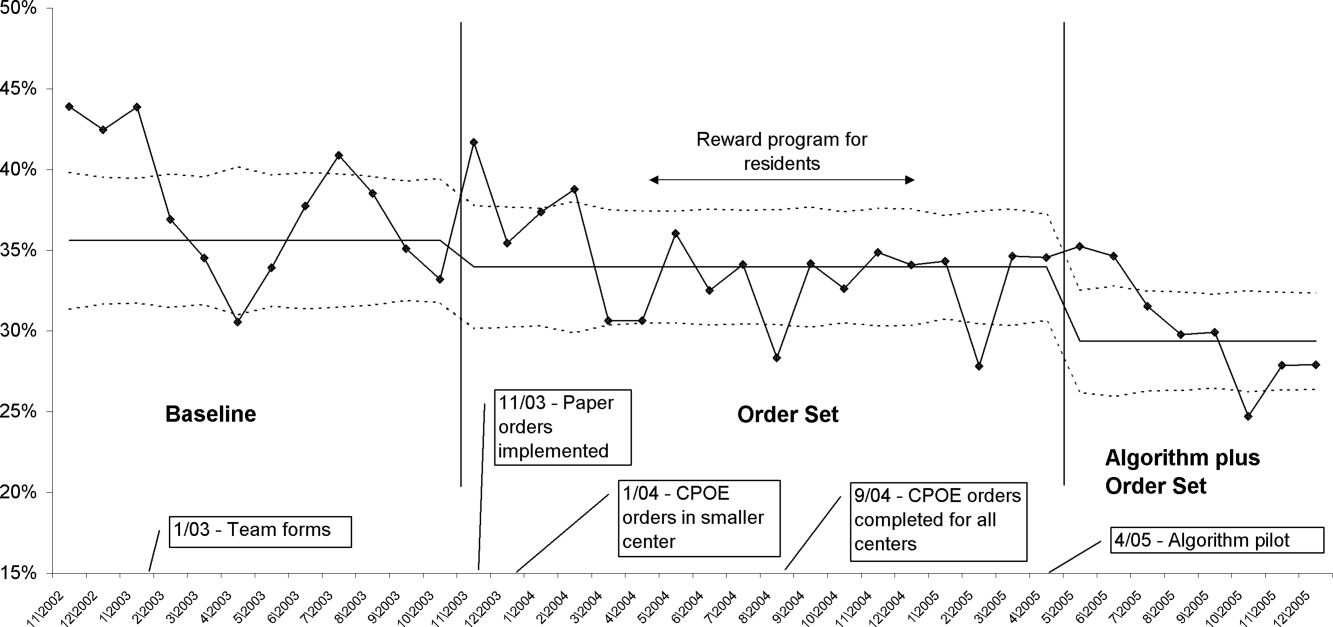
In a similar fashion, the percent of patients with uncontrolled patient‐stays (day‐weighted mean glucose 180 mg/dL) was also reduced over the 3 time periods (41.5% versus 37.6% versus 34.2%, P < 0.05, Pearson chi square statistic, with an RR reduction of 16% for TP3:TP1). Figure 5 depicts a statistical process control chart of the percent of patients experiencing uncontrolled patient‐stays over time, and is more effective in displaying the temporal relationship of the interventions with the improved results.
Uncontrolled hyperglycemic days and stays were reduced incrementally from TP3 versus TP2, reflecting the added benefit of the insulin management algorithm, compared to the benefit enjoyed with the structured order set alone.
When the analyses were repeated after excluding patients with fewer than 8 POC glucose readings (Table 3), the findings were similar, but as predicted, the effect was slightly more pronounced, with a 23% relative reduction in uncontrolled patient‐days and a 27% reduction in uncontrolled patient‐stays of TP3 versus TP1.
| Time Period (TP) | Baseline | TP2 Structured Orders | TP3 Orders Plus Algorithm | Relative Risk TP3:TP2 |
|---|---|---|---|---|
| ||||
| Patient‐day glucose | ||||
| Mean SD | 172 65 | 169 64 | 163 57 | |
| Median | 159 | 154 | 149 | |
| Uncontrolled patient‐days* | 3,469 | 5,639 | 2,766 | |
| Monitored patient‐days | 9,304 | 17,278 | 9,671 | |
| % Uncontrolled patient‐days | 37.3 | 32.6 | 28.6 | |
| RR: uncontrolled patient‐day (95% confidence interval) | 1.0 | 0.87 (0.85‐0.90) | 0.77 (0.74‐0.80) | 0.88 (0.84‐0.91) |
| Glycemic control by patient‐stay | ||||
| Day‐weighted mean SD | 175 51 | 169 47 | 166 45 | |
| Day‐weighted median | 167 | 158 | 155 | |
| Uncontrolled patient‐stay (%) | 588 | 908 | 425 | |
| Monitored patient‐stay | 1,439 | 2,659 | 1,426 | |
| % Uncontrolled patient‐stays | 40.1 | 34.1 | 29.8 | |
| RR: Uncontrolled patient‐stay (95% confidence interval) | 0.84 (0.77‐0.91) | 0.73 (0.66‐0.81) | 0.87 (0.79‐0.96) | |
Hypoglycemia
Table 4 summarizes the results for hypoglycemia and severe hypoglycemia in the study population, and Table 5 summarizes the secondary analyses of hypoglycemia in the subset with at least 8 POC glucose readings.
| TP (Time Period) | Baseline | TP2 | TP3 | Relative Risk TP3:TP2 |
|---|---|---|---|---|
| ||||
| Monitored patient‐stays | 2504 | 4515 | 2295 | |
| Stays with hypoglycemia (%) | 296 (11.8) | 437 (9.7) | 210 (9.2) | |
| RR hypoglycemic stay (CI) | 1.0 | 0.82 (0.72‐0.94) | 0.77 (0.65‐0.92) | 0.95 (0.81‐1.10) |
| Stays with severe hypoglycemia (%) | 73 (2.9) | 96 (2.1) | 55 (2.4) | |
| RR severe hypoglycemic stay (CI) | 1.0 | 0.73 (0.54‐0.98) | 0.82 (0.58‐1.16) | 1.13 (0.81‐1.56) |
| Monitored patient‐days | 11,584 | 21,158 | 11,548 | |
| Days with hypoglycemia (%) | 441 (3.8) | 623 (2.9) | 300 (2.6) | |
| RR hypoglycemic day (CI) | 1.0 | 0.77 (0.69‐0.87) | 0.68 (0.59‐0.78) | 0.88 (0.77‐1.01) |
| Days with severe hypoglycemia (%) | 86 (0.74) | 109 (0.52) | 66 (0.57) | |
| RR Severe hypoglycemic day (CI) | 1.0 | 0.69 (0.52‐0.92) | 0.77 (0.56‐1.06) | 1.10 (0.82‐1.5) |
| TP (Time Period) | Baseline | TP2 | TP3 | Relative Risk TP3:TP2 |
|---|---|---|---|---|
| ||||
| Monitored patient‐stays | 1440 | 2664 | 1426 | |
| Stays with hypoglycemia (%) | 237 (16.5) | 384 (14.4) | 180 (12.6) | |
| RR hypoglycemic stay (CI) | 1.0 | 0.88 (0.76‐1.02) | 0.77 (0.64‐0.92) | 0.88 (0.75‐1.03) |
| Stays with severe hypoglycemia (%) | 58 (4.0) | 93 (3.5) | 47 (3.3) | |
| RR severe hypoglycemic stay (CI) | 1.0 | 0.87 (0.63‐1.2) | 0.82 (0.56‐1.19) | 0.94 (0.67‐1.33) |
| Monitored patient‐days | 9,317 | 17,310 | 9,684 | |
| Days with hypoglycemia (%) | 379 (4.1) | 569 (3.3) | 269 (2.7) | |
| RR hypoglycemic day (CI) | 1.0 | 0.81 (0.71‐0.92) | 0.68 (0.59‐0.80) | 0.85 (0.73‐0.98) |
| Days with severe hypoglycemia (%) | 71 (0.76) | 106 (0.61) | 58 (0.60) | |
| RR severe hypoglycemic day (CI) | 1.0 | 0.80 (0.60‐1.08) | 0.79 (0.56‐1.11) | 0.98 (0.71‐1.34) |
Analysis by Patient‐Stay
The percent of patients that suffered 1 or more hypoglycemic event over the course of their inpatient stay was 11.8% in TP1, 9.7% in TP2, and 9.2% in TP3. The RR of a patient suffering from a hypoglycemic event was significantly improved in the intervention time periods compared to baseline, with the RR of TP3:TP1 = 0.77 (CI, 0.65‐0.92). There was a strong trend for incremental improvement in hypoglycemic patient‐stays for TP3 versus TP2, but the trend just missed statistical significance (P < 0.07). Similar trends in improvement were found for severe hypoglycemia by patient‐stay, but these trends were only statistically significant for TP2 versus TP1. The findings were similar in the subset of patients with at least 8 POC glucose readings (Table 5).
Analysis by Patient‐Day
Of monitored patient days in the baseline TP1, 3.8% contained a hypoglycemic value of 60 mg/dL. With the introduction of structured insulin orders in TP2, this was reduced to 2.9%, and in TP3 it was 2.6%. The RR of a hypoglycemic patient‐day of TP2 compared to TP1 was 0.77 (CI, 0.69‐0.87), whereas the cumulative impact of the structured order set and algorithm (TP3:TP1) was 0.68 (CI, 0.59‐0.78), representing a 32% reduction of the baseline risk of suffering from a hypoglycemic day. Similar reductions were seen for the risk of a severe hypoglycemic patient‐day.
The secondary analysis of hypoglycemic and severe hypoglycemic patient‐days showed very similar results, except that the TP3:TP2 RR for hypoglycemia of 0.85 (CI, 0.73‐0.98) reached statistical significance, again demonstrating the incrementally beneficial effect of the insulin management algorithm.
DISCUSSION
Our study convincingly demonstrates that significant improvement in glycemic control can be achieved with implementation of structured subcutaneous insulin orders and a simple insulin management protocol. Perhaps more importantly, these gains in glycemic control are not gained at the expense of increased iatrogenic hypoglycemia, and in fact, we observed a 32% decline in the percent of patient‐days with hypoglycemia. This is extremely important because fear of hypoglycemia is the most significant barrier to glycemic control efforts.
Strengths and Limitations
Our study has several strengths. The study is large and incorporates all patients with diabetes or hyperglycemia captured by POC glucose testing, and the observation period is long enough that bias from merely being observed is not a factor. We used metrics for glycemic control, hypoglycemia, and insulin use patterns that are of high quality and are generally in line with the Society of Hospital Medicine (SHM) Glycemic Control Task force recommendations,12, 13 and examined data by both patient‐stay and patient‐day.
The increased use of anticipatory physiologic subcutaneous insulin regimens, and the subsequent decline in the use of sliding scale insulin, is the most likely mechanism for improvement. The improvements seen are fairly dramatic for an institution in absolute terms, because inpatient hyperglycemia and hypoglycemia are so common. For example, on an annualized basis for our 400‐bed medical center, these interventions prevent 124 patients from experiencing 208 hypoglycemic days.
Other institutions should be able to replicate our results. We received administrative support to create a multidisciplinary steering committee, but we did not have incremental resources to create a dedicated team for insulin management, mandated endocrinology comanagement or consultations, or manual data collection. In fact, we had only 1 diabetes educator for 400 adult beds at 2 sites, and were relatively underresourced in this area by community standards. There was some time and expense in creating the glycemic control reports, but all of the glucose data collected were part of normal care, and the data retrieval became automated.
The main limitation of this study lies in the observational study design. There were multiple interventions in addition to structured insulin orders and the insulin management algorithm, and these educational and organizational changes undoubtedly also contributed to the overall success of our program. Since we did not perform a randomized controlled trial, the reader might reasonably question if the structured order sets and insulin management algorithm were actually the cause of the improvement seen, as opposed to these ancillary efforts or secular change. However, there are several factors that make this unlikely. First, the study population was well‐defined, having diabetes or documented hyperglycemia in all 3 time periods. Second, the demographics remained constant or actually worked against improvement trends, since the markers of patient acuity suggest increased patient acuity over the observation period. Third, the temporal relationship of the improvement to the introduction of our key interventions, as viewed on statistical process control charts shown in Figure 5, strongly suggest a causal relationship. This temporal relationship was consistently observed no matter how we chose to define uncontrolled hyperglycemia, and was also seen on hypoglycemia control charts. We view the ancillary interventions (such as educational efforts) as necessary, but not sufficient, in and of themselves, to effect major improvement.
We did not analyze the impact of the improved glycemic control on patient outcomes. In the absence of a randomized controlled trial design, controlling for the various confounders is a challenging task. Also, it is likely that not all hypoglycemic events were attributable to inpatient glycemic control regimens, though the secondary analysis probably eliminated many hypoglycemia admissions.
Lessons Learned: Implications from our study
We agree with the American Association of Clinical Endocrinologists (AACE)/American Diabetes Association (ADA)2 and the SHM Glycemic Control Task Force12 about the essential elements needed for successful implementation of inpatient glycemic control programs:
An appropriate level of administrative support.
Formation of a multidisciplinary steering committee to drive the development of initiatives, empowered to enact changes.
Assessment of current processes, quality of care, and barriers to practice change.
Development and implementation of interventions, including standardized order sets, protocols, policies, and algorithms with associated educational programs.
Metrics for evaluation of glycemic control, hypoglycemia, insulin use patterns, and other aspects of care.
Metrics to follow hypoglycemia are extremely important. The voluntary reporting on insulin‐induced hypoglycemia fluctuated widely over the course of our project. These fluctuations did not correlate well with the more objective and accurate measures we followed, and this objective data was very helpful in reducing the fear of hypoglycemia, and spreading the wider use of basal bolus insulin regimens. We strongly recommend that improvement teams formulate and follow measures of glycemic control, hypoglycemia, and insulin use, similar to those outlined in the SHM Glycemic Control Improvement Guide12 and the SHM Glycemic Control Task Force summary on glucometrics.13
Although we introduced our structured insulin order set first, with a long lag time until we introduced the insulin management algorithm, we advocate a different approach for institutions grappling with these issues. This approach is well‐described by the SHM Glycemic Control Task Force.14 An insulin management algorithm should be crafted first, integrating guidance for insulin dosing, preferred insulin regimens for different nutritional situations, a glycemic target, insulin dosing adjustment, glucose monitoring, and prompts for ordering a glycosylated hemoglobin (A1c) level. Next, the order set and the supporting educational programs should integrate this guidance as much as possible, making the key guidance available at the point of patient care.
This guidance was available in our algorithm but was not inherent in the structured insulin orders described in this report, and all basal and nutritional insulin options were offered as equally acceptable choices. This version did not calculate insulin doses or assist in the apportionment of insulin between basal and nutritional components. Only a single adjustment dose scale was offered, leaving appropriate modifications up to the end user, and from a usability standpoint, our CPOE insulin orders lacked dynamic flexibility (revising a single insulin required discontinuing all prior orders and reentering all orders). These limitations have subsequently been addressed with Version 2 of our CPOE insulin orders, and the details will soon be available in the literature.15
We are now exploring further improvement with concurrent identification and intervention of hyperglycemic patients that are not on physiologic insulin regimens or not meeting glycemic targets, and implementing protocols addressing the transition from infusion insulin.
CONCLUSION
We significantly improved glycemic control and simultaneously reduced hypoglycemia across all major medical and surgical services at our medical center, thereby addressing the number 1 barrier to improved inpatient glycemic control. We achieved this via systems changes with the introduction of structured subcutaneous insulin orders and the insulin management algorithm, along with education, but did not otherwise mandate or monitor adherence to our algorithm.
Implementing an institutional insulin management algorithm and structured insulin orders should now be viewed as a potent safety intervention as well as an intervention to enhance quality, and we have demonstrated that non‐critical care glycemic control efforts can clearly be a win‐win situation.
- Centers for Disease Control and Prevention.National Diabetes Fact Sheet: General Information and National Estimates on Diabetes in the United States, 2002.Atlanta, GA:U.S. Department of Health and Human Services, Centers for Disease Control and Prevention;2003. Available at: www.cdc.gov/diabetes/pubs/factsheet.htm. Accessed January 21, 2006.
- American College of Endocrinology and American Diabetes Association Consensus statement on inpatient diabetes and glycemic control: a call to action.Diabetes Care.2006;29:1955‐1962.
- ,,, et al.Hyperglycemia: an independent marker of in‐hospital mortality in patients with undiagnosed diabetes.J Clin Endocrinol Metab.2002;87:978‐982.
- ,,, et al.The relation between hyperglycemia and outcomes in 2471 patients admitted to the hospital with community‐acquired pneumonia.Diabetes Care.2005;28:810‐815.
- ,,, et al.Cancer.2004;100:1179‐1185.
- ,,, et al.Early perioperative glycaemic control and allograft rejection in patients with diabetes mellitus: a pilot study.Transplantation.2001;72:1321‐1324.
- ,,, et al.Early postoperative glucose control predicts nosocomial infection rate in diabetic patients.J Parenter Enteral Nutr.1998;22:77‐81.
- ,,, et al.Glucose control lowers the risk of wound infection in diabetics after open heart operations.Ann Thorac Surg.1997;63:356‐361.
- ,,, et al.Management of diabetes and hyperglycemia in hospitals.Diabetes Care.2004;27:553‐591.
- ,,, et al.American College of Endocrinology position statement on inpatient diabetes and metabolic control.Endocr Pract.2004;10:77‐82.
- ,.Glycemic chaos (not glycemic control) still the rule for inpatient care: how do we stop the insanity? [Editorial].J Hosp Med.2006;1:141‐144.
- Society of Hospital Medicine Glycemic Control Task Force: Optimizing Glycemic Control and Reducing Hypoglycemia at Your Medical Center. Society of Hospital Medicine, Glycemic Control Quality Improvement Resource Room. Available at: http://www.hospitalmedicine.org/ResourceRoomRedesign/GlycemicControl.cfm. Accessed October2008.
- ,,,,,.SHM Glycemic Control Task Force summary: practical recommendations for assessing the impact of glycemic control efforts.J Hosp Med.2008;3(S5):66–75.
- ,,,;for the SHM Glycemic Control Task Force.Subcutaneous insulin order sets and protocols: effective design and implementation strategies.J Hosp Med.2008;3(S5):29–41.
- ,,,.Indication‐based ordering: a new paradigm for glycemic control in hospitalized inpatients.J Diabetes Sci Tech.2008;2(3):349‐356.
Diabetes has reached epidemic proportions in the United States, affecting over 20 million individuals,1 and further rises are expected. A disproportionate increase in diabetes has occurred in the inpatient setting.2 Furthermore, for every 2 patients in the hospital with known diabetes, there may be an additional 1 with newly observed hyperglycemia. Both are common. In 1 report, for example, 24% of inpatients with hyperglycemia had a prior diagnosis of diabetes, whereas another 12% had hyperglycemia without a prior diagnosis of diabetes.3
Although there is a paucity of high quality randomized controlled trials to support tight glycemic control in non‐critical care inpatient settings, poor glycemic control in hospitalized patients is strongly associated with undesirable outcomes for a variety of conditions, including pneumonia,4 cancer chemotherapy,5 renal transplant,6 and postsurgical wound infections.7, 8 Hyperglycemia also induces dehydration, fluid and electrolyte imbalance, gastric motility problems, and venous thromboembolism formation.9
Structured subcutaneous insulin order sets and insulin management protocols have been widely advocated as a method to encourage basal bolus insulin regimens and enhance glycemic control,2, 9, 10 but the effect of these interventions on glycemic control, hypoglycemia, and insulin use patterns in the real world setting has not been well reported. Fear of inducing hypoglycemia is often the main barrier for initiating basal insulin containing regimens and pursuing glycemic targets.2 The evidence would suggest, however, that sliding scale regimens, as opposed to more physiologic basal bolus regimens, may actually increase both hypoglycemic and hyperglycemic excursions.11 A convincing demonstration of the efficacy (improved insulin use patterns and reduced hyperglycemia) and safety (reduced hypoglycemia) of structured insulin order sets and insulin management protocols would foster a more rapid adoption of these strategies.
PATIENTS AND METHODS
In our 400‐bed university hospital, we formed a hospitalist‐led multidisciplinary team in early 2003, with the focus of improving the care delivered to non‐critical care patients with diabetes or hyperglycemia. We used a Plan‐Do‐Study‐Act (PDSA) performance improvement framework, and conducted institutional review board (IRB)‐approved prospective observational research in parallel with the performance improvement efforts, with a waiver for individual informed consent. The study population consisted of all adult inpatients on non‐critical care units with electronically reported point of care (POC) glucose testing from November 2002 through December 2005. We excluded patients who did not have either a discharge diagnosis of Diabetes (ICD 9 codes 250‐251.XX) or demonstrated hyperglycemia (fasting POC glucose >130 mg/dL 2, or a random value of >180 mg/dL) from analysis of glycemic control and hypoglycemia. Women admitted to Obstetrics were excluded. Monthly and quarterly summaries on glycemic control, hypoglycemia, and insulin use patterns (metrics described below) were reported to the improvement team and other groups on a regular basis throughout the intervention period. POC glucose data, demographics, markers of severity of illness, and diagnosis codes were retrieved from the electronic health record.
Interventions
We introduced several interventions and educational efforts throughout the course of our improvement. The 2 key interventions were as follows:
Structured subcutaneous insulin order sets (November, 2003).
An insulin management algorithm, described below (May 2005).
Key Intervention #1: Structured Subcutaneous Insulin Order Set Implementation
In November 2003, we introduced a paper‐based structured subcutaneous insulin order set. This order set encouraged the use of scheduled basal and nutritional insulin, provided guidance for monitoring glucose levels, and for insulin dosing. A hypoglycemia protocol and a standardized correction insulin table were embedded in the order set. This set was similar to examples of structured insulin ordering subsequently presented in the literature.9 In a parallel effort, the University of California, San Diego Medical Center (UCSDMC) was developing a computer physician order entry (CPOE) module for our comprehensive clinical information system, Invision (Siemens Medical Systems, Malvern, PA), that heretofore had primarily focused on result review, patient schedule management, and nursing documentation. In anticipation of CPOE and for the purpose of standardization, we removed outdated sliding scale insulin regimens from a variety preexisting order sets and inserted references to the standardized subcutaneous insulin order set in their stead. The medication administration record (MAR) was changed to reflect the basal/nutritional/correction insulin terminology. It became more difficult to order a stand‐alone insulin sliding scale even before CPOE versions became available. The standardized order set was the only preprinted correction scale insulin order available, and ordering physicians have to specifically opt out of basal and nutritional insulin choices to order sliding scale only regimens. Verbal orders for correction dose scales were deemed unacceptable by medical staff committees. Correctional insulin doses could be ordered as a 1‐time order, but the pharmacy rejected ongoing insulin orders that were not entered on the structured form.
We introduced our first standardized CPOE subcutaneous insulin order set in January 2004 at the smaller of our 2 campuses, and subsequently completed full deployment across both campuses in all adult medical‐surgical care areas by September 2004.
The CPOE version, like the paper version that immediately preceded it, encouraged the use of basal/bolus insulin regimens, promoted the terms basal, nutritional or premeal, and adjustment dose insulin in the order sets and the medication administration record, and was mandatory for providers wishing to order anything but a 1‐time order of insulin. Figure 1 depicts a screen shot of the CPOE version. Similar to the paper version, the ordering physician had to specifically opt out of ordering scheduled premeal and basal insulin to order a sliding scale only regimen. The first screen also ensured that appropriate POC glucose monitoring was ordered and endorsed a standing hypoglycemia protocol order. The CPOE version had only a few additional features not possible on paper. Obvious benefits included elimination of unapproved abbreviations and handwriting errors. Nutritional and correction insulin types were forced to be identical. Fundamentally, however, both the paper and online structured ordering experiences had the same degree of control over provider ordering patterns, and there was no increment in guidance for choosing insulin regimens, hence their combined analysis as structured orders.
Key Intervention #2: Insulin Management Algorithm
The structured insulin order set had many advantages, but also had many limitations. Guidance for preferred insulin regimens for patients in different nutritional situations was not inherent in the order set, and all basal and nutritional insulin options were offered as equally acceptable choices. The order set gave very general guidance for insulin dosing, but did not calculate insulin doses or assist in the apportionment of insulin between basal and nutritional components, and guidance for setting a glycemic target or adjusting insulin was lacking.
Recognizing these limitations, we devised an insulin management algorithm to provide guidance incremental to that offered in the order set. In April 2005, 3 hospitalists piloted a paper‐based insulin management algorithm (Figure 2, front; Figure 3, reverse) on their teaching services. This 1‐page algorithm provided guidance on insulin dosing and monitoring, and provided institutionally preferred insulin regimens for patients in different nutritional situations. As an example, of the several acceptable subcutaneous insulin regimens that an eating patient might use in the inpatient setting, we advocated the use of 1 preferred regimen (a relatively peakless, long‐acting basal insulin once a day, along with a rapid acting analog nutritional insulin with each meal). We introduced the concept of a ward glycemic target, provided prompts for diabetes education, and generally recommended discontinuation of oral hypoglycemic agents in the inpatient setting. The hospitalists were introduced to the concepts and the algorithm via 1 of the authors (G.M.) in a 1‐hour session. The algorithm was introduced on each teaching team during routine teaching rounds with a slide set (approximately 15 slides) that outlined the basic principles of insulin dosing, and gave example cases which modeled the proper use of the algorithm. The principles were reinforced on daily patient work rounds as they were applied on inpatients with hyperglycemia. The pilot results on 25 patients, compared to 250 historical control patients, were very promising, with markedly improved glycemic control and no increase in hypoglycemia. We therefore sought to spread the use of the algorithm. In May 2005 the insulin management algorithm and teaching slide set were promoted on all 7 hospitalist‐run services, and the results of the pilot and concepts of the algorithm were shared with a variety of house staff and service leaders in approximately a dozen sessions: educational grand rounds, assorted noon lectures, and subsequently, at new intern orientations. Easy access to the algorithm was assured by providing a link to the file within the CPOE insulin order set.
Other Attempts to Improve Care
Several other issues were addressed in the context of the larger performance improvement effort by the team. In many cases, hard data were not gathered to assess the effectiveness of the interventions, or the interventions were ongoing and could be considered the background milieu for the key interventions listed above.
During each intervention, education sessions were given throughout the hospital to staff, including physicians, residents, and nurses, using departmental grand rounds, nursing rounds, and in‐services to describe the process and goals. Patient education programs were also redesigned and implemented, using preprinted brochure. Front‐line nursing staff teaching skills were bolstered via Clinical Nurse Specialist educational sessions, and the use of a template for patient teaching. The educational template assessed patient readiness to learn, home environment, current knowledge, and other factors. Approximately 6 conferences directed at various physician staff per year became part of the regular curriculum.
We recognized that there was often poor coordination between glucose monitoring, nutrition delivery, and insulin administration. The traditional nursing practice of the 6:00 AM finger stick and insulin administration was changed to match a formalized nutrition delivery schedule. Nutrition services and nursing were engaged to address timeliness of nutrition delivery, insulin administration, and POC glucose documentation in the electronic health record.
Feedback to individual medicine resident teams on reaching glycemic targets, with movie ticket/coffee coupon rewards to high performing teams, was tried from April 2004 to September 2004.
Measures and Analyses
Assessing Insulin Use Patterns
A convenience sample gathering all subcutaneous insulin orders from 4 to 5 selected days per month yielded 70 to 90 subcutaneous insulin orders for review each month. Sampling was originally performed each month, followed by less frequent sampling once stability in insulin use patterns was reached. Regimens were categorized by pharmacy and hospitalist review as to whether basal insulin was part of the insulin regimen or not. The percentage of insulin regimens incorporating basal insulin was calculated for each sampled month and followed in run charts, and comparisons between preorder set and postorder set time periods were made using Pearson's chi square statistic.
Assessing Glycemic Control
Glycemic control and hypoglycemia parameters were monitored for the entire 38‐month observation period.
Routinely monitored POC glucose values were used to assess glycemic control. During the initial data examination, it was found after 14 days of the hospital stay, there was a notable stabilization and improvement in glucose control and fewer hypoglycemic events, therefore we examined only the first 14 days of hospitalization, thereby eliminating a potential source of bias from length of stay outliers.
A mean glucose value was recorded for each patient‐day with 1 or more recorded values. Glycemic control for each patient‐stay was calculated by averaging the patient‐day mean values, which we will refer to as the day‐weighted mean. Hypoglycemic values (60 mg/dL) were excluded from calculation of the mean glucose, to avoid equating frequent hypoglycemia with optimal glycemic control. An uncontrolled patient‐day was defined as a monitored patient‐day with a mean glucose 180 mg/dL. An uncontrolled patient‐stay is defined as a patient‐stay with a day‐weighted mean glucose value 180 mg/dL.
We theorized that the greatest impact of the interventions would be realized in patients with longer monitoring periods, and that those with only a few POC glucose values could potentially misrepresent the impact of our interventions: therefore we performed a second analysis restricted to patients with 8 POC glucose values.
Assessing Hypoglycemia
Hypoglycemia was defined as a glucose 60 mg/dL, and severe hypoglycemia was defined as a glucose 40 mg/dL. These parameters were characterized by 2 methods. First, we calculated the percentage of monitored patients suffering from 1 or more hypoglycemic events or severe hypoglycemic events over the course of their entire admission. A second method tracked the percentage of monitored patient‐days with hypoglycemia and severe hypoglycemia, thereby correcting for potential misinterpretation from clustered repeated measures or variable length of stay. As with the glycemic control analysis, we repeated the hypoglycemia analysis in the subset of patients with 8 POC glucose values.
Summary Analysis of Glycemic Control and Hypoglycemia
Pearson chi square values, with relative risks (RRs) and 95% confidence intervals (CIs) were calculated to compare glycemic control and hypoglycemia in the 2 key interventions and baseline. The interventions and data reporting were grouped as follows:
Baseline: November 2002 to October 2003) = Time Period 1 (TP1)
Structured Order Set: November 2003 to April 2005) = Time Period 2 (TP2)
Algorithm plus Structured Order Set: May 2005 to December 2005) = Time Period 3 (TP3)
A P value of less than 0.05 was determined as significant and data were analyzed using STATA, Version 8 (STATA Corp., College Station, TX).
We assigned the RR of uncontrolled hyperglycemia and the RR of hypoglycemia during the baseline time (TP1) with values of 1.0, and calculated the RR and CIs for the same parameters during TP2 and TP3.
RESULTS
Just over 11,000 patients were identified for POC glucose testing over the 38 month observation period. Of these, 9314 patients had either a diagnosis of diabetes or documented hyperglycemia. The characteristics of this study population are depicted in Table 1. There were no differences between the groups and the demographics of age, gender, or length of stay (P > 0.05 for all parameters). There was a slight increase in the percent of patients with any intensive care unit days over the 3 time periods and a similar increase in the case mix index.
| Patients Meeting Criteria of Diabetes Mellitus Diagnosis or Hyperglycemia (n = 9,314 patients) | Baseline | TP2 | TP3 |
|---|---|---|---|
| |||
| Time period (TP) | November 2002 to October 2003 | November 2003 to April 2005 | May 2005 to December 2005 |
| Monitored patient days (44,232) | 11,571 | 21,126 | 11,535 |
| Number of patients (9,314) | 2,504 | 4,515 | 2,295 |
| Males (%) | 55 | 54 | 56 |
| Average age standard deviation | 56 17 | 56 17 | 56 16 |
| Length of stay (excluding highest 1% of outliers) | 4.6 5.9 | 4.6 5.7 | 4.8 5.8 |
| % With any intensive care unit days* | 18 | 20 | 22 |
| Case mix index score (mean SD) | 1.8 2.1 | 2.0 2.3 | 2.1 2.1 |
| Case mix index (median score) | 1.1 | 1.3 | 1.3 |
Of the 9314 study patients, 5530 had 8 or more POC glucose values, and were included in a secondary analysis of glycemic control and hypoglycemia.
Insulin Use Patterns
Figure 4 demonstrates the dramatic improvement that took place with the introduction of the structured order set. In the 6 months preceding the introduction of the structured insulin order set (May‐October 2003) 72% of 477 sampled patients with insulin orders were on sliding scale‐only insulin regimens (with no basal insulin), compared to just 26% of 499 patients sampled in the March to August 2004 time period subsequent to order set implementation (P < .0001, chi square statistic). Intermittent monthly checks on insulin use patterns reveal this change has been sustained.
Glycemic Control
A total of 9314 patients with 44,232 monitored patient‐days and over 120,000 POC glucose values were analyzed to assess glycemic control, which was improved with structured insulin orders and improved incrementally with the introduction of the insulin management algorithm.
The percent of patient‐days that were uncontrolled, defined as a monitored day with a mean glucose of 180 mg/dL, was reduced over the 3 time periods (37.8% versus 33.9% versus 30.1%, P < 0.005, Pearson chi square statistic), representing a 21% RR reduction of uncontrolled patient‐days from TP1 versus TP3. Table 2 shows the summary results for glycemic control, including the RR and CIs between the 3 time periods.
| Time Period (TP) | Baseline | TP2 Structured Orders | TP3 Orders Plus Algorithm | Relative Risk TP3:TP2 |
|---|---|---|---|---|
| ||||
| Patient‐day glucose | ||||
| Mean SD | 179 66 | 170 65 | 165 58 | |
| Median | 160 | 155 | 151 | |
| Uncontrolled patient‐days* | 4,372 | 7,162 | 3,465 | |
| Monitored patient‐days | 11,555 | 21,135 | 11,531 | |
| % Uncontrolled patient‐days | 37.8 | 33.9 | 30.1 | |
| RR: uncontrolled patient‐day (95% confidence interval) | 1.0 | 0.89 (0.87‐0.92) | 0.79 (0.77‐0.82) | 0.89 (0.86‐0.92) |
| Glycemic control by patient‐stay | ||||
| Day‐weighted mean SD | 177 57 | 174 54 | 170 50 | |
| Day‐weighted median | 167 | 162 | 158 | |
| Uncontrolled patient‐stay (%) | 1,038 | 1,696 | 784 | |
| Monitored patient‐stay | 2,504 | 4,515 | 2,295 | |
| % Uncontrolled patient‐stays | 41.5 | 37.6 | 34.2 | |
| RR: uncontrolled patient‐stay (95% confidence interval) | 0.91 (0.85‐0.96) | 0.84 (0.77‐0.89) | 0.91 (0.85‐0.97) | |
In a similar fashion, the percent of patients with uncontrolled patient‐stays (day‐weighted mean glucose 180 mg/dL) was also reduced over the 3 time periods (41.5% versus 37.6% versus 34.2%, P < 0.05, Pearson chi square statistic, with an RR reduction of 16% for TP3:TP1). Figure 5 depicts a statistical process control chart of the percent of patients experiencing uncontrolled patient‐stays over time, and is more effective in displaying the temporal relationship of the interventions with the improved results.
Uncontrolled hyperglycemic days and stays were reduced incrementally from TP3 versus TP2, reflecting the added benefit of the insulin management algorithm, compared to the benefit enjoyed with the structured order set alone.
When the analyses were repeated after excluding patients with fewer than 8 POC glucose readings (Table 3), the findings were similar, but as predicted, the effect was slightly more pronounced, with a 23% relative reduction in uncontrolled patient‐days and a 27% reduction in uncontrolled patient‐stays of TP3 versus TP1.
| Time Period (TP) | Baseline | TP2 Structured Orders | TP3 Orders Plus Algorithm | Relative Risk TP3:TP2 |
|---|---|---|---|---|
| ||||
| Patient‐day glucose | ||||
| Mean SD | 172 65 | 169 64 | 163 57 | |
| Median | 159 | 154 | 149 | |
| Uncontrolled patient‐days* | 3,469 | 5,639 | 2,766 | |
| Monitored patient‐days | 9,304 | 17,278 | 9,671 | |
| % Uncontrolled patient‐days | 37.3 | 32.6 | 28.6 | |
| RR: uncontrolled patient‐day (95% confidence interval) | 1.0 | 0.87 (0.85‐0.90) | 0.77 (0.74‐0.80) | 0.88 (0.84‐0.91) |
| Glycemic control by patient‐stay | ||||
| Day‐weighted mean SD | 175 51 | 169 47 | 166 45 | |
| Day‐weighted median | 167 | 158 | 155 | |
| Uncontrolled patient‐stay (%) | 588 | 908 | 425 | |
| Monitored patient‐stay | 1,439 | 2,659 | 1,426 | |
| % Uncontrolled patient‐stays | 40.1 | 34.1 | 29.8 | |
| RR: Uncontrolled patient‐stay (95% confidence interval) | 0.84 (0.77‐0.91) | 0.73 (0.66‐0.81) | 0.87 (0.79‐0.96) | |
Hypoglycemia
Table 4 summarizes the results for hypoglycemia and severe hypoglycemia in the study population, and Table 5 summarizes the secondary analyses of hypoglycemia in the subset with at least 8 POC glucose readings.
| TP (Time Period) | Baseline | TP2 | TP3 | Relative Risk TP3:TP2 |
|---|---|---|---|---|
| ||||
| Monitored patient‐stays | 2504 | 4515 | 2295 | |
| Stays with hypoglycemia (%) | 296 (11.8) | 437 (9.7) | 210 (9.2) | |
| RR hypoglycemic stay (CI) | 1.0 | 0.82 (0.72‐0.94) | 0.77 (0.65‐0.92) | 0.95 (0.81‐1.10) |
| Stays with severe hypoglycemia (%) | 73 (2.9) | 96 (2.1) | 55 (2.4) | |
| RR severe hypoglycemic stay (CI) | 1.0 | 0.73 (0.54‐0.98) | 0.82 (0.58‐1.16) | 1.13 (0.81‐1.56) |
| Monitored patient‐days | 11,584 | 21,158 | 11,548 | |
| Days with hypoglycemia (%) | 441 (3.8) | 623 (2.9) | 300 (2.6) | |
| RR hypoglycemic day (CI) | 1.0 | 0.77 (0.69‐0.87) | 0.68 (0.59‐0.78) | 0.88 (0.77‐1.01) |
| Days with severe hypoglycemia (%) | 86 (0.74) | 109 (0.52) | 66 (0.57) | |
| RR Severe hypoglycemic day (CI) | 1.0 | 0.69 (0.52‐0.92) | 0.77 (0.56‐1.06) | 1.10 (0.82‐1.5) |
| TP (Time Period) | Baseline | TP2 | TP3 | Relative Risk TP3:TP2 |
|---|---|---|---|---|
| ||||
| Monitored patient‐stays | 1440 | 2664 | 1426 | |
| Stays with hypoglycemia (%) | 237 (16.5) | 384 (14.4) | 180 (12.6) | |
| RR hypoglycemic stay (CI) | 1.0 | 0.88 (0.76‐1.02) | 0.77 (0.64‐0.92) | 0.88 (0.75‐1.03) |
| Stays with severe hypoglycemia (%) | 58 (4.0) | 93 (3.5) | 47 (3.3) | |
| RR severe hypoglycemic stay (CI) | 1.0 | 0.87 (0.63‐1.2) | 0.82 (0.56‐1.19) | 0.94 (0.67‐1.33) |
| Monitored patient‐days | 9,317 | 17,310 | 9,684 | |
| Days with hypoglycemia (%) | 379 (4.1) | 569 (3.3) | 269 (2.7) | |
| RR hypoglycemic day (CI) | 1.0 | 0.81 (0.71‐0.92) | 0.68 (0.59‐0.80) | 0.85 (0.73‐0.98) |
| Days with severe hypoglycemia (%) | 71 (0.76) | 106 (0.61) | 58 (0.60) | |
| RR severe hypoglycemic day (CI) | 1.0 | 0.80 (0.60‐1.08) | 0.79 (0.56‐1.11) | 0.98 (0.71‐1.34) |
Analysis by Patient‐Stay
The percent of patients that suffered 1 or more hypoglycemic event over the course of their inpatient stay was 11.8% in TP1, 9.7% in TP2, and 9.2% in TP3. The RR of a patient suffering from a hypoglycemic event was significantly improved in the intervention time periods compared to baseline, with the RR of TP3:TP1 = 0.77 (CI, 0.65‐0.92). There was a strong trend for incremental improvement in hypoglycemic patient‐stays for TP3 versus TP2, but the trend just missed statistical significance (P < 0.07). Similar trends in improvement were found for severe hypoglycemia by patient‐stay, but these trends were only statistically significant for TP2 versus TP1. The findings were similar in the subset of patients with at least 8 POC glucose readings (Table 5).
Analysis by Patient‐Day
Of monitored patient days in the baseline TP1, 3.8% contained a hypoglycemic value of 60 mg/dL. With the introduction of structured insulin orders in TP2, this was reduced to 2.9%, and in TP3 it was 2.6%. The RR of a hypoglycemic patient‐day of TP2 compared to TP1 was 0.77 (CI, 0.69‐0.87), whereas the cumulative impact of the structured order set and algorithm (TP3:TP1) was 0.68 (CI, 0.59‐0.78), representing a 32% reduction of the baseline risk of suffering from a hypoglycemic day. Similar reductions were seen for the risk of a severe hypoglycemic patient‐day.
The secondary analysis of hypoglycemic and severe hypoglycemic patient‐days showed very similar results, except that the TP3:TP2 RR for hypoglycemia of 0.85 (CI, 0.73‐0.98) reached statistical significance, again demonstrating the incrementally beneficial effect of the insulin management algorithm.
DISCUSSION
Our study convincingly demonstrates that significant improvement in glycemic control can be achieved with implementation of structured subcutaneous insulin orders and a simple insulin management protocol. Perhaps more importantly, these gains in glycemic control are not gained at the expense of increased iatrogenic hypoglycemia, and in fact, we observed a 32% decline in the percent of patient‐days with hypoglycemia. This is extremely important because fear of hypoglycemia is the most significant barrier to glycemic control efforts.
Strengths and Limitations
Our study has several strengths. The study is large and incorporates all patients with diabetes or hyperglycemia captured by POC glucose testing, and the observation period is long enough that bias from merely being observed is not a factor. We used metrics for glycemic control, hypoglycemia, and insulin use patterns that are of high quality and are generally in line with the Society of Hospital Medicine (SHM) Glycemic Control Task force recommendations,12, 13 and examined data by both patient‐stay and patient‐day.
The increased use of anticipatory physiologic subcutaneous insulin regimens, and the subsequent decline in the use of sliding scale insulin, is the most likely mechanism for improvement. The improvements seen are fairly dramatic for an institution in absolute terms, because inpatient hyperglycemia and hypoglycemia are so common. For example, on an annualized basis for our 400‐bed medical center, these interventions prevent 124 patients from experiencing 208 hypoglycemic days.
Other institutions should be able to replicate our results. We received administrative support to create a multidisciplinary steering committee, but we did not have incremental resources to create a dedicated team for insulin management, mandated endocrinology comanagement or consultations, or manual data collection. In fact, we had only 1 diabetes educator for 400 adult beds at 2 sites, and were relatively underresourced in this area by community standards. There was some time and expense in creating the glycemic control reports, but all of the glucose data collected were part of normal care, and the data retrieval became automated.
The main limitation of this study lies in the observational study design. There were multiple interventions in addition to structured insulin orders and the insulin management algorithm, and these educational and organizational changes undoubtedly also contributed to the overall success of our program. Since we did not perform a randomized controlled trial, the reader might reasonably question if the structured order sets and insulin management algorithm were actually the cause of the improvement seen, as opposed to these ancillary efforts or secular change. However, there are several factors that make this unlikely. First, the study population was well‐defined, having diabetes or documented hyperglycemia in all 3 time periods. Second, the demographics remained constant or actually worked against improvement trends, since the markers of patient acuity suggest increased patient acuity over the observation period. Third, the temporal relationship of the improvement to the introduction of our key interventions, as viewed on statistical process control charts shown in Figure 5, strongly suggest a causal relationship. This temporal relationship was consistently observed no matter how we chose to define uncontrolled hyperglycemia, and was also seen on hypoglycemia control charts. We view the ancillary interventions (such as educational efforts) as necessary, but not sufficient, in and of themselves, to effect major improvement.
We did not analyze the impact of the improved glycemic control on patient outcomes. In the absence of a randomized controlled trial design, controlling for the various confounders is a challenging task. Also, it is likely that not all hypoglycemic events were attributable to inpatient glycemic control regimens, though the secondary analysis probably eliminated many hypoglycemia admissions.
Lessons Learned: Implications from our study
We agree with the American Association of Clinical Endocrinologists (AACE)/American Diabetes Association (ADA)2 and the SHM Glycemic Control Task Force12 about the essential elements needed for successful implementation of inpatient glycemic control programs:
An appropriate level of administrative support.
Formation of a multidisciplinary steering committee to drive the development of initiatives, empowered to enact changes.
Assessment of current processes, quality of care, and barriers to practice change.
Development and implementation of interventions, including standardized order sets, protocols, policies, and algorithms with associated educational programs.
Metrics for evaluation of glycemic control, hypoglycemia, insulin use patterns, and other aspects of care.
Metrics to follow hypoglycemia are extremely important. The voluntary reporting on insulin‐induced hypoglycemia fluctuated widely over the course of our project. These fluctuations did not correlate well with the more objective and accurate measures we followed, and this objective data was very helpful in reducing the fear of hypoglycemia, and spreading the wider use of basal bolus insulin regimens. We strongly recommend that improvement teams formulate and follow measures of glycemic control, hypoglycemia, and insulin use, similar to those outlined in the SHM Glycemic Control Improvement Guide12 and the SHM Glycemic Control Task Force summary on glucometrics.13
Although we introduced our structured insulin order set first, with a long lag time until we introduced the insulin management algorithm, we advocate a different approach for institutions grappling with these issues. This approach is well‐described by the SHM Glycemic Control Task Force.14 An insulin management algorithm should be crafted first, integrating guidance for insulin dosing, preferred insulin regimens for different nutritional situations, a glycemic target, insulin dosing adjustment, glucose monitoring, and prompts for ordering a glycosylated hemoglobin (A1c) level. Next, the order set and the supporting educational programs should integrate this guidance as much as possible, making the key guidance available at the point of patient care.
This guidance was available in our algorithm but was not inherent in the structured insulin orders described in this report, and all basal and nutritional insulin options were offered as equally acceptable choices. This version did not calculate insulin doses or assist in the apportionment of insulin between basal and nutritional components. Only a single adjustment dose scale was offered, leaving appropriate modifications up to the end user, and from a usability standpoint, our CPOE insulin orders lacked dynamic flexibility (revising a single insulin required discontinuing all prior orders and reentering all orders). These limitations have subsequently been addressed with Version 2 of our CPOE insulin orders, and the details will soon be available in the literature.15
We are now exploring further improvement with concurrent identification and intervention of hyperglycemic patients that are not on physiologic insulin regimens or not meeting glycemic targets, and implementing protocols addressing the transition from infusion insulin.
CONCLUSION
We significantly improved glycemic control and simultaneously reduced hypoglycemia across all major medical and surgical services at our medical center, thereby addressing the number 1 barrier to improved inpatient glycemic control. We achieved this via systems changes with the introduction of structured subcutaneous insulin orders and the insulin management algorithm, along with education, but did not otherwise mandate or monitor adherence to our algorithm.
Implementing an institutional insulin management algorithm and structured insulin orders should now be viewed as a potent safety intervention as well as an intervention to enhance quality, and we have demonstrated that non‐critical care glycemic control efforts can clearly be a win‐win situation.
- Centers for Disease Control and Prevention.National Diabetes Fact Sheet: General Information and National Estimates on Diabetes in the United States, 2002.Atlanta, GA:U.S. Department of Health and Human Services, Centers for Disease Control and Prevention;2003. Available at: www.cdc.gov/diabetes/pubs/factsheet.htm. Accessed January 21, 2006.
- American College of Endocrinology and American Diabetes Association Consensus statement on inpatient diabetes and glycemic control: a call to action.Diabetes Care.2006;29:1955‐1962.
- ,,, et al.Hyperglycemia: an independent marker of in‐hospital mortality in patients with undiagnosed diabetes.J Clin Endocrinol Metab.2002;87:978‐982.
- ,,, et al.The relation between hyperglycemia and outcomes in 2471 patients admitted to the hospital with community‐acquired pneumonia.Diabetes Care.2005;28:810‐815.
- ,,, et al.Cancer.2004;100:1179‐1185.
- ,,, et al.Early perioperative glycaemic control and allograft rejection in patients with diabetes mellitus: a pilot study.Transplantation.2001;72:1321‐1324.
- ,,, et al.Early postoperative glucose control predicts nosocomial infection rate in diabetic patients.J Parenter Enteral Nutr.1998;22:77‐81.
- ,,, et al.Glucose control lowers the risk of wound infection in diabetics after open heart operations.Ann Thorac Surg.1997;63:356‐361.
- ,,, et al.Management of diabetes and hyperglycemia in hospitals.Diabetes Care.2004;27:553‐591.
- ,,, et al.American College of Endocrinology position statement on inpatient diabetes and metabolic control.Endocr Pract.2004;10:77‐82.
- ,.Glycemic chaos (not glycemic control) still the rule for inpatient care: how do we stop the insanity? [Editorial].J Hosp Med.2006;1:141‐144.
- Society of Hospital Medicine Glycemic Control Task Force: Optimizing Glycemic Control and Reducing Hypoglycemia at Your Medical Center. Society of Hospital Medicine, Glycemic Control Quality Improvement Resource Room. Available at: http://www.hospitalmedicine.org/ResourceRoomRedesign/GlycemicControl.cfm. Accessed October2008.
- ,,,,,.SHM Glycemic Control Task Force summary: practical recommendations for assessing the impact of glycemic control efforts.J Hosp Med.2008;3(S5):66–75.
- ,,,;for the SHM Glycemic Control Task Force.Subcutaneous insulin order sets and protocols: effective design and implementation strategies.J Hosp Med.2008;3(S5):29–41.
- ,,,.Indication‐based ordering: a new paradigm for glycemic control in hospitalized inpatients.J Diabetes Sci Tech.2008;2(3):349‐356.
Copyright © 2009 Society of Hospital Medicine