User login
Hospitalists’ performance is routinely evaluated by third-party payers, employers, and patients. As hospitalist programs mature, there is a need to develop processes to identify, internally measure, and report on individual and group performance. We know from Society of Hospital Medicine (SHM) data that a significant amount of hospitalists’ total compensation is at least partially based on performance. Often this is based at least in part on quality data. In 2006, SHM issued a white paper detailing the key elements of a successful performance monitoring and reporting process.1,2 Recommendations included the identification of meaningful operational and clinical performance metrics, and the ability to monitor and report both group and individual metrics was highlighted as an essential component. There is evidence that comparison of individual provider performance with that of their peers is a necessary element of successful provider dashboards.3 Additionally, regular feedback and a clear, visual presentation of the data are important components of successful provider feedback dashboards.3-6
Much of the literature regarding provider feedback dashboards has been based in the outpatient setting. The majority of these dashboards focus on the management of chronic illnesses (eg, diabetes and hypertension), rates of preventative care services (eg, colonoscopy or mammogram), or avoidance of unnecessary care (eg, antibiotics for sinusitis).4,5 Unlike in the outpatient setting, in which 1 provider often provides a majority of the care for a given episode of care, hospitalized patients are often cared for by multiple providers, challenging the appropriate attribution of patient-level metrics to specific providers. Under the standard approach, an entire hospitalization is attributed to 1 physician, generally the attending of record for the hospitalization, which may be the admitting provider or the discharging provider, depending on the approach used by the hospital. However, assigning responsibility for an entire hospitalization to a provider who may have only seen the patient for a small percentage of a hospitalization may jeopardize the validity of metrics. As provider metrics are increasingly being used for compensation, it is important to ensure that the method for attribution correctly identifies the providers caring for patients. To our knowledge there is no gold standard approach for attributing metrics to providers when patients are cared for by multiple providers, and the standard attending of record–based approach may lack face validity in many cases.
We aimed to develop and operationalize a system to more fairly attribute patient-level data to individual providers across a single hospitalization even when multiple providers cared for the patient. We then compared our methodology to the standard approach, in which the attending of record receives full attribution for each metric, to determine the difference on a provider level between the 2 models.
METHODS
Clinical Setting
The Johns Hopkins Hospital is a 1145-bed, tertiary-care hospital. Over the years of this project, the Johns Hopkins Hospitalist Program was an approximately 20-physician group providing care in a variety of settings, including a dedicated hospitalist floor, where this metrics program was initiated. Hospitalists in this setting work Monday through Friday, with 1 hospitalist and a moonlighter covering on the weekends. Admissions are performed by an admitter, and overnight care is provided by a nocturnist. Initially 17 beds, this unit expanded to 24 beds in June 2012. For the purposes of this article, we included all general medicine patients admitted to this floor between July 1, 2010, and June 30, 2014, who were cared for by hospitalists. During this period, all patients were inpatients; no patients were admitted under observation status. All of these patients were cared for by hospitalists without housestaff or advanced practitioners. Since 2014, the metrics program has been expanded to other hospitalist-run services in the hospital, but for simplicity, we have not presented these more recent data.
Individual Provider Metrics
Metrics were chosen to reflect institutional quality and efficiency priorities. Our choice of metrics was restricted to those that (1) plausibly reflect provider performance, at least in part, and (2) could be accessed in electronic form (without any manual chart review). Whenever possible, we chose metrics with objective data. Additionally, because funding for this effort was provided by the hospital, we sought to ensure that enough of the metrics were related to cost to justify ongoing hospital support of the project. SAS 9.2 (SAS Institute Inc, Cary, NC) was used to calculate metric weights. Specific metrics included American College of Chest Physicians (ACCP)–compliant venous thromboembolism (VTE) prophylaxis,7 observed-to-expected length of stay (LOS) ratio, percentage of discharges per day, discharges before 3 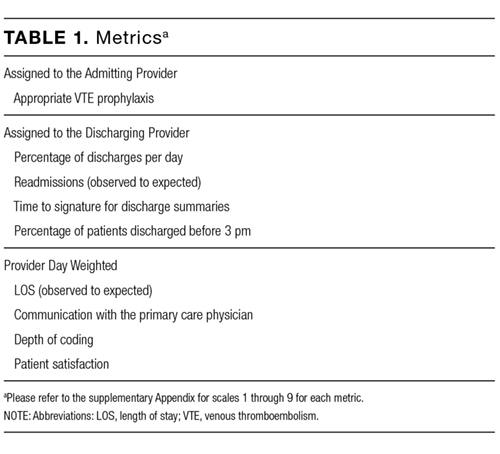
Appropriate prophylaxis for VTE was calculated by using an algorithm embedded within the computerized provider order entry system, which assessed the prescription of ACCP-compliant VTE prophylaxis within 24 hours following admission. This included a risk assessment, and credit was given for no prophylaxis and/or mechanical and/or pharmacologic prophylaxis per the ACCP guidelines.7
Observed-to-expected LOS was defined by using the University HealthSystem Consortium (UHC; now Vizient Inc) expected LOS for the given calendar year. This approach incorporates patient diagnoses, demographics, and other administrative variables to define an expected LOS for each patient.
The percent of patients discharged per day was defined from billing data as the percentage of a provider’s evaluation and management charges that were the final charge of a patient’s stay (regardless of whether a discharge day service was coded).
Discharge prior to 3
Depth of coding was defined as the number of coded diagnoses submitted to the Maryland Health Services Cost Review Commission for determining payment and was viewed as an indicator of the thoroughness of provider documentation.
Patient satisfaction was defined at the patient level (for those patients who turned in patient satisfaction surveys) as the pooled value of the 5 provider questions on the hospital’s patient satisfaction survey administered by Press Ganey: “time the physician spent with you,” “did the physician show concern for your questions/worries,” “did the physician keep you informed,” “friendliness/courtesy of the physician,” and “skill of the physician.”8
Readmission rates were defined as same-hospital readmissions divided by the total number of patients discharged by a given provider, with exclusions based on the Centers for Medicare and Medicaid Services hospital-wide, all-cause readmission measure.1 The expected same-hospital readmission rate was defined for each patient as the observed readmission rate in the entire UHC (Vizient) data set for all patients with the same All Patient Refined Diagnosis Related Group and severity of illness, as we have described previously.9
Communication with the primary care provider was the only self-reported metric used. It was based on a mandatory prompt on the discharge worksheet in the electronic medical record (EMR). Successful communication with the outpatient provider was defined as verbal or electronic communication by the hospitalist with the outpatient provider. Partial (50%) credit was given for providers who attempted but were unsuccessful in communicating with the outpatient provider, for patients for whom the provider had access to the Johns Hopkins EMR system, and for planned admissions without new or important information to convey. No credit was given for providers who indicated that communication was not indicated, who indicated that a patient and/or family would update the provider, or who indicated that the discharge summary would be sufficient.9 Because the discharge worksheet could be initiated at any time during the hospitalization, providers could document communication with the outpatient provider at any point during hospitalization.
Discharge summary turnaround was defined as the average number of days elapsed between the day of discharge and the signing of the discharge summary in the EMR.
Assigning Ownership of Patients to Individual Providers
Using billing data, we assigned ownership of patient care based on the type, timing, and number of charges that occurred during each hospitalization (Figure 1). Eligible charges included all history and physical (codes 99221, 99222, and 99223), subsequent care (codes 99231, 99232, and 99233), and discharge charges (codes 99238 and 99239).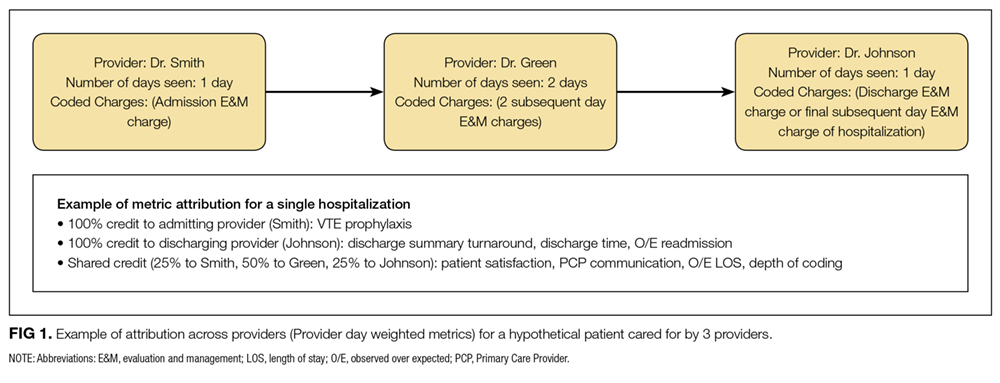
By using a unique identifier assigned for each hospitalization, professional fees submitted by providers were used to identify which provider saw the patient on the admission day, discharge day, as well as subsequent care days. Providers’ productivity, bonus supplements, and policy compliance were determined by using billing data, which encouraged the prompt submittal of charges.
The provider who billed the admission history and physical (codes 99221, 99222, and 99223) within 1 calendar date of the patient’s initial admission was defined as the admitting provider. Patients transferred to the hospitalist service from other services were not assigned an admitting hospitalist. The sole metric assigned to the admitting hospitalist was ACCP-compliant VTE prophylaxis.
The provider who billed the final subsequent care or discharge code (codes 99231, 99232, 99233, 99238, and 99239) within 1 calendar date of discharge was defined as the discharging provider. For hospitalizations characterized by a single provider charge (eg, for patients admitted and discharged on the same day), the provider billing this charge was assigned as both the admitting and discharging physician. Patients upgraded to the intensive care unit (ICU) were not counted as a discharge unless the patient was downgraded and discharged from the hospitalist service. The discharging provider was assigned responsibility for the time of discharge, the percent of patients discharged per day, the discharge summary turnaround time, and hospital readmissions.
Metrics that were assigned to multiple providers for a single hospitalization were termed “provider day–weighted” metrics. The formula for calculating the weight for each provider day–weighted metric was as follows: weight for provider A = [number of daily charges billed by provider A] divided by [LOS +1]. The initial hospital day was counted as day 0. LOS plus 1 was used to recognize that a typical hospitalization will have a charge on the day of admission (day 0) and a charge on the day of discharge such that an LOS of 2 days (eg, a patient admitted on Monday and discharged on Wednesday) will have 3 daily charges. Provider day–weighted metrics included patient satisfaction, communication with the outpatient provider, depth of coding, and observed-to-expected LOS.
Our billing software prevented providers from the same group from billing multiple daily charges, thus ensuring that there were no duplicated charges submitted for a given day.
Presenting Results
Providers were only shown data from the day-weighted approach. For ease of visual interpretation, scores for each metric were scaled ordinally from 1 (worst performance) to 9 (best performance; Table 1). Data were displayed in a dashboard format on a password-protected website for each provider to view his or her own data relative to that of the hospitalist peer group. The dashboard was implemented in this format on July 1, 2011. Data were updated quarterly (Figure 2).
Results were displayed in a polyhedral or spider-web graph (Figure 2). Provider and group metrics were scaled according to predefined benchmarks established for each metric and standardized to a scale ranging from 1 to 9. The scale for each metric was set based on examining historical data and group median performance on the metrics to ensure that there was a range of performance (ie, to avoid having most hospitalists scoring a 1 or 9). Scaling thresholds were periodically adjusted as appropriate to maintain good visual discrimination. Higher scores (creating a larger-volume polygon) are desirable even for metrics such as LOS, for which a low value is desirable. Both a spider-web graph and trends over time were available to the provider (Figure 2). These graphs display a comparison of the individual provider scores for each metric to the hospitalist group average for that metric.
Comparison with the Standard (Attending of Record) Method of Attribution
For the purposes of this report, we sought to determine whether there were meaningful differences between our day-weighted approach versus the standard method of attribution, in which the attending of record is assigned responsibility for each metric that would not have been attributed to the discharging attending under both methods. Our goal was to determine where and whether there was a meaningful difference between the 2 methodologies, recognizing that the degree of difference between these 2 methodologies might vary in other institutions and settings. In our hospital, the attending of record is generally the discharging attending. In order to compare the 2 methodologies, we arbitrarily picked 2015 to retrospectively evaluate the differences between these 2 methods of attribution. We did not display or provide data using the standard methodology to providers at any point; this approach was used only for the purposes of this report. Because these metrics are intended to evaluate relative provider performance, we assigned a percentile to each provider for his or her performance on the given metric using our attribution methodology and then, similarly, assigned a percentile to each provider using the standard methodology. This yielded 2 percentile scores for each provider and each metric. We then compared these percentile ranks for providers in 2 ways: (1) we determined how often providers who scored in the top half of the group for a given metric (above the 50th percentile) also scored in the top half of the group for that metric by using the other calculation method, and (2) we calculated the absolute value of the difference in percentiles between the 2 methods to characterize the impact on a provider’s ranking for that metric that might result from switching to the other method. For instance, if a provider scored at the 20th percentile for the group in patient satisfaction with 1 attribution method and scored at the 40th percentile for the group in patient satisfaction using the other method, the absolute change in percentile would be 20 percentile points. But, this provider would still be below the 50th percentile by both methods (concordant bottom half performance). We did not perform this comparison for metrics assigned to the discharging provider (such as discharge summary turnaround time or readmissions) because the attending of record designation is assigned to the discharging provider at our hospital.
RESULTS
The dashboard was successfully operationalized on July 1, 2011, with displays visible to providers as shown in Figure 2. Consistent with the principles of providing effective performance feedback to providers, the display simultaneously showed providers their individual performance as well as the performance of their peers. Providers were able to view their spider-web plot for prior quarters. Not shown are additional views that allowed providers to see quarterly trends in their data versus their peers across several fiscal years. Also available to providers was their ranking relative to their peers for each metric; specific peers were deidentified in the display.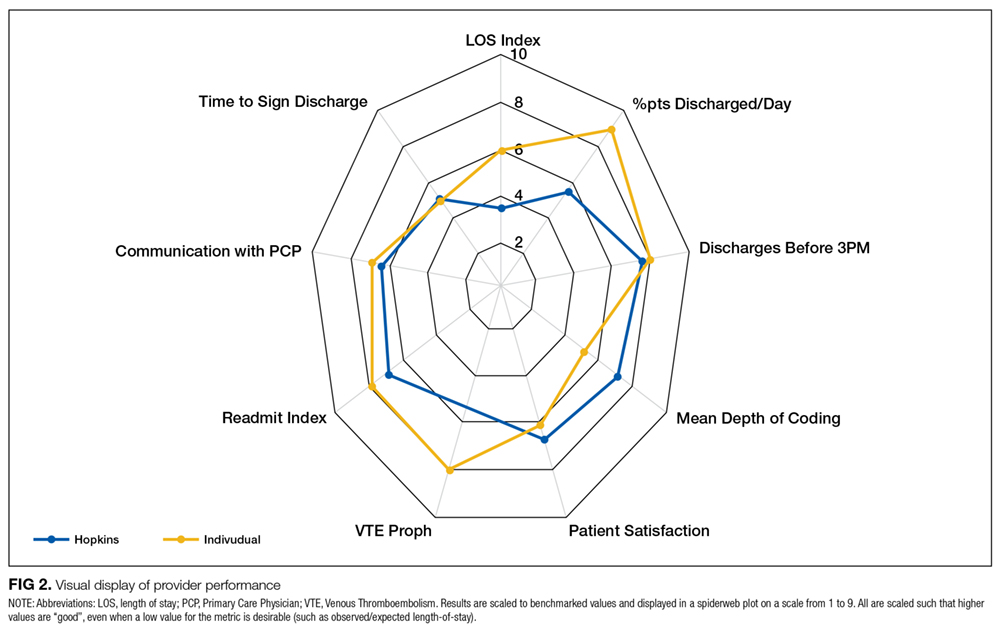
There was notable discordance between provider rankings between the 2 methodologies, as shown in Table 2. Provider performance above or below the median was concordant 56% to 75% of the time (depending on the particular metric), indicating substantial discordance because top-half or bottom-half concordance would be expected to occur by chance 50% of the time. Although the provider percentile differences between the 2 methods tended to be modest for most providers (the median difference between the methods was 13 to 22 percentile points for the various metrics), there were some providers for whom the method of calculation dramatically impacted their rankings. For 5 of the 6 metrics we examined, at least 1 provider had a 50-percentile or greater change in his or her ranking based on the method used. This indicates that at least some providers would have had markedly different scores relative to their peers had we used the alternative methodology (Table 2). In VTE prophylaxis, for example, at least 1 provider had a 94-percentile change in his or her ranking; similarly, a provider had an 88-perentile change in his or her LOS ranking between the 2 methodologies.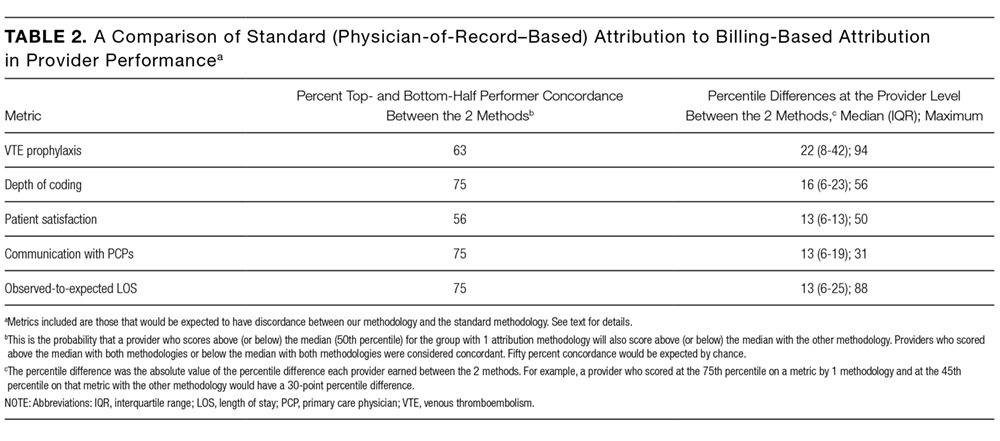
DISCUSSION
We found that it is possible to assign metrics across 1 hospital stay to multiple providers by using billing data. We also found a meaningful discrepancy in how well providers scored (relative to their peers) based on the method used for attribution. These results imply that hospitals should consider attributing performance metrics based on ascribed ownership from billing data and not just from attending of record status.
As hospitalist programs and providers in general are increasingly being asked to develop dashboards to monitor individual and group performance, correctly attributing care to providers is likely to become increasingly important. Experts agree that principles of effective provider performance dashboards include ranking individual provider performance relative to peers, clearly displaying data in an easily accessible format, and ensuring that data can be credibly attributed to the individual provider.3,4,6 However, there appears to be no gold standard method for attribution, especially in the inpatient setting. Our results imply that hospitals should consider attributing performance metrics based on ascribed ownership from billing data and not just from attending of record status.
Several limitations of our findings are important to consider. First, our program is a relatively small, academic group with handoffs that typically occur every 1 to 2 weeks and sometimes with additional handoffs on weekends. Different care patterns and settings might impact the utility of our attribution methodology relative to the standard methodology. Additionally, it is important to note that the relative merits of the different methodologies cannot be ascertained from our comparison. We can demonstrate discordance between the attribution methodologies, but we cannot say that 1 method is correct and the other is flawed. Although we believe that our day-weighted approach feels fairer to providers based on group input and feedback, we did not conduct a formal survey to examine providers’ preferences for the standard versus day-weighted approaches. The appropriateness of a particular attribution method needs to be assessed locally and may vary based on the clinical setting. For instance, on a service in which patients are admitted for procedures, it may make more sense to attribute the outcome of the case to the proceduralist even if that provider did not bill for the patient’s care on a daily basis. Finally, the computational requirements of our methodology are not trivial and require linking billing data with administrative patient-level data, which may be challenging to operationalize in some institutions.
These limitations aside, we believe that our attribution methodology has face validity. For example, a provider might be justifiably frustrated if, using the standard methodology, he or she is charged with the LOS of a patient who had been hospitalized for months, particularly if that patient is discharged shortly after the provider assumes care. Our method addresses this type of misattribution. Particularly when individual provider compensation is based on performance on metrics (as is the case at our institution), optimizing provider attribution to particular patients may be important, and face validity may be required for group buy-in.
In summary, we have demonstrated that it is possible to use billing data to assign ownership of patients to multiple providers over 1 hospital stay. This could be applied to other hospitalist programs as well as other healthcare settings in which multiple providers care for patients during 1 healthcare encounter (eg, ICUs).
Disclosure
The authors declare they have no relevant conflicts of interest.
1. Horwitz L, Partovian C, Lin Z, et al. Hospital-Wide (All-Condition) 30‐Day Risk-Standardized Readmission Measure. https://www.cms.gov/Medicare/Quality-Initiatives-Patient-Assessment-Instruments/MMS/downloads/MMSHospital-WideAll-ConditionReadmissionRate.pdf. Accessed March 6, 2015.
2. Medicine SoH. Measuring Hospitalist Performance: Metrics, Reports, and Dashboards. 2007; https://www.hospitalmedicine.org/Web/Practice_Management/Products_and_Programs/measure_hosp_perf_metrics_reports_dashboards.aspx. Accessed May 12, 2013.
3. Teleki SS, Shaw R, Damberg CL, McGlynn EA. Providing performance feedback to individual physicians: current practice and emerging lessons. Santa Monica, CA: RAND Corporation; 2006. 1-47. https://www.rand.org/content/dam/rand/pubs/working_papers/2006/RAND_WR381.pdf. Accessed August, 2017.
4. Brehaut JC, Colquhoun HL, Eva KW, et al. Practice Feedback Interventions: 15 Suggestions for Optimizing Effectiveness Practice Feedback Interventions. Ann Intern Med. 2016;164(6):435-441. PubMed
5. Dowding D, Randell R, Gardner P, et al. Dashboards for improving patient care: review of the literature. Int J Med Inform. 2015;84(2):87-100. PubMed
6. Landon BE, Normand S-LT, Blumenthal D, Daley J. Physician clinical performance assessment: prospects and barriers. JAMA. 2003;290(9):1183-1189. PubMed
7. Guyatt GH, Akl EA, Crowther M, Gutterman DD, Schuünemann HJ. Executive summary: Antit hrombotic therapy and prevention of thrombosis, 9th ed: American College of Chest Physicians evidence-based clinical practice guidelines. Ann Intern Med. 2012;141(2 suppl):7S-47S. PubMed
8. Siddiqui Z, Qayyum R, Bertram A, et al. Does Provider Self-reporting of Etiquette Behaviors Improve Patient Experience? A Randomized Controlled Trial. J Hosp Med. 2017;12(6):402-406. PubMed
9. Oduyebo I, Lehmann CU, Pollack CE, et al. Association of self-reported hospital discharge handoffs with 30-day readmissions. JAMA Intern Med. 2013;173(8):624-629. PubMed
Hospitalists’ performance is routinely evaluated by third-party payers, employers, and patients. As hospitalist programs mature, there is a need to develop processes to identify, internally measure, and report on individual and group performance. We know from Society of Hospital Medicine (SHM) data that a significant amount of hospitalists’ total compensation is at least partially based on performance. Often this is based at least in part on quality data. In 2006, SHM issued a white paper detailing the key elements of a successful performance monitoring and reporting process.1,2 Recommendations included the identification of meaningful operational and clinical performance metrics, and the ability to monitor and report both group and individual metrics was highlighted as an essential component. There is evidence that comparison of individual provider performance with that of their peers is a necessary element of successful provider dashboards.3 Additionally, regular feedback and a clear, visual presentation of the data are important components of successful provider feedback dashboards.3-6
Much of the literature regarding provider feedback dashboards has been based in the outpatient setting. The majority of these dashboards focus on the management of chronic illnesses (eg, diabetes and hypertension), rates of preventative care services (eg, colonoscopy or mammogram), or avoidance of unnecessary care (eg, antibiotics for sinusitis).4,5 Unlike in the outpatient setting, in which 1 provider often provides a majority of the care for a given episode of care, hospitalized patients are often cared for by multiple providers, challenging the appropriate attribution of patient-level metrics to specific providers. Under the standard approach, an entire hospitalization is attributed to 1 physician, generally the attending of record for the hospitalization, which may be the admitting provider or the discharging provider, depending on the approach used by the hospital. However, assigning responsibility for an entire hospitalization to a provider who may have only seen the patient for a small percentage of a hospitalization may jeopardize the validity of metrics. As provider metrics are increasingly being used for compensation, it is important to ensure that the method for attribution correctly identifies the providers caring for patients. To our knowledge there is no gold standard approach for attributing metrics to providers when patients are cared for by multiple providers, and the standard attending of record–based approach may lack face validity in many cases.
We aimed to develop and operationalize a system to more fairly attribute patient-level data to individual providers across a single hospitalization even when multiple providers cared for the patient. We then compared our methodology to the standard approach, in which the attending of record receives full attribution for each metric, to determine the difference on a provider level between the 2 models.
METHODS
Clinical Setting
The Johns Hopkins Hospital is a 1145-bed, tertiary-care hospital. Over the years of this project, the Johns Hopkins Hospitalist Program was an approximately 20-physician group providing care in a variety of settings, including a dedicated hospitalist floor, where this metrics program was initiated. Hospitalists in this setting work Monday through Friday, with 1 hospitalist and a moonlighter covering on the weekends. Admissions are performed by an admitter, and overnight care is provided by a nocturnist. Initially 17 beds, this unit expanded to 24 beds in June 2012. For the purposes of this article, we included all general medicine patients admitted to this floor between July 1, 2010, and June 30, 2014, who were cared for by hospitalists. During this period, all patients were inpatients; no patients were admitted under observation status. All of these patients were cared for by hospitalists without housestaff or advanced practitioners. Since 2014, the metrics program has been expanded to other hospitalist-run services in the hospital, but for simplicity, we have not presented these more recent data.
Individual Provider Metrics
Metrics were chosen to reflect institutional quality and efficiency priorities. Our choice of metrics was restricted to those that (1) plausibly reflect provider performance, at least in part, and (2) could be accessed in electronic form (without any manual chart review). Whenever possible, we chose metrics with objective data. Additionally, because funding for this effort was provided by the hospital, we sought to ensure that enough of the metrics were related to cost to justify ongoing hospital support of the project. SAS 9.2 (SAS Institute Inc, Cary, NC) was used to calculate metric weights. Specific metrics included American College of Chest Physicians (ACCP)–compliant venous thromboembolism (VTE) prophylaxis,7 observed-to-expected length of stay (LOS) ratio, percentage of discharges per day, discharges before 3
Appropriate prophylaxis for VTE was calculated by using an algorithm embedded within the computerized provider order entry system, which assessed the prescription of ACCP-compliant VTE prophylaxis within 24 hours following admission. This included a risk assessment, and credit was given for no prophylaxis and/or mechanical and/or pharmacologic prophylaxis per the ACCP guidelines.7
Observed-to-expected LOS was defined by using the University HealthSystem Consortium (UHC; now Vizient Inc) expected LOS for the given calendar year. This approach incorporates patient diagnoses, demographics, and other administrative variables to define an expected LOS for each patient.
The percent of patients discharged per day was defined from billing data as the percentage of a provider’s evaluation and management charges that were the final charge of a patient’s stay (regardless of whether a discharge day service was coded).
Discharge prior to 3
Depth of coding was defined as the number of coded diagnoses submitted to the Maryland Health Services Cost Review Commission for determining payment and was viewed as an indicator of the thoroughness of provider documentation.
Patient satisfaction was defined at the patient level (for those patients who turned in patient satisfaction surveys) as the pooled value of the 5 provider questions on the hospital’s patient satisfaction survey administered by Press Ganey: “time the physician spent with you,” “did the physician show concern for your questions/worries,” “did the physician keep you informed,” “friendliness/courtesy of the physician,” and “skill of the physician.”8
Readmission rates were defined as same-hospital readmissions divided by the total number of patients discharged by a given provider, with exclusions based on the Centers for Medicare and Medicaid Services hospital-wide, all-cause readmission measure.1 The expected same-hospital readmission rate was defined for each patient as the observed readmission rate in the entire UHC (Vizient) data set for all patients with the same All Patient Refined Diagnosis Related Group and severity of illness, as we have described previously.9
Communication with the primary care provider was the only self-reported metric used. It was based on a mandatory prompt on the discharge worksheet in the electronic medical record (EMR). Successful communication with the outpatient provider was defined as verbal or electronic communication by the hospitalist with the outpatient provider. Partial (50%) credit was given for providers who attempted but were unsuccessful in communicating with the outpatient provider, for patients for whom the provider had access to the Johns Hopkins EMR system, and for planned admissions without new or important information to convey. No credit was given for providers who indicated that communication was not indicated, who indicated that a patient and/or family would update the provider, or who indicated that the discharge summary would be sufficient.9 Because the discharge worksheet could be initiated at any time during the hospitalization, providers could document communication with the outpatient provider at any point during hospitalization.
Discharge summary turnaround was defined as the average number of days elapsed between the day of discharge and the signing of the discharge summary in the EMR.
Assigning Ownership of Patients to Individual Providers
Using billing data, we assigned ownership of patient care based on the type, timing, and number of charges that occurred during each hospitalization (Figure 1). Eligible charges included all history and physical (codes 99221, 99222, and 99223), subsequent care (codes 99231, 99232, and 99233), and discharge charges (codes 99238 and 99239).
By using a unique identifier assigned for each hospitalization, professional fees submitted by providers were used to identify which provider saw the patient on the admission day, discharge day, as well as subsequent care days. Providers’ productivity, bonus supplements, and policy compliance were determined by using billing data, which encouraged the prompt submittal of charges.
The provider who billed the admission history and physical (codes 99221, 99222, and 99223) within 1 calendar date of the patient’s initial admission was defined as the admitting provider. Patients transferred to the hospitalist service from other services were not assigned an admitting hospitalist. The sole metric assigned to the admitting hospitalist was ACCP-compliant VTE prophylaxis.
The provider who billed the final subsequent care or discharge code (codes 99231, 99232, 99233, 99238, and 99239) within 1 calendar date of discharge was defined as the discharging provider. For hospitalizations characterized by a single provider charge (eg, for patients admitted and discharged on the same day), the provider billing this charge was assigned as both the admitting and discharging physician. Patients upgraded to the intensive care unit (ICU) were not counted as a discharge unless the patient was downgraded and discharged from the hospitalist service. The discharging provider was assigned responsibility for the time of discharge, the percent of patients discharged per day, the discharge summary turnaround time, and hospital readmissions.
Metrics that were assigned to multiple providers for a single hospitalization were termed “provider day–weighted” metrics. The formula for calculating the weight for each provider day–weighted metric was as follows: weight for provider A = [number of daily charges billed by provider A] divided by [LOS +1]. The initial hospital day was counted as day 0. LOS plus 1 was used to recognize that a typical hospitalization will have a charge on the day of admission (day 0) and a charge on the day of discharge such that an LOS of 2 days (eg, a patient admitted on Monday and discharged on Wednesday) will have 3 daily charges. Provider day–weighted metrics included patient satisfaction, communication with the outpatient provider, depth of coding, and observed-to-expected LOS.
Our billing software prevented providers from the same group from billing multiple daily charges, thus ensuring that there were no duplicated charges submitted for a given day.
Presenting Results
Providers were only shown data from the day-weighted approach. For ease of visual interpretation, scores for each metric were scaled ordinally from 1 (worst performance) to 9 (best performance; Table 1). Data were displayed in a dashboard format on a password-protected website for each provider to view his or her own data relative to that of the hospitalist peer group. The dashboard was implemented in this format on July 1, 2011. Data were updated quarterly (Figure 2).
Results were displayed in a polyhedral or spider-web graph (Figure 2). Provider and group metrics were scaled according to predefined benchmarks established for each metric and standardized to a scale ranging from 1 to 9. The scale for each metric was set based on examining historical data and group median performance on the metrics to ensure that there was a range of performance (ie, to avoid having most hospitalists scoring a 1 or 9). Scaling thresholds were periodically adjusted as appropriate to maintain good visual discrimination. Higher scores (creating a larger-volume polygon) are desirable even for metrics such as LOS, for which a low value is desirable. Both a spider-web graph and trends over time were available to the provider (Figure 2). These graphs display a comparison of the individual provider scores for each metric to the hospitalist group average for that metric.
Comparison with the Standard (Attending of Record) Method of Attribution
For the purposes of this report, we sought to determine whether there were meaningful differences between our day-weighted approach versus the standard method of attribution, in which the attending of record is assigned responsibility for each metric that would not have been attributed to the discharging attending under both methods. Our goal was to determine where and whether there was a meaningful difference between the 2 methodologies, recognizing that the degree of difference between these 2 methodologies might vary in other institutions and settings. In our hospital, the attending of record is generally the discharging attending. In order to compare the 2 methodologies, we arbitrarily picked 2015 to retrospectively evaluate the differences between these 2 methods of attribution. We did not display or provide data using the standard methodology to providers at any point; this approach was used only for the purposes of this report. Because these metrics are intended to evaluate relative provider performance, we assigned a percentile to each provider for his or her performance on the given metric using our attribution methodology and then, similarly, assigned a percentile to each provider using the standard methodology. This yielded 2 percentile scores for each provider and each metric. We then compared these percentile ranks for providers in 2 ways: (1) we determined how often providers who scored in the top half of the group for a given metric (above the 50th percentile) also scored in the top half of the group for that metric by using the other calculation method, and (2) we calculated the absolute value of the difference in percentiles between the 2 methods to characterize the impact on a provider’s ranking for that metric that might result from switching to the other method. For instance, if a provider scored at the 20th percentile for the group in patient satisfaction with 1 attribution method and scored at the 40th percentile for the group in patient satisfaction using the other method, the absolute change in percentile would be 20 percentile points. But, this provider would still be below the 50th percentile by both methods (concordant bottom half performance). We did not perform this comparison for metrics assigned to the discharging provider (such as discharge summary turnaround time or readmissions) because the attending of record designation is assigned to the discharging provider at our hospital.
RESULTS
The dashboard was successfully operationalized on July 1, 2011, with displays visible to providers as shown in Figure 2. Consistent with the principles of providing effective performance feedback to providers, the display simultaneously showed providers their individual performance as well as the performance of their peers. Providers were able to view their spider-web plot for prior quarters. Not shown are additional views that allowed providers to see quarterly trends in their data versus their peers across several fiscal years. Also available to providers was their ranking relative to their peers for each metric; specific peers were deidentified in the display.
There was notable discordance between provider rankings between the 2 methodologies, as shown in Table 2. Provider performance above or below the median was concordant 56% to 75% of the time (depending on the particular metric), indicating substantial discordance because top-half or bottom-half concordance would be expected to occur by chance 50% of the time. Although the provider percentile differences between the 2 methods tended to be modest for most providers (the median difference between the methods was 13 to 22 percentile points for the various metrics), there were some providers for whom the method of calculation dramatically impacted their rankings. For 5 of the 6 metrics we examined, at least 1 provider had a 50-percentile or greater change in his or her ranking based on the method used. This indicates that at least some providers would have had markedly different scores relative to their peers had we used the alternative methodology (Table 2). In VTE prophylaxis, for example, at least 1 provider had a 94-percentile change in his or her ranking; similarly, a provider had an 88-perentile change in his or her LOS ranking between the 2 methodologies.
DISCUSSION
We found that it is possible to assign metrics across 1 hospital stay to multiple providers by using billing data. We also found a meaningful discrepancy in how well providers scored (relative to their peers) based on the method used for attribution. These results imply that hospitals should consider attributing performance metrics based on ascribed ownership from billing data and not just from attending of record status.
As hospitalist programs and providers in general are increasingly being asked to develop dashboards to monitor individual and group performance, correctly attributing care to providers is likely to become increasingly important. Experts agree that principles of effective provider performance dashboards include ranking individual provider performance relative to peers, clearly displaying data in an easily accessible format, and ensuring that data can be credibly attributed to the individual provider.3,4,6 However, there appears to be no gold standard method for attribution, especially in the inpatient setting. Our results imply that hospitals should consider attributing performance metrics based on ascribed ownership from billing data and not just from attending of record status.
Several limitations of our findings are important to consider. First, our program is a relatively small, academic group with handoffs that typically occur every 1 to 2 weeks and sometimes with additional handoffs on weekends. Different care patterns and settings might impact the utility of our attribution methodology relative to the standard methodology. Additionally, it is important to note that the relative merits of the different methodologies cannot be ascertained from our comparison. We can demonstrate discordance between the attribution methodologies, but we cannot say that 1 method is correct and the other is flawed. Although we believe that our day-weighted approach feels fairer to providers based on group input and feedback, we did not conduct a formal survey to examine providers’ preferences for the standard versus day-weighted approaches. The appropriateness of a particular attribution method needs to be assessed locally and may vary based on the clinical setting. For instance, on a service in which patients are admitted for procedures, it may make more sense to attribute the outcome of the case to the proceduralist even if that provider did not bill for the patient’s care on a daily basis. Finally, the computational requirements of our methodology are not trivial and require linking billing data with administrative patient-level data, which may be challenging to operationalize in some institutions.
These limitations aside, we believe that our attribution methodology has face validity. For example, a provider might be justifiably frustrated if, using the standard methodology, he or she is charged with the LOS of a patient who had been hospitalized for months, particularly if that patient is discharged shortly after the provider assumes care. Our method addresses this type of misattribution. Particularly when individual provider compensation is based on performance on metrics (as is the case at our institution), optimizing provider attribution to particular patients may be important, and face validity may be required for group buy-in.
In summary, we have demonstrated that it is possible to use billing data to assign ownership of patients to multiple providers over 1 hospital stay. This could be applied to other hospitalist programs as well as other healthcare settings in which multiple providers care for patients during 1 healthcare encounter (eg, ICUs).
Disclosure
The authors declare they have no relevant conflicts of interest.
1. Horwitz L, Partovian C, Lin Z, et al. Hospital-Wide (All-Condition) 30‐Day Risk-Standardized Readmission Measure. https://www.cms.gov/Medicare/Quality-Initiatives-Patient-Assessment-Instruments/MMS/downloads/MMSHospital-WideAll-ConditionReadmissionRate.pdf. Accessed March 6, 2015.
2. Medicine SoH. Measuring Hospitalist Performance: Metrics, Reports, and Dashboards. 2007; https://www.hospitalmedicine.org/Web/Practice_Management/Products_and_Programs/measure_hosp_perf_metrics_reports_dashboards.aspx. Accessed May 12, 2013.
3. Teleki SS, Shaw R, Damberg CL, McGlynn EA. Providing performance feedback to individual physicians: current practice and emerging lessons. Santa Monica, CA: RAND Corporation; 2006. 1-47. https://www.rand.org/content/dam/rand/pubs/working_papers/2006/RAND_WR381.pdf. Accessed August, 2017.
4. Brehaut JC, Colquhoun HL, Eva KW, et al. Practice Feedback Interventions: 15 Suggestions for Optimizing Effectiveness Practice Feedback Interventions. Ann Intern Med. 2016;164(6):435-441. PubMed
5. Dowding D, Randell R, Gardner P, et al. Dashboards for improving patient care: review of the literature. Int J Med Inform. 2015;84(2):87-100. PubMed
6. Landon BE, Normand S-LT, Blumenthal D, Daley J. Physician clinical performance assessment: prospects and barriers. JAMA. 2003;290(9):1183-1189. PubMed
7. Guyatt GH, Akl EA, Crowther M, Gutterman DD, Schuünemann HJ. Executive summary: Antit hrombotic therapy and prevention of thrombosis, 9th ed: American College of Chest Physicians evidence-based clinical practice guidelines. Ann Intern Med. 2012;141(2 suppl):7S-47S. PubMed
8. Siddiqui Z, Qayyum R, Bertram A, et al. Does Provider Self-reporting of Etiquette Behaviors Improve Patient Experience? A Randomized Controlled Trial. J Hosp Med. 2017;12(6):402-406. PubMed
9. Oduyebo I, Lehmann CU, Pollack CE, et al. Association of self-reported hospital discharge handoffs with 30-day readmissions. JAMA Intern Med. 2013;173(8):624-629. PubMed
© 2017 Society of Hospital Medicine