User login
A Method for Attributing Patient-Level Metrics to Rotating Providers in an Inpatient Setting
Hospitalists’ performance is routinely evaluated by third-party payers, employers, and patients. As hospitalist programs mature, there is a need to develop processes to identify, internally measure, and report on individual and group performance. We know from Society of Hospital Medicine (SHM) data that a significant amount of hospitalists’ total compensation is at least partially based on performance. Often this is based at least in part on quality data. In 2006, SHM issued a white paper detailing the key elements of a successful performance monitoring and reporting process.1,2 Recommendations included the identification of meaningful operational and clinical performance metrics, and the ability to monitor and report both group and individual metrics was highlighted as an essential component. There is evidence that comparison of individual provider performance with that of their peers is a necessary element of successful provider dashboards.3 Additionally, regular feedback and a clear, visual presentation of the data are important components of successful provider feedback dashboards.3-6
Much of the literature regarding provider feedback dashboards has been based in the outpatient setting. The majority of these dashboards focus on the management of chronic illnesses (eg, diabetes and hypertension), rates of preventative care services (eg, colonoscopy or mammogram), or avoidance of unnecessary care (eg, antibiotics for sinusitis).4,5 Unlike in the outpatient setting, in which 1 provider often provides a majority of the care for a given episode of care, hospitalized patients are often cared for by multiple providers, challenging the appropriate attribution of patient-level metrics to specific providers. Under the standard approach, an entire hospitalization is attributed to 1 physician, generally the attending of record for the hospitalization, which may be the admitting provider or the discharging provider, depending on the approach used by the hospital. However, assigning responsibility for an entire hospitalization to a provider who may have only seen the patient for a small percentage of a hospitalization may jeopardize the validity of metrics. As provider metrics are increasingly being used for compensation, it is important to ensure that the method for attribution correctly identifies the providers caring for patients. To our knowledge there is no gold standard approach for attributing metrics to providers when patients are cared for by multiple providers, and the standard attending of record–based approach may lack face validity in many cases.
We aimed to develop and operationalize a system to more fairly attribute patient-level data to individual providers across a single hospitalization even when multiple providers cared for the patient. We then compared our methodology to the standard approach, in which the attending of record receives full attribution for each metric, to determine the difference on a provider level between the 2 models.
METHODS
Clinical Setting
The Johns Hopkins Hospital is a 1145-bed, tertiary-care hospital. Over the years of this project, the Johns Hopkins Hospitalist Program was an approximately 20-physician group providing care in a variety of settings, including a dedicated hospitalist floor, where this metrics program was initiated. Hospitalists in this setting work Monday through Friday, with 1 hospitalist and a moonlighter covering on the weekends. Admissions are performed by an admitter, and overnight care is provided by a nocturnist. Initially 17 beds, this unit expanded to 24 beds in June 2012. For the purposes of this article, we included all general medicine patients admitted to this floor between July 1, 2010, and June 30, 2014, who were cared for by hospitalists. During this period, all patients were inpatients; no patients were admitted under observation status. All of these patients were cared for by hospitalists without housestaff or advanced practitioners. Since 2014, the metrics program has been expanded to other hospitalist-run services in the hospital, but for simplicity, we have not presented these more recent data.
Individual Provider Metrics
Metrics were chosen to reflect institutional quality and efficiency priorities. Our choice of metrics was restricted to those that (1) plausibly reflect provider performance, at least in part, and (2) could be accessed in electronic form (without any manual chart review). Whenever possible, we chose metrics with objective data. Additionally, because funding for this effort was provided by the hospital, we sought to ensure that enough of the metrics were related to cost to justify ongoing hospital support of the project. SAS 9.2 (SAS Institute Inc, Cary, NC) was used to calculate metric weights. Specific metrics included American College of Chest Physicians (ACCP)–compliant venous thromboembolism (VTE) prophylaxis,7 observed-to-expected length of stay (LOS) ratio, percentage of discharges per day, discharges before 3 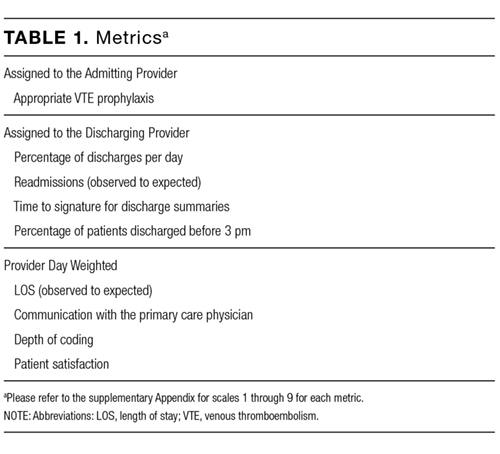
Appropriate prophylaxis for VTE was calculated by using an algorithm embedded within the computerized provider order entry system, which assessed the prescription of ACCP-compliant VTE prophylaxis within 24 hours following admission. This included a risk assessment, and credit was given for no prophylaxis and/or mechanical and/or pharmacologic prophylaxis per the ACCP guidelines.7
Observed-to-expected LOS was defined by using the University HealthSystem Consortium (UHC; now Vizient Inc) expected LOS for the given calendar year. This approach incorporates patient diagnoses, demographics, and other administrative variables to define an expected LOS for each patient.
The percent of patients discharged per day was defined from billing data as the percentage of a provider’s evaluation and management charges that were the final charge of a patient’s stay (regardless of whether a discharge day service was coded).
Discharge prior to 3
Depth of coding was defined as the number of coded diagnoses submitted to the Maryland Health Services Cost Review Commission for determining payment and was viewed as an indicator of the thoroughness of provider documentation.
Patient satisfaction was defined at the patient level (for those patients who turned in patient satisfaction surveys) as the pooled value of the 5 provider questions on the hospital’s patient satisfaction survey administered by Press Ganey: “time the physician spent with you,” “did the physician show concern for your questions/worries,” “did the physician keep you informed,” “friendliness/courtesy of the physician,” and “skill of the physician.”8
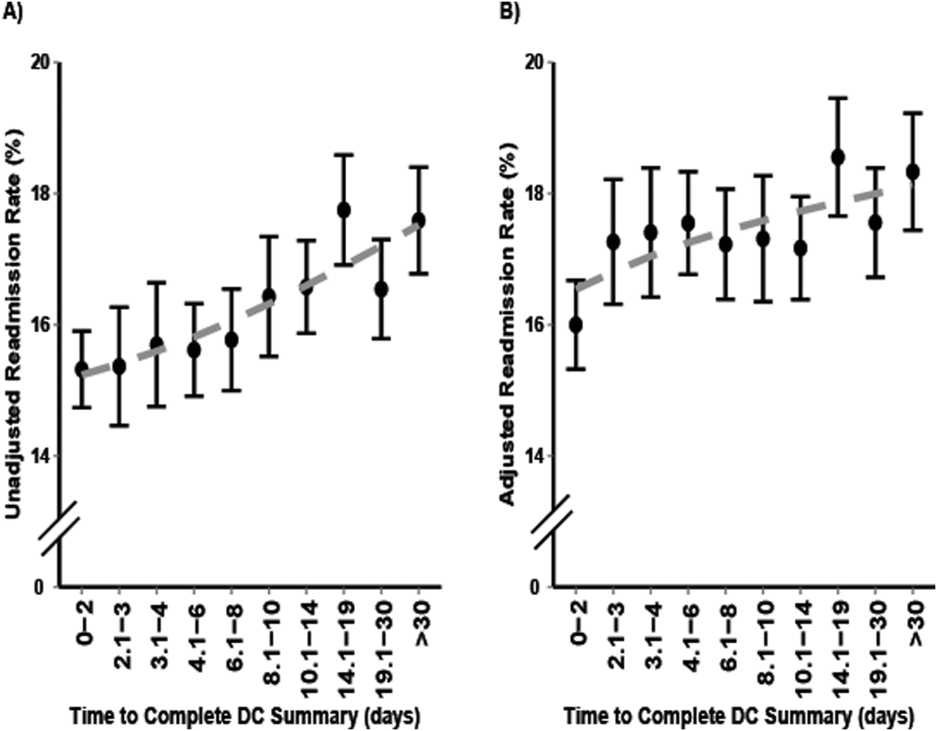
Readmission rates were defined as same-hospital readmissions divided by the total number of patients discharged by a given provider, with exclusions based on the Centers for Medicare and Medicaid Services hospital-wide, all-cause readmission measure.1 The expected same-hospital readmission rate was defined for each patient as the observed readmission rate in the entire UHC (Vizient) data set for all patients with the same All Patient Refined Diagnosis Related Group and severity of illness, as we have described previously.9
Communication with the primary care provider was the only self-reported metric used. It was based on a mandatory prompt on the discharge worksheet in the electronic medical record (EMR). Successful communication with the outpatient provider was defined as verbal or electronic communication by the hospitalist with the outpatient provider. Partial (50%) credit was given for providers who attempted but were unsuccessful in communicating with the outpatient provider, for patients for whom the provider had access to the Johns Hopkins EMR system, and for planned admissions without new or important information to convey. No credit was given for providers who indicated that communication was not indicated, who indicated that a patient and/or family would update the provider, or who indicated that the discharge summary would be sufficient.9 Because the discharge worksheet could be initiated at any time during the hospitalization, providers could document communication with the outpatient provider at any point during hospitalization.
Discharge summary turnaround was defined as the average number of days elapsed between the day of discharge and the signing of the discharge summary in the EMR.
Assigning Ownership of Patients to Individual Providers
Using billing data, we assigned ownership of patient care based on the type, timing, and number of charges that occurred during each hospitalization (Figure 1). Eligible charges included all history and physical (codes 99221, 99222, and 99223), subsequent care (codes 99231, 99232, and 99233), and discharge charges (codes 99238 and 99239).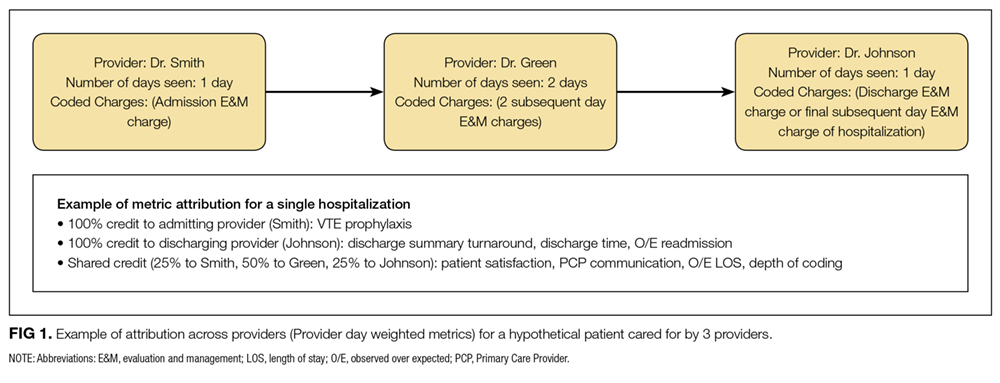
By using a unique identifier assigned for each hospitalization, professional fees submitted by providers were used to identify which provider saw the patient on the admission day, discharge day, as well as subsequent care days. Providers’ productivity, bonus supplements, and policy compliance were determined by using billing data, which encouraged the prompt submittal of charges.
The provider who billed the admission history and physical (codes 99221, 99222, and 99223) within 1 calendar date of the patient’s initial admission was defined as the admitting provider. Patients transferred to the hospitalist service from other services were not assigned an admitting hospitalist. The sole metric assigned to the admitting hospitalist was ACCP-compliant VTE prophylaxis.
The provider who billed the final subsequent care or discharge code (codes 99231, 99232, 99233, 99238, and 99239) within 1 calendar date of discharge was defined as the discharging provider. For hospitalizations characterized by a single provider charge (eg, for patients admitted and discharged on the same day), the provider billing this charge was assigned as both the admitting and discharging physician. Patients upgraded to the intensive care unit (ICU) were not counted as a discharge unless the patient was downgraded and discharged from the hospitalist service. The discharging provider was assigned responsibility for the time of discharge, the percent of patients discharged per day, the discharge summary turnaround time, and hospital readmissions.
Metrics that were assigned to multiple providers for a single hospitalization were termed “provider day–weighted” metrics. The formula for calculating the weight for each provider day–weighted metric was as follows: weight for provider A = [number of daily charges billed by provider A] divided by [LOS +1]. The initial hospital day was counted as day 0. LOS plus 1 was used to recognize that a typical hospitalization will have a charge on the day of admission (day 0) and a charge on the day of discharge such that an LOS of 2 days (eg, a patient admitted on Monday and discharged on Wednesday) will have 3 daily charges. Provider day–weighted metrics included patient satisfaction, communication with the outpatient provider, depth of coding, and observed-to-expected LOS.
Our billing software prevented providers from the same group from billing multiple daily charges, thus ensuring that there were no duplicated charges submitted for a given day.
Presenting Results
Providers were only shown data from the day-weighted approach. For ease of visual interpretation, scores for each metric were scaled ordinally from 1 (worst performance) to 9 (best performance; Table 1). Data were displayed in a dashboard format on a password-protected website for each provider to view his or her own data relative to that of the hospitalist peer group. The dashboard was implemented in this format on July 1, 2011. Data were updated quarterly (Figure 2).
Results were displayed in a polyhedral or spider-web graph (Figure 2). Provider and group metrics were scaled according to predefined benchmarks established for each metric and standardized to a scale ranging from 1 to 9. The scale for each metric was set based on examining historical data and group median performance on the metrics to ensure that there was a range of performance (ie, to avoid having most hospitalists scoring a 1 or 9). Scaling thresholds were periodically adjusted as appropriate to maintain good visual discrimination. Higher scores (creating a larger-volume polygon) are desirable even for metrics such as LOS, for which a low value is desirable. Both a spider-web graph and trends over time were available to the provider (Figure 2). These graphs display a comparison of the individual provider scores for each metric to the hospitalist group average for that metric.
Comparison with the Standard (Attending of Record) Method of Attribution
For the purposes of this report, we sought to determine whether there were meaningful differences between our day-weighted approach versus the standard method of attribution, in which the attending of record is assigned responsibility for each metric that would not have been attributed to the discharging attending under both methods. Our goal was to determine where and whether there was a meaningful difference between the 2 methodologies, recognizing that the degree of difference between these 2 methodologies might vary in other institutions and settings. In our hospital, the attending of record is generally the discharging attending. In order to compare the 2 methodologies, we arbitrarily picked 2015 to retrospectively evaluate the differences between these 2 methods of attribution. We did not display or provide data using the standard methodology to providers at any point; this approach was used only for the purposes of this report. Because these metrics are intended to evaluate relative provider performance, we assigned a percentile to each provider for his or her performance on the given metric using our attribution methodology and then, similarly, assigned a percentile to each provider using the standard methodology. This yielded 2 percentile scores for each provider and each metric. We then compared these percentile ranks for providers in 2 ways: (1) we determined how often providers who scored in the top half of the group for a given metric (above the 50th percentile) also scored in the top half of the group for that metric by using the other calculation method, and (2) we calculated the absolute value of the difference in percentiles between the 2 methods to characterize the impact on a provider’s ranking for that metric that might result from switching to the other method. For instance, if a provider scored at the 20th percentile for the group in patient satisfaction with 1 attribution method and scored at the 40th percentile for the group in patient satisfaction using the other method, the absolute change in percentile would be 20 percentile points. But, this provider would still be below the 50th percentile by both methods (concordant bottom half performance). We did not perform this comparison for metrics assigned to the discharging provider (such as discharge summary turnaround time or readmissions) because the attending of record designation is assigned to the discharging provider at our hospital.
RESULTS
The dashboard was successfully operationalized on July 1, 2011, with displays visible to providers as shown in Figure 2. Consistent with the principles of providing effective performance feedback to providers, the display simultaneously showed providers their individual performance as well as the performance of their peers. Providers were able to view their spider-web plot for prior quarters. Not shown are additional views that allowed providers to see quarterly trends in their data versus their peers across several fiscal years. Also available to providers was their ranking relative to their peers for each metric; specific peers were deidentified in the display.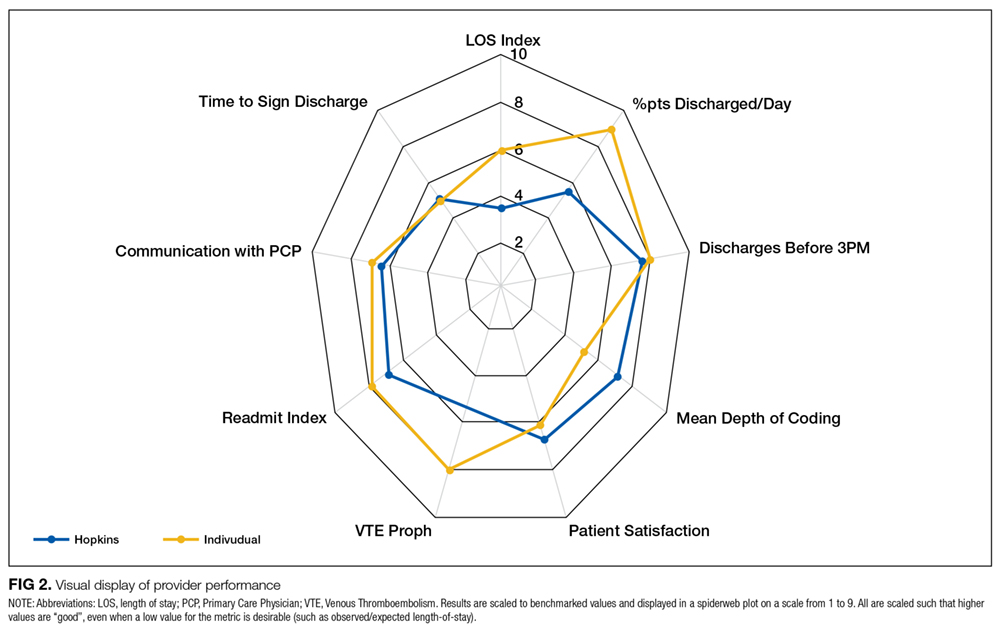
There was notable discordance between provider rankings between the 2 methodologies, as shown in Table 2. Provider performance above or below the median was concordant 56% to 75% of the time (depending on the particular metric), indicating substantial discordance because top-half or bottom-half concordance would be expected to occur by chance 50% of the time. Although the provider percentile differences between the 2 methods tended to be modest for most providers (the median difference between the methods was 13 to 22 percentile points for the various metrics), there were some providers for whom the method of calculation dramatically impacted their rankings. For 5 of the 6 metrics we examined, at least 1 provider had a 50-percentile or greater change in his or her ranking based on the method used. This indicates that at least some providers would have had markedly different scores relative to their peers had we used the alternative methodology (Table 2). In VTE prophylaxis, for example, at least 1 provider had a 94-percentile change in his or her ranking; similarly, a provider had an 88-perentile change in his or her LOS ranking between the 2 methodologies.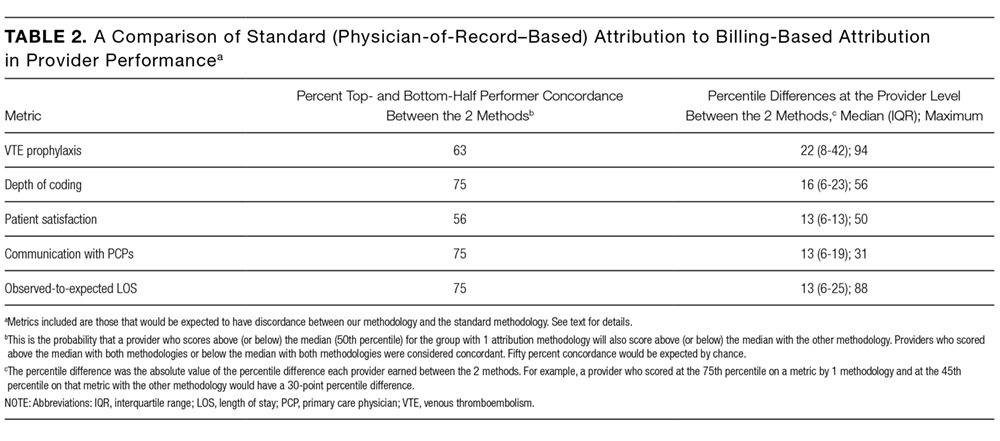
DISCUSSION
We found that it is possible to assign metrics across 1 hospital stay to multiple providers by using billing data. We also found a meaningful discrepancy in how well providers scored (relative to their peers) based on the method used for attribution. These results imply that hospitals should consider attributing performance metrics based on ascribed ownership from billing data and not just from attending of record status.
As hospitalist programs and providers in general are increasingly being asked to develop dashboards to monitor individual and group performance, correctly attributing care to providers is likely to become increasingly important. Experts agree that principles of effective provider performance dashboards include ranking individual provider performance relative to peers, clearly displaying data in an easily accessible format, and ensuring that data can be credibly attributed to the individual provider.3,4,6 However, there appears to be no gold standard method for attribution, especially in the inpatient setting. Our results imply that hospitals should consider attributing performance metrics based on ascribed ownership from billing data and not just from attending of record status.
Several limitations of our findings are important to consider. First, our program is a relatively small, academic group with handoffs that typically occur every 1 to 2 weeks and sometimes with additional handoffs on weekends. Different care patterns and settings might impact the utility of our attribution methodology relative to the standard methodology. Additionally, it is important to note that the relative merits of the different methodologies cannot be ascertained from our comparison. We can demonstrate discordance between the attribution methodologies, but we cannot say that 1 method is correct and the other is flawed. Although we believe that our day-weighted approach feels fairer to providers based on group input and feedback, we did not conduct a formal survey to examine providers’ preferences for the standard versus day-weighted approaches. The appropriateness of a particular attribution method needs to be assessed locally and may vary based on the clinical setting. For instance, on a service in which patients are admitted for procedures, it may make more sense to attribute the outcome of the case to the proceduralist even if that provider did not bill for the patient’s care on a daily basis. Finally, the computational requirements of our methodology are not trivial and require linking billing data with administrative patient-level data, which may be challenging to operationalize in some institutions.
These limitations aside, we believe that our attribution methodology has face validity. For example, a provider might be justifiably frustrated if, using the standard methodology, he or she is charged with the LOS of a patient who had been hospitalized for months, particularly if that patient is discharged shortly after the provider assumes care. Our method addresses this type of misattribution. Particularly when individual provider compensation is based on performance on metrics (as is the case at our institution), optimizing provider attribution to particular patients may be important, and face validity may be required for group buy-in.
In summary, we have demonstrated that it is possible to use billing data to assign ownership of patients to multiple providers over 1 hospital stay. This could be applied to other hospitalist programs as well as other healthcare settings in which multiple providers care for patients during 1 healthcare encounter (eg, ICUs).
Disclosure
The authors declare they have no relevant conflicts of interest.
1. Horwitz L, Partovian C, Lin Z, et al. Hospital-Wide (All-Condition) 30‐Day Risk-Standardized Readmission Measure. https://www.cms.gov/Medicare/Quality-Initiatives-Patient-Assessment-Instruments/MMS/downloads/MMSHospital-WideAll-ConditionReadmissionRate.pdf. Accessed March 6, 2015.
2. Medicine SoH. Measuring Hospitalist Performance: Metrics, Reports, and Dashboards. 2007; https://www.hospitalmedicine.org/Web/Practice_Management/Products_and_Programs/measure_hosp_perf_metrics_reports_dashboards.aspx. Accessed May 12, 2013.
3. Teleki SS, Shaw R, Damberg CL, McGlynn EA. Providing performance feedback to individual physicians: current practice and emerging lessons. Santa Monica, CA: RAND Corporation; 2006. 1-47. https://www.rand.org/content/dam/rand/pubs/working_papers/2006/RAND_WR381.pdf. Accessed August, 2017.
4. Brehaut JC, Colquhoun HL, Eva KW, et al. Practice Feedback Interventions: 15 Suggestions for Optimizing Effectiveness Practice Feedback Interventions. Ann Intern Med. 2016;164(6):435-441. PubMed
5. Dowding D, Randell R, Gardner P, et al. Dashboards for improving patient care: review of the literature. Int J Med Inform. 2015;84(2):87-100. PubMed
6. Landon BE, Normand S-LT, Blumenthal D, Daley J. Physician clinical performance assessment: prospects and barriers. JAMA. 2003;290(9):1183-1189. PubMed
7. Guyatt GH, Akl EA, Crowther M, Gutterman DD, Schuünemann HJ. Executive summary: Antit hrombotic therapy and prevention of thrombosis, 9th ed: American College of Chest Physicians evidence-based clinical practice guidelines. Ann Intern Med. 2012;141(2 suppl):7S-47S. PubMed
8. Siddiqui Z, Qayyum R, Bertram A, et al. Does Provider Self-reporting of Etiquette Behaviors Improve Patient Experience? A Randomized Controlled Trial. J Hosp Med. 2017;12(6):402-406. PubMed
9. Oduyebo I, Lehmann CU, Pollack CE, et al. Association of self-reported hospital discharge handoffs with 30-day readmissions. JAMA Intern Med. 2013;173(8):624-629. PubMed
Hospitalists’ performance is routinely evaluated by third-party payers, employers, and patients. As hospitalist programs mature, there is a need to develop processes to identify, internally measure, and report on individual and group performance. We know from Society of Hospital Medicine (SHM) data that a significant amount of hospitalists’ total compensation is at least partially based on performance. Often this is based at least in part on quality data. In 2006, SHM issued a white paper detailing the key elements of a successful performance monitoring and reporting process.1,2 Recommendations included the identification of meaningful operational and clinical performance metrics, and the ability to monitor and report both group and individual metrics was highlighted as an essential component. There is evidence that comparison of individual provider performance with that of their peers is a necessary element of successful provider dashboards.3 Additionally, regular feedback and a clear, visual presentation of the data are important components of successful provider feedback dashboards.3-6
Much of the literature regarding provider feedback dashboards has been based in the outpatient setting. The majority of these dashboards focus on the management of chronic illnesses (eg, diabetes and hypertension), rates of preventative care services (eg, colonoscopy or mammogram), or avoidance of unnecessary care (eg, antibiotics for sinusitis).4,5 Unlike in the outpatient setting, in which 1 provider often provides a majority of the care for a given episode of care, hospitalized patients are often cared for by multiple providers, challenging the appropriate attribution of patient-level metrics to specific providers. Under the standard approach, an entire hospitalization is attributed to 1 physician, generally the attending of record for the hospitalization, which may be the admitting provider or the discharging provider, depending on the approach used by the hospital. However, assigning responsibility for an entire hospitalization to a provider who may have only seen the patient for a small percentage of a hospitalization may jeopardize the validity of metrics. As provider metrics are increasingly being used for compensation, it is important to ensure that the method for attribution correctly identifies the providers caring for patients. To our knowledge there is no gold standard approach for attributing metrics to providers when patients are cared for by multiple providers, and the standard attending of record–based approach may lack face validity in many cases.
We aimed to develop and operationalize a system to more fairly attribute patient-level data to individual providers across a single hospitalization even when multiple providers cared for the patient. We then compared our methodology to the standard approach, in which the attending of record receives full attribution for each metric, to determine the difference on a provider level between the 2 models.
METHODS
Clinical Setting
The Johns Hopkins Hospital is a 1145-bed, tertiary-care hospital. Over the years of this project, the Johns Hopkins Hospitalist Program was an approximately 20-physician group providing care in a variety of settings, including a dedicated hospitalist floor, where this metrics program was initiated. Hospitalists in this setting work Monday through Friday, with 1 hospitalist and a moonlighter covering on the weekends. Admissions are performed by an admitter, and overnight care is provided by a nocturnist. Initially 17 beds, this unit expanded to 24 beds in June 2012. For the purposes of this article, we included all general medicine patients admitted to this floor between July 1, 2010, and June 30, 2014, who were cared for by hospitalists. During this period, all patients were inpatients; no patients were admitted under observation status. All of these patients were cared for by hospitalists without housestaff or advanced practitioners. Since 2014, the metrics program has been expanded to other hospitalist-run services in the hospital, but for simplicity, we have not presented these more recent data.
Individual Provider Metrics
Metrics were chosen to reflect institutional quality and efficiency priorities. Our choice of metrics was restricted to those that (1) plausibly reflect provider performance, at least in part, and (2) could be accessed in electronic form (without any manual chart review). Whenever possible, we chose metrics with objective data. Additionally, because funding for this effort was provided by the hospital, we sought to ensure that enough of the metrics were related to cost to justify ongoing hospital support of the project. SAS 9.2 (SAS Institute Inc, Cary, NC) was used to calculate metric weights. Specific metrics included American College of Chest Physicians (ACCP)–compliant venous thromboembolism (VTE) prophylaxis,7 observed-to-expected length of stay (LOS) ratio, percentage of discharges per day, discharges before 3
Appropriate prophylaxis for VTE was calculated by using an algorithm embedded within the computerized provider order entry system, which assessed the prescription of ACCP-compliant VTE prophylaxis within 24 hours following admission. This included a risk assessment, and credit was given for no prophylaxis and/or mechanical and/or pharmacologic prophylaxis per the ACCP guidelines.7
Observed-to-expected LOS was defined by using the University HealthSystem Consortium (UHC; now Vizient Inc) expected LOS for the given calendar year. This approach incorporates patient diagnoses, demographics, and other administrative variables to define an expected LOS for each patient.
The percent of patients discharged per day was defined from billing data as the percentage of a provider’s evaluation and management charges that were the final charge of a patient’s stay (regardless of whether a discharge day service was coded).
Discharge prior to 3
Depth of coding was defined as the number of coded diagnoses submitted to the Maryland Health Services Cost Review Commission for determining payment and was viewed as an indicator of the thoroughness of provider documentation.
Patient satisfaction was defined at the patient level (for those patients who turned in patient satisfaction surveys) as the pooled value of the 5 provider questions on the hospital’s patient satisfaction survey administered by Press Ganey: “time the physician spent with you,” “did the physician show concern for your questions/worries,” “did the physician keep you informed,” “friendliness/courtesy of the physician,” and “skill of the physician.”8
Readmission rates were defined as same-hospital readmissions divided by the total number of patients discharged by a given provider, with exclusions based on the Centers for Medicare and Medicaid Services hospital-wide, all-cause readmission measure.1 The expected same-hospital readmission rate was defined for each patient as the observed readmission rate in the entire UHC (Vizient) data set for all patients with the same All Patient Refined Diagnosis Related Group and severity of illness, as we have described previously.9
Communication with the primary care provider was the only self-reported metric used. It was based on a mandatory prompt on the discharge worksheet in the electronic medical record (EMR). Successful communication with the outpatient provider was defined as verbal or electronic communication by the hospitalist with the outpatient provider. Partial (50%) credit was given for providers who attempted but were unsuccessful in communicating with the outpatient provider, for patients for whom the provider had access to the Johns Hopkins EMR system, and for planned admissions without new or important information to convey. No credit was given for providers who indicated that communication was not indicated, who indicated that a patient and/or family would update the provider, or who indicated that the discharge summary would be sufficient.9 Because the discharge worksheet could be initiated at any time during the hospitalization, providers could document communication with the outpatient provider at any point during hospitalization.
Discharge summary turnaround was defined as the average number of days elapsed between the day of discharge and the signing of the discharge summary in the EMR.
Assigning Ownership of Patients to Individual Providers
Using billing data, we assigned ownership of patient care based on the type, timing, and number of charges that occurred during each hospitalization (Figure 1). Eligible charges included all history and physical (codes 99221, 99222, and 99223), subsequent care (codes 99231, 99232, and 99233), and discharge charges (codes 99238 and 99239).
By using a unique identifier assigned for each hospitalization, professional fees submitted by providers were used to identify which provider saw the patient on the admission day, discharge day, as well as subsequent care days. Providers’ productivity, bonus supplements, and policy compliance were determined by using billing data, which encouraged the prompt submittal of charges.
The provider who billed the admission history and physical (codes 99221, 99222, and 99223) within 1 calendar date of the patient’s initial admission was defined as the admitting provider. Patients transferred to the hospitalist service from other services were not assigned an admitting hospitalist. The sole metric assigned to the admitting hospitalist was ACCP-compliant VTE prophylaxis.
The provider who billed the final subsequent care or discharge code (codes 99231, 99232, 99233, 99238, and 99239) within 1 calendar date of discharge was defined as the discharging provider. For hospitalizations characterized by a single provider charge (eg, for patients admitted and discharged on the same day), the provider billing this charge was assigned as both the admitting and discharging physician. Patients upgraded to the intensive care unit (ICU) were not counted as a discharge unless the patient was downgraded and discharged from the hospitalist service. The discharging provider was assigned responsibility for the time of discharge, the percent of patients discharged per day, the discharge summary turnaround time, and hospital readmissions.
Metrics that were assigned to multiple providers for a single hospitalization were termed “provider day–weighted” metrics. The formula for calculating the weight for each provider day–weighted metric was as follows: weight for provider A = [number of daily charges billed by provider A] divided by [LOS +1]. The initial hospital day was counted as day 0. LOS plus 1 was used to recognize that a typical hospitalization will have a charge on the day of admission (day 0) and a charge on the day of discharge such that an LOS of 2 days (eg, a patient admitted on Monday and discharged on Wednesday) will have 3 daily charges. Provider day–weighted metrics included patient satisfaction, communication with the outpatient provider, depth of coding, and observed-to-expected LOS.
Our billing software prevented providers from the same group from billing multiple daily charges, thus ensuring that there were no duplicated charges submitted for a given day.
Presenting Results
Providers were only shown data from the day-weighted approach. For ease of visual interpretation, scores for each metric were scaled ordinally from 1 (worst performance) to 9 (best performance; Table 1). Data were displayed in a dashboard format on a password-protected website for each provider to view his or her own data relative to that of the hospitalist peer group. The dashboard was implemented in this format on July 1, 2011. Data were updated quarterly (Figure 2).
Results were displayed in a polyhedral or spider-web graph (Figure 2). Provider and group metrics were scaled according to predefined benchmarks established for each metric and standardized to a scale ranging from 1 to 9. The scale for each metric was set based on examining historical data and group median performance on the metrics to ensure that there was a range of performance (ie, to avoid having most hospitalists scoring a 1 or 9). Scaling thresholds were periodically adjusted as appropriate to maintain good visual discrimination. Higher scores (creating a larger-volume polygon) are desirable even for metrics such as LOS, for which a low value is desirable. Both a spider-web graph and trends over time were available to the provider (Figure 2). These graphs display a comparison of the individual provider scores for each metric to the hospitalist group average for that metric.
Comparison with the Standard (Attending of Record) Method of Attribution
For the purposes of this report, we sought to determine whether there were meaningful differences between our day-weighted approach versus the standard method of attribution, in which the attending of record is assigned responsibility for each metric that would not have been attributed to the discharging attending under both methods. Our goal was to determine where and whether there was a meaningful difference between the 2 methodologies, recognizing that the degree of difference between these 2 methodologies might vary in other institutions and settings. In our hospital, the attending of record is generally the discharging attending. In order to compare the 2 methodologies, we arbitrarily picked 2015 to retrospectively evaluate the differences between these 2 methods of attribution. We did not display or provide data using the standard methodology to providers at any point; this approach was used only for the purposes of this report. Because these metrics are intended to evaluate relative provider performance, we assigned a percentile to each provider for his or her performance on the given metric using our attribution methodology and then, similarly, assigned a percentile to each provider using the standard methodology. This yielded 2 percentile scores for each provider and each metric. We then compared these percentile ranks for providers in 2 ways: (1) we determined how often providers who scored in the top half of the group for a given metric (above the 50th percentile) also scored in the top half of the group for that metric by using the other calculation method, and (2) we calculated the absolute value of the difference in percentiles between the 2 methods to characterize the impact on a provider’s ranking for that metric that might result from switching to the other method. For instance, if a provider scored at the 20th percentile for the group in patient satisfaction with 1 attribution method and scored at the 40th percentile for the group in patient satisfaction using the other method, the absolute change in percentile would be 20 percentile points. But, this provider would still be below the 50th percentile by both methods (concordant bottom half performance). We did not perform this comparison for metrics assigned to the discharging provider (such as discharge summary turnaround time or readmissions) because the attending of record designation is assigned to the discharging provider at our hospital.
RESULTS
The dashboard was successfully operationalized on July 1, 2011, with displays visible to providers as shown in Figure 2. Consistent with the principles of providing effective performance feedback to providers, the display simultaneously showed providers their individual performance as well as the performance of their peers. Providers were able to view their spider-web plot for prior quarters. Not shown are additional views that allowed providers to see quarterly trends in their data versus their peers across several fiscal years. Also available to providers was their ranking relative to their peers for each metric; specific peers were deidentified in the display.
There was notable discordance between provider rankings between the 2 methodologies, as shown in Table 2. Provider performance above or below the median was concordant 56% to 75% of the time (depending on the particular metric), indicating substantial discordance because top-half or bottom-half concordance would be expected to occur by chance 50% of the time. Although the provider percentile differences between the 2 methods tended to be modest for most providers (the median difference between the methods was 13 to 22 percentile points for the various metrics), there were some providers for whom the method of calculation dramatically impacted their rankings. For 5 of the 6 metrics we examined, at least 1 provider had a 50-percentile or greater change in his or her ranking based on the method used. This indicates that at least some providers would have had markedly different scores relative to their peers had we used the alternative methodology (Table 2). In VTE prophylaxis, for example, at least 1 provider had a 94-percentile change in his or her ranking; similarly, a provider had an 88-perentile change in his or her LOS ranking between the 2 methodologies.
DISCUSSION
We found that it is possible to assign metrics across 1 hospital stay to multiple providers by using billing data. We also found a meaningful discrepancy in how well providers scored (relative to their peers) based on the method used for attribution. These results imply that hospitals should consider attributing performance metrics based on ascribed ownership from billing data and not just from attending of record status.
As hospitalist programs and providers in general are increasingly being asked to develop dashboards to monitor individual and group performance, correctly attributing care to providers is likely to become increasingly important. Experts agree that principles of effective provider performance dashboards include ranking individual provider performance relative to peers, clearly displaying data in an easily accessible format, and ensuring that data can be credibly attributed to the individual provider.3,4,6 However, there appears to be no gold standard method for attribution, especially in the inpatient setting. Our results imply that hospitals should consider attributing performance metrics based on ascribed ownership from billing data and not just from attending of record status.
Several limitations of our findings are important to consider. First, our program is a relatively small, academic group with handoffs that typically occur every 1 to 2 weeks and sometimes with additional handoffs on weekends. Different care patterns and settings might impact the utility of our attribution methodology relative to the standard methodology. Additionally, it is important to note that the relative merits of the different methodologies cannot be ascertained from our comparison. We can demonstrate discordance between the attribution methodologies, but we cannot say that 1 method is correct and the other is flawed. Although we believe that our day-weighted approach feels fairer to providers based on group input and feedback, we did not conduct a formal survey to examine providers’ preferences for the standard versus day-weighted approaches. The appropriateness of a particular attribution method needs to be assessed locally and may vary based on the clinical setting. For instance, on a service in which patients are admitted for procedures, it may make more sense to attribute the outcome of the case to the proceduralist even if that provider did not bill for the patient’s care on a daily basis. Finally, the computational requirements of our methodology are not trivial and require linking billing data with administrative patient-level data, which may be challenging to operationalize in some institutions.
These limitations aside, we believe that our attribution methodology has face validity. For example, a provider might be justifiably frustrated if, using the standard methodology, he or she is charged with the LOS of a patient who had been hospitalized for months, particularly if that patient is discharged shortly after the provider assumes care. Our method addresses this type of misattribution. Particularly when individual provider compensation is based on performance on metrics (as is the case at our institution), optimizing provider attribution to particular patients may be important, and face validity may be required for group buy-in.
In summary, we have demonstrated that it is possible to use billing data to assign ownership of patients to multiple providers over 1 hospital stay. This could be applied to other hospitalist programs as well as other healthcare settings in which multiple providers care for patients during 1 healthcare encounter (eg, ICUs).
Disclosure
The authors declare they have no relevant conflicts of interest.
1. Horwitz L, Partovian C, Lin Z, et al. Hospital-Wide (All-Condition) 30‐Day Risk-Standardized Readmission Measure. https://www.cms.gov/Medicare/Quality-Initiatives-Patient-Assessment-Instruments/MMS/downloads/MMSHospital-WideAll-ConditionReadmissionRate.pdf. Accessed March 6, 2015.
2. Medicine SoH. Measuring Hospitalist Performance: Metrics, Reports, and Dashboards. 2007; https://www.hospitalmedicine.org/Web/Practice_Management/Products_and_Programs/measure_hosp_perf_metrics_reports_dashboards.aspx. Accessed May 12, 2013.
3. Teleki SS, Shaw R, Damberg CL, McGlynn EA. Providing performance feedback to individual physicians: current practice and emerging lessons. Santa Monica, CA: RAND Corporation; 2006. 1-47. https://www.rand.org/content/dam/rand/pubs/working_papers/2006/RAND_WR381.pdf. Accessed August, 2017.
4. Brehaut JC, Colquhoun HL, Eva KW, et al. Practice Feedback Interventions: 15 Suggestions for Optimizing Effectiveness Practice Feedback Interventions. Ann Intern Med. 2016;164(6):435-441. PubMed
5. Dowding D, Randell R, Gardner P, et al. Dashboards for improving patient care: review of the literature. Int J Med Inform. 2015;84(2):87-100. PubMed
6. Landon BE, Normand S-LT, Blumenthal D, Daley J. Physician clinical performance assessment: prospects and barriers. JAMA. 2003;290(9):1183-1189. PubMed
7. Guyatt GH, Akl EA, Crowther M, Gutterman DD, Schuünemann HJ. Executive summary: Antit hrombotic therapy and prevention of thrombosis, 9th ed: American College of Chest Physicians evidence-based clinical practice guidelines. Ann Intern Med. 2012;141(2 suppl):7S-47S. PubMed
8. Siddiqui Z, Qayyum R, Bertram A, et al. Does Provider Self-reporting of Etiquette Behaviors Improve Patient Experience? A Randomized Controlled Trial. J Hosp Med. 2017;12(6):402-406. PubMed
9. Oduyebo I, Lehmann CU, Pollack CE, et al. Association of self-reported hospital discharge handoffs with 30-day readmissions. JAMA Intern Med. 2013;173(8):624-629. PubMed
© 2017 Society of Hospital Medicine
Readmission Rates and Mortality Measures
The Centers for Medicare & Medicaid Services (CMS) have sought to reduce readmissions in the 30 days following hospital discharge through penalties applied to hospitals with readmission rates that are higher than expected. Expected readmission rates for Medicare fee‐for‐service beneficiaries are calculated from models that use patient‐level administrative data to account for patient morbidities. Readmitted patients are defined as those who are discharged from the hospital alive and then rehospitalized at any acute care facility within 30 days of discharge. These models explicitly exclude sociodemographic variables that may impact quality of and access to outpatient care. Specific exclusions are also applied based on diagnosis codes so as to avoid penalizing hospitals for rehospitalizations that are likely to have been planned.
More recently, a hospital‐wide readmission measure has been developed, which seeks to provide a comprehensive view of each hospital's readmission rate by including the vast majority of Medicare patients. Like the condition‐specific readmission measures, the hospital‐wide readmission measure also excludes sociodemographic variables and incorporates specific condition‐based exclusions so as to avoid counting planned rehospitalizations (e.g., an admission for cholecystectomy following an admission for biliary sepsis). Although not currently used for pay‐for‐performance, this measure has been included in the CMS Star Report along with other readmission measures.[1] CMS does not currently disseminate a hospital‐wide mortality measure, but does disseminate hospital‐level adjusted 30‐day mortality rates for Medicare beneficiaries with discharge diagnoses of stroke, heart failure, myocardial infarction (MI), chronic obstructive pulmonary disease (COPD) and pneumonia, and principal procedure of coronary artery bypass grafting (CABG).
It is conceivable that aggressive efforts to reduce readmissions might delay life‐saving acute care in some scenarios,[2] and there is prior evidence that heart failure readmissions are inversely (but weakly) related to heart failure mortality.[3] It is also plausible that keeping tenuous patients alive until discharge might result in higher readmission rates. We sought to examine the relationship between hospital‐wide adjusted 30‐day readmissions and death rates across the acute care hospitals in the United States. Lacking a measure of hospital‐wide death rates, we examined the relation between hospital‐wide readmissions and each of the 6 condition‐specific mortality measures. For comparison, we also examined the relationships between condition‐specific readmission rates and mortality rates.
METHODS
We used publically available data published by CMS from July 1, 2011 through June 30, 2014.[4] These data are provided at the hospital level, without any patient‐level data. We included 4452 acute care facilities based on having hospital‐wide readmission rates, but not all facilities contributed data for each mortality measure. We excluded from analysis on a measure‐by‐measure basis those facilities for which outcomes were absent, without imputing missing outcome measures, because low volume of a given condition was the main reason for not reporting a measure. For each mortality measure, we constructed a logistic regression model to quantify the odds of performing in the lowest (best) mortality tertile as a function of hospital‐wide readmission tertile. To account for patient volumes, we included in each model the number of eligible patients at each hospital with the specified condition. We repeated these analyses using condition‐specific readmission rates (rather than the hospital‐wide readmission rates) as the independent variable. Specifications for CMS models for mortality and readmissions are publically available.[5]
RESULTS
After adjustment for patient volumes, hospitals in the highest hospital‐wide readmission tertile were more likely to perform in the lowest (best) mortality tertile for 3 of the 6 mortality measures: heart failure, COPD, and stroke (P < 0.001 for all). For MI, CABG and pneumonia, there was no significant association between high hospital‐wide readmission rates and low mortality (Table 1). Using condition‐specific readmission rates, there remained an inverse association between readmissions and mortality for heart failure and stroke, but not for COPD. In contrast, hospitals with the highest CABG‐specific readmission rates were significantly less likely to have low CABG‐specific mortality (P < 0.001).
| Hospital‐Wide Readmission Rate Tertile [Range of Adjusted Readmission Rates, %]* | |||
|---|---|---|---|
|
1st Tertile, n = 1359 [11.3%‐14.8%], Adjusted Odds Ratio (95% CI) |
2nd Tertile, n = 1785 [14.9%‐15.5%], Adjusted Odds Ratio (95% CI) |
3rd Tertile, n = 1308 [15.6%‐19.8%], Adjusted Odds Ratio (95% CI) |
|
| |||
| Mortality measure (no. of hospitals reporting) | |||
| Acute myocardial infarction (n = 2415) | 1.00 (referent) | 0.88 (0.711.09) | 1.02 (0.831.25) |
| Pneumonia (n = 4067) | 1.00 (referent) | 0.83 (0.710.98) | 1.11 (0.941.31) |
| Heart failure (n = 3668) | 1.00 (referent) | 1.21 (1.021.45) | 1.94 (1.632.30) |
| Stroke (n = 2754) | 1.00 (referent) | 1.13 (0.931.38) | 1.48 (1.221.79) |
| Chronic obstructive pulmonary disease (n = 3633) | 1.00 (referent) | 1.12 (0.951.33) | 1.73 (1.462.05) |
| Coronary artery bypass (n = 1058) | 1.00 (referent) | 0.87 (0.631.19) | 0.99 (0.741.34) |
| Condition‐specific readmission rate tertile | |||
| Mortality measure | |||
| Acute myocardial infarction | 1.00 (referent) | 0.88 (0.711.08) | 0.79 (0.640.99) |
| Pneumonia | 1.00 (referent) | 0.91 (0.781.07) | 0.89 (0.761.04) |
| Heart failure | 1.00 (referent) | 1.15 (0.961.36) | 1.56 (1.311.86) |
| Stroke | 1.00 (referent) | 1.65 (1.342.03) | 1.70 (1.232.35) |
| Chronic obstructive pulmonary disease | 1.00 (referent) | 0.83 (0.700.98) | 0.84 (0.710.99) |
| Coronary artery bypass | 1.00 (referent) | 0.59 (0.440.80) | 0.47 (0.340.64) |
DISCUSSION
We found that higher hospital‐wide readmission rates were associated with lower mortality at the hospital level for 3 of the 6 mortality measures we examined. The findings for heart failure parallel the findings of Krumholz and colleagues who examined 3 of these 6 measures (MI, pneumonia, and heart failure) in relation to readmissions for these specific populations.[3] This prior analysis, however, did not include the 3 more recently reported mortality measures (COPD, stroke, and CABG) and did not use hospital‐wide readmissions.
Causal mechanisms underlying the associations between mortality and readmission at the hospital level deserve further exploration. It is certainly possible that global efforts to keep patients out of the hospital might, in some instances, place patients at risk by delaying necessary acute care.[2] It is also possible that unmeasured variables, particularly access to hospice and palliative care services that might facilitate good deaths, could be associated with both reduced readmissions and higher death rates. Additionally, because deceased patients cannot be readmitted, one might expect that readmissions and mortality might be inversely associated, particularly for conditions with a high postdischarge mortality rate. Similarly, a hospital that does a particularly good job keeping chronically ill patients alive until discharge might exhibit a higher readmission rate than a hospital that is less adept at keeping tenuous patients alive until discharge.
Regardless of the mechanisms of these findings, we present these data to raise the concern that using readmission rates, particularly hospital‐wide readmission rates, as a measure of hospital quality is inherently problematic. It is particularly problematic that CMS has applied equal weight to readmissions and mortality in the Star Report.[1] High readmission rates may result from complications and poor handoffs, but may also stem from the legitimate need to care for chronically ill patients in a high‐intensity setting, particularly fragile patients who have been kept alive against the odds. In conclusion, caution is warranted in viewing readmissions as a quality metric until the associations we describe are better explained using patient‐level data and more robust adjustment than is possible with these publically available data.
Disclosures: Dr. Daniel J. Brotman had full access to the data in the study and takes responsibility for the integrity of the data and the accuracy of the data analysis. There was no financial support for this work. Contributions of the authors are as follows: drafting manuscript (Brotman), revision of manuscript for important intellectual content (brotman, Hoyer, Lepley, Deutschendorf, Leung), acquisition of data (Deutschendorf, Leung, Lepley), interpretation of data (Brotman, Hoyer, Lepley, Deutschendorf, Leung), data analysis (Brotman, Hoyer).
- Centers for Medicare and Medicaid Services. Available at: https://www.cms.gov/Outreach-and-Education/Outreach/NPC/Downloads/2015-08-13-Star-Ratings-Presentation.pdf. Accessed September 2015.
- , , , et al. A comprehensive care management program to prevent chronic obstructive pulmonary disease hospitalizations: a randomized, controlled trial. Ann Intern Med. 2012;156(10):673–683.
- , , , et al. Relationship between hospital readmission and mortality rates for patients hospitalized with acute myocardial infarction, heart failure, or pneumonia. JAMA. 2013;309(6):587–593.
- Centers for Medicare and Medicaid Services. Hospital compare datasets. Available at: https://data.medicare.gov/data/hospital‐compare. Accessed September 2015.
- Centers for Medicare and Medicaid Services. Hospital quality initiative. Available at: https://www.cms.gov/Medicare/Quality‐Initiatives‐Patient‐Assessment‐Instruments/HospitalQualityInits. Accessed September 2015.
The Centers for Medicare & Medicaid Services (CMS) have sought to reduce readmissions in the 30 days following hospital discharge through penalties applied to hospitals with readmission rates that are higher than expected. Expected readmission rates for Medicare fee‐for‐service beneficiaries are calculated from models that use patient‐level administrative data to account for patient morbidities. Readmitted patients are defined as those who are discharged from the hospital alive and then rehospitalized at any acute care facility within 30 days of discharge. These models explicitly exclude sociodemographic variables that may impact quality of and access to outpatient care. Specific exclusions are also applied based on diagnosis codes so as to avoid penalizing hospitals for rehospitalizations that are likely to have been planned.
More recently, a hospital‐wide readmission measure has been developed, which seeks to provide a comprehensive view of each hospital's readmission rate by including the vast majority of Medicare patients. Like the condition‐specific readmission measures, the hospital‐wide readmission measure also excludes sociodemographic variables and incorporates specific condition‐based exclusions so as to avoid counting planned rehospitalizations (e.g., an admission for cholecystectomy following an admission for biliary sepsis). Although not currently used for pay‐for‐performance, this measure has been included in the CMS Star Report along with other readmission measures.[1] CMS does not currently disseminate a hospital‐wide mortality measure, but does disseminate hospital‐level adjusted 30‐day mortality rates for Medicare beneficiaries with discharge diagnoses of stroke, heart failure, myocardial infarction (MI), chronic obstructive pulmonary disease (COPD) and pneumonia, and principal procedure of coronary artery bypass grafting (CABG).
It is conceivable that aggressive efforts to reduce readmissions might delay life‐saving acute care in some scenarios,[2] and there is prior evidence that heart failure readmissions are inversely (but weakly) related to heart failure mortality.[3] It is also plausible that keeping tenuous patients alive until discharge might result in higher readmission rates. We sought to examine the relationship between hospital‐wide adjusted 30‐day readmissions and death rates across the acute care hospitals in the United States. Lacking a measure of hospital‐wide death rates, we examined the relation between hospital‐wide readmissions and each of the 6 condition‐specific mortality measures. For comparison, we also examined the relationships between condition‐specific readmission rates and mortality rates.
METHODS
We used publically available data published by CMS from July 1, 2011 through June 30, 2014.[4] These data are provided at the hospital level, without any patient‐level data. We included 4452 acute care facilities based on having hospital‐wide readmission rates, but not all facilities contributed data for each mortality measure. We excluded from analysis on a measure‐by‐measure basis those facilities for which outcomes were absent, without imputing missing outcome measures, because low volume of a given condition was the main reason for not reporting a measure. For each mortality measure, we constructed a logistic regression model to quantify the odds of performing in the lowest (best) mortality tertile as a function of hospital‐wide readmission tertile. To account for patient volumes, we included in each model the number of eligible patients at each hospital with the specified condition. We repeated these analyses using condition‐specific readmission rates (rather than the hospital‐wide readmission rates) as the independent variable. Specifications for CMS models for mortality and readmissions are publically available.[5]
RESULTS
After adjustment for patient volumes, hospitals in the highest hospital‐wide readmission tertile were more likely to perform in the lowest (best) mortality tertile for 3 of the 6 mortality measures: heart failure, COPD, and stroke (P < 0.001 for all). For MI, CABG and pneumonia, there was no significant association between high hospital‐wide readmission rates and low mortality (Table 1). Using condition‐specific readmission rates, there remained an inverse association between readmissions and mortality for heart failure and stroke, but not for COPD. In contrast, hospitals with the highest CABG‐specific readmission rates were significantly less likely to have low CABG‐specific mortality (P < 0.001).
| Hospital‐Wide Readmission Rate Tertile [Range of Adjusted Readmission Rates, %]* | |||
|---|---|---|---|
|
1st Tertile, n = 1359 [11.3%‐14.8%], Adjusted Odds Ratio (95% CI) |
2nd Tertile, n = 1785 [14.9%‐15.5%], Adjusted Odds Ratio (95% CI) |
3rd Tertile, n = 1308 [15.6%‐19.8%], Adjusted Odds Ratio (95% CI) |
|
| |||
| Mortality measure (no. of hospitals reporting) | |||
| Acute myocardial infarction (n = 2415) | 1.00 (referent) | 0.88 (0.711.09) | 1.02 (0.831.25) |
| Pneumonia (n = 4067) | 1.00 (referent) | 0.83 (0.710.98) | 1.11 (0.941.31) |
| Heart failure (n = 3668) | 1.00 (referent) | 1.21 (1.021.45) | 1.94 (1.632.30) |
| Stroke (n = 2754) | 1.00 (referent) | 1.13 (0.931.38) | 1.48 (1.221.79) |
| Chronic obstructive pulmonary disease (n = 3633) | 1.00 (referent) | 1.12 (0.951.33) | 1.73 (1.462.05) |
| Coronary artery bypass (n = 1058) | 1.00 (referent) | 0.87 (0.631.19) | 0.99 (0.741.34) |
| Condition‐specific readmission rate tertile | |||
| Mortality measure | |||
| Acute myocardial infarction | 1.00 (referent) | 0.88 (0.711.08) | 0.79 (0.640.99) |
| Pneumonia | 1.00 (referent) | 0.91 (0.781.07) | 0.89 (0.761.04) |
| Heart failure | 1.00 (referent) | 1.15 (0.961.36) | 1.56 (1.311.86) |
| Stroke | 1.00 (referent) | 1.65 (1.342.03) | 1.70 (1.232.35) |
| Chronic obstructive pulmonary disease | 1.00 (referent) | 0.83 (0.700.98) | 0.84 (0.710.99) |
| Coronary artery bypass | 1.00 (referent) | 0.59 (0.440.80) | 0.47 (0.340.64) |
DISCUSSION
We found that higher hospital‐wide readmission rates were associated with lower mortality at the hospital level for 3 of the 6 mortality measures we examined. The findings for heart failure parallel the findings of Krumholz and colleagues who examined 3 of these 6 measures (MI, pneumonia, and heart failure) in relation to readmissions for these specific populations.[3] This prior analysis, however, did not include the 3 more recently reported mortality measures (COPD, stroke, and CABG) and did not use hospital‐wide readmissions.
Causal mechanisms underlying the associations between mortality and readmission at the hospital level deserve further exploration. It is certainly possible that global efforts to keep patients out of the hospital might, in some instances, place patients at risk by delaying necessary acute care.[2] It is also possible that unmeasured variables, particularly access to hospice and palliative care services that might facilitate good deaths, could be associated with both reduced readmissions and higher death rates. Additionally, because deceased patients cannot be readmitted, one might expect that readmissions and mortality might be inversely associated, particularly for conditions with a high postdischarge mortality rate. Similarly, a hospital that does a particularly good job keeping chronically ill patients alive until discharge might exhibit a higher readmission rate than a hospital that is less adept at keeping tenuous patients alive until discharge.
Regardless of the mechanisms of these findings, we present these data to raise the concern that using readmission rates, particularly hospital‐wide readmission rates, as a measure of hospital quality is inherently problematic. It is particularly problematic that CMS has applied equal weight to readmissions and mortality in the Star Report.[1] High readmission rates may result from complications and poor handoffs, but may also stem from the legitimate need to care for chronically ill patients in a high‐intensity setting, particularly fragile patients who have been kept alive against the odds. In conclusion, caution is warranted in viewing readmissions as a quality metric until the associations we describe are better explained using patient‐level data and more robust adjustment than is possible with these publically available data.
Disclosures: Dr. Daniel J. Brotman had full access to the data in the study and takes responsibility for the integrity of the data and the accuracy of the data analysis. There was no financial support for this work. Contributions of the authors are as follows: drafting manuscript (Brotman), revision of manuscript for important intellectual content (brotman, Hoyer, Lepley, Deutschendorf, Leung), acquisition of data (Deutschendorf, Leung, Lepley), interpretation of data (Brotman, Hoyer, Lepley, Deutschendorf, Leung), data analysis (Brotman, Hoyer).
- Centers for Medicare and Medicaid Services. Available at: https://www.cms.gov/Outreach-and-Education/Outreach/NPC/Downloads/2015-08-13-Star-Ratings-Presentation.pdf. Accessed September 2015.
- , , , et al. A comprehensive care management program to prevent chronic obstructive pulmonary disease hospitalizations: a randomized, controlled trial. Ann Intern Med. 2012;156(10):673–683.
- , , , et al. Relationship between hospital readmission and mortality rates for patients hospitalized with acute myocardial infarction, heart failure, or pneumonia. JAMA. 2013;309(6):587–593.
- Centers for Medicare and Medicaid Services. Hospital compare datasets. Available at: https://data.medicare.gov/data/hospital‐compare. Accessed September 2015.
- Centers for Medicare and Medicaid Services. Hospital quality initiative. Available at: https://www.cms.gov/Medicare/Quality‐Initiatives‐Patient‐Assessment‐Instruments/HospitalQualityInits. Accessed September 2015.
Discharge Summaries and Readmissions
Across the continuum of care, the discharge summary is a critical tool for communication among care providers.[1] In the United States, the Joint Commission policies mandate that all hospital providers complete a discharge summary for patients with specific components to foster effective communication with future providers.[2] Because outpatient providers and emergency physicians rely on clinical information in the discharge summary to ensure appropriate postdischarge continuity of care, timely documentation is potentially an essential aspect of readmission reduction initiatives.[3, 4, 5] Prior reports indicate that poor discharge documentation of follow‐up plan‐of‐care increases the risk of hospitalization, whereas structured instructions, patient education, and direct communications with primary care physicians (PCPs) reduce repeat hospital visits.[6, 7, 8, 9] However, the current literature is limited in its narrow focus on the contents of discharge summaries, considered only same‐hospital readmissions, or considered readmissions within 3 months of discharge.[10, 11, 12, 13] Moreover, some prior research has suggested no association between discharge summary timeliness with readmission,[12, 13, 14] whereas another study did find a relationship,[15] hence the need to study this further is important. Filling this gap in knowledge could provide an avenue to track and improve quality of patient care, as delays in discharge summaries have been linked with pot‐discharge adverse outcomes and patient safety concerns.[15, 16, 17, 18] Because readmissions often occur soon after discharge, having timely discharge summaries may be particularly important to outcomes.[19, 20]
This research began under the framework of evaluating a bundle of care coordination strategies that were implemented at the Johns Hopkins Health System. These strategies were informed by the early Centers for Medicare and Medicaid Services (CMS) demonstration projects and other best practices that have been documented in the literature to improve utilization and improve communication during transitions of care.[21, 22, 23, 24, 25] Later they were augmented through a contract with the Center of Medicare and Medicaid Innovation to improve access to healthcare services and improve patient outcomes through improved care coordination processes. One of the domains our institution has increased efforts to improve is in provider handoffs. Toward that goal, we have worked to disentangle the effects of different factors of provider‐to‐provider communication that may influence readmissions.[26] For example, effective written provider handoffs in the form of accurate and timely discharge summaries was considered a key care coordination component of this program, but there was institutional resistance to endorsing an expectation that discharge summary turnaround should be shortened. To build a case for this concept, we sought to test the hypothesis that, at our hospital, longer time to complete hospital discharge summaries was associated with increased readmission rates. Unique to this analysis is that, in the state of Maryland, there is statewide reporting of readmissions, so we were able to account for intra‐ and interhospital readmissions for an all‐payer population. The authors anticipated that findings from this study would help inform discharge quality‐improvement initiatives and reemphasize the importance of timely discharge documentation across all disciplines as part of quality patient care.
METHODS
Study Population and Setting
We conducted a single‐center, retrospective cohort study of 87,994 consecutive patients discharged from Johns Hopkins Hospital, which is a 1000‐bed, tertiary academic medical center in Baltimore, Maryland between January 1, 2013 and December 31, 2014. One thousand ninety‐three (1.2%) of the records on days to complete the discharge summary were missing and were excluded from the analysis.
Data Source and Covariates
Data were derived from several sources. The Johns Hopkins Hospital data mart financial database, used for mandatory reporting to the State of Maryland, provided the following patient data: age, gender, race/ethnicity, payer (Medicare, Medicaid, and other) as a proxy for socioeconomic status,[27] hospital service prior to discharge (gynecologyobstetrics, medicine, neurosciences, oncology, pediatrics, and surgical sciences), hospital length of stay (LOS) prior to discharge, Agency for Healthcare Research and Quality (AHRQ) Comorbidity Index (which is an update to the original Elixhauser methodology[28]), and all‐payerrefined diagnosis‐related group (APRDRG) and severity of illness (SOI) combinations (a tool to group patients into clinically comparable disease and SOI categories expected to use similar resources and experience similar outcomes). The Health Services Cost Review Commission (HSCRC) in Maryland provided the observed readmission rate in Maryland for each APRDRG‐SOI combination and served as an expected readmission rate. This risk stratification methodology is similar to the approach used in previous studies.[26, 29] Discharge summary turnaround time was obtained from institutional administrative databases used to track compliance with discharge summary completion. Discharge location (home, facility, home with homecare or hospice, or other) was obtained from Curaspan databases (Curaspan Health Group, Inc., Newton, MA).
Primary Outcome: 30‐Day Readmission
The primary outcome was unplanned rehospitalizations to an acute care hospital in Maryland within 30 days of discharge from Johns Hopkins Hospital. This was as defined by the Maryland HSCRC using an algorithm to exclude readmissions that were likely to be scheduled, as defined by the index admission diagnosis and readmission diagnosis; this algorithm is updated based on the CMS all‐cause readmission algorithm.[30, 31]
Primary Exposure: Days to Complete the Discharge Summary
Discharge summary completion time was defined as the date when the discharge attending physician electronically signs the discharge summary. At our institution, an auto‐fax system sends documents (eg, discharge summaries, clinic notes) to linked providers (eg, primary care providers) shortly after midnight from the day the document is signed by an attending physician. During the period of the project, the policy for discharge summaries at the Johns Hopkins Hospital went from requiring them to be completed within 30 days to 14 days, and we were hoping to use our analyses to inform decision makers why this was important. To emphasize the need for timely completion of discharge summaries, we dichotomized the number of days to complete the discharge summary into >3 versus 3 days (20th percentile cutoff) and modeled it as a continuous variable (per 3‐day increase in days to complete the discharge summary).
Statistical Analysis
To evaluate differences in patient characteristics by readmission status, analysis of variance and 2 tests were used for continuous and dichotomous variables, respectively. Logistic regression was used to evaluate the association between days to complete the discharge summary >3 days and readmission status, adjusting for potentially confounding variables. Before inclusion in the logistic regression model, we confirmed a lack of multicollinearity in the multivariable regression model using variance inflation factors. We evaluated residual versus predicted value plots and residual versus fitted value plots with a locally weighted scatterplot smoothing line. In a sensitivity analysis we evaluated the association between readmission status and different cutoffs (>8 days, 50th percentile; and >14 days, 70% percentile). In a separate analysis, we used interaction terms to test whether the association between the association between days to complete the discharge summary >3 days and hospital readmission varied by the covariates in the analysis (age, sex, race, payer, hospital service, discharge location, LOS, APRDRG‐SOI expected readmission rate, and AHRQ Comorbidity Index). We observed a significant interaction between 30‐day readmission and days to complete the discharge summary >3 days by hospital service. Hence, we separately calculated the adjusted mean readmission rates separately for each hospital service using the least squared means method for the multivariable logistic regression analysis and adjusting for the previously mentioned covariates. In a separate analysis, we used linear regression to evaluate the association between LOS and days to complete the discharge summary, adjusting for potentially confounding variables. Statistical significance was defined as a 2‐sided P < 0.05. Data were analyzed with R (version 2.15.0; R Foundation for Statistical Computing, Vienna, Austria;
RESULTS
Readmitted Patients
In the study period, 14,248 out of 87,994 (16.2%) consecutive eligible patients were readmitted to a hospital in Maryland from patients discharged from Johns Hopkins Hospital between January 1, 2013 and December 31, 2014. A total of 11,027 (77.4%) of the readmissions were back to Johns Hopkins Hospital. Table 1 compares characteristics of readmitted versus nonreadmitted patients, with the following variables being significantly different between these patient groups: age, gender, healthcare payer, hospital service, discharge location, length of stay expected readmission rate, AHRQ Comorbidity Index, and days to complete inpatient discharge summary.
| Characteristics | All Patients, N = 87,994 | Not Readmitted, N = 73,746 | Readmitted, N = 14,248 | P Value |
|---|---|---|---|---|
| ||||
| Age, y | 42.1 (25.1) | 41.3 (25.4) | 46.4 (23.1) | <0.001 |
| Male | 43,210 (49.1%) | 35,851 (48.6%) | 7,359 (51.6%) | <0.001 |
| Race | <0.001 | |||
| Caucasian | 45,705 (51.9%) | 3,8661 (52.4%) | 7,044 (49.4%) | |
| African American | 32,777 (37.2%) | 2,6841 (36.4%) | 5,936 (41.7%) | |
| Other | 9,512 (10.8%) | 8,244 (11.2%) | 1,268 (8.9%) | |
| Payer | <0.001 | |||
| Medicare | 22,345 (25.4%) | 17,614 (23.9%) | 4,731 (33.2%) | |
| Medicaid | 24,080 (27.4%) | 20,100 (27.3%) | 3,980 (27.9%) | |
| Other | 41,569 (47.2%) | 36,032 (48.9%) | 5,537 (38.9%) | |
| Hospital service | <0.001 | |||
| Gynecologyobstetrics | 9,299 (10.6%) | 8,829 (12.0%) | 470 (3.3%) | |
| Medicine | 26,036 (29.6%) | 20,069 (27.2%) | 5,967 (41.9%) | |
| Neurosciences | 8,269 (9.4%) | 7,331 (9.9%) | 938 (6.6%) | |
| Oncology | 5,222 (5.9%) | 3,898 (5.3%) | 1,324 (9.3%) | |
| Pediatrics | 17,029 (19.4%) | 14,684 (19.9%) | 2,345 (16.5%) | |
| Surgical sciences | 22,139 (25.2%) | 18,935 (25.7%) | 3,204 (22.5%) | |
| Discharge location | <0.001 | |||
| Home | 65,478 (74.4%) | 56,359 (76.4%) | 9,119 (64.0%) | |
| Home with homecare or hospice | 9,524 (10.8%) | 7,440 (10.1%) | 2,084 (14.6%) | |
| Facility (SNF, rehabilitation facility) | 5,398 (6.1%) | 4,131 (5.6%) | 1,267 (8.9%) | |
| Other | 7,594 (8.6%) | 5,816 (7.9%) | 1,778 (12.5%) | |
| Length of stay, d | 5.5 (8.6) | 5.1 (7.8) | 7.5 (11.6) | <0.001 |
| APRDRG‐SOI Expected Readmission Rate, % | 14.4 (9.5) | 13.3 (9.2) | 20.1 (9.0) | <0.001 |
| AHRQ Comorbidity Index (1 point) | 2.5 (1.4) | 2.4 (1.4) | 3.0 (1.8) | <0.001 |
| Discharge summary completed >3 days | 66,242 (75.3%) | 55,329 (75.0%) | 10,913 (76.6%) | <0.001 |
Association Between Days to Complete the Discharge Summary and Readmission
After hospital discharge, median (IQR) number of days to complete discharge summaries was 8 (416) days. After hospital discharge, median (IQR) number of days to complete discharge summaries and the number of days from discharge to readmission was 8 (416) and 11 (519) days, respectively (P < 0.001). Six thousand one hundred one patients (42.8%) were readmitted before their discharge summary was completed. The median (IQR) days to complete discharge summaries by hospital service in order from shortest to longest was: oncology, 6 (212) days; surgical sciences, 6 (312) days; pediatrics, 7 (315) days; gynecologyobstetrics, 8 (415) days; medicine, 9 (420) days; neurosciences, 12 (621) days.
When we divided the number of days to complete the discharge summary into deciles (02, 2.13, 3.14, 4.16, 6.18, 8.210, 10.114, 14.119, 19.130, >30), a longer number of days to complete discharge summaries had higher unadjusted and adjusted readmission rates (Figure 1). In unadjusted analysis, Table 2 shows that older age, male sex, African American race, oncological versus medicine hospital service, discharge location, longer LOS, higher APRDRG‐SOI expected readmission rate, and higher AHRQ Comorbidity Index were associated with readmission. Days to complete the discharge summary >3 days versus 3 days was associated with a higher readmission rate, with an unadjusted odds ratio (OR) and 95% confidence interval (CI) of 1.09 (95% CI: 1.04 to 1.13, P < 0.001).
| Characteristic | Bivariable Analysis* | Multivariable Analysis* | ||
|---|---|---|---|---|
| OR (95% CI) | P Value | OR (95% CI) | P Value | |
| ||||
| Age, 10 y | 1.09 (1.08 to 1.09) | <0.001 | 0.97 (0.95 to 0.98) | <0.001 |
| Male | 1.13 (1.09 to 1.17) | <0.001 | 1.01 (0.97 to 1.05) | 0.76 |
| Race | ||||
| Caucasian | Referent | Referent | ||
| African American | 1.21 (1.17 to 1.26) | <0.001 | 1.01 (0.96 to 1.05) | 0.74 |
| Other | 0.84 (0.79 to 0.90) | <0.001 | 0.92 (0.86 to 0.98) | 0.01 |
| Payer | ||||
| Medicare | Referent | Referent | ||
| Medicaid | 0.74 (0.70 to 0.77) | <0.001 | 1.03 (0.97 to 1.09) | 0.42 |
| Other | 0.57 (0.55 to 0.60) | <0.001 | 0.86 (0.82 to 0.91) | <0.001 |
| Hospital service | ||||
| Medicine | Referent | Referent | ||
| Gynecologyobstetrics | 0.18 (0.16 to 0.20) | <0.001 | 0.50 (0.45 to 0.56) | <0.001 |
| Neurosciences | 0.43 (0.40 to 0.46) | <0.001 | 0.76 (0.70 to 0.82) | <0.001 |
| Oncology | 1.14 (1.07 to 1.22) | <0.001 | 1.18 (1.10 to 1.28) | <0.001 |
| Pediatrics | 0.54 (0.51 to 0.57) | <0.001 | 0.77 (0.71 to 0.83) | <0.001 |
| Surgical sciences | 0.57 (0.54 to 0.60) | <0.001 | 0.92 (0.87 to 0.97) | 0.002 |
| Discharge location | ||||
| Home | Referent | |||
| Facility (SNF, rehabilitation facility) | 1.90 (1.77 to 2.03) | <0.001 | 1.11 (1.02 to 1.19) | 0.009 |
| Home with homecare or hospice | 1.73 (1.64 to 1.83) | <0.001 | 1.26 (1.19 to 1.34) | <0.001 |
| Other | 1.89 (1.78 to 2.00) | <0.001 | 1.25 (1.18 to 1.34) | <0.001 |
| Length of stay, d | 1.03 (1.02 to 1.03) | <0.001 | 1.00 (1.00 to 1.01) | <0.001 |
| APRDRG‐SOI expected readmission rate, % | 1.08 (1.07 to 1.08) | <0.001 | 1.06 (1.06 to 1.06) | <0.001 |
| AHRQ Comorbidity Index (1 point) | 1.27 (1.26 to 1.28) | <0.001 | 1.11 (1.09 to 1.12) | <0.001 |
| Discharge summary completed >3 days | 1.09 (1.04 to 1.14) | <0.001 | 1.09 (1.05 to 1.14) | <0.001 |

Multivariable and Secondary Analyses
In adjusted analysis (Table 2), patients discharged from an oncologic service relative to a medicine hospital service (OR: 1.19, 95% CI: 1.10 to 1.28, P < 0.001), patients discharged to a facility, home with homecare or hospice, or other location compared to home (facility OR: 1.11, 95% CI: 1.02 to 1.19, P = 0.009; home with homecare or hospice OR: 1.26, 95% CI: 1.19 to 1.34, P < 0.001; other OR: 1.25, 95% CI: 1.18 to 1.34, P < 0.001), patients with longer LOS (OR: 1.11 per day, 95% CI: 1.10 to 1.12, P < 0.001), patients with a higher expected readmission rates (OR: 1.01 per percent, 95% CI: 1.00 to 1.01, P < 0.001), and patients with a higher AHRQ comorbidity index (OR: 1.06 per 1 point, 95% CI: 1.06 to 1.06, P < 0.001) had higher 30‐day readmission rates. Overall, days to complete the discharge summary >3 days versus 3 days was associated with a higher readmission rate (OR: 1.09, 95% CI: 1.05 to 1.14, P < 0.001).
In a sensitivity analysis, discharge summary completion >8 days (median) versus 8 days was associated with higher unadjusted readmission rate (OR: 1.11, 95% CI: 1.07 to 1.15, P < 0.001) and a higher adjusted readmission rate (OR: 1.06, 95% CI: 1.02 to 1.10, P < 0.001). Discharge summary completion >14 days (70th percentile) versus 14 days was also associated with higher unadjusted readmission rate (OR: 1.15, 95% CI: 1.08 to 1.21, P < 0.001) and a higher adjusted readmission rate (OR: 1.09, 95% CI: 1.02 to 1.16, P = 0.008). The association between days to complete the discharge summary >3 days and readmissions was found to vary significantly by hospital service (P = 0.03). For comparing days to complete the discharge summary >3 versus 3 days, Table 3 shows that neurosciences, pediatrics, oncology, and medicine hospital services were associated with significantly increased adjusted mean readmission rates. Additionally, when days to complete the discharge summary was modeled as a continuous variable, we found that for every 3 days the odds of readmission increased by 1% (OR: 1.01, 95% CI: 1.00 to 1.01, P < 0.001).
| Days to Complete Discharge Summary by Hospital Service | Adjusted Mean Readmission Rate (95% CI)* | P Value |
|---|---|---|
| ||
| Gynecologyobstetrics | 0.30 | |
| 03 days, n = 1,792 | 5.4 (4.1 to 6.7) | |
| >3 days, n = 7,507 | 6.0 (4.9 to 7.0) | |
| Medicine | 0.04 | |
| 03 days, n = 6,137 | 21.1 (20.0 to 22.3) | |
| >3 days, n = 19,899 | 22.4 (21.6 to 23.2) | |
| Neurosciences | 0.02 | |
| 03 days, n = 1,116 | 10.1 (8.2 to 12.1) | |
| >3 days, n = 7,153 | 12.5 (11.6 to 13.5) | |
| Oncology | 0.01 | |
| 03 days, n = 1,885 | 25.0 (22.6 to 27.4) | |
| >3 days, n = 3,337 | 28.2 (26.6 to 30.2) | |
| Pediatrics | 0.001 | |
| 03 days, n = 4,561 | 9.5 (6.9 to 12.2) | |
| >3 days, n = 12,468 | 11.4 (8.9 to 13.9) | |
| Surgical sciences | 0.89 | |
| 03 days, n = 6,261 | 15.2 (14.2 to 16.1) | |
| >3 days, n = 15,878 | 15.1 (14.4 to 15.8) | |
In an unadjusted analysis, we found that the relationship between LOS and days to complete the discharge summary was not significant ( coefficient and 95% CI:, 0.01, 0.02 to 0.00, P = 0.20). However, we found a small but significant relationship in our multivariable analysis, such that each hospitalization day was associated with a 0.01 (95% CI: 0.00 to 0.02, P = 0.03) increase in days to complete the discharge summary.
DISCUSSION
In this single‐center retrospective analysis, the number of days to complete the discharge summary was significantly associated with readmissions after hospitalization. This association was independent of age, gender, comorbidity index, payer, discharge location, length of hospital stay, expected readmission rate based on diagnosis and severity of illness, and all hospital services. The odds of readmission for patients with delayed discharge summaries was small but significant. This is important in the current landscape of readmissions, particularly for institutions who are challenged to reduce readmission rates, and a small relative difference in readmissions may be the difference between getting penalized or not. In the context of prior studies, the results highlight the role of timely discharge summary as an under‐recognized metric, which may be a valid litmus test for care coordination. The findings also emphasize the potential of early summaries to expedite communication and to help facilitate quality of patient care. Hence, the study results extend the literature examining the relationship of delay in discharge summary with unfavorable patient outcomes.[15, 32]
In contrast to prior reports with limited focus on same‐hospital readmissions,[18, 33, 34, 35] readmissions beyond 30 days,[12] or focused on a specific patient population,[13, 36] this study evaluates both intra‐ and interhospital 30‐day readmissions in Maryland in an all‐payer, multi‐institution, diverse patient population. Additionally, prior research is conflicting with respect to whether timely discharges summaries are significantly associated with increased hospital readmissions.[12, 13, 14, 15] Although it is not surprising that inadequate care during hospitalization could result in readmissions, the role of discharge summaries remain underappreciated. Having a timely discharge summary may not always prevent readmissions, but our study showed that 43% of readmission occurred before the discharge summary completion. Not having a completed discharge summary at the time of readmission may have been a driver for the positive association between timely completion and 30‐day readmission we observed. This study highlights that delay in the discharge summary could be a marker of poor transitions of care, because suboptimal dissemination of critical information to care providers may result in discontinuity of patient care posthospitalization.
A plausible mechanism of the association between discharge summary delays and readmissions could be the provision of collateral information, which may potentially alter the threshold for readmissions. For example, in the emergency room/emergency department (ER/ED) setting, discharge summaries may help with preventable readmissions. For patients who present repeatedly with the same complaint, timely summaries to ER/ED providers may help reframe the patient complaints, such as patient has concern X, which was previously identified to be related to diagnosis Y. As others have shown, the content of discharge summaries, format, and accessibility (electronic vs paper chart), as well as timely distribution of summaries, are key factors that impact quality outcomes.[2, 12, 15, 37, 38] By detailing prior hospital information (ie, discharge medications, prior presentations, tests completed), summaries could help prevent errors in medication dosing, reduce unnecessary testing, and help facilitate admission triage. Summaries may have information regarding a new diagnosis such as the results of an endoscopic evaluation that revealed the source of occult gastrointestinal bleeding, which could help contextualize a complaint of repeat melena and redirect goals of care. Discussions of goals of care in the discharge summary may guide primary providers in continued care management plans.
Our study findings underscore a positive correlation between late discharge summaries and readmissions. However, the extent that this is a causal relationship is unclear; the association of delay in days to complete the discharge summary with readmission may be an epiphenomenon related to processes related to quality of clinical care. For example, delays in discharge summary completion could be a marker of other system issues, such as a stressed work environment. It is possible that providers who fail to complete timely discharge summaries may also fail to do other important functions related to transitions of care and care coordination. However, even if this is so, timely discharge summaries could become a focal point for discussion for optimization of care transitions. A discharge summary could be delayed because the patient has already been readmitted before the summary was distributed, thus making that original summary less relevant. Delays could also be a reflection of the data complexity for patients with longer hospital stays. This is supported by the small but significant relationship between LOS and days to complete the discharge summary in this study. Lastly, delays in discharge summary completion may also be a proxy of provider communication and can reflect the culture of communication at the institution.
Although unplanned hospital readmission is an important outcome, many readmissions may be related to other factors such as disease progression, rather than late summaries or the lack of postdischarge communication. For instance, prior reports did not find any association between the PCP seeing the discharge summaries or direct communications with the PCP and 30‐day clinical outcomes for readmission and death.[26, 39] However, these studies were limited in their use of self‐reported handoffs, did not measure quality of information transfer, and failed to capture a broader audience beyond the PCP, such as ED physicians or specialists.
Our results suggest that the relationship between days to complete discharge summaries and 30‐day readmissions may vary depending on whether the hospitalization is primarily surgical/procedural versus medical treatment. A recent study found that most readmissions after surgery were associated with new complications related to the procedure and not exacerbation of prior index hospitalization complications.[40] Hence, treatment for common causes of hospital readmissions after surgical or gynecological procedures, such as wound infections, acute anemia, ileus, or dehydration, may not necessarily require a completed discharge summary for appropriate management. However, we caution extending this finding to clinical practice before further studies are conducted on specific procedures and in different clinical settings.
Results from this study also support institutional policies that specify the need for practitioners to complete discharge summaries contemporaneously, such as at the time of discharge or within a couple of days. Unlike other forms of communication that are optional, discharge summaries are required, so we recommend that practitioners be held accountable for short turnaround times. For example, providers could be graded and rated on timely completions of discharge summaries, among other performance variables. Anecdotally at our institutions, we have heard from practitioners that it takes less time to complete them when you do them on the day of discharge, because the hospitalization course is fresher in their mind and they have to wade through less information in the medical record to complete an accurate discharge summary. To this point, a barrier to on‐time completion is that providers may have misconceptions about what is really vital information to convey to the next provider. In agreement with past research and in the era of the electronic medical record system, we recommend that the discharge summary should be a quick synthesis of key findings that incorporates only the important elements, such as why the patient was hospitalized, what were key findings and key responses to therapy, what is pending at the time of discharge, what medications the patient is currently taking, and what are the follow‐up plans, rather than a lengthy expose of all the findings.[13, 36, 41, 42]
Lastly, our study results should be taken in the context of its limitations. As a single‐center study, findings may lack generalizability. In particular, the results may not generalize to hospitals that lack access to statewide reporting. We were also not able to assess readmission for patients who may have been readmitted to a hospital outside of Maryland. Although we adjusted for pertinent variables such as age, gender, healthcare payer, hospital service, comorbidity index, discharge location, LOS, and expected readmission rates, there may be other relevant confounders that we failed to capture or measure optimally. Median days to complete the discharge summary in this study was 8 days, which is longer than practices at other institutions, and may also limit this study's generalizability.[15, 36, 42] However, prior research supports our findings,[15] and a systematic review found that only 29% and 52% of discharge summaries were completed by 2 weeks and 4 weeks, respectively.[9] Finally, as noted above and perhaps most important, it is possible that discharge summary turnaround time does not in itself causally impact readmissions, but rather reflects an underlying commitment of the inpatient team to effectively coordinate care following hospital discharge.
CONCLUSION
In sum, this study delineates an underappreciated but important relationship of timely discharge summary completion and readmission outcomes. The discharge summary may be a relevant metric reflecting quality of patient care. Healthcare providers may begin to target timely discharge summaries as a potential focal point of quality‐improvement projects with the goal to facilitate better patient outcomes.
Disclosures
The authors certify that no party having a direct interest in the results of the research supporting this article has or will confer a benefit on us or on any organization with which we are associated, and, if applicable, the authors certify that all financial and material support for this research (eg, Centers for Medicare and Medicaid Services, National Institutes of Health, or National Health Service grants) and work are clearly identified. This study was supported by funding opportunity, number CMS‐1C1‐12‐0001, from the Centers for Medicare and Medicaid Services and Center for Medicare and Medicaid Innovation. Its contents are solely the responsibility of the authors and do not necessarily represent the official views of the Department of Health and Human Services or any of its agencies.
- , , , et al. Development and sustainability of an inpatient‐to‐outpatient discharge handoff tool: a quality improvement project. Jt Comm J Qual Patient Saf. 2014;40(5):219–227.
- , , , , , . Documentation of mandated discharge summary components in transitions from acute to subacute care. In: Henriksen K, Battles JB, Keyes MA, et al., eds. Advances in Patient Safety: New Directions and Alternative Approaches. Vol. 2. Culture and Redesign. Rockville, MD: Agency for Healthcare Research and Quality; 2008.
- , , , . Better transitions: improving comprehension of discharge instructions. Front Health Serv Manage. 2009;25(3):11–32.
- , , , . Structured discharge education improves early outcome in orthopedic patients. Int J Orthop Trauma Nurs. 2010;14(2):66–74.
- , , , et al. Hospital discharge documentation and risk of rehospitalisation. BMJ Qual Saf. 2011;20(9):773–778.
- , , . The hospital discharge: a review of a high risk care transition with highlights of a reengineered discharge process. J Patient Saf. 2007;3(2):97–106.
- , , , , . Interventions to reduce 30‐day rehospitalization: a systematic review. Ann Intern Med. 2011;155(8):520–528.
- , , , , , . Effect of hospital follow‐up appointment on clinical event outcomes and mortality. Arch Intern Med. 2010;170(11):955–960.
- , , , , , . Deficits in communication and information transfer between hospital‐based and primary care physicians: implications for patient safety and continuity of care. JAMA. 2007;297(8):831–841.
- , , , , . Provider characteristics, clinical‐work processes and their relationship to discharge summary quality for sub‐acute care patients. J Gen Intern Med. 2012;27(1):78–84.
- , , , et al. Contemporary evidence about hospital strategies for reducing 30‐day readmissions: a national study. J Am Coll Cardiol. 2012;60(7):607–614.
- , , , . Effect of discharge summary availability during post‐discharge visits on hospital readmission. J Gen Intern Med. 2002;17(3):186–192.
- , , , et al. Association of discharge summary quality with readmission risk for patients hospitalized with heart failure exacerbation. Circ Cardiovasc Qual Outcomes. 2015;8(1):109–111.
- , , , et al. The independent association of provider and information continuity on outcomes after hospital discharge: implications for hospitalists. J Hosp Med. 2010;5(7):398–405.
- , , , , . Timeliness in discharge summary dissemination is associated with patients' clinical outcomes. J Eval Clin Pract. 2013;19(1):76–79.
- , , , et al. Communication and information deficits in patients discharged to rehabilitation facilities: an evaluation of five acute care hospitals. J Hosp Med. 2009;4(8):E28–E33.
- , , . Preventing readmissions through comprehensive discharge planning. Prof Case Manag. 2013;18(2):56–63; quiz 64–65.
- , , , et al. Effect of a postdischarge virtual ward on readmission or death for high‐risk patients: a randomized clinical trial. JAMA. 2014;312(13):1305–1312..
- , , . Risk factors for early unplanned hospital readmission in the elderly. J Gen Intern Med. 1991;6(3):223–228.
- , , , , . Differences between early and late readmissions among patients: a cohort study. Ann Intern Med. 2015;162(11):741–749.
- , , , et al. Post‐acute care payment reform demonstration report to congress supplement‐interim report. Centers for Medicare 14(3):1–14; quiz 88–89.
- , , , et al. Comprehensive discharge planning and home follow‐up of hospitalized elders: a randomized clinical trial. JAMA. 1999;281(7):613–620.
- , , , . Posthospital care transitions: patterns, complications, and risk identification. Health Serv Res. 2004;39(5):1449–1465.
- , , , et al. Transitions of care consensus policy statement: American College of Physicians, Society of General Internal Medicine, Society of Hospital Medicine, American Geriatrics Society, American College of Emergency Physicians, and Society for Academic Emergency Medicine. J Hosp Med. 2009;4(6):364–370.
- , , , et al. Association of self‐reported hospital discharge handoffs with 30‐day readmissions. JAMA Intern Med. 2013;173(8):624–629.
- , . Socioeconomic disparities in health: pathways and policies. Health Aff (Millwood). 2002;21(2):60–76.
- , , , . Comorbidity measures for use with administrative data. Med Care. 1998;36(1):8–27.
- , , , , , . Functional status impairment is associated with unplanned readmissions. Arch Phys Med Rehabil. 2013;94(10):1951–1958.
- Centers for Medicare 35(10):1044–1059.
- , , , et al. Understanding and execution of discharge instructions. Am J Med Qual. 2013;28(5):383–391.
- , , , , . Beyond the hospital gates: elucidating the interactive association of social support, depressive symptoms, and physical function with 30‐day readmissions. Am J Phys Med Rehabil. 2015;94(7):555–567.
- , , , et al. Improving the discharge process by embedding a discharge facilitator in a resident team. J Hosp Med. 2011;6(9):494–500.
- , , , et al. Hospital variation in quality of discharge summaries for patients hospitalized with heart failure exacerbation. Circ Cardiovasc Qual Outcomes. 2015;8(1):77–86
- , , , . Addressing the business of discharge: building a case for an electronic discharge summary. J Hosp Med. 2011;6(1):37–42.
- , , , , . Joint commission requirements for discharge instructions in patients with heart failure: is understanding important for preventing readmissions? J Card Fail. 2014;20(9):641–649.
- , , , et al. Association of communication between hospital‐based physicians and primary care providers with patient outcomes. J Gen Intern Med. 2009;24(3):381–386.
- , , , et al. Underlying reasons associated with hospital readmission following surgery in the united states. JAMA. 2015;313(5):483–495.
- , , , , . Assessing quality and efficiency of discharge summaries. Am J Med Qual. 2005;20(6):337–343.
- , , , et al. Comprehensive quality of discharge summaries at an academic medical center. J Hosp Med. 2013;8(8):436–443.
Across the continuum of care, the discharge summary is a critical tool for communication among care providers.[1] In the United States, the Joint Commission policies mandate that all hospital providers complete a discharge summary for patients with specific components to foster effective communication with future providers.[2] Because outpatient providers and emergency physicians rely on clinical information in the discharge summary to ensure appropriate postdischarge continuity of care, timely documentation is potentially an essential aspect of readmission reduction initiatives.[3, 4, 5] Prior reports indicate that poor discharge documentation of follow‐up plan‐of‐care increases the risk of hospitalization, whereas structured instructions, patient education, and direct communications with primary care physicians (PCPs) reduce repeat hospital visits.[6, 7, 8, 9] However, the current literature is limited in its narrow focus on the contents of discharge summaries, considered only same‐hospital readmissions, or considered readmissions within 3 months of discharge.[10, 11, 12, 13] Moreover, some prior research has suggested no association between discharge summary timeliness with readmission,[12, 13, 14] whereas another study did find a relationship,[15] hence the need to study this further is important. Filling this gap in knowledge could provide an avenue to track and improve quality of patient care, as delays in discharge summaries have been linked with pot‐discharge adverse outcomes and patient safety concerns.[15, 16, 17, 18] Because readmissions often occur soon after discharge, having timely discharge summaries may be particularly important to outcomes.[19, 20]
This research began under the framework of evaluating a bundle of care coordination strategies that were implemented at the Johns Hopkins Health System. These strategies were informed by the early Centers for Medicare and Medicaid Services (CMS) demonstration projects and other best practices that have been documented in the literature to improve utilization and improve communication during transitions of care.[21, 22, 23, 24, 25] Later they were augmented through a contract with the Center of Medicare and Medicaid Innovation to improve access to healthcare services and improve patient outcomes through improved care coordination processes. One of the domains our institution has increased efforts to improve is in provider handoffs. Toward that goal, we have worked to disentangle the effects of different factors of provider‐to‐provider communication that may influence readmissions.[26] For example, effective written provider handoffs in the form of accurate and timely discharge summaries was considered a key care coordination component of this program, but there was institutional resistance to endorsing an expectation that discharge summary turnaround should be shortened. To build a case for this concept, we sought to test the hypothesis that, at our hospital, longer time to complete hospital discharge summaries was associated with increased readmission rates. Unique to this analysis is that, in the state of Maryland, there is statewide reporting of readmissions, so we were able to account for intra‐ and interhospital readmissions for an all‐payer population. The authors anticipated that findings from this study would help inform discharge quality‐improvement initiatives and reemphasize the importance of timely discharge documentation across all disciplines as part of quality patient care.
METHODS
Study Population and Setting
We conducted a single‐center, retrospective cohort study of 87,994 consecutive patients discharged from Johns Hopkins Hospital, which is a 1000‐bed, tertiary academic medical center in Baltimore, Maryland between January 1, 2013 and December 31, 2014. One thousand ninety‐three (1.2%) of the records on days to complete the discharge summary were missing and were excluded from the analysis.
Data Source and Covariates
Data were derived from several sources. The Johns Hopkins Hospital data mart financial database, used for mandatory reporting to the State of Maryland, provided the following patient data: age, gender, race/ethnicity, payer (Medicare, Medicaid, and other) as a proxy for socioeconomic status,[27] hospital service prior to discharge (gynecologyobstetrics, medicine, neurosciences, oncology, pediatrics, and surgical sciences), hospital length of stay (LOS) prior to discharge, Agency for Healthcare Research and Quality (AHRQ) Comorbidity Index (which is an update to the original Elixhauser methodology[28]), and all‐payerrefined diagnosis‐related group (APRDRG) and severity of illness (SOI) combinations (a tool to group patients into clinically comparable disease and SOI categories expected to use similar resources and experience similar outcomes). The Health Services Cost Review Commission (HSCRC) in Maryland provided the observed readmission rate in Maryland for each APRDRG‐SOI combination and served as an expected readmission rate. This risk stratification methodology is similar to the approach used in previous studies.[26, 29] Discharge summary turnaround time was obtained from institutional administrative databases used to track compliance with discharge summary completion. Discharge location (home, facility, home with homecare or hospice, or other) was obtained from Curaspan databases (Curaspan Health Group, Inc., Newton, MA).
Primary Outcome: 30‐Day Readmission
The primary outcome was unplanned rehospitalizations to an acute care hospital in Maryland within 30 days of discharge from Johns Hopkins Hospital. This was as defined by the Maryland HSCRC using an algorithm to exclude readmissions that were likely to be scheduled, as defined by the index admission diagnosis and readmission diagnosis; this algorithm is updated based on the CMS all‐cause readmission algorithm.[30, 31]
Primary Exposure: Days to Complete the Discharge Summary
Discharge summary completion time was defined as the date when the discharge attending physician electronically signs the discharge summary. At our institution, an auto‐fax system sends documents (eg, discharge summaries, clinic notes) to linked providers (eg, primary care providers) shortly after midnight from the day the document is signed by an attending physician. During the period of the project, the policy for discharge summaries at the Johns Hopkins Hospital went from requiring them to be completed within 30 days to 14 days, and we were hoping to use our analyses to inform decision makers why this was important. To emphasize the need for timely completion of discharge summaries, we dichotomized the number of days to complete the discharge summary into >3 versus 3 days (20th percentile cutoff) and modeled it as a continuous variable (per 3‐day increase in days to complete the discharge summary).
Statistical Analysis
To evaluate differences in patient characteristics by readmission status, analysis of variance and 2 tests were used for continuous and dichotomous variables, respectively. Logistic regression was used to evaluate the association between days to complete the discharge summary >3 days and readmission status, adjusting for potentially confounding variables. Before inclusion in the logistic regression model, we confirmed a lack of multicollinearity in the multivariable regression model using variance inflation factors. We evaluated residual versus predicted value plots and residual versus fitted value plots with a locally weighted scatterplot smoothing line. In a sensitivity analysis we evaluated the association between readmission status and different cutoffs (>8 days, 50th percentile; and >14 days, 70% percentile). In a separate analysis, we used interaction terms to test whether the association between the association between days to complete the discharge summary >3 days and hospital readmission varied by the covariates in the analysis (age, sex, race, payer, hospital service, discharge location, LOS, APRDRG‐SOI expected readmission rate, and AHRQ Comorbidity Index). We observed a significant interaction between 30‐day readmission and days to complete the discharge summary >3 days by hospital service. Hence, we separately calculated the adjusted mean readmission rates separately for each hospital service using the least squared means method for the multivariable logistic regression analysis and adjusting for the previously mentioned covariates. In a separate analysis, we used linear regression to evaluate the association between LOS and days to complete the discharge summary, adjusting for potentially confounding variables. Statistical significance was defined as a 2‐sided P < 0.05. Data were analyzed with R (version 2.15.0; R Foundation for Statistical Computing, Vienna, Austria;
RESULTS
Readmitted Patients
In the study period, 14,248 out of 87,994 (16.2%) consecutive eligible patients were readmitted to a hospital in Maryland from patients discharged from Johns Hopkins Hospital between January 1, 2013 and December 31, 2014. A total of 11,027 (77.4%) of the readmissions were back to Johns Hopkins Hospital. Table 1 compares characteristics of readmitted versus nonreadmitted patients, with the following variables being significantly different between these patient groups: age, gender, healthcare payer, hospital service, discharge location, length of stay expected readmission rate, AHRQ Comorbidity Index, and days to complete inpatient discharge summary.
| Characteristics | All Patients, N = 87,994 | Not Readmitted, N = 73,746 | Readmitted, N = 14,248 | P Value |
|---|---|---|---|---|
| ||||
| Age, y | 42.1 (25.1) | 41.3 (25.4) | 46.4 (23.1) | <0.001 |
| Male | 43,210 (49.1%) | 35,851 (48.6%) | 7,359 (51.6%) | <0.001 |
| Race | <0.001 | |||
| Caucasian | 45,705 (51.9%) | 3,8661 (52.4%) | 7,044 (49.4%) | |
| African American | 32,777 (37.2%) | 2,6841 (36.4%) | 5,936 (41.7%) | |
| Other | 9,512 (10.8%) | 8,244 (11.2%) | 1,268 (8.9%) | |
| Payer | <0.001 | |||
| Medicare | 22,345 (25.4%) | 17,614 (23.9%) | 4,731 (33.2%) | |
| Medicaid | 24,080 (27.4%) | 20,100 (27.3%) | 3,980 (27.9%) | |
| Other | 41,569 (47.2%) | 36,032 (48.9%) | 5,537 (38.9%) | |
| Hospital service | <0.001 | |||
| Gynecologyobstetrics | 9,299 (10.6%) | 8,829 (12.0%) | 470 (3.3%) | |
| Medicine | 26,036 (29.6%) | 20,069 (27.2%) | 5,967 (41.9%) | |
| Neurosciences | 8,269 (9.4%) | 7,331 (9.9%) | 938 (6.6%) | |
| Oncology | 5,222 (5.9%) | 3,898 (5.3%) | 1,324 (9.3%) | |
| Pediatrics | 17,029 (19.4%) | 14,684 (19.9%) | 2,345 (16.5%) | |
| Surgical sciences | 22,139 (25.2%) | 18,935 (25.7%) | 3,204 (22.5%) | |
| Discharge location | <0.001 | |||
| Home | 65,478 (74.4%) | 56,359 (76.4%) | 9,119 (64.0%) | |
| Home with homecare or hospice | 9,524 (10.8%) | 7,440 (10.1%) | 2,084 (14.6%) | |
| Facility (SNF, rehabilitation facility) | 5,398 (6.1%) | 4,131 (5.6%) | 1,267 (8.9%) | |
| Other | 7,594 (8.6%) | 5,816 (7.9%) | 1,778 (12.5%) | |
| Length of stay, d | 5.5 (8.6) | 5.1 (7.8) | 7.5 (11.6) | <0.001 |
| APRDRG‐SOI Expected Readmission Rate, % | 14.4 (9.5) | 13.3 (9.2) | 20.1 (9.0) | <0.001 |
| AHRQ Comorbidity Index (1 point) | 2.5 (1.4) | 2.4 (1.4) | 3.0 (1.8) | <0.001 |
| Discharge summary completed >3 days | 66,242 (75.3%) | 55,329 (75.0%) | 10,913 (76.6%) | <0.001 |
Association Between Days to Complete the Discharge Summary and Readmission
After hospital discharge, median (IQR) number of days to complete discharge summaries was 8 (416) days. After hospital discharge, median (IQR) number of days to complete discharge summaries and the number of days from discharge to readmission was 8 (416) and 11 (519) days, respectively (P < 0.001). Six thousand one hundred one patients (42.8%) were readmitted before their discharge summary was completed. The median (IQR) days to complete discharge summaries by hospital service in order from shortest to longest was: oncology, 6 (212) days; surgical sciences, 6 (312) days; pediatrics, 7 (315) days; gynecologyobstetrics, 8 (415) days; medicine, 9 (420) days; neurosciences, 12 (621) days.
When we divided the number of days to complete the discharge summary into deciles (02, 2.13, 3.14, 4.16, 6.18, 8.210, 10.114, 14.119, 19.130, >30), a longer number of days to complete discharge summaries had higher unadjusted and adjusted readmission rates (Figure 1). In unadjusted analysis, Table 2 shows that older age, male sex, African American race, oncological versus medicine hospital service, discharge location, longer LOS, higher APRDRG‐SOI expected readmission rate, and higher AHRQ Comorbidity Index were associated with readmission. Days to complete the discharge summary >3 days versus 3 days was associated with a higher readmission rate, with an unadjusted odds ratio (OR) and 95% confidence interval (CI) of 1.09 (95% CI: 1.04 to 1.13, P < 0.001).
| Characteristic | Bivariable Analysis* | Multivariable Analysis* | ||
|---|---|---|---|---|
| OR (95% CI) | P Value | OR (95% CI) | P Value | |
| ||||
| Age, 10 y | 1.09 (1.08 to 1.09) | <0.001 | 0.97 (0.95 to 0.98) | <0.001 |
| Male | 1.13 (1.09 to 1.17) | <0.001 | 1.01 (0.97 to 1.05) | 0.76 |
| Race | ||||
| Caucasian | Referent | Referent | ||
| African American | 1.21 (1.17 to 1.26) | <0.001 | 1.01 (0.96 to 1.05) | 0.74 |
| Other | 0.84 (0.79 to 0.90) | <0.001 | 0.92 (0.86 to 0.98) | 0.01 |
| Payer | ||||
| Medicare | Referent | Referent | ||
| Medicaid | 0.74 (0.70 to 0.77) | <0.001 | 1.03 (0.97 to 1.09) | 0.42 |
| Other | 0.57 (0.55 to 0.60) | <0.001 | 0.86 (0.82 to 0.91) | <0.001 |
| Hospital service | ||||
| Medicine | Referent | Referent | ||
| Gynecologyobstetrics | 0.18 (0.16 to 0.20) | <0.001 | 0.50 (0.45 to 0.56) | <0.001 |
| Neurosciences | 0.43 (0.40 to 0.46) | <0.001 | 0.76 (0.70 to 0.82) | <0.001 |
| Oncology | 1.14 (1.07 to 1.22) | <0.001 | 1.18 (1.10 to 1.28) | <0.001 |
| Pediatrics | 0.54 (0.51 to 0.57) | <0.001 | 0.77 (0.71 to 0.83) | <0.001 |
| Surgical sciences | 0.57 (0.54 to 0.60) | <0.001 | 0.92 (0.87 to 0.97) | 0.002 |
| Discharge location | ||||
| Home | Referent | |||
| Facility (SNF, rehabilitation facility) | 1.90 (1.77 to 2.03) | <0.001 | 1.11 (1.02 to 1.19) | 0.009 |
| Home with homecare or hospice | 1.73 (1.64 to 1.83) | <0.001 | 1.26 (1.19 to 1.34) | <0.001 |
| Other | 1.89 (1.78 to 2.00) | <0.001 | 1.25 (1.18 to 1.34) | <0.001 |
| Length of stay, d | 1.03 (1.02 to 1.03) | <0.001 | 1.00 (1.00 to 1.01) | <0.001 |
| APRDRG‐SOI expected readmission rate, % | 1.08 (1.07 to 1.08) | <0.001 | 1.06 (1.06 to 1.06) | <0.001 |
| AHRQ Comorbidity Index (1 point) | 1.27 (1.26 to 1.28) | <0.001 | 1.11 (1.09 to 1.12) | <0.001 |
| Discharge summary completed >3 days | 1.09 (1.04 to 1.14) | <0.001 | 1.09 (1.05 to 1.14) | <0.001 |
Multivariable and Secondary Analyses
In adjusted analysis (Table 2), patients discharged from an oncologic service relative to a medicine hospital service (OR: 1.19, 95% CI: 1.10 to 1.28, P < 0.001), patients discharged to a facility, home with homecare or hospice, or other location compared to home (facility OR: 1.11, 95% CI: 1.02 to 1.19, P = 0.009; home with homecare or hospice OR: 1.26, 95% CI: 1.19 to 1.34, P < 0.001; other OR: 1.25, 95% CI: 1.18 to 1.34, P < 0.001), patients with longer LOS (OR: 1.11 per day, 95% CI: 1.10 to 1.12, P < 0.001), patients with a higher expected readmission rates (OR: 1.01 per percent, 95% CI: 1.00 to 1.01, P < 0.001), and patients with a higher AHRQ comorbidity index (OR: 1.06 per 1 point, 95% CI: 1.06 to 1.06, P < 0.001) had higher 30‐day readmission rates. Overall, days to complete the discharge summary >3 days versus 3 days was associated with a higher readmission rate (OR: 1.09, 95% CI: 1.05 to 1.14, P < 0.001).
In a sensitivity analysis, discharge summary completion >8 days (median) versus 8 days was associated with higher unadjusted readmission rate (OR: 1.11, 95% CI: 1.07 to 1.15, P < 0.001) and a higher adjusted readmission rate (OR: 1.06, 95% CI: 1.02 to 1.10, P < 0.001). Discharge summary completion >14 days (70th percentile) versus 14 days was also associated with higher unadjusted readmission rate (OR: 1.15, 95% CI: 1.08 to 1.21, P < 0.001) and a higher adjusted readmission rate (OR: 1.09, 95% CI: 1.02 to 1.16, P = 0.008). The association between days to complete the discharge summary >3 days and readmissions was found to vary significantly by hospital service (P = 0.03). For comparing days to complete the discharge summary >3 versus 3 days, Table 3 shows that neurosciences, pediatrics, oncology, and medicine hospital services were associated with significantly increased adjusted mean readmission rates. Additionally, when days to complete the discharge summary was modeled as a continuous variable, we found that for every 3 days the odds of readmission increased by 1% (OR: 1.01, 95% CI: 1.00 to 1.01, P < 0.001).
| Days to Complete Discharge Summary by Hospital Service | Adjusted Mean Readmission Rate (95% CI)* | P Value |
|---|---|---|
| ||
| Gynecologyobstetrics | 0.30 | |
| 03 days, n = 1,792 | 5.4 (4.1 to 6.7) | |
| >3 days, n = 7,507 | 6.0 (4.9 to 7.0) | |
| Medicine | 0.04 | |
| 03 days, n = 6,137 | 21.1 (20.0 to 22.3) | |
| >3 days, n = 19,899 | 22.4 (21.6 to 23.2) | |
| Neurosciences | 0.02 | |
| 03 days, n = 1,116 | 10.1 (8.2 to 12.1) | |
| >3 days, n = 7,153 | 12.5 (11.6 to 13.5) | |
| Oncology | 0.01 | |
| 03 days, n = 1,885 | 25.0 (22.6 to 27.4) | |
| >3 days, n = 3,337 | 28.2 (26.6 to 30.2) | |
| Pediatrics | 0.001 | |
| 03 days, n = 4,561 | 9.5 (6.9 to 12.2) | |
| >3 days, n = 12,468 | 11.4 (8.9 to 13.9) | |
| Surgical sciences | 0.89 | |
| 03 days, n = 6,261 | 15.2 (14.2 to 16.1) | |
| >3 days, n = 15,878 | 15.1 (14.4 to 15.8) | |
In an unadjusted analysis, we found that the relationship between LOS and days to complete the discharge summary was not significant ( coefficient and 95% CI:, 0.01, 0.02 to 0.00, P = 0.20). However, we found a small but significant relationship in our multivariable analysis, such that each hospitalization day was associated with a 0.01 (95% CI: 0.00 to 0.02, P = 0.03) increase in days to complete the discharge summary.
DISCUSSION
In this single‐center retrospective analysis, the number of days to complete the discharge summary was significantly associated with readmissions after hospitalization. This association was independent of age, gender, comorbidity index, payer, discharge location, length of hospital stay, expected readmission rate based on diagnosis and severity of illness, and all hospital services. The odds of readmission for patients with delayed discharge summaries was small but significant. This is important in the current landscape of readmissions, particularly for institutions who are challenged to reduce readmission rates, and a small relative difference in readmissions may be the difference between getting penalized or not. In the context of prior studies, the results highlight the role of timely discharge summary as an under‐recognized metric, which may be a valid litmus test for care coordination. The findings also emphasize the potential of early summaries to expedite communication and to help facilitate quality of patient care. Hence, the study results extend the literature examining the relationship of delay in discharge summary with unfavorable patient outcomes.[15, 32]
In contrast to prior reports with limited focus on same‐hospital readmissions,[18, 33, 34, 35] readmissions beyond 30 days,[12] or focused on a specific patient population,[13, 36] this study evaluates both intra‐ and interhospital 30‐day readmissions in Maryland in an all‐payer, multi‐institution, diverse patient population. Additionally, prior research is conflicting with respect to whether timely discharges summaries are significantly associated with increased hospital readmissions.[12, 13, 14, 15] Although it is not surprising that inadequate care during hospitalization could result in readmissions, the role of discharge summaries remain underappreciated. Having a timely discharge summary may not always prevent readmissions, but our study showed that 43% of readmission occurred before the discharge summary completion. Not having a completed discharge summary at the time of readmission may have been a driver for the positive association between timely completion and 30‐day readmission we observed. This study highlights that delay in the discharge summary could be a marker of poor transitions of care, because suboptimal dissemination of critical information to care providers may result in discontinuity of patient care posthospitalization.
A plausible mechanism of the association between discharge summary delays and readmissions could be the provision of collateral information, which may potentially alter the threshold for readmissions. For example, in the emergency room/emergency department (ER/ED) setting, discharge summaries may help with preventable readmissions. For patients who present repeatedly with the same complaint, timely summaries to ER/ED providers may help reframe the patient complaints, such as patient has concern X, which was previously identified to be related to diagnosis Y. As others have shown, the content of discharge summaries, format, and accessibility (electronic vs paper chart), as well as timely distribution of summaries, are key factors that impact quality outcomes.[2, 12, 15, 37, 38] By detailing prior hospital information (ie, discharge medications, prior presentations, tests completed), summaries could help prevent errors in medication dosing, reduce unnecessary testing, and help facilitate admission triage. Summaries may have information regarding a new diagnosis such as the results of an endoscopic evaluation that revealed the source of occult gastrointestinal bleeding, which could help contextualize a complaint of repeat melena and redirect goals of care. Discussions of goals of care in the discharge summary may guide primary providers in continued care management plans.
Our study findings underscore a positive correlation between late discharge summaries and readmissions. However, the extent that this is a causal relationship is unclear; the association of delay in days to complete the discharge summary with readmission may be an epiphenomenon related to processes related to quality of clinical care. For example, delays in discharge summary completion could be a marker of other system issues, such as a stressed work environment. It is possible that providers who fail to complete timely discharge summaries may also fail to do other important functions related to transitions of care and care coordination. However, even if this is so, timely discharge summaries could become a focal point for discussion for optimization of care transitions. A discharge summary could be delayed because the patient has already been readmitted before the summary was distributed, thus making that original summary less relevant. Delays could also be a reflection of the data complexity for patients with longer hospital stays. This is supported by the small but significant relationship between LOS and days to complete the discharge summary in this study. Lastly, delays in discharge summary completion may also be a proxy of provider communication and can reflect the culture of communication at the institution.
Although unplanned hospital readmission is an important outcome, many readmissions may be related to other factors such as disease progression, rather than late summaries or the lack of postdischarge communication. For instance, prior reports did not find any association between the PCP seeing the discharge summaries or direct communications with the PCP and 30‐day clinical outcomes for readmission and death.[26, 39] However, these studies were limited in their use of self‐reported handoffs, did not measure quality of information transfer, and failed to capture a broader audience beyond the PCP, such as ED physicians or specialists.
Our results suggest that the relationship between days to complete discharge summaries and 30‐day readmissions may vary depending on whether the hospitalization is primarily surgical/procedural versus medical treatment. A recent study found that most readmissions after surgery were associated with new complications related to the procedure and not exacerbation of prior index hospitalization complications.[40] Hence, treatment for common causes of hospital readmissions after surgical or gynecological procedures, such as wound infections, acute anemia, ileus, or dehydration, may not necessarily require a completed discharge summary for appropriate management. However, we caution extending this finding to clinical practice before further studies are conducted on specific procedures and in different clinical settings.
Results from this study also support institutional policies that specify the need for practitioners to complete discharge summaries contemporaneously, such as at the time of discharge or within a couple of days. Unlike other forms of communication that are optional, discharge summaries are required, so we recommend that practitioners be held accountable for short turnaround times. For example, providers could be graded and rated on timely completions of discharge summaries, among other performance variables. Anecdotally at our institutions, we have heard from practitioners that it takes less time to complete them when you do them on the day of discharge, because the hospitalization course is fresher in their mind and they have to wade through less information in the medical record to complete an accurate discharge summary. To this point, a barrier to on‐time completion is that providers may have misconceptions about what is really vital information to convey to the next provider. In agreement with past research and in the era of the electronic medical record system, we recommend that the discharge summary should be a quick synthesis of key findings that incorporates only the important elements, such as why the patient was hospitalized, what were key findings and key responses to therapy, what is pending at the time of discharge, what medications the patient is currently taking, and what are the follow‐up plans, rather than a lengthy expose of all the findings.[13, 36, 41, 42]
Lastly, our study results should be taken in the context of its limitations. As a single‐center study, findings may lack generalizability. In particular, the results may not generalize to hospitals that lack access to statewide reporting. We were also not able to assess readmission for patients who may have been readmitted to a hospital outside of Maryland. Although we adjusted for pertinent variables such as age, gender, healthcare payer, hospital service, comorbidity index, discharge location, LOS, and expected readmission rates, there may be other relevant confounders that we failed to capture or measure optimally. Median days to complete the discharge summary in this study was 8 days, which is longer than practices at other institutions, and may also limit this study's generalizability.[15, 36, 42] However, prior research supports our findings,[15] and a systematic review found that only 29% and 52% of discharge summaries were completed by 2 weeks and 4 weeks, respectively.[9] Finally, as noted above and perhaps most important, it is possible that discharge summary turnaround time does not in itself causally impact readmissions, but rather reflects an underlying commitment of the inpatient team to effectively coordinate care following hospital discharge.
CONCLUSION
In sum, this study delineates an underappreciated but important relationship of timely discharge summary completion and readmission outcomes. The discharge summary may be a relevant metric reflecting quality of patient care. Healthcare providers may begin to target timely discharge summaries as a potential focal point of quality‐improvement projects with the goal to facilitate better patient outcomes.
Disclosures
The authors certify that no party having a direct interest in the results of the research supporting this article has or will confer a benefit on us or on any organization with which we are associated, and, if applicable, the authors certify that all financial and material support for this research (eg, Centers for Medicare and Medicaid Services, National Institutes of Health, or National Health Service grants) and work are clearly identified. This study was supported by funding opportunity, number CMS‐1C1‐12‐0001, from the Centers for Medicare and Medicaid Services and Center for Medicare and Medicaid Innovation. Its contents are solely the responsibility of the authors and do not necessarily represent the official views of the Department of Health and Human Services or any of its agencies.
- , , , et al. Development and sustainability of an inpatient‐to‐outpatient discharge handoff tool: a quality improvement project. Jt Comm J Qual Patient Saf. 2014;40(5):219–227.
- , , , , , . Documentation of mandated discharge summary components in transitions from acute to subacute care. In: Henriksen K, Battles JB, Keyes MA, et al., eds. Advances in Patient Safety: New Directions and Alternative Approaches. Vol. 2. Culture and Redesign. Rockville, MD: Agency for Healthcare Research and Quality; 2008.
- , , , . Better transitions: improving comprehension of discharge instructions. Front Health Serv Manage. 2009;25(3):11–32.
- , , , . Structured discharge education improves early outcome in orthopedic patients. Int J Orthop Trauma Nurs. 2010;14(2):66–74.
- , , , et al. Hospital discharge documentation and risk of rehospitalisation. BMJ Qual Saf. 2011;20(9):773–778.
- , , . The hospital discharge: a review of a high risk care transition with highlights of a reengineered discharge process. J Patient Saf. 2007;3(2):97–106.
- , , , , . Interventions to reduce 30‐day rehospitalization: a systematic review. Ann Intern Med. 2011;155(8):520–528.
- , , , , , . Effect of hospital follow‐up appointment on clinical event outcomes and mortality. Arch Intern Med. 2010;170(11):955–960.
- , , , , , . Deficits in communication and information transfer between hospital‐based and primary care physicians: implications for patient safety and continuity of care. JAMA. 2007;297(8):831–841.
- , , , , . Provider characteristics, clinical‐work processes and their relationship to discharge summary quality for sub‐acute care patients. J Gen Intern Med. 2012;27(1):78–84.
- , , , et al. Contemporary evidence about hospital strategies for reducing 30‐day readmissions: a national study. J Am Coll Cardiol. 2012;60(7):607–614.
- , , , . Effect of discharge summary availability during post‐discharge visits on hospital readmission. J Gen Intern Med. 2002;17(3):186–192.
- , , , et al. Association of discharge summary quality with readmission risk for patients hospitalized with heart failure exacerbation. Circ Cardiovasc Qual Outcomes. 2015;8(1):109–111.
- , , , et al. The independent association of provider and information continuity on outcomes after hospital discharge: implications for hospitalists. J Hosp Med. 2010;5(7):398–405.
- , , , , . Timeliness in discharge summary dissemination is associated with patients' clinical outcomes. J Eval Clin Pract. 2013;19(1):76–79.
- , , , et al. Communication and information deficits in patients discharged to rehabilitation facilities: an evaluation of five acute care hospitals. J Hosp Med. 2009;4(8):E28–E33.
- , , . Preventing readmissions through comprehensive discharge planning. Prof Case Manag. 2013;18(2):56–63; quiz 64–65.
- , , , et al. Effect of a postdischarge virtual ward on readmission or death for high‐risk patients: a randomized clinical trial. JAMA. 2014;312(13):1305–1312..
- , , . Risk factors for early unplanned hospital readmission in the elderly. J Gen Intern Med. 1991;6(3):223–228.
- , , , , . Differences between early and late readmissions among patients: a cohort study. Ann Intern Med. 2015;162(11):741–749.
- , , , et al. Post‐acute care payment reform demonstration report to congress supplement‐interim report. Centers for Medicare 14(3):1–14; quiz 88–89.
- , , , et al. Comprehensive discharge planning and home follow‐up of hospitalized elders: a randomized clinical trial. JAMA. 1999;281(7):613–620.
- , , , . Posthospital care transitions: patterns, complications, and risk identification. Health Serv Res. 2004;39(5):1449–1465.
- , , , et al. Transitions of care consensus policy statement: American College of Physicians, Society of General Internal Medicine, Society of Hospital Medicine, American Geriatrics Society, American College of Emergency Physicians, and Society for Academic Emergency Medicine. J Hosp Med. 2009;4(6):364–370.
- , , , et al. Association of self‐reported hospital discharge handoffs with 30‐day readmissions. JAMA Intern Med. 2013;173(8):624–629.
- , . Socioeconomic disparities in health: pathways and policies. Health Aff (Millwood). 2002;21(2):60–76.
- , , , . Comorbidity measures for use with administrative data. Med Care. 1998;36(1):8–27.
- , , , , , . Functional status impairment is associated with unplanned readmissions. Arch Phys Med Rehabil. 2013;94(10):1951–1958.
- Centers for Medicare 35(10):1044–1059.
- , , , et al. Understanding and execution of discharge instructions. Am J Med Qual. 2013;28(5):383–391.
- , , , , . Beyond the hospital gates: elucidating the interactive association of social support, depressive symptoms, and physical function with 30‐day readmissions. Am J Phys Med Rehabil. 2015;94(7):555–567.
- , , , et al. Improving the discharge process by embedding a discharge facilitator in a resident team. J Hosp Med. 2011;6(9):494–500.
- , , , et al. Hospital variation in quality of discharge summaries for patients hospitalized with heart failure exacerbation. Circ Cardiovasc Qual Outcomes. 2015;8(1):77–86
- , , , . Addressing the business of discharge: building a case for an electronic discharge summary. J Hosp Med. 2011;6(1):37–42.
- , , , , . Joint commission requirements for discharge instructions in patients with heart failure: is understanding important for preventing readmissions? J Card Fail. 2014;20(9):641–649.
- , , , et al. Association of communication between hospital‐based physicians and primary care providers with patient outcomes. J Gen Intern Med. 2009;24(3):381–386.
- , , , et al. Underlying reasons associated with hospital readmission following surgery in the united states. JAMA. 2015;313(5):483–495.
- , , , , . Assessing quality and efficiency of discharge summaries. Am J Med Qual. 2005;20(6):337–343.
- , , , et al. Comprehensive quality of discharge summaries at an academic medical center. J Hosp Med. 2013;8(8):436–443.
© 2016 Society of Hospital Medicine