User login
The Hospital Readmissions Reduction Program: Inconvenient Observations
Centers for Medicare and Medicaid Services (CMS)–promulgated quality metrics continue to attract critics. Physicians decry that many metrics are outside their control, while patient groups are frustrated that metrics lack meaning for beneficiaries. The Hospital Readmissions Reduction Program (HRRP) reduces payments for “excess” 30-day risk-standardized readmissions for six conditions and procedures, and may be less effective in reducing readmissions than previously reported due to intentional and increasing use of hospital observation stays.1
In this issue, Sheehy et al2 report that nearly one in five rehospitalizations were unrecognized because either the index hospitalization or the rehospitalization was an observation stay, highlighting yet another challenge with the HRRP. Limitations of their study include the use of a single year of claims data and the exclusion of Medicare Advantage claims data, as one might expect lower readmission rates in this capitated program. Opportunities for improving the HRRP could consist of updating the HRRP metric to include observation stays and, for surgical hospitalizations, extended-stay surgical recovery, wherein patients may be observed for up to 2 days following a procedure. Unfortunately, despite the HRRP missing nearly one in five readmissions, CMS would likely need additional statutory authority from Congress in order to reinterpret the definition of readmission3 to include observation stays.
Challenges with the HRRP metrics raise broader concerns about the program. For decades, administrators viewed readmissions as a utilization metric, only to have the Affordable Care Act re-designate and define all-cause readmissions as a quality metric. Yet hospitals and health systems control only some factors driving readmission. Readmissions occur for a variety of reasons, including not only poor quality of initial hospital care and inadequate care coordination, but also factors that are beyond the hospital’s purview, such as lack of access to ambulatory services, multiple and severe chronic conditions that progress or remain unresponsive to intervention,4 and demographic and social factors such as housing instability, health literacy, or residence in a food desert. These non-hospital factors reside within the domain of other market participants or local, state, and federal government agencies.
Challenges to the utility, validity, and appropriateness of HRRP metrics should remind policymakers of the dangers of over-legislating the details of healthcare policy and the statutory inflexibility that can ensue. Clinical care evolves, and artificial constructs—including payment categories such as observation status—may age poorly over time, exemplified best by the challenges of accessing post-acute care due to the 3-day rule.5 Introduced as a statutory requirement in 1967, when the average length of stay was 13.8 days and observation care did not exist as a payment category, the 3-day rule requires Medicare beneficiaries to spend 3 days admitted to the hospital in order to qualify for coverage of post-acute care, creating care gaps for observation stay patients.
Observation care itself is an artificial construct of CMS payment policy. In the Medicare program, observation care falls under Part B, exposing patients to both greater financial responsibility and billing complexity through the engagement of their supplemental insurance, even though those receiving observation care experience the same care as if hospitalized— routine monitoring, nursing care, blood draws, imaging, and diagnostic tests. While CMS requires notification of observation status and explanation of the difference in patient financial responsibility, in clinical practice, patient understanding is limited. Policymakers can support both Medicare beneficiaries and hospitals by reexamining observation care as a payment category.
Sheehy and colleagues’ work simultaneously challenges the face validity of the HRRP and the reasonableness of categorizing some inpatient stays as outpatient care in the hospital—issues that policymakers can and should address.
1. Sabbatini AK, Wright B. Excluding observation stays from readmission rates – what quality measures are missing. N Engl J Med. 2018;378(22):2062-2065. https://doi.org/10.1056/NEJMp1800732
2. Sheehy AM, Kaiksow F, Powell WR, et al. The hospital readmissions reduction program’s blind spot: observation hospitalizations. J Hosp Med. 2021;16(7):409-411. https://doi.org/10.12788/jhm.3634
3. The Patient Protection and Affordable Care Act, 42 USC 18001§3025 (2010).
4. Reuben DB, Tinetti ME. The hospital-dependent patient. N Engl J Med. 2014;370(8):694-697. https://doi.org/10.1056/NEJMp1315568
5. Patel N, Slota JM, Miller BJ. The continued conundrum of discharge to a skilled nursing facility after a medicare observation stay. JAMA Health Forum. 2020;1(5):e200577. https://doi.org/10.1001/jamahealthforum.2020.0577
Centers for Medicare and Medicaid Services (CMS)–promulgated quality metrics continue to attract critics. Physicians decry that many metrics are outside their control, while patient groups are frustrated that metrics lack meaning for beneficiaries. The Hospital Readmissions Reduction Program (HRRP) reduces payments for “excess” 30-day risk-standardized readmissions for six conditions and procedures, and may be less effective in reducing readmissions than previously reported due to intentional and increasing use of hospital observation stays.1
In this issue, Sheehy et al2 report that nearly one in five rehospitalizations were unrecognized because either the index hospitalization or the rehospitalization was an observation stay, highlighting yet another challenge with the HRRP. Limitations of their study include the use of a single year of claims data and the exclusion of Medicare Advantage claims data, as one might expect lower readmission rates in this capitated program. Opportunities for improving the HRRP could consist of updating the HRRP metric to include observation stays and, for surgical hospitalizations, extended-stay surgical recovery, wherein patients may be observed for up to 2 days following a procedure. Unfortunately, despite the HRRP missing nearly one in five readmissions, CMS would likely need additional statutory authority from Congress in order to reinterpret the definition of readmission3 to include observation stays.
Challenges with the HRRP metrics raise broader concerns about the program. For decades, administrators viewed readmissions as a utilization metric, only to have the Affordable Care Act re-designate and define all-cause readmissions as a quality metric. Yet hospitals and health systems control only some factors driving readmission. Readmissions occur for a variety of reasons, including not only poor quality of initial hospital care and inadequate care coordination, but also factors that are beyond the hospital’s purview, such as lack of access to ambulatory services, multiple and severe chronic conditions that progress or remain unresponsive to intervention,4 and demographic and social factors such as housing instability, health literacy, or residence in a food desert. These non-hospital factors reside within the domain of other market participants or local, state, and federal government agencies.
Challenges to the utility, validity, and appropriateness of HRRP metrics should remind policymakers of the dangers of over-legislating the details of healthcare policy and the statutory inflexibility that can ensue. Clinical care evolves, and artificial constructs—including payment categories such as observation status—may age poorly over time, exemplified best by the challenges of accessing post-acute care due to the 3-day rule.5 Introduced as a statutory requirement in 1967, when the average length of stay was 13.8 days and observation care did not exist as a payment category, the 3-day rule requires Medicare beneficiaries to spend 3 days admitted to the hospital in order to qualify for coverage of post-acute care, creating care gaps for observation stay patients.
Observation care itself is an artificial construct of CMS payment policy. In the Medicare program, observation care falls under Part B, exposing patients to both greater financial responsibility and billing complexity through the engagement of their supplemental insurance, even though those receiving observation care experience the same care as if hospitalized— routine monitoring, nursing care, blood draws, imaging, and diagnostic tests. While CMS requires notification of observation status and explanation of the difference in patient financial responsibility, in clinical practice, patient understanding is limited. Policymakers can support both Medicare beneficiaries and hospitals by reexamining observation care as a payment category.
Sheehy and colleagues’ work simultaneously challenges the face validity of the HRRP and the reasonableness of categorizing some inpatient stays as outpatient care in the hospital—issues that policymakers can and should address.
1. Sabbatini AK, Wright B. Excluding observation stays from readmission rates – what quality measures are missing. N Engl J Med. 2018;378(22):2062-2065. https://doi.org/10.1056/NEJMp1800732
2. Sheehy AM, Kaiksow F, Powell WR, et al. The hospital readmissions reduction program’s blind spot: observation hospitalizations. J Hosp Med. 2021;16(7):409-411. https://doi.org/10.12788/jhm.3634
3. The Patient Protection and Affordable Care Act, 42 USC 18001§3025 (2010).
4. Reuben DB, Tinetti ME. The hospital-dependent patient. N Engl J Med. 2014;370(8):694-697. https://doi.org/10.1056/NEJMp1315568
5. Patel N, Slota JM, Miller BJ. The continued conundrum of discharge to a skilled nursing facility after a medicare observation stay. JAMA Health Forum. 2020;1(5):e200577. https://doi.org/10.1001/jamahealthforum.2020.0577
© 2021 Society of Hospital Medicine
Hospital Star Ratings and Sociodemographics: A Scoring System in Need of Revision
Still in its infancy, the Hospital Compare overall hospital quality star rating program introduced by the Centers for Medicare & Medicaid Services (CMS) has generated intense industry debate. Individual health systems are microcosms of the challenges of ratings and measurement design. Sibley Memorial Hospital, a member of Johns Hopkins Medicine, is a well-run, 288-bed, community hospital located in a wealthy section of northwest District of Columbia with a five-star rating. In contrast, its academic partner, the Johns Hopkins Hospital, a 1,162-bed hospital with a century-long history of innovation situated in an impoverished Baltimore, Maryland, neighborhood, received a three-star rating.
Hospital ratings are the product of an industry in transition: As care delivery has shifted from an individual provider-driven industry to an increasingly scaled systems enterprise, policymakers implemented regulatory standards targeting quality measurement. Subsequent to the National Academy of Medicine’s 1999 report To Err is Human, policy efforts brought public reporting of quality ratings to multiple market segments, including dialysis facilities (2001), nursing homes (2003), Medicare Advantage plans (2007), and physicians (2015). The hospital industry was no exception, and in 2016—with much controversy1—CMS launched the hospital star ratings program.
CMS Star Ratings for hospitals are based on seven measure groups: mortality, safety, readmission, patient experience, effectiveness, timeliness, and efficient use of medical imaging. Both industry and researchers have decried the challenges of star ratings, noting that hospitals with a narrower scope of services are more likely to receive higher ratings.2 Measure groupings may be further flawed as shown by recent work demonstrating that larger, safety net, or academic hospitals, as well as hospitals offering transplant services, have higher readmission rates,3 which may be caused by differences in patient complexity. Other research has demonstrated that overall quality ratings inappropriately pool all hospitals together, when it may be fairer to initially categorize hospitals and then score them.4
It is within this maelstrom of debate that, in this month’s issue of the Journal of Hospital Medicine, Shi and colleagues explore the relationship between hospital star ratings and the socioeconomic features of the surrounding communities.5 Conducting their analysis by linking multiple reputable government and industry sources, Shi and colleagues found that counties with higher education attainment and a lower proportion of dual Medicare-Medicaid–eligible populations had higher hospital star ratings. Furthermore, a county’s minority population percentage negatively correlated with hospital ratings. Validating the experience of many rural hospital executives—who frequently experience financial challenges—Shi and colleagues noted that rural hospitals were less likely to receive five-star ratings.
Do these findings reflect a true disparity and lack of access to high-quality hospitals, or are they artifactual—secondary to a flawed construct of hospital quality measurement? Many lower-ranking hospitals are urban academic centers frequently providing services not offered at their five-star community counterparts, such as neurosurgery, comprehensive cancer care, and organ transplants, while simultaneously serving as safety net hospitals, research institutions, trauma centers, and national referral centers.
Sociodemographics factor significantly in self-care management for hospital aftercare. Health literacy, access to primary and behavioral healthcare, and transportation all affect star indicators. Recent work6 demonstrated that comprehensive investments in transitional care strategies and the social determinants of health were ineffective at reducing readmissions, which suggests that high readmission rates for hospitals in impoverished areas are not only common, but also may not accurately reflect hospital quality and local investment.
Patient experience is also complicating, with research demonstrating that patient perceptions vary significantly by education, age, primary language, ethnicity, and overall health. For example, one-third of average-ranked hospitals would have rankings vary by at least 18 percentile points when evaluated by Spanish-speaking patients. Star ratings fail to capture and communicate this granularity.7
More concerning is that star ratings inherently assume that hospital performance is being compared across the same tasks, regardless of patient characteristics, local resources, or the scope of services provided, the latter of which may vary between hospitals. For example, communication may differ in both complexity and time intensity: Explaining an antibiotic to the uncomplicated patient with pneumonia differs from prescribing an antibiotic to a patient who is legally blind from optic neuritis, walks with a cane because of multiple sclerosis, and has 24 other prescription medications. Similar challenges exist for differences in local neighborhood resources and for facilities with differing service scope.
Although one strategy to handle these “disparities” in star ratings might be to risk-adjust for social determinants of health, patients may be better served by first rethinking how star ratings are constructed. Clustering hospitals by scope of services provided and geographic region prior to determining star ratings would provide consumers with meaningful information by helping patients compare and make choices among either local or regional hospitals; national quality rankings are unhelpful for patients.
Arguably one of the most complex and person-dependent service enterprises, care delivery presents unique challenges for evaluation of customer experience and medical quality. Hospital star ratings are no exception: We must rethink their construction so they can be more meaningful for both patients and physicians.
Acknowledgments
The authors would like to acknowledge Daniel J Brotman, MD, for his editorial advice and input.
Disclosures
Dr Miller reported consulting for the Federal Trade Commission and serving as a member of the Centers for Medicare & Medicaid Services Medicare Evidence Development Coverage Advisory Committee. Drs Siddiqui and Deutschendorf have nothing to disclose.
1. Whitman E. CMS releases star ratings for hospitals. Modern Healthcare. July 27, 2016. Accessed April 27, 2020. https://www.modernhealthcare.com/article/20160727/NEWS/160729910/cms-releases-star-ratings-for-hospitals
2. Siddiqui ZK, Abusamaan M, Bertram A, et al. Comparison of services available in 5-star and non-5-star patient experience hospital. JAMA Intern Med. 2019;179(10):1429-1430. https://doi.org/10.1001/jamainternmed.2019.1285
3. Hoyer EH, Padula WV, Brotman DJ, et al. Patterns of hospital performance on the hospital-wide 30-day readmission metric: is the playing field level? J Gen Intern Med. 2018;33(1):57-64. https://doi.org/10.1007/s11606-017-4193-9
4. Chung JW, Dahlke AR, Barnard C, DeLancey JO, Merkow RP, Bilimoria KY. The Centers for Medicare and Medicaid Services hospital ratings: pitfalls of grading on a single curve. Health Aff (Millwood). 2019;38(9):1523-1529. https://doi.org/10.1377/hlthaff.2018.05345
5. Shi B, King C, Huang SS. Relationship of hospital star ratings to race, education, and community income. J Hosp Med. 2020;15:588-593. https://doi.org/10.12788/jhm.3393
6. Finkelstein A, Zhou A, Taubman S, Doyle J. Health care hotspotting—a randomized controlled trial. N Engl J Med. 2020;382:152-162. https://doi.org/10.1056/NEJMsa1906848
7. Elliott MN, Lehrman WG, Goldstein E, Hambarsoomian K, Beckett MK, Giordano LA. Do hospitals rank differently on HCAHPS for different patient subgroups? Med Care Res Rev. 2010;67(1):56-73. https://doi.org/10.1177/1077558709339066
Still in its infancy, the Hospital Compare overall hospital quality star rating program introduced by the Centers for Medicare & Medicaid Services (CMS) has generated intense industry debate. Individual health systems are microcosms of the challenges of ratings and measurement design. Sibley Memorial Hospital, a member of Johns Hopkins Medicine, is a well-run, 288-bed, community hospital located in a wealthy section of northwest District of Columbia with a five-star rating. In contrast, its academic partner, the Johns Hopkins Hospital, a 1,162-bed hospital with a century-long history of innovation situated in an impoverished Baltimore, Maryland, neighborhood, received a three-star rating.
Hospital ratings are the product of an industry in transition: As care delivery has shifted from an individual provider-driven industry to an increasingly scaled systems enterprise, policymakers implemented regulatory standards targeting quality measurement. Subsequent to the National Academy of Medicine’s 1999 report To Err is Human, policy efforts brought public reporting of quality ratings to multiple market segments, including dialysis facilities (2001), nursing homes (2003), Medicare Advantage plans (2007), and physicians (2015). The hospital industry was no exception, and in 2016—with much controversy1—CMS launched the hospital star ratings program.
CMS Star Ratings for hospitals are based on seven measure groups: mortality, safety, readmission, patient experience, effectiveness, timeliness, and efficient use of medical imaging. Both industry and researchers have decried the challenges of star ratings, noting that hospitals with a narrower scope of services are more likely to receive higher ratings.2 Measure groupings may be further flawed as shown by recent work demonstrating that larger, safety net, or academic hospitals, as well as hospitals offering transplant services, have higher readmission rates,3 which may be caused by differences in patient complexity. Other research has demonstrated that overall quality ratings inappropriately pool all hospitals together, when it may be fairer to initially categorize hospitals and then score them.4
It is within this maelstrom of debate that, in this month’s issue of the Journal of Hospital Medicine, Shi and colleagues explore the relationship between hospital star ratings and the socioeconomic features of the surrounding communities.5 Conducting their analysis by linking multiple reputable government and industry sources, Shi and colleagues found that counties with higher education attainment and a lower proportion of dual Medicare-Medicaid–eligible populations had higher hospital star ratings. Furthermore, a county’s minority population percentage negatively correlated with hospital ratings. Validating the experience of many rural hospital executives—who frequently experience financial challenges—Shi and colleagues noted that rural hospitals were less likely to receive five-star ratings.
Do these findings reflect a true disparity and lack of access to high-quality hospitals, or are they artifactual—secondary to a flawed construct of hospital quality measurement? Many lower-ranking hospitals are urban academic centers frequently providing services not offered at their five-star community counterparts, such as neurosurgery, comprehensive cancer care, and organ transplants, while simultaneously serving as safety net hospitals, research institutions, trauma centers, and national referral centers.
Sociodemographics factor significantly in self-care management for hospital aftercare. Health literacy, access to primary and behavioral healthcare, and transportation all affect star indicators. Recent work6 demonstrated that comprehensive investments in transitional care strategies and the social determinants of health were ineffective at reducing readmissions, which suggests that high readmission rates for hospitals in impoverished areas are not only common, but also may not accurately reflect hospital quality and local investment.
Patient experience is also complicating, with research demonstrating that patient perceptions vary significantly by education, age, primary language, ethnicity, and overall health. For example, one-third of average-ranked hospitals would have rankings vary by at least 18 percentile points when evaluated by Spanish-speaking patients. Star ratings fail to capture and communicate this granularity.7
More concerning is that star ratings inherently assume that hospital performance is being compared across the same tasks, regardless of patient characteristics, local resources, or the scope of services provided, the latter of which may vary between hospitals. For example, communication may differ in both complexity and time intensity: Explaining an antibiotic to the uncomplicated patient with pneumonia differs from prescribing an antibiotic to a patient who is legally blind from optic neuritis, walks with a cane because of multiple sclerosis, and has 24 other prescription medications. Similar challenges exist for differences in local neighborhood resources and for facilities with differing service scope.
Although one strategy to handle these “disparities” in star ratings might be to risk-adjust for social determinants of health, patients may be better served by first rethinking how star ratings are constructed. Clustering hospitals by scope of services provided and geographic region prior to determining star ratings would provide consumers with meaningful information by helping patients compare and make choices among either local or regional hospitals; national quality rankings are unhelpful for patients.
Arguably one of the most complex and person-dependent service enterprises, care delivery presents unique challenges for evaluation of customer experience and medical quality. Hospital star ratings are no exception: We must rethink their construction so they can be more meaningful for both patients and physicians.
Acknowledgments
The authors would like to acknowledge Daniel J Brotman, MD, for his editorial advice and input.
Disclosures
Dr Miller reported consulting for the Federal Trade Commission and serving as a member of the Centers for Medicare & Medicaid Services Medicare Evidence Development Coverage Advisory Committee. Drs Siddiqui and Deutschendorf have nothing to disclose.
1. Whitman E. CMS releases star ratings for hospitals. Modern Healthcare. July 27, 2016. Accessed April 27, 2020. https://www.modernhealthcare.com/article/20160727/NEWS/160729910/cms-releases-star-ratings-for-hospitals
2. Siddiqui ZK, Abusamaan M, Bertram A, et al. Comparison of services available in 5-star and non-5-star patient experience hospital. JAMA Intern Med. 2019;179(10):1429-1430. https://doi.org/10.1001/jamainternmed.2019.1285
3. Hoyer EH, Padula WV, Brotman DJ, et al. Patterns of hospital performance on the hospital-wide 30-day readmission metric: is the playing field level? J Gen Intern Med. 2018;33(1):57-64. https://doi.org/10.1007/s11606-017-4193-9
4. Chung JW, Dahlke AR, Barnard C, DeLancey JO, Merkow RP, Bilimoria KY. The Centers for Medicare and Medicaid Services hospital ratings: pitfalls of grading on a single curve. Health Aff (Millwood). 2019;38(9):1523-1529. https://doi.org/10.1377/hlthaff.2018.05345
5. Shi B, King C, Huang SS. Relationship of hospital star ratings to race, education, and community income. J Hosp Med. 2020;15:588-593. https://doi.org/10.12788/jhm.3393
6. Finkelstein A, Zhou A, Taubman S, Doyle J. Health care hotspotting—a randomized controlled trial. N Engl J Med. 2020;382:152-162. https://doi.org/10.1056/NEJMsa1906848
7. Elliott MN, Lehrman WG, Goldstein E, Hambarsoomian K, Beckett MK, Giordano LA. Do hospitals rank differently on HCAHPS for different patient subgroups? Med Care Res Rev. 2010;67(1):56-73. https://doi.org/10.1177/1077558709339066
© 2020 Society of Hospital Medicine
Patient Perceptions of Readmission Risk: An Exploratory Survey
Recent years have seen a proliferation of programs designed to prevent readmissions, including patient education initiatives, financial assistance programs, postdischarge services, and clinical personnel assigned to help patients navigate their posthospitalization clinical care. Although some strategies do not require direct patient participation (such as timely and effective handoffs between inpatient and outpatient care teams), many rely upon a commitment by the patient to participate in the postdischarge care plan. At our hospital, we have found that only about 2/3 of patients who are offered transitional interventions (such as postdischarge phone calls by nurses or home nursing through a “transition guide” program) receive the intended interventions, and those who do not receive them are more likely to be readmitted.1 While limited patient uptake may relate, in part, to factors that are difficult to overcome, such as inadequate housing or phone service, we have also encountered patients whose values, beliefs, or preferences about their care do not align with those of the care team. The purposes of this exploratory study were to (1) assess patient attitudes surrounding readmission, (2) ascertain whether these attitudes are associated with actual readmission, and (3) determine whether patients can estimate their own risk of readmission.
METHODS
From January 2014 to September 2016, we circulated surveys to patients on internal medicine nursing units who were being discharged home within 24 hours. Blank surveys were distributed to nursing units by the researchers. Unit clerks and support staff were educated on the purpose of the project and asked to distribute surveys to patients who were identified by unit case managers or nurses as slated for discharge. Staff members were not asked to help with or supervise survey completion. Surveys were generally filled out by patients, but we allowed family members to assist patients if needed, and to indicate so with a checkbox. There were no exclusion criteria. Because surveys were distributed by clinical staff, the received surveys can be considered a convenience sample. Patients were asked 5 questions with 4- or 5-point Likert scale responses:
(1) “How likely is it that you will be admitted to the hospital (have to stay in the hospital overnight) again within the next 30 days after you leave the hospital this time?” [answers ranging from “Very Unlikely (<5% chance)” to “Very Likely (>50% chance)”];
(2) “How would you feel about being rehospitalized in the next month?” [answers ranging from “Very sad, frustrated, or disappointed” to “Very happy or relieved”];
(3) “How much do you think that you personally can control whether or not you will be rehospitalized (based on what you do to take care of your body, take your medicines, and follow-up with your healthcare team)?” [answers ranging from “I have no control over whether I will be rehospitalized” to “I have complete control over whether I will be rehospitalized”];
(4) “Which of the options below best describes how you plan to follow the medical instructions after you leave the hospital?” [answers ranging from “I do NOT plan to do very much of what I am being asked to do by the doctors, nurses, therapists, and other members of the care team” to “I plan to do EVERYTHING I am being asked to do by the doctors, nurses, therapists and other members of the care team”]; and
(5) “Pick the item below that best describes YOUR OWN VIEW of the care team’s recommendations:” [answers ranging from “I DO NOT AGREE AT ALL that the best way to be healthy is to do exactly what I am being asked to do by the doctors, nurses, therapists, and other members of the care team” to “I FULLY AGREE that the best way to be healthy is to do exactly what I am being asked to do by the doctors, nurses, therapists, and other members of the care team”].
Responses were linked, based on discharge date and medical record number, to administrative data, including age, sex, race, payer, and clinical data. Subsequent hospitalizations to our hospital were ascertained from administrative data. We estimated expected risk of readmission using the all payer refined diagnosis related group coupled with the associated severity-of-illness (SOI) score, as we have reported previously.2-5 We restricted our analysis to patients who answered the question related to the likelihood of readmission. Logistic regression models were constructed using actual 30-day readmission as the dependent variable to determine whether patients could predict their own readmissions and whether patient attitudes and beliefs about their care were predictive of subsequent readmission. Patient survey responses were entered as continuous independent variables (ranging from 1-4 or 1-5, as appropriate). Multivariable logistic regression was used to determine whether patients could predict their readmissions independent of demographic variables and expected readmission rate (modeled continuously); we repeated this model after dichotomizing the patient’s estimate of the likelihood of readmission as either “unlikely” or “likely.” Patients with missing survey responses were excluded from individual models without imputation. The study was approved by the Johns Hopkins institutional review board.
RESULTS
Responses were obtained from 895 patients. Their median age was 56 years [interquartile range, 43-67], 51.4% were female, and 41.7% were white. Mean SOI was 2.53 (on a 1-4 scale), and median length-of-stay was representative for our medical service at 5.2 days (range, 1-66 days). Family members reported filling out the survey in 57 cases. The primary payer was Medicare in 40.7%, Medicaid in 24.9%, and other in 34.4%. A total of 138 patients (15.4%) were readmitted within 30 days. The Table shows survey responses and associated readmission rates. None of the attitudes related to readmission were predictive of actual readmission. However, patients were able to predict their own readmissions (P = .002 for linear trend). After adjustment for expected readmission rate, race, sex, age, and payer, the trend remained significant (P = .005). Other significant predictors of readmissions in this model included expected readmission rate (P = .002), age (P = .02), and payer (P = .002). After dichotomizing the patient estimate of readmission rate as “unlikely” (N = 581) or “likely” (N = 314), the unadjusted odds ratio associating a patient-estimated risk of readmission as “likely” with actual readmission was 1.8 (95% confidence interval, 1.2-2.5). The adjusted odds ratio (including the variables above) was 1.6 (1.1-2.4).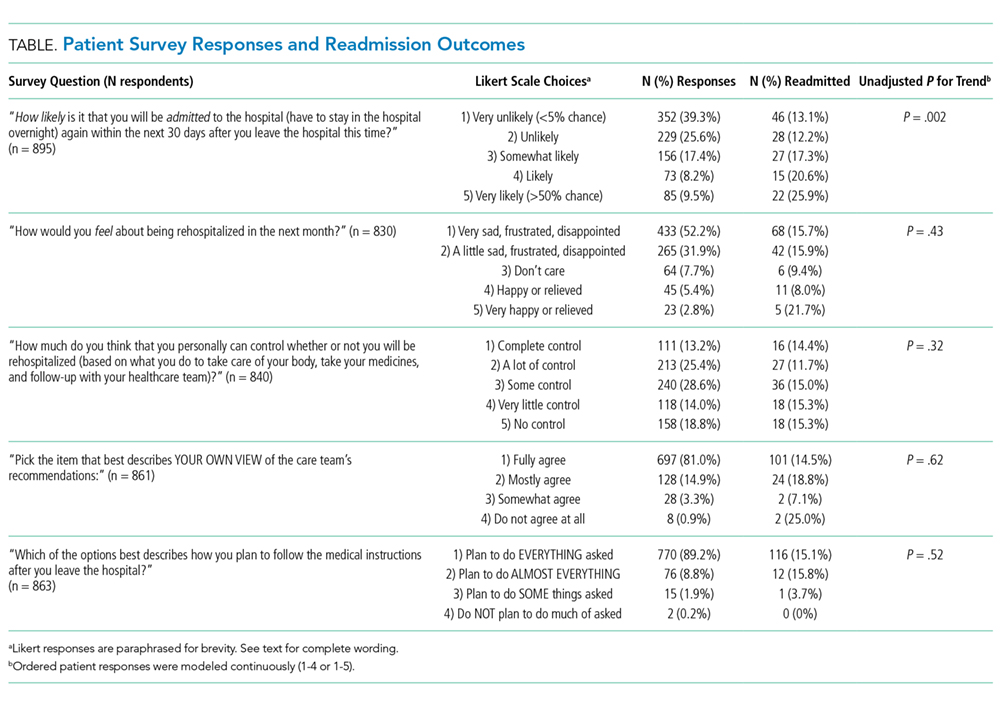
DISCUSSION
Our findings demonstrate that patients are able to quantify their own readmission risk. This was true even after adjustment for expected readmission rate, age, sex, race, and payer. However, we did not identify any patient attitudes, beliefs, or preferences related to readmission or discharge instructions that were associated with subsequent rehospitalization. Reassuringly, more than 80% of patients who responded to the survey indicated that they would be sad, frustrated, or disappointed should readmission occur. This suggests that most patients are invested in preventing rehospitalization. Also reassuring was that patients indicated that they agreed with the discharge care plan and intended to follow their discharge instructions.
The major limitation of this study is that it was a convenience sample. Surveys were distributed inconsistently by nursing unit staff, preventing us from calculating a response rate. Further, it is possible, if not likely, that those patients with higher levels of engagement were more likely to take the time to respond, enriching our sample with activated patients. Although we allowed family members to fill out surveys on behalf of patients, this was done in fewer than 10% of instances; as such, our data may have limited applicability to patients who are physically or cognitively unable to participate in the discharge process. Finally, in this study, we did not capture readmissions to other facilities.
We conclude that patients are able to predict their own readmissions, even after accounting for other potential predictors of readmission. However, we found no evidence to support the possibility that low levels of engagement, limited trust in the healthcare team, or nonchalance about being readmitted are associated with subsequent rehospitalization. Whether asking patients about their perceived risk of readmission might help target readmission prevention programs deserves further study.
Acknowledgments
Dr. Daniel J. Brotman had full access to the data in the study and takes responsibility for the integrity of the study data and the accuracy of the data analysis. The authors also thank the following individuals for their contributions: Drafting the manuscript (Brotman); revising the manuscript for important intellectual content (Brotman, Shihab, Tieu, Cheng, Bertram, Hoyer, Deutschendorf); acquiring the data (Brotman, Shihab, Tieu, Cheng, Bertram, Deutschendorf); interpreting the data (Brotman, Shihab, Tieu, Cheng, Bertram, Hoyer, Deutschendorf); and analyzing the data (Brotman). The authors thank nursing leadership and nursing unit staff for their assistance in distributing surveys.
Funding support: Johns Hopkins Hospitalist Scholars Program
Disclosures: The authors have declared no conflicts of interest.
1. Hoyer EH, Brotman DJ, Apfel A, et al. Improving outcomes after hospitalization: a prospective observational multi-center evaluation of care-coordination strategies on 30-day readmissions to Maryland hospitals. J Gen Int Med. 2017 (in press). PubMed
2. Oduyebo I, Lehmann CU, Pollack CE, et al. Association of self-reported hospital discharge handoffs with 30-day readmissions. JAMA Intern Med. 2013;173(8):624-629. PubMed
3. Hoyer EH, Needham DM, Atanelov L, Knox B, Friedman M, Brotman DJ. Association of impaired functional status at hospital discharge and subsequent rehospitalization. J Hosp Med. 2014;9(5):277-282. PubMed
4. Hoyer EH, Needham DM, Miller J, Deutschendorf A, Friedman M, Brotman DJ. Functional status impairment is associated with unplanned readmissions. Arch Phys Med Rehabil. 2013;94(10):1951-1958. PubMed
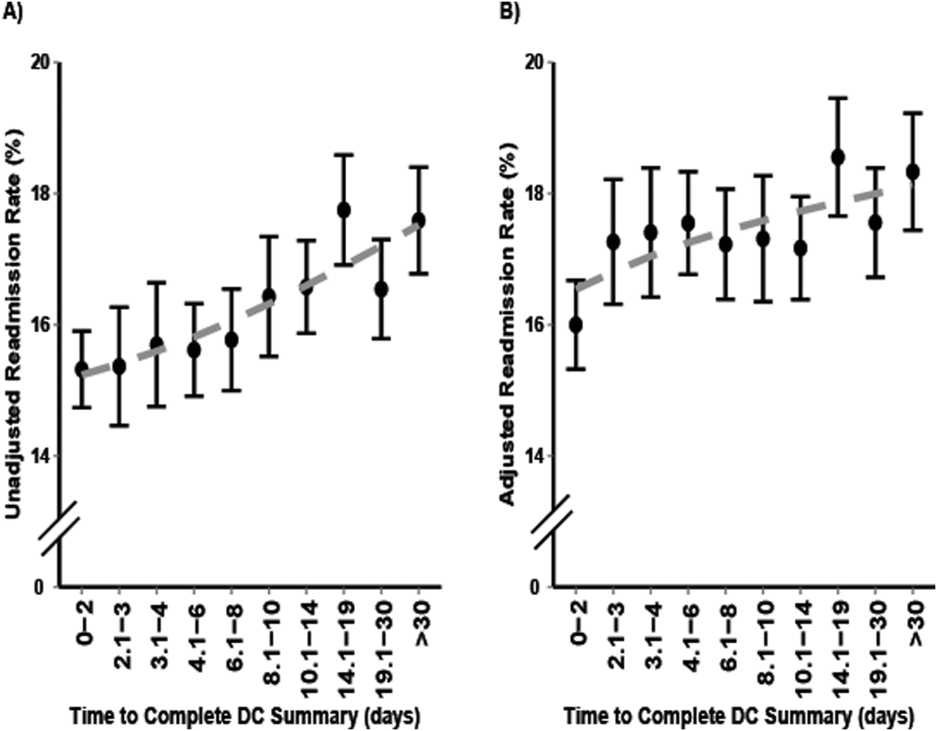
5. Hoyer EH, Odonkor CA, Bhatia SN, Leung C, Deutschendorf A, Brotman DJ. Association between days to complete inpatient discharge summaries with all-payer hospital readmissions in Maryland. J Hosp Med. 2016;11(6):393-400. PubMed
Recent years have seen a proliferation of programs designed to prevent readmissions, including patient education initiatives, financial assistance programs, postdischarge services, and clinical personnel assigned to help patients navigate their posthospitalization clinical care. Although some strategies do not require direct patient participation (such as timely and effective handoffs between inpatient and outpatient care teams), many rely upon a commitment by the patient to participate in the postdischarge care plan. At our hospital, we have found that only about 2/3 of patients who are offered transitional interventions (such as postdischarge phone calls by nurses or home nursing through a “transition guide” program) receive the intended interventions, and those who do not receive them are more likely to be readmitted.1 While limited patient uptake may relate, in part, to factors that are difficult to overcome, such as inadequate housing or phone service, we have also encountered patients whose values, beliefs, or preferences about their care do not align with those of the care team. The purposes of this exploratory study were to (1) assess patient attitudes surrounding readmission, (2) ascertain whether these attitudes are associated with actual readmission, and (3) determine whether patients can estimate their own risk of readmission.
METHODS
From January 2014 to September 2016, we circulated surveys to patients on internal medicine nursing units who were being discharged home within 24 hours. Blank surveys were distributed to nursing units by the researchers. Unit clerks and support staff were educated on the purpose of the project and asked to distribute surveys to patients who were identified by unit case managers or nurses as slated for discharge. Staff members were not asked to help with or supervise survey completion. Surveys were generally filled out by patients, but we allowed family members to assist patients if needed, and to indicate so with a checkbox. There were no exclusion criteria. Because surveys were distributed by clinical staff, the received surveys can be considered a convenience sample. Patients were asked 5 questions with 4- or 5-point Likert scale responses:
(1) “How likely is it that you will be admitted to the hospital (have to stay in the hospital overnight) again within the next 30 days after you leave the hospital this time?” [answers ranging from “Very Unlikely (<5% chance)” to “Very Likely (>50% chance)”];
(2) “How would you feel about being rehospitalized in the next month?” [answers ranging from “Very sad, frustrated, or disappointed” to “Very happy or relieved”];
(3) “How much do you think that you personally can control whether or not you will be rehospitalized (based on what you do to take care of your body, take your medicines, and follow-up with your healthcare team)?” [answers ranging from “I have no control over whether I will be rehospitalized” to “I have complete control over whether I will be rehospitalized”];
(4) “Which of the options below best describes how you plan to follow the medical instructions after you leave the hospital?” [answers ranging from “I do NOT plan to do very much of what I am being asked to do by the doctors, nurses, therapists, and other members of the care team” to “I plan to do EVERYTHING I am being asked to do by the doctors, nurses, therapists and other members of the care team”]; and
(5) “Pick the item below that best describes YOUR OWN VIEW of the care team’s recommendations:” [answers ranging from “I DO NOT AGREE AT ALL that the best way to be healthy is to do exactly what I am being asked to do by the doctors, nurses, therapists, and other members of the care team” to “I FULLY AGREE that the best way to be healthy is to do exactly what I am being asked to do by the doctors, nurses, therapists, and other members of the care team”].
Responses were linked, based on discharge date and medical record number, to administrative data, including age, sex, race, payer, and clinical data. Subsequent hospitalizations to our hospital were ascertained from administrative data. We estimated expected risk of readmission using the all payer refined diagnosis related group coupled with the associated severity-of-illness (SOI) score, as we have reported previously.2-5 We restricted our analysis to patients who answered the question related to the likelihood of readmission. Logistic regression models were constructed using actual 30-day readmission as the dependent variable to determine whether patients could predict their own readmissions and whether patient attitudes and beliefs about their care were predictive of subsequent readmission. Patient survey responses were entered as continuous independent variables (ranging from 1-4 or 1-5, as appropriate). Multivariable logistic regression was used to determine whether patients could predict their readmissions independent of demographic variables and expected readmission rate (modeled continuously); we repeated this model after dichotomizing the patient’s estimate of the likelihood of readmission as either “unlikely” or “likely.” Patients with missing survey responses were excluded from individual models without imputation. The study was approved by the Johns Hopkins institutional review board.
RESULTS
Responses were obtained from 895 patients. Their median age was 56 years [interquartile range, 43-67], 51.4% were female, and 41.7% were white. Mean SOI was 2.53 (on a 1-4 scale), and median length-of-stay was representative for our medical service at 5.2 days (range, 1-66 days). Family members reported filling out the survey in 57 cases. The primary payer was Medicare in 40.7%, Medicaid in 24.9%, and other in 34.4%. A total of 138 patients (15.4%) were readmitted within 30 days. The Table shows survey responses and associated readmission rates. None of the attitudes related to readmission were predictive of actual readmission. However, patients were able to predict their own readmissions (P = .002 for linear trend). After adjustment for expected readmission rate, race, sex, age, and payer, the trend remained significant (P = .005). Other significant predictors of readmissions in this model included expected readmission rate (P = .002), age (P = .02), and payer (P = .002). After dichotomizing the patient estimate of readmission rate as “unlikely” (N = 581) or “likely” (N = 314), the unadjusted odds ratio associating a patient-estimated risk of readmission as “likely” with actual readmission was 1.8 (95% confidence interval, 1.2-2.5). The adjusted odds ratio (including the variables above) was 1.6 (1.1-2.4).
DISCUSSION
Our findings demonstrate that patients are able to quantify their own readmission risk. This was true even after adjustment for expected readmission rate, age, sex, race, and payer. However, we did not identify any patient attitudes, beliefs, or preferences related to readmission or discharge instructions that were associated with subsequent rehospitalization. Reassuringly, more than 80% of patients who responded to the survey indicated that they would be sad, frustrated, or disappointed should readmission occur. This suggests that most patients are invested in preventing rehospitalization. Also reassuring was that patients indicated that they agreed with the discharge care plan and intended to follow their discharge instructions.
The major limitation of this study is that it was a convenience sample. Surveys were distributed inconsistently by nursing unit staff, preventing us from calculating a response rate. Further, it is possible, if not likely, that those patients with higher levels of engagement were more likely to take the time to respond, enriching our sample with activated patients. Although we allowed family members to fill out surveys on behalf of patients, this was done in fewer than 10% of instances; as such, our data may have limited applicability to patients who are physically or cognitively unable to participate in the discharge process. Finally, in this study, we did not capture readmissions to other facilities.
We conclude that patients are able to predict their own readmissions, even after accounting for other potential predictors of readmission. However, we found no evidence to support the possibility that low levels of engagement, limited trust in the healthcare team, or nonchalance about being readmitted are associated with subsequent rehospitalization. Whether asking patients about their perceived risk of readmission might help target readmission prevention programs deserves further study.
Acknowledgments
Dr. Daniel J. Brotman had full access to the data in the study and takes responsibility for the integrity of the study data and the accuracy of the data analysis. The authors also thank the following individuals for their contributions: Drafting the manuscript (Brotman); revising the manuscript for important intellectual content (Brotman, Shihab, Tieu, Cheng, Bertram, Hoyer, Deutschendorf); acquiring the data (Brotman, Shihab, Tieu, Cheng, Bertram, Deutschendorf); interpreting the data (Brotman, Shihab, Tieu, Cheng, Bertram, Hoyer, Deutschendorf); and analyzing the data (Brotman). The authors thank nursing leadership and nursing unit staff for their assistance in distributing surveys.
Funding support: Johns Hopkins Hospitalist Scholars Program
Disclosures: The authors have declared no conflicts of interest.
1. Hoyer EH, Brotman DJ, Apfel A, et al. Improving outcomes after hospitalization: a prospective observational multi-center evaluation of care-coordination strategies on 30-day readmissions to Maryland hospitals. J Gen Int Med. 2017 (in press). PubMed
2. Oduyebo I, Lehmann CU, Pollack CE, et al. Association of self-reported hospital discharge handoffs with 30-day readmissions. JAMA Intern Med. 2013;173(8):624-629. PubMed
3. Hoyer EH, Needham DM, Atanelov L, Knox B, Friedman M, Brotman DJ. Association of impaired functional status at hospital discharge and subsequent rehospitalization. J Hosp Med. 2014;9(5):277-282. PubMed
4. Hoyer EH, Needham DM, Miller J, Deutschendorf A, Friedman M, Brotman DJ. Functional status impairment is associated with unplanned readmissions. Arch Phys Med Rehabil. 2013;94(10):1951-1958. PubMed
5. Hoyer EH, Odonkor CA, Bhatia SN, Leung C, Deutschendorf A, Brotman DJ. Association between days to complete inpatient discharge summaries with all-payer hospital readmissions in Maryland. J Hosp Med. 2016;11(6):393-400. PubMed
© 2018 Society of Hospital Medicine
Reconsidering Hospital Readmission Measures
Hospital readmission rates are a consequential and contentious measure of hospital quality. Readmissions within 30 days of hospital discharge are part of the Centers for Medicare & Medicaid Services (CMS) Value-Based Purchasing Program and are publicly reported. Hospital-wide readmissions and condition-specific readmissions are heavily weighted by US News & World Report in its hospital rankings and in the new CMS Five-Star Quality Rating System.1 However, clinicians and researchers question the construct validity of current readmission measures.2,3
The focus on readmissions began in 2009 when Jencks et al.4 reported that 20% of Medicare patients were readmitted within 30 days after hospital discharge. Policy makers embraced readmission reduction, assuming that a hospital readmission so soon after discharge reflected poor quality of hospital care and that, with focused efforts, hospitals could reduce readmissions and save CMS money. In 2010, the Affordable Care Act introduced an initiative to reduce readmissions and, in 2012, the Hospital Readmission Reduction Program was implemented, financially penalizing hospitals with higher-than-expected readmission rates for patients hospitalized with principal diagnoses of heart failure, myocardial infarction, and pneumonia.5 Readmission measures have since proliferated and now include pay-for-performance metrics for hospitalizations for chronic obstructive pulmonary disease (COPD), coronary artery bypass grafting, and total hip or knee arthroplasty. Measures are also reported for stroke patients and for “hospital-wide readmissions,” a catch-all measure intended to capture readmission rates across most diagnoses, with various exclusions intended to prevent counting planned readmissions (eg, hospitalization for cholecystectomy following a hospitalization for cholecystitis). These measures use claims data to construct hierarchical regression models at the patient and hospital levels, assuming that variation among readmission rates are due to hospital quality effects. The goal of this approach is to level the playing field to avoid penalizing hospitals for caring for sicker patients who are at higher risk for readmission for reasons unrelated to hospital care. Yet hospital readmissions are influenced by a complex set of variables that go well beyond hospital care, some of which may be better captured by existing models than others. Below we review several potential biases in the hospital readmission measures and offer policy recommendations to improve the accuracy of these measures.
Variation in a quality measure is influenced by the quality of the underlying data, the mix of patients served, bias in the performance measure, and the degree of systemic or random error.6 Hospital readmission rates are subject to multiple sources of variation, and true differences in the quality of care are often a much smaller source of this variation. A recent analysis of patient readmissions following general surgery found that the majority were unrelated to suboptimal medical care.7 Consider 3 scenarios in which a patient with COPD is readmitted 22 days after discharge. In hospital 1, the patient was discharged without a prescription for a steroid inhaler. In hospital 2, the patient was discharged on a steroid inhaler, filled the prescription, and elected not to use it. In hospital 3, the patient was discharged on a steroid inhaler and was provided medical assistance to fill the prescription but still could not afford the $15 copay. In all 3 scenarios, the hospital would be equally culpable under the current readmission measures, suffering financial and reputational penalties.
Yet the hospitals in these scenarios are not equally culpable. Variation in the mix of patients and bias in the measure impacted performance. Hospital 1 should clearly be held accountable for the readmission. In the cases of hospitals 2 and 3, the situations are more nuanced. More education about COPD, financial investment by the hospital to cover a copay, or a different transitional care approach may have increased the likelihood of patient compliance, but, ultimately, hospitals 2 and 3 were impacted by personal health behaviors and access to public health services and financial assistance, and the readmissions were less within their control.8
To be valid, hospital readmission measures would need to ensure that all hospitals are similar in patient characteristics and in the need for an availability of public health services. Yet these factors vary among hospitals and cannot be accounted for by models that rely exclusively on patient-level variables, such as the nature and severity of illness. As a result, the existing readmission measures are biased against certain types of hospitals. Hospitals that treat a greater proportion of patients who are socioeconomically disadvantaged; who lack access to primary care, medical assistance, or public health programs; and who have substance abuse and mental health issues will have higher readmission rates. Hospitals that care for patients who fail initial treatments and require referral for complex care will also have higher readmission rates. These types of patients are not randomly distributed throughout our healthcare system. They are clustered at rural hospitals in underserved areas, certain urban health systems, safety net hospitals, and academic health centers. It is not surprising that readmission penalties have most severely impacted large academic hospitals that care for disadvantaged populations.2 These penalties may have unintended consequences, reducing a hospital’s willingness to care for disadvantaged populations.
While these biases may unfairly harm hospitals caring for disadvantaged patients, the readmission measures may also indirectly harm patients. Low hospital readmission rates are not associated with reduced mortality and, in some instances, track with higher mortality.9-11 This may result from measurement factors (patients who die cannot be readmitted), from neighborhood socioeconomic status (SES) factors that may impact readmissions more,12 or from actual patient harm (some patients need acute care following discharge and may have worse outcomes if that care is delayed).11 Doctors have long recognized this potential risk; empiric evidence now supports them. While mortality measures may also be impacted by sociodemographic variables,13 whether to adjust for SES should be defined by the purpose of the measure. If the measure is meant to evaluate hospital quality (or utilization in the case of readmissions), adjusting for SES is appropriate because it is unrealistic to expect a health system to reduce income inequality and provide safe housing. Failure to adjust for SES, which has a large impact on outcomes, may mask a quality of care issue. Conversely, if the purpose of a measure is for a community to improve population health, then it should not be adjusted for SES because the community could adjust for income inequality.
Despite the complex ethical challenges created by the efforts to reduce readmissions, there has been virtually no public dialogue with patients, physicians, and policy makers regarding how to balance the trade-offs between reducing readmission and maintaining safety. Patients would likely value increased survival more than reduced readmissions, yet the current CMS Five-Star Rating System for hospital quality weighs readmissions equally with mortality in its hospital rankings, potentially misinforming patients. For example, many well-known academic medical centers score well (4 or 5 stars) on mortality and poorly (1 or 2 stars) on readmissions, resulting in a low or average overall score, calling into question face validity and confounding consumers struggling to make decisions about where to seek care. The Medicare Payment Advisory Commission’s Report to the Congress14 highlights the multiple significant systematic and random errors with the hospital readmission data.
Revisiting the Hospital Readmission Measures
Given significant bias in the hospital readmission measures and the ethical challenges imposed by reducing readmissions, potentially at the expense of survival, we believe CMS needs to take action to remedy the problem. First, CMS should drop hospital readmissions as a quality measure from its hospital rankings. Other hospital-rating groups and insurers should do the same. When included in payment schemes, readmissions should not be construed as a quality measure but as a utilization measure, like length of stay.
Second, the Department of Health & Human Services (HHS) should invest in maturing the hospital readmission measures to ensure construct, content, and criterion validity and reliability. No doubt the risk adjustment is complex and may be inherently limited using Medicare claims data. In the case of SES adjustment, for example, limited numbers of SES measures can be constructed from current data sources.8,13 There are other approaches to address this recommendation. For example, HHS could define a preventable readmission as one linked to some process or outcome of hospital care, such as whether the patient was discharged on an inhaler. The National Quality Forum used this approach to define a preventable venous thromboembolic event as one occurring when a patient did not receive appropriate prophylaxis. In this way, only hospital 1 in the 3 scenarios for the patient with COPD would be penalized. However, we recognize that it is not always simple to define specific process measures (eg, prescribing an inhaler) that link to readmission outcomes and that there may be other important yet hard-to-measure interventions (eg, patient and family education) that are important components of patient-centered care and readmission prevention. This is why readmissions are so challenging as a quality measure. If experts cannot define clinician behaviors that have a strong theory of change or are causally related to reduced readmissions, it is hard to call readmissions a modifiable quality measure. Another potential strategy to level the playing field would be to compare readmission rates across peer institutions only. For instance, tertiary-care safety net hospitals would be compared to one another and rural community hospitals would be compared to one another.14 Lastly, new data sources could be added to account for the social, community-level, public health, and personal health factors that heavily influence a patient’s risk for readmission, in addition to hospital-level factors. Appropriate methods will be needed to develop statistical models for risk adjustment; however, this is a complex topic and beyond the scope of the current paper.
Third, HHS could continue to use the current readmission measures as population health measures while supporting multistakeholder teams to better understand how people and their communities, public health agencies, insurers, and healthcare providers can collaborate to help patients thrive and avoid readmissions by addressing true defects in care and care coordination.
While it is understandable why policy makers chose to focus on hospital readmissions, and while we recognize that concerns about the measures were unknown when they were created, emerging evidence demonstrates that the current readmission measures (particularly when used as a quality metric) lack construct validity, contain significant bias and systematic errors, and create ethical tension by rewarding hospitals both financially and reputationally for turning away sick and socially disadvantaged patients who may, consequently, have adverse outcomes. Current readmission measures need to be reconsidered.
Acknowledgments
The authors thank Christine G. Holzmueller, BLA, with the Armstrong Institute for Patient Safety and Quality, Johns Hopkins Medicine, for her assistance in editing the manuscript and preparing it for journal submission.
Disclosure
Dr. Pronovost errs on the side of full disclosure and reports receiving grant or contract support from the Agency for Healthcare Research and Quality, the Gordon and Betty Moore Foundation (research related to patient safety and quality of care), the National Institutes of Health (acute lung injury research), and the American Medical Association Inc. (improve blood pressure control); honoraria from various healthcare organizations for speaking on patient safety and quality (the Leigh Bureau manages engagements); book royalties from the Penguin Group for his book Safe Patients, Smart Hospitals; and was receiving stock and fees to serve as a director for Cantel Medical up until 24 months ago. Dr. Pronovost is a founder of Patient Doctor Technologies, a startup company that seeks to enhance the partnership between patients and clinicians with an application called Doctella. Dr. Brotman, Dr. Hoyer, and Ms. Deutschendorf report no relevant conflicts of interest.
1. Centers for Medicare & Medicaid Services. Five-star quality rating system. https://www.cms.gov/medicare/provider-enrollment-and-certification/certificationandcomplianc/fsqrs.html. Accessed October 11, 2016.
2. Joynt KE, Jha AK. Characteristics of hospitals receiving penalties under the Hospital Readmissions Reduction Program. JAMA. 2013;309(4):342-343. PubMed
3. Boozary AS, Manchin J, 3rd, Wicker RF. The Medicare Hospital Readmissions Reduction Program: time for reform. JAMA. 2015;314(4):347-348. PubMed
4. Jencks SF, Williams MV, Coleman EA. Rehospitalizations among patients in the Medicare fee-for-service program. N Engl J Med. 2009;360(14):1418-1428. PubMed
5. Centers for Medicare & Medicaid Services. Readmissions Reduction Program (HRRP). https://www.cms.gov/medicare/medicare-fee-for-service-payment/acuteinpatientpps/readmissions-reduction-program.html. Accessed April 12, 2017.
6. Parker C, Schwamm LH, Fonarow GC, Smith EE, Reeves MJ. Stroke quality metrics: systematic reviews of the relationships to patient-centered outcomes and impact of public reporting. Stroke. 2012;43(1):155-162. PubMed
7. McIntyre LK, Arbabi S, Robinson EF, Maier RV. Analysis of risk factors for patient readmission 30 days following discharge from general surgery. JAMA Surg. 2016;151(9):855-861. PubMed
8. Sheingold SH, Zuckerman R, Shartzer A. Understanding Medicare hospital readmission rates and differing penalties between safety-net and other hospitals. Health Aff (Millwood). 2016;35(1):124-131. PubMed
9. Brotman DJ, Hoyer EH, Leung C, Lepley D, Deutschendorf A. Associations between hospital-wide readmission rates and mortality measures at the hospital level: are hospital-wide readmissions a measure of quality? J Hosp Med. 2016;11(9):650-651. PubMed
10. Krumholz HM, Lin Z, Keenan PS, et al. Relationship between hospital readmission and mortality rates for patients hospitalized with acute myocardial infarction, heart failure, or pneumonia. JAMA. 2013;309(6):587-593. PubMed
11. Fan VS, Gaziano JM, Lew R, et al. A comprehensive care management program to prevent chronic obstructive pulmonary disease hospitalizations: a randomized, controlled trial. Ann Intern Med. 2012;156(10):673-683. PubMed
12. Bikdeli B, Wayda B, Bao H, et al. Place of residence and outcomes of patients with heart failure: analysis from the Telemonitoring to Improve Heart Failure Outcomes Trial. Circ Cardiovasc Qual Outcomes. 2014;7(5):749-756. PubMed
13. Bernheim SM, Parzynski CS, Horwitz L, et al. Accounting for patients’ socioeconomic status does not change hospital readmission rates. Health Aff (Millwood). 2016;35(8):1461-1470. PubMed
14. Medicare Payment Advisory Commission. Refining the Hospital Readmissions Reduction Program. In: Report to the Congress: Medicare and the Health Care Delivery System, Chapter 4. June 2013. PubMed
Hospital readmission rates are a consequential and contentious measure of hospital quality. Readmissions within 30 days of hospital discharge are part of the Centers for Medicare & Medicaid Services (CMS) Value-Based Purchasing Program and are publicly reported. Hospital-wide readmissions and condition-specific readmissions are heavily weighted by US News & World Report in its hospital rankings and in the new CMS Five-Star Quality Rating System.1 However, clinicians and researchers question the construct validity of current readmission measures.2,3
The focus on readmissions began in 2009 when Jencks et al.4 reported that 20% of Medicare patients were readmitted within 30 days after hospital discharge. Policy makers embraced readmission reduction, assuming that a hospital readmission so soon after discharge reflected poor quality of hospital care and that, with focused efforts, hospitals could reduce readmissions and save CMS money. In 2010, the Affordable Care Act introduced an initiative to reduce readmissions and, in 2012, the Hospital Readmission Reduction Program was implemented, financially penalizing hospitals with higher-than-expected readmission rates for patients hospitalized with principal diagnoses of heart failure, myocardial infarction, and pneumonia.5 Readmission measures have since proliferated and now include pay-for-performance metrics for hospitalizations for chronic obstructive pulmonary disease (COPD), coronary artery bypass grafting, and total hip or knee arthroplasty. Measures are also reported for stroke patients and for “hospital-wide readmissions,” a catch-all measure intended to capture readmission rates across most diagnoses, with various exclusions intended to prevent counting planned readmissions (eg, hospitalization for cholecystectomy following a hospitalization for cholecystitis). These measures use claims data to construct hierarchical regression models at the patient and hospital levels, assuming that variation among readmission rates are due to hospital quality effects. The goal of this approach is to level the playing field to avoid penalizing hospitals for caring for sicker patients who are at higher risk for readmission for reasons unrelated to hospital care. Yet hospital readmissions are influenced by a complex set of variables that go well beyond hospital care, some of which may be better captured by existing models than others. Below we review several potential biases in the hospital readmission measures and offer policy recommendations to improve the accuracy of these measures.
Variation in a quality measure is influenced by the quality of the underlying data, the mix of patients served, bias in the performance measure, and the degree of systemic or random error.6 Hospital readmission rates are subject to multiple sources of variation, and true differences in the quality of care are often a much smaller source of this variation. A recent analysis of patient readmissions following general surgery found that the majority were unrelated to suboptimal medical care.7 Consider 3 scenarios in which a patient with COPD is readmitted 22 days after discharge. In hospital 1, the patient was discharged without a prescription for a steroid inhaler. In hospital 2, the patient was discharged on a steroid inhaler, filled the prescription, and elected not to use it. In hospital 3, the patient was discharged on a steroid inhaler and was provided medical assistance to fill the prescription but still could not afford the $15 copay. In all 3 scenarios, the hospital would be equally culpable under the current readmission measures, suffering financial and reputational penalties.
Yet the hospitals in these scenarios are not equally culpable. Variation in the mix of patients and bias in the measure impacted performance. Hospital 1 should clearly be held accountable for the readmission. In the cases of hospitals 2 and 3, the situations are more nuanced. More education about COPD, financial investment by the hospital to cover a copay, or a different transitional care approach may have increased the likelihood of patient compliance, but, ultimately, hospitals 2 and 3 were impacted by personal health behaviors and access to public health services and financial assistance, and the readmissions were less within their control.8
To be valid, hospital readmission measures would need to ensure that all hospitals are similar in patient characteristics and in the need for an availability of public health services. Yet these factors vary among hospitals and cannot be accounted for by models that rely exclusively on patient-level variables, such as the nature and severity of illness. As a result, the existing readmission measures are biased against certain types of hospitals. Hospitals that treat a greater proportion of patients who are socioeconomically disadvantaged; who lack access to primary care, medical assistance, or public health programs; and who have substance abuse and mental health issues will have higher readmission rates. Hospitals that care for patients who fail initial treatments and require referral for complex care will also have higher readmission rates. These types of patients are not randomly distributed throughout our healthcare system. They are clustered at rural hospitals in underserved areas, certain urban health systems, safety net hospitals, and academic health centers. It is not surprising that readmission penalties have most severely impacted large academic hospitals that care for disadvantaged populations.2 These penalties may have unintended consequences, reducing a hospital’s willingness to care for disadvantaged populations.
While these biases may unfairly harm hospitals caring for disadvantaged patients, the readmission measures may also indirectly harm patients. Low hospital readmission rates are not associated with reduced mortality and, in some instances, track with higher mortality.9-11 This may result from measurement factors (patients who die cannot be readmitted), from neighborhood socioeconomic status (SES) factors that may impact readmissions more,12 or from actual patient harm (some patients need acute care following discharge and may have worse outcomes if that care is delayed).11 Doctors have long recognized this potential risk; empiric evidence now supports them. While mortality measures may also be impacted by sociodemographic variables,13 whether to adjust for SES should be defined by the purpose of the measure. If the measure is meant to evaluate hospital quality (or utilization in the case of readmissions), adjusting for SES is appropriate because it is unrealistic to expect a health system to reduce income inequality and provide safe housing. Failure to adjust for SES, which has a large impact on outcomes, may mask a quality of care issue. Conversely, if the purpose of a measure is for a community to improve population health, then it should not be adjusted for SES because the community could adjust for income inequality.
Despite the complex ethical challenges created by the efforts to reduce readmissions, there has been virtually no public dialogue with patients, physicians, and policy makers regarding how to balance the trade-offs between reducing readmission and maintaining safety. Patients would likely value increased survival more than reduced readmissions, yet the current CMS Five-Star Rating System for hospital quality weighs readmissions equally with mortality in its hospital rankings, potentially misinforming patients. For example, many well-known academic medical centers score well (4 or 5 stars) on mortality and poorly (1 or 2 stars) on readmissions, resulting in a low or average overall score, calling into question face validity and confounding consumers struggling to make decisions about where to seek care. The Medicare Payment Advisory Commission’s Report to the Congress14 highlights the multiple significant systematic and random errors with the hospital readmission data.
Revisiting the Hospital Readmission Measures
Given significant bias in the hospital readmission measures and the ethical challenges imposed by reducing readmissions, potentially at the expense of survival, we believe CMS needs to take action to remedy the problem. First, CMS should drop hospital readmissions as a quality measure from its hospital rankings. Other hospital-rating groups and insurers should do the same. When included in payment schemes, readmissions should not be construed as a quality measure but as a utilization measure, like length of stay.
Second, the Department of Health & Human Services (HHS) should invest in maturing the hospital readmission measures to ensure construct, content, and criterion validity and reliability. No doubt the risk adjustment is complex and may be inherently limited using Medicare claims data. In the case of SES adjustment, for example, limited numbers of SES measures can be constructed from current data sources.8,13 There are other approaches to address this recommendation. For example, HHS could define a preventable readmission as one linked to some process or outcome of hospital care, such as whether the patient was discharged on an inhaler. The National Quality Forum used this approach to define a preventable venous thromboembolic event as one occurring when a patient did not receive appropriate prophylaxis. In this way, only hospital 1 in the 3 scenarios for the patient with COPD would be penalized. However, we recognize that it is not always simple to define specific process measures (eg, prescribing an inhaler) that link to readmission outcomes and that there may be other important yet hard-to-measure interventions (eg, patient and family education) that are important components of patient-centered care and readmission prevention. This is why readmissions are so challenging as a quality measure. If experts cannot define clinician behaviors that have a strong theory of change or are causally related to reduced readmissions, it is hard to call readmissions a modifiable quality measure. Another potential strategy to level the playing field would be to compare readmission rates across peer institutions only. For instance, tertiary-care safety net hospitals would be compared to one another and rural community hospitals would be compared to one another.14 Lastly, new data sources could be added to account for the social, community-level, public health, and personal health factors that heavily influence a patient’s risk for readmission, in addition to hospital-level factors. Appropriate methods will be needed to develop statistical models for risk adjustment; however, this is a complex topic and beyond the scope of the current paper.
Third, HHS could continue to use the current readmission measures as population health measures while supporting multistakeholder teams to better understand how people and their communities, public health agencies, insurers, and healthcare providers can collaborate to help patients thrive and avoid readmissions by addressing true defects in care and care coordination.
While it is understandable why policy makers chose to focus on hospital readmissions, and while we recognize that concerns about the measures were unknown when they were created, emerging evidence demonstrates that the current readmission measures (particularly when used as a quality metric) lack construct validity, contain significant bias and systematic errors, and create ethical tension by rewarding hospitals both financially and reputationally for turning away sick and socially disadvantaged patients who may, consequently, have adverse outcomes. Current readmission measures need to be reconsidered.
Acknowledgments
The authors thank Christine G. Holzmueller, BLA, with the Armstrong Institute for Patient Safety and Quality, Johns Hopkins Medicine, for her assistance in editing the manuscript and preparing it for journal submission.
Disclosure
Dr. Pronovost errs on the side of full disclosure and reports receiving grant or contract support from the Agency for Healthcare Research and Quality, the Gordon and Betty Moore Foundation (research related to patient safety and quality of care), the National Institutes of Health (acute lung injury research), and the American Medical Association Inc. (improve blood pressure control); honoraria from various healthcare organizations for speaking on patient safety and quality (the Leigh Bureau manages engagements); book royalties from the Penguin Group for his book Safe Patients, Smart Hospitals; and was receiving stock and fees to serve as a director for Cantel Medical up until 24 months ago. Dr. Pronovost is a founder of Patient Doctor Technologies, a startup company that seeks to enhance the partnership between patients and clinicians with an application called Doctella. Dr. Brotman, Dr. Hoyer, and Ms. Deutschendorf report no relevant conflicts of interest.
1. Centers for Medicare & Medicaid Services. Five-star quality rating system. https://www.cms.gov/medicare/provider-enrollment-and-certification/certificationandcomplianc/fsqrs.html. Accessed October 11, 2016.
2. Joynt KE, Jha AK. Characteristics of hospitals receiving penalties under the Hospital Readmissions Reduction Program. JAMA. 2013;309(4):342-343. PubMed
3. Boozary AS, Manchin J, 3rd, Wicker RF. The Medicare Hospital Readmissions Reduction Program: time for reform. JAMA. 2015;314(4):347-348. PubMed
4. Jencks SF, Williams MV, Coleman EA. Rehospitalizations among patients in the Medicare fee-for-service program. N Engl J Med. 2009;360(14):1418-1428. PubMed
5. Centers for Medicare & Medicaid Services. Readmissions Reduction Program (HRRP). https://www.cms.gov/medicare/medicare-fee-for-service-payment/acuteinpatientpps/readmissions-reduction-program.html. Accessed April 12, 2017.
6. Parker C, Schwamm LH, Fonarow GC, Smith EE, Reeves MJ. Stroke quality metrics: systematic reviews of the relationships to patient-centered outcomes and impact of public reporting. Stroke. 2012;43(1):155-162. PubMed
7. McIntyre LK, Arbabi S, Robinson EF, Maier RV. Analysis of risk factors for patient readmission 30 days following discharge from general surgery. JAMA Surg. 2016;151(9):855-861. PubMed
8. Sheingold SH, Zuckerman R, Shartzer A. Understanding Medicare hospital readmission rates and differing penalties between safety-net and other hospitals. Health Aff (Millwood). 2016;35(1):124-131. PubMed
9. Brotman DJ, Hoyer EH, Leung C, Lepley D, Deutschendorf A. Associations between hospital-wide readmission rates and mortality measures at the hospital level: are hospital-wide readmissions a measure of quality? J Hosp Med. 2016;11(9):650-651. PubMed
10. Krumholz HM, Lin Z, Keenan PS, et al. Relationship between hospital readmission and mortality rates for patients hospitalized with acute myocardial infarction, heart failure, or pneumonia. JAMA. 2013;309(6):587-593. PubMed
11. Fan VS, Gaziano JM, Lew R, et al. A comprehensive care management program to prevent chronic obstructive pulmonary disease hospitalizations: a randomized, controlled trial. Ann Intern Med. 2012;156(10):673-683. PubMed
12. Bikdeli B, Wayda B, Bao H, et al. Place of residence and outcomes of patients with heart failure: analysis from the Telemonitoring to Improve Heart Failure Outcomes Trial. Circ Cardiovasc Qual Outcomes. 2014;7(5):749-756. PubMed
13. Bernheim SM, Parzynski CS, Horwitz L, et al. Accounting for patients’ socioeconomic status does not change hospital readmission rates. Health Aff (Millwood). 2016;35(8):1461-1470. PubMed
14. Medicare Payment Advisory Commission. Refining the Hospital Readmissions Reduction Program. In: Report to the Congress: Medicare and the Health Care Delivery System, Chapter 4. June 2013. PubMed
© 2017 Society of Hospital Medicine
Readmission Rates and Mortality Measures
The Centers for Medicare & Medicaid Services (CMS) have sought to reduce readmissions in the 30 days following hospital discharge through penalties applied to hospitals with readmission rates that are higher than expected. Expected readmission rates for Medicare fee‐for‐service beneficiaries are calculated from models that use patient‐level administrative data to account for patient morbidities. Readmitted patients are defined as those who are discharged from the hospital alive and then rehospitalized at any acute care facility within 30 days of discharge. These models explicitly exclude sociodemographic variables that may impact quality of and access to outpatient care. Specific exclusions are also applied based on diagnosis codes so as to avoid penalizing hospitals for rehospitalizations that are likely to have been planned.
More recently, a hospital‐wide readmission measure has been developed, which seeks to provide a comprehensive view of each hospital's readmission rate by including the vast majority of Medicare patients. Like the condition‐specific readmission measures, the hospital‐wide readmission measure also excludes sociodemographic variables and incorporates specific condition‐based exclusions so as to avoid counting planned rehospitalizations (e.g., an admission for cholecystectomy following an admission for biliary sepsis). Although not currently used for pay‐for‐performance, this measure has been included in the CMS Star Report along with other readmission measures.[1] CMS does not currently disseminate a hospital‐wide mortality measure, but does disseminate hospital‐level adjusted 30‐day mortality rates for Medicare beneficiaries with discharge diagnoses of stroke, heart failure, myocardial infarction (MI), chronic obstructive pulmonary disease (COPD) and pneumonia, and principal procedure of coronary artery bypass grafting (CABG).
It is conceivable that aggressive efforts to reduce readmissions might delay life‐saving acute care in some scenarios,[2] and there is prior evidence that heart failure readmissions are inversely (but weakly) related to heart failure mortality.[3] It is also plausible that keeping tenuous patients alive until discharge might result in higher readmission rates. We sought to examine the relationship between hospital‐wide adjusted 30‐day readmissions and death rates across the acute care hospitals in the United States. Lacking a measure of hospital‐wide death rates, we examined the relation between hospital‐wide readmissions and each of the 6 condition‐specific mortality measures. For comparison, we also examined the relationships between condition‐specific readmission rates and mortality rates.
METHODS
We used publically available data published by CMS from July 1, 2011 through June 30, 2014.[4] These data are provided at the hospital level, without any patient‐level data. We included 4452 acute care facilities based on having hospital‐wide readmission rates, but not all facilities contributed data for each mortality measure. We excluded from analysis on a measure‐by‐measure basis those facilities for which outcomes were absent, without imputing missing outcome measures, because low volume of a given condition was the main reason for not reporting a measure. For each mortality measure, we constructed a logistic regression model to quantify the odds of performing in the lowest (best) mortality tertile as a function of hospital‐wide readmission tertile. To account for patient volumes, we included in each model the number of eligible patients at each hospital with the specified condition. We repeated these analyses using condition‐specific readmission rates (rather than the hospital‐wide readmission rates) as the independent variable. Specifications for CMS models for mortality and readmissions are publically available.[5]
RESULTS
After adjustment for patient volumes, hospitals in the highest hospital‐wide readmission tertile were more likely to perform in the lowest (best) mortality tertile for 3 of the 6 mortality measures: heart failure, COPD, and stroke (P < 0.001 for all). For MI, CABG and pneumonia, there was no significant association between high hospital‐wide readmission rates and low mortality (Table 1). Using condition‐specific readmission rates, there remained an inverse association between readmissions and mortality for heart failure and stroke, but not for COPD. In contrast, hospitals with the highest CABG‐specific readmission rates were significantly less likely to have low CABG‐specific mortality (P < 0.001).
| Hospital‐Wide Readmission Rate Tertile [Range of Adjusted Readmission Rates, %]* | |||
|---|---|---|---|
|
1st Tertile, n = 1359 [11.3%‐14.8%], Adjusted Odds Ratio (95% CI) |
2nd Tertile, n = 1785 [14.9%‐15.5%], Adjusted Odds Ratio (95% CI) |
3rd Tertile, n = 1308 [15.6%‐19.8%], Adjusted Odds Ratio (95% CI) |
|
| |||
| Mortality measure (no. of hospitals reporting) | |||
| Acute myocardial infarction (n = 2415) | 1.00 (referent) | 0.88 (0.711.09) | 1.02 (0.831.25) |
| Pneumonia (n = 4067) | 1.00 (referent) | 0.83 (0.710.98) | 1.11 (0.941.31) |
| Heart failure (n = 3668) | 1.00 (referent) | 1.21 (1.021.45) | 1.94 (1.632.30) |
| Stroke (n = 2754) | 1.00 (referent) | 1.13 (0.931.38) | 1.48 (1.221.79) |
| Chronic obstructive pulmonary disease (n = 3633) | 1.00 (referent) | 1.12 (0.951.33) | 1.73 (1.462.05) |
| Coronary artery bypass (n = 1058) | 1.00 (referent) | 0.87 (0.631.19) | 0.99 (0.741.34) |
| Condition‐specific readmission rate tertile | |||
| Mortality measure | |||
| Acute myocardial infarction | 1.00 (referent) | 0.88 (0.711.08) | 0.79 (0.640.99) |
| Pneumonia | 1.00 (referent) | 0.91 (0.781.07) | 0.89 (0.761.04) |
| Heart failure | 1.00 (referent) | 1.15 (0.961.36) | 1.56 (1.311.86) |
| Stroke | 1.00 (referent) | 1.65 (1.342.03) | 1.70 (1.232.35) |
| Chronic obstructive pulmonary disease | 1.00 (referent) | 0.83 (0.700.98) | 0.84 (0.710.99) |
| Coronary artery bypass | 1.00 (referent) | 0.59 (0.440.80) | 0.47 (0.340.64) |
DISCUSSION
We found that higher hospital‐wide readmission rates were associated with lower mortality at the hospital level for 3 of the 6 mortality measures we examined. The findings for heart failure parallel the findings of Krumholz and colleagues who examined 3 of these 6 measures (MI, pneumonia, and heart failure) in relation to readmissions for these specific populations.[3] This prior analysis, however, did not include the 3 more recently reported mortality measures (COPD, stroke, and CABG) and did not use hospital‐wide readmissions.
Causal mechanisms underlying the associations between mortality and readmission at the hospital level deserve further exploration. It is certainly possible that global efforts to keep patients out of the hospital might, in some instances, place patients at risk by delaying necessary acute care.[2] It is also possible that unmeasured variables, particularly access to hospice and palliative care services that might facilitate good deaths, could be associated with both reduced readmissions and higher death rates. Additionally, because deceased patients cannot be readmitted, one might expect that readmissions and mortality might be inversely associated, particularly for conditions with a high postdischarge mortality rate. Similarly, a hospital that does a particularly good job keeping chronically ill patients alive until discharge might exhibit a higher readmission rate than a hospital that is less adept at keeping tenuous patients alive until discharge.
Regardless of the mechanisms of these findings, we present these data to raise the concern that using readmission rates, particularly hospital‐wide readmission rates, as a measure of hospital quality is inherently problematic. It is particularly problematic that CMS has applied equal weight to readmissions and mortality in the Star Report.[1] High readmission rates may result from complications and poor handoffs, but may also stem from the legitimate need to care for chronically ill patients in a high‐intensity setting, particularly fragile patients who have been kept alive against the odds. In conclusion, caution is warranted in viewing readmissions as a quality metric until the associations we describe are better explained using patient‐level data and more robust adjustment than is possible with these publically available data.
Disclosures: Dr. Daniel J. Brotman had full access to the data in the study and takes responsibility for the integrity of the data and the accuracy of the data analysis. There was no financial support for this work. Contributions of the authors are as follows: drafting manuscript (Brotman), revision of manuscript for important intellectual content (brotman, Hoyer, Lepley, Deutschendorf, Leung), acquisition of data (Deutschendorf, Leung, Lepley), interpretation of data (Brotman, Hoyer, Lepley, Deutschendorf, Leung), data analysis (Brotman, Hoyer).
- Centers for Medicare and Medicaid Services. Available at: https://www.cms.gov/Outreach-and-Education/Outreach/NPC/Downloads/2015-08-13-Star-Ratings-Presentation.pdf. Accessed September 2015.
- , , , et al. A comprehensive care management program to prevent chronic obstructive pulmonary disease hospitalizations: a randomized, controlled trial. Ann Intern Med. 2012;156(10):673–683.
- , , , et al. Relationship between hospital readmission and mortality rates for patients hospitalized with acute myocardial infarction, heart failure, or pneumonia. JAMA. 2013;309(6):587–593.
- Centers for Medicare and Medicaid Services. Hospital compare datasets. Available at: https://data.medicare.gov/data/hospital‐compare. Accessed September 2015.
- Centers for Medicare and Medicaid Services. Hospital quality initiative. Available at: https://www.cms.gov/Medicare/Quality‐Initiatives‐Patient‐Assessment‐Instruments/HospitalQualityInits. Accessed September 2015.
The Centers for Medicare & Medicaid Services (CMS) have sought to reduce readmissions in the 30 days following hospital discharge through penalties applied to hospitals with readmission rates that are higher than expected. Expected readmission rates for Medicare fee‐for‐service beneficiaries are calculated from models that use patient‐level administrative data to account for patient morbidities. Readmitted patients are defined as those who are discharged from the hospital alive and then rehospitalized at any acute care facility within 30 days of discharge. These models explicitly exclude sociodemographic variables that may impact quality of and access to outpatient care. Specific exclusions are also applied based on diagnosis codes so as to avoid penalizing hospitals for rehospitalizations that are likely to have been planned.
More recently, a hospital‐wide readmission measure has been developed, which seeks to provide a comprehensive view of each hospital's readmission rate by including the vast majority of Medicare patients. Like the condition‐specific readmission measures, the hospital‐wide readmission measure also excludes sociodemographic variables and incorporates specific condition‐based exclusions so as to avoid counting planned rehospitalizations (e.g., an admission for cholecystectomy following an admission for biliary sepsis). Although not currently used for pay‐for‐performance, this measure has been included in the CMS Star Report along with other readmission measures.[1] CMS does not currently disseminate a hospital‐wide mortality measure, but does disseminate hospital‐level adjusted 30‐day mortality rates for Medicare beneficiaries with discharge diagnoses of stroke, heart failure, myocardial infarction (MI), chronic obstructive pulmonary disease (COPD) and pneumonia, and principal procedure of coronary artery bypass grafting (CABG).
It is conceivable that aggressive efforts to reduce readmissions might delay life‐saving acute care in some scenarios,[2] and there is prior evidence that heart failure readmissions are inversely (but weakly) related to heart failure mortality.[3] It is also plausible that keeping tenuous patients alive until discharge might result in higher readmission rates. We sought to examine the relationship between hospital‐wide adjusted 30‐day readmissions and death rates across the acute care hospitals in the United States. Lacking a measure of hospital‐wide death rates, we examined the relation between hospital‐wide readmissions and each of the 6 condition‐specific mortality measures. For comparison, we also examined the relationships between condition‐specific readmission rates and mortality rates.
METHODS
We used publically available data published by CMS from July 1, 2011 through June 30, 2014.[4] These data are provided at the hospital level, without any patient‐level data. We included 4452 acute care facilities based on having hospital‐wide readmission rates, but not all facilities contributed data for each mortality measure. We excluded from analysis on a measure‐by‐measure basis those facilities for which outcomes were absent, without imputing missing outcome measures, because low volume of a given condition was the main reason for not reporting a measure. For each mortality measure, we constructed a logistic regression model to quantify the odds of performing in the lowest (best) mortality tertile as a function of hospital‐wide readmission tertile. To account for patient volumes, we included in each model the number of eligible patients at each hospital with the specified condition. We repeated these analyses using condition‐specific readmission rates (rather than the hospital‐wide readmission rates) as the independent variable. Specifications for CMS models for mortality and readmissions are publically available.[5]
RESULTS
After adjustment for patient volumes, hospitals in the highest hospital‐wide readmission tertile were more likely to perform in the lowest (best) mortality tertile for 3 of the 6 mortality measures: heart failure, COPD, and stroke (P < 0.001 for all). For MI, CABG and pneumonia, there was no significant association between high hospital‐wide readmission rates and low mortality (Table 1). Using condition‐specific readmission rates, there remained an inverse association between readmissions and mortality for heart failure and stroke, but not for COPD. In contrast, hospitals with the highest CABG‐specific readmission rates were significantly less likely to have low CABG‐specific mortality (P < 0.001).
| Hospital‐Wide Readmission Rate Tertile [Range of Adjusted Readmission Rates, %]* | |||
|---|---|---|---|
|
1st Tertile, n = 1359 [11.3%‐14.8%], Adjusted Odds Ratio (95% CI) |
2nd Tertile, n = 1785 [14.9%‐15.5%], Adjusted Odds Ratio (95% CI) |
3rd Tertile, n = 1308 [15.6%‐19.8%], Adjusted Odds Ratio (95% CI) |
|
| |||
| Mortality measure (no. of hospitals reporting) | |||
| Acute myocardial infarction (n = 2415) | 1.00 (referent) | 0.88 (0.711.09) | 1.02 (0.831.25) |
| Pneumonia (n = 4067) | 1.00 (referent) | 0.83 (0.710.98) | 1.11 (0.941.31) |
| Heart failure (n = 3668) | 1.00 (referent) | 1.21 (1.021.45) | 1.94 (1.632.30) |
| Stroke (n = 2754) | 1.00 (referent) | 1.13 (0.931.38) | 1.48 (1.221.79) |
| Chronic obstructive pulmonary disease (n = 3633) | 1.00 (referent) | 1.12 (0.951.33) | 1.73 (1.462.05) |
| Coronary artery bypass (n = 1058) | 1.00 (referent) | 0.87 (0.631.19) | 0.99 (0.741.34) |
| Condition‐specific readmission rate tertile | |||
| Mortality measure | |||
| Acute myocardial infarction | 1.00 (referent) | 0.88 (0.711.08) | 0.79 (0.640.99) |
| Pneumonia | 1.00 (referent) | 0.91 (0.781.07) | 0.89 (0.761.04) |
| Heart failure | 1.00 (referent) | 1.15 (0.961.36) | 1.56 (1.311.86) |
| Stroke | 1.00 (referent) | 1.65 (1.342.03) | 1.70 (1.232.35) |
| Chronic obstructive pulmonary disease | 1.00 (referent) | 0.83 (0.700.98) | 0.84 (0.710.99) |
| Coronary artery bypass | 1.00 (referent) | 0.59 (0.440.80) | 0.47 (0.340.64) |
DISCUSSION
We found that higher hospital‐wide readmission rates were associated with lower mortality at the hospital level for 3 of the 6 mortality measures we examined. The findings for heart failure parallel the findings of Krumholz and colleagues who examined 3 of these 6 measures (MI, pneumonia, and heart failure) in relation to readmissions for these specific populations.[3] This prior analysis, however, did not include the 3 more recently reported mortality measures (COPD, stroke, and CABG) and did not use hospital‐wide readmissions.
Causal mechanisms underlying the associations between mortality and readmission at the hospital level deserve further exploration. It is certainly possible that global efforts to keep patients out of the hospital might, in some instances, place patients at risk by delaying necessary acute care.[2] It is also possible that unmeasured variables, particularly access to hospice and palliative care services that might facilitate good deaths, could be associated with both reduced readmissions and higher death rates. Additionally, because deceased patients cannot be readmitted, one might expect that readmissions and mortality might be inversely associated, particularly for conditions with a high postdischarge mortality rate. Similarly, a hospital that does a particularly good job keeping chronically ill patients alive until discharge might exhibit a higher readmission rate than a hospital that is less adept at keeping tenuous patients alive until discharge.
Regardless of the mechanisms of these findings, we present these data to raise the concern that using readmission rates, particularly hospital‐wide readmission rates, as a measure of hospital quality is inherently problematic. It is particularly problematic that CMS has applied equal weight to readmissions and mortality in the Star Report.[1] High readmission rates may result from complications and poor handoffs, but may also stem from the legitimate need to care for chronically ill patients in a high‐intensity setting, particularly fragile patients who have been kept alive against the odds. In conclusion, caution is warranted in viewing readmissions as a quality metric until the associations we describe are better explained using patient‐level data and more robust adjustment than is possible with these publically available data.
Disclosures: Dr. Daniel J. Brotman had full access to the data in the study and takes responsibility for the integrity of the data and the accuracy of the data analysis. There was no financial support for this work. Contributions of the authors are as follows: drafting manuscript (Brotman), revision of manuscript for important intellectual content (brotman, Hoyer, Lepley, Deutschendorf, Leung), acquisition of data (Deutschendorf, Leung, Lepley), interpretation of data (Brotman, Hoyer, Lepley, Deutschendorf, Leung), data analysis (Brotman, Hoyer).
- Centers for Medicare and Medicaid Services. Available at: https://www.cms.gov/Outreach-and-Education/Outreach/NPC/Downloads/2015-08-13-Star-Ratings-Presentation.pdf. Accessed September 2015.
- , , , et al. A comprehensive care management program to prevent chronic obstructive pulmonary disease hospitalizations: a randomized, controlled trial. Ann Intern Med. 2012;156(10):673–683.
- , , , et al. Relationship between hospital readmission and mortality rates for patients hospitalized with acute myocardial infarction, heart failure, or pneumonia. JAMA. 2013;309(6):587–593.
- Centers for Medicare and Medicaid Services. Hospital compare datasets. Available at: https://data.medicare.gov/data/hospital‐compare. Accessed September 2015.
- Centers for Medicare and Medicaid Services. Hospital quality initiative. Available at: https://www.cms.gov/Medicare/Quality‐Initiatives‐Patient‐Assessment‐Instruments/HospitalQualityInits. Accessed September 2015.
Discharge Summaries and Readmissions
Across the continuum of care, the discharge summary is a critical tool for communication among care providers.[1] In the United States, the Joint Commission policies mandate that all hospital providers complete a discharge summary for patients with specific components to foster effective communication with future providers.[2] Because outpatient providers and emergency physicians rely on clinical information in the discharge summary to ensure appropriate postdischarge continuity of care, timely documentation is potentially an essential aspect of readmission reduction initiatives.[3, 4, 5] Prior reports indicate that poor discharge documentation of follow‐up plan‐of‐care increases the risk of hospitalization, whereas structured instructions, patient education, and direct communications with primary care physicians (PCPs) reduce repeat hospital visits.[6, 7, 8, 9] However, the current literature is limited in its narrow focus on the contents of discharge summaries, considered only same‐hospital readmissions, or considered readmissions within 3 months of discharge.[10, 11, 12, 13] Moreover, some prior research has suggested no association between discharge summary timeliness with readmission,[12, 13, 14] whereas another study did find a relationship,[15] hence the need to study this further is important. Filling this gap in knowledge could provide an avenue to track and improve quality of patient care, as delays in discharge summaries have been linked with pot‐discharge adverse outcomes and patient safety concerns.[15, 16, 17, 18] Because readmissions often occur soon after discharge, having timely discharge summaries may be particularly important to outcomes.[19, 20]
This research began under the framework of evaluating a bundle of care coordination strategies that were implemented at the Johns Hopkins Health System. These strategies were informed by the early Centers for Medicare and Medicaid Services (CMS) demonstration projects and other best practices that have been documented in the literature to improve utilization and improve communication during transitions of care.[21, 22, 23, 24, 25] Later they were augmented through a contract with the Center of Medicare and Medicaid Innovation to improve access to healthcare services and improve patient outcomes through improved care coordination processes. One of the domains our institution has increased efforts to improve is in provider handoffs. Toward that goal, we have worked to disentangle the effects of different factors of provider‐to‐provider communication that may influence readmissions.[26] For example, effective written provider handoffs in the form of accurate and timely discharge summaries was considered a key care coordination component of this program, but there was institutional resistance to endorsing an expectation that discharge summary turnaround should be shortened. To build a case for this concept, we sought to test the hypothesis that, at our hospital, longer time to complete hospital discharge summaries was associated with increased readmission rates. Unique to this analysis is that, in the state of Maryland, there is statewide reporting of readmissions, so we were able to account for intra‐ and interhospital readmissions for an all‐payer population. The authors anticipated that findings from this study would help inform discharge quality‐improvement initiatives and reemphasize the importance of timely discharge documentation across all disciplines as part of quality patient care.
METHODS
Study Population and Setting
We conducted a single‐center, retrospective cohort study of 87,994 consecutive patients discharged from Johns Hopkins Hospital, which is a 1000‐bed, tertiary academic medical center in Baltimore, Maryland between January 1, 2013 and December 31, 2014. One thousand ninety‐three (1.2%) of the records on days to complete the discharge summary were missing and were excluded from the analysis.
Data Source and Covariates
Data were derived from several sources. The Johns Hopkins Hospital data mart financial database, used for mandatory reporting to the State of Maryland, provided the following patient data: age, gender, race/ethnicity, payer (Medicare, Medicaid, and other) as a proxy for socioeconomic status,[27] hospital service prior to discharge (gynecologyobstetrics, medicine, neurosciences, oncology, pediatrics, and surgical sciences), hospital length of stay (LOS) prior to discharge, Agency for Healthcare Research and Quality (AHRQ) Comorbidity Index (which is an update to the original Elixhauser methodology[28]), and all‐payerrefined diagnosis‐related group (APRDRG) and severity of illness (SOI) combinations (a tool to group patients into clinically comparable disease and SOI categories expected to use similar resources and experience similar outcomes). The Health Services Cost Review Commission (HSCRC) in Maryland provided the observed readmission rate in Maryland for each APRDRG‐SOI combination and served as an expected readmission rate. This risk stratification methodology is similar to the approach used in previous studies.[26, 29] Discharge summary turnaround time was obtained from institutional administrative databases used to track compliance with discharge summary completion. Discharge location (home, facility, home with homecare or hospice, or other) was obtained from Curaspan databases (Curaspan Health Group, Inc., Newton, MA).
Primary Outcome: 30‐Day Readmission
The primary outcome was unplanned rehospitalizations to an acute care hospital in Maryland within 30 days of discharge from Johns Hopkins Hospital. This was as defined by the Maryland HSCRC using an algorithm to exclude readmissions that were likely to be scheduled, as defined by the index admission diagnosis and readmission diagnosis; this algorithm is updated based on the CMS all‐cause readmission algorithm.[30, 31]
Primary Exposure: Days to Complete the Discharge Summary
Discharge summary completion time was defined as the date when the discharge attending physician electronically signs the discharge summary. At our institution, an auto‐fax system sends documents (eg, discharge summaries, clinic notes) to linked providers (eg, primary care providers) shortly after midnight from the day the document is signed by an attending physician. During the period of the project, the policy for discharge summaries at the Johns Hopkins Hospital went from requiring them to be completed within 30 days to 14 days, and we were hoping to use our analyses to inform decision makers why this was important. To emphasize the need for timely completion of discharge summaries, we dichotomized the number of days to complete the discharge summary into >3 versus 3 days (20th percentile cutoff) and modeled it as a continuous variable (per 3‐day increase in days to complete the discharge summary).
Statistical Analysis
To evaluate differences in patient characteristics by readmission status, analysis of variance and 2 tests were used for continuous and dichotomous variables, respectively. Logistic regression was used to evaluate the association between days to complete the discharge summary >3 days and readmission status, adjusting for potentially confounding variables. Before inclusion in the logistic regression model, we confirmed a lack of multicollinearity in the multivariable regression model using variance inflation factors. We evaluated residual versus predicted value plots and residual versus fitted value plots with a locally weighted scatterplot smoothing line. In a sensitivity analysis we evaluated the association between readmission status and different cutoffs (>8 days, 50th percentile; and >14 days, 70% percentile). In a separate analysis, we used interaction terms to test whether the association between the association between days to complete the discharge summary >3 days and hospital readmission varied by the covariates in the analysis (age, sex, race, payer, hospital service, discharge location, LOS, APRDRG‐SOI expected readmission rate, and AHRQ Comorbidity Index). We observed a significant interaction between 30‐day readmission and days to complete the discharge summary >3 days by hospital service. Hence, we separately calculated the adjusted mean readmission rates separately for each hospital service using the least squared means method for the multivariable logistic regression analysis and adjusting for the previously mentioned covariates. In a separate analysis, we used linear regression to evaluate the association between LOS and days to complete the discharge summary, adjusting for potentially confounding variables. Statistical significance was defined as a 2‐sided P < 0.05. Data were analyzed with R (version 2.15.0; R Foundation for Statistical Computing, Vienna, Austria;
RESULTS
Readmitted Patients
In the study period, 14,248 out of 87,994 (16.2%) consecutive eligible patients were readmitted to a hospital in Maryland from patients discharged from Johns Hopkins Hospital between January 1, 2013 and December 31, 2014. A total of 11,027 (77.4%) of the readmissions were back to Johns Hopkins Hospital. Table 1 compares characteristics of readmitted versus nonreadmitted patients, with the following variables being significantly different between these patient groups: age, gender, healthcare payer, hospital service, discharge location, length of stay expected readmission rate, AHRQ Comorbidity Index, and days to complete inpatient discharge summary.
| Characteristics | All Patients, N = 87,994 | Not Readmitted, N = 73,746 | Readmitted, N = 14,248 | P Value |
|---|---|---|---|---|
| ||||
| Age, y | 42.1 (25.1) | 41.3 (25.4) | 46.4 (23.1) | <0.001 |
| Male | 43,210 (49.1%) | 35,851 (48.6%) | 7,359 (51.6%) | <0.001 |
| Race | <0.001 | |||
| Caucasian | 45,705 (51.9%) | 3,8661 (52.4%) | 7,044 (49.4%) | |
| African American | 32,777 (37.2%) | 2,6841 (36.4%) | 5,936 (41.7%) | |
| Other | 9,512 (10.8%) | 8,244 (11.2%) | 1,268 (8.9%) | |
| Payer | <0.001 | |||
| Medicare | 22,345 (25.4%) | 17,614 (23.9%) | 4,731 (33.2%) | |
| Medicaid | 24,080 (27.4%) | 20,100 (27.3%) | 3,980 (27.9%) | |
| Other | 41,569 (47.2%) | 36,032 (48.9%) | 5,537 (38.9%) | |
| Hospital service | <0.001 | |||
| Gynecologyobstetrics | 9,299 (10.6%) | 8,829 (12.0%) | 470 (3.3%) | |
| Medicine | 26,036 (29.6%) | 20,069 (27.2%) | 5,967 (41.9%) | |
| Neurosciences | 8,269 (9.4%) | 7,331 (9.9%) | 938 (6.6%) | |
| Oncology | 5,222 (5.9%) | 3,898 (5.3%) | 1,324 (9.3%) | |
| Pediatrics | 17,029 (19.4%) | 14,684 (19.9%) | 2,345 (16.5%) | |
| Surgical sciences | 22,139 (25.2%) | 18,935 (25.7%) | 3,204 (22.5%) | |
| Discharge location | <0.001 | |||
| Home | 65,478 (74.4%) | 56,359 (76.4%) | 9,119 (64.0%) | |
| Home with homecare or hospice | 9,524 (10.8%) | 7,440 (10.1%) | 2,084 (14.6%) | |
| Facility (SNF, rehabilitation facility) | 5,398 (6.1%) | 4,131 (5.6%) | 1,267 (8.9%) | |
| Other | 7,594 (8.6%) | 5,816 (7.9%) | 1,778 (12.5%) | |
| Length of stay, d | 5.5 (8.6) | 5.1 (7.8) | 7.5 (11.6) | <0.001 |
| APRDRG‐SOI Expected Readmission Rate, % | 14.4 (9.5) | 13.3 (9.2) | 20.1 (9.0) | <0.001 |
| AHRQ Comorbidity Index (1 point) | 2.5 (1.4) | 2.4 (1.4) | 3.0 (1.8) | <0.001 |
| Discharge summary completed >3 days | 66,242 (75.3%) | 55,329 (75.0%) | 10,913 (76.6%) | <0.001 |
Association Between Days to Complete the Discharge Summary and Readmission
After hospital discharge, median (IQR) number of days to complete discharge summaries was 8 (416) days. After hospital discharge, median (IQR) number of days to complete discharge summaries and the number of days from discharge to readmission was 8 (416) and 11 (519) days, respectively (P < 0.001). Six thousand one hundred one patients (42.8%) were readmitted before their discharge summary was completed. The median (IQR) days to complete discharge summaries by hospital service in order from shortest to longest was: oncology, 6 (212) days; surgical sciences, 6 (312) days; pediatrics, 7 (315) days; gynecologyobstetrics, 8 (415) days; medicine, 9 (420) days; neurosciences, 12 (621) days.
When we divided the number of days to complete the discharge summary into deciles (02, 2.13, 3.14, 4.16, 6.18, 8.210, 10.114, 14.119, 19.130, >30), a longer number of days to complete discharge summaries had higher unadjusted and adjusted readmission rates (Figure 1). In unadjusted analysis, Table 2 shows that older age, male sex, African American race, oncological versus medicine hospital service, discharge location, longer LOS, higher APRDRG‐SOI expected readmission rate, and higher AHRQ Comorbidity Index were associated with readmission. Days to complete the discharge summary >3 days versus 3 days was associated with a higher readmission rate, with an unadjusted odds ratio (OR) and 95% confidence interval (CI) of 1.09 (95% CI: 1.04 to 1.13, P < 0.001).
| Characteristic | Bivariable Analysis* | Multivariable Analysis* | ||
|---|---|---|---|---|
| OR (95% CI) | P Value | OR (95% CI) | P Value | |
| ||||
| Age, 10 y | 1.09 (1.08 to 1.09) | <0.001 | 0.97 (0.95 to 0.98) | <0.001 |
| Male | 1.13 (1.09 to 1.17) | <0.001 | 1.01 (0.97 to 1.05) | 0.76 |
| Race | ||||
| Caucasian | Referent | Referent | ||
| African American | 1.21 (1.17 to 1.26) | <0.001 | 1.01 (0.96 to 1.05) | 0.74 |
| Other | 0.84 (0.79 to 0.90) | <0.001 | 0.92 (0.86 to 0.98) | 0.01 |
| Payer | ||||
| Medicare | Referent | Referent | ||
| Medicaid | 0.74 (0.70 to 0.77) | <0.001 | 1.03 (0.97 to 1.09) | 0.42 |
| Other | 0.57 (0.55 to 0.60) | <0.001 | 0.86 (0.82 to 0.91) | <0.001 |
| Hospital service | ||||
| Medicine | Referent | Referent | ||
| Gynecologyobstetrics | 0.18 (0.16 to 0.20) | <0.001 | 0.50 (0.45 to 0.56) | <0.001 |
| Neurosciences | 0.43 (0.40 to 0.46) | <0.001 | 0.76 (0.70 to 0.82) | <0.001 |
| Oncology | 1.14 (1.07 to 1.22) | <0.001 | 1.18 (1.10 to 1.28) | <0.001 |
| Pediatrics | 0.54 (0.51 to 0.57) | <0.001 | 0.77 (0.71 to 0.83) | <0.001 |
| Surgical sciences | 0.57 (0.54 to 0.60) | <0.001 | 0.92 (0.87 to 0.97) | 0.002 |
| Discharge location | ||||
| Home | Referent | |||
| Facility (SNF, rehabilitation facility) | 1.90 (1.77 to 2.03) | <0.001 | 1.11 (1.02 to 1.19) | 0.009 |
| Home with homecare or hospice | 1.73 (1.64 to 1.83) | <0.001 | 1.26 (1.19 to 1.34) | <0.001 |
| Other | 1.89 (1.78 to 2.00) | <0.001 | 1.25 (1.18 to 1.34) | <0.001 |
| Length of stay, d | 1.03 (1.02 to 1.03) | <0.001 | 1.00 (1.00 to 1.01) | <0.001 |
| APRDRG‐SOI expected readmission rate, % | 1.08 (1.07 to 1.08) | <0.001 | 1.06 (1.06 to 1.06) | <0.001 |
| AHRQ Comorbidity Index (1 point) | 1.27 (1.26 to 1.28) | <0.001 | 1.11 (1.09 to 1.12) | <0.001 |
| Discharge summary completed >3 days | 1.09 (1.04 to 1.14) | <0.001 | 1.09 (1.05 to 1.14) | <0.001 |

Multivariable and Secondary Analyses
In adjusted analysis (Table 2), patients discharged from an oncologic service relative to a medicine hospital service (OR: 1.19, 95% CI: 1.10 to 1.28, P < 0.001), patients discharged to a facility, home with homecare or hospice, or other location compared to home (facility OR: 1.11, 95% CI: 1.02 to 1.19, P = 0.009; home with homecare or hospice OR: 1.26, 95% CI: 1.19 to 1.34, P < 0.001; other OR: 1.25, 95% CI: 1.18 to 1.34, P < 0.001), patients with longer LOS (OR: 1.11 per day, 95% CI: 1.10 to 1.12, P < 0.001), patients with a higher expected readmission rates (OR: 1.01 per percent, 95% CI: 1.00 to 1.01, P < 0.001), and patients with a higher AHRQ comorbidity index (OR: 1.06 per 1 point, 95% CI: 1.06 to 1.06, P < 0.001) had higher 30‐day readmission rates. Overall, days to complete the discharge summary >3 days versus 3 days was associated with a higher readmission rate (OR: 1.09, 95% CI: 1.05 to 1.14, P < 0.001).
In a sensitivity analysis, discharge summary completion >8 days (median) versus 8 days was associated with higher unadjusted readmission rate (OR: 1.11, 95% CI: 1.07 to 1.15, P < 0.001) and a higher adjusted readmission rate (OR: 1.06, 95% CI: 1.02 to 1.10, P < 0.001). Discharge summary completion >14 days (70th percentile) versus 14 days was also associated with higher unadjusted readmission rate (OR: 1.15, 95% CI: 1.08 to 1.21, P < 0.001) and a higher adjusted readmission rate (OR: 1.09, 95% CI: 1.02 to 1.16, P = 0.008). The association between days to complete the discharge summary >3 days and readmissions was found to vary significantly by hospital service (P = 0.03). For comparing days to complete the discharge summary >3 versus 3 days, Table 3 shows that neurosciences, pediatrics, oncology, and medicine hospital services were associated with significantly increased adjusted mean readmission rates. Additionally, when days to complete the discharge summary was modeled as a continuous variable, we found that for every 3 days the odds of readmission increased by 1% (OR: 1.01, 95% CI: 1.00 to 1.01, P < 0.001).
| Days to Complete Discharge Summary by Hospital Service | Adjusted Mean Readmission Rate (95% CI)* | P Value |
|---|---|---|
| ||
| Gynecologyobstetrics | 0.30 | |
| 03 days, n = 1,792 | 5.4 (4.1 to 6.7) | |
| >3 days, n = 7,507 | 6.0 (4.9 to 7.0) | |
| Medicine | 0.04 | |
| 03 days, n = 6,137 | 21.1 (20.0 to 22.3) | |
| >3 days, n = 19,899 | 22.4 (21.6 to 23.2) | |
| Neurosciences | 0.02 | |
| 03 days, n = 1,116 | 10.1 (8.2 to 12.1) | |
| >3 days, n = 7,153 | 12.5 (11.6 to 13.5) | |
| Oncology | 0.01 | |
| 03 days, n = 1,885 | 25.0 (22.6 to 27.4) | |
| >3 days, n = 3,337 | 28.2 (26.6 to 30.2) | |
| Pediatrics | 0.001 | |
| 03 days, n = 4,561 | 9.5 (6.9 to 12.2) | |
| >3 days, n = 12,468 | 11.4 (8.9 to 13.9) | |
| Surgical sciences | 0.89 | |
| 03 days, n = 6,261 | 15.2 (14.2 to 16.1) | |
| >3 days, n = 15,878 | 15.1 (14.4 to 15.8) | |
In an unadjusted analysis, we found that the relationship between LOS and days to complete the discharge summary was not significant ( coefficient and 95% CI:, 0.01, 0.02 to 0.00, P = 0.20). However, we found a small but significant relationship in our multivariable analysis, such that each hospitalization day was associated with a 0.01 (95% CI: 0.00 to 0.02, P = 0.03) increase in days to complete the discharge summary.
DISCUSSION
In this single‐center retrospective analysis, the number of days to complete the discharge summary was significantly associated with readmissions after hospitalization. This association was independent of age, gender, comorbidity index, payer, discharge location, length of hospital stay, expected readmission rate based on diagnosis and severity of illness, and all hospital services. The odds of readmission for patients with delayed discharge summaries was small but significant. This is important in the current landscape of readmissions, particularly for institutions who are challenged to reduce readmission rates, and a small relative difference in readmissions may be the difference between getting penalized or not. In the context of prior studies, the results highlight the role of timely discharge summary as an under‐recognized metric, which may be a valid litmus test for care coordination. The findings also emphasize the potential of early summaries to expedite communication and to help facilitate quality of patient care. Hence, the study results extend the literature examining the relationship of delay in discharge summary with unfavorable patient outcomes.[15, 32]
In contrast to prior reports with limited focus on same‐hospital readmissions,[18, 33, 34, 35] readmissions beyond 30 days,[12] or focused on a specific patient population,[13, 36] this study evaluates both intra‐ and interhospital 30‐day readmissions in Maryland in an all‐payer, multi‐institution, diverse patient population. Additionally, prior research is conflicting with respect to whether timely discharges summaries are significantly associated with increased hospital readmissions.[12, 13, 14, 15] Although it is not surprising that inadequate care during hospitalization could result in readmissions, the role of discharge summaries remain underappreciated. Having a timely discharge summary may not always prevent readmissions, but our study showed that 43% of readmission occurred before the discharge summary completion. Not having a completed discharge summary at the time of readmission may have been a driver for the positive association between timely completion and 30‐day readmission we observed. This study highlights that delay in the discharge summary could be a marker of poor transitions of care, because suboptimal dissemination of critical information to care providers may result in discontinuity of patient care posthospitalization.
A plausible mechanism of the association between discharge summary delays and readmissions could be the provision of collateral information, which may potentially alter the threshold for readmissions. For example, in the emergency room/emergency department (ER/ED) setting, discharge summaries may help with preventable readmissions. For patients who present repeatedly with the same complaint, timely summaries to ER/ED providers may help reframe the patient complaints, such as patient has concern X, which was previously identified to be related to diagnosis Y. As others have shown, the content of discharge summaries, format, and accessibility (electronic vs paper chart), as well as timely distribution of summaries, are key factors that impact quality outcomes.[2, 12, 15, 37, 38] By detailing prior hospital information (ie, discharge medications, prior presentations, tests completed), summaries could help prevent errors in medication dosing, reduce unnecessary testing, and help facilitate admission triage. Summaries may have information regarding a new diagnosis such as the results of an endoscopic evaluation that revealed the source of occult gastrointestinal bleeding, which could help contextualize a complaint of repeat melena and redirect goals of care. Discussions of goals of care in the discharge summary may guide primary providers in continued care management plans.
Our study findings underscore a positive correlation between late discharge summaries and readmissions. However, the extent that this is a causal relationship is unclear; the association of delay in days to complete the discharge summary with readmission may be an epiphenomenon related to processes related to quality of clinical care. For example, delays in discharge summary completion could be a marker of other system issues, such as a stressed work environment. It is possible that providers who fail to complete timely discharge summaries may also fail to do other important functions related to transitions of care and care coordination. However, even if this is so, timely discharge summaries could become a focal point for discussion for optimization of care transitions. A discharge summary could be delayed because the patient has already been readmitted before the summary was distributed, thus making that original summary less relevant. Delays could also be a reflection of the data complexity for patients with longer hospital stays. This is supported by the small but significant relationship between LOS and days to complete the discharge summary in this study. Lastly, delays in discharge summary completion may also be a proxy of provider communication and can reflect the culture of communication at the institution.
Although unplanned hospital readmission is an important outcome, many readmissions may be related to other factors such as disease progression, rather than late summaries or the lack of postdischarge communication. For instance, prior reports did not find any association between the PCP seeing the discharge summaries or direct communications with the PCP and 30‐day clinical outcomes for readmission and death.[26, 39] However, these studies were limited in their use of self‐reported handoffs, did not measure quality of information transfer, and failed to capture a broader audience beyond the PCP, such as ED physicians or specialists.
Our results suggest that the relationship between days to complete discharge summaries and 30‐day readmissions may vary depending on whether the hospitalization is primarily surgical/procedural versus medical treatment. A recent study found that most readmissions after surgery were associated with new complications related to the procedure and not exacerbation of prior index hospitalization complications.[40] Hence, treatment for common causes of hospital readmissions after surgical or gynecological procedures, such as wound infections, acute anemia, ileus, or dehydration, may not necessarily require a completed discharge summary for appropriate management. However, we caution extending this finding to clinical practice before further studies are conducted on specific procedures and in different clinical settings.
Results from this study also support institutional policies that specify the need for practitioners to complete discharge summaries contemporaneously, such as at the time of discharge or within a couple of days. Unlike other forms of communication that are optional, discharge summaries are required, so we recommend that practitioners be held accountable for short turnaround times. For example, providers could be graded and rated on timely completions of discharge summaries, among other performance variables. Anecdotally at our institutions, we have heard from practitioners that it takes less time to complete them when you do them on the day of discharge, because the hospitalization course is fresher in their mind and they have to wade through less information in the medical record to complete an accurate discharge summary. To this point, a barrier to on‐time completion is that providers may have misconceptions about what is really vital information to convey to the next provider. In agreement with past research and in the era of the electronic medical record system, we recommend that the discharge summary should be a quick synthesis of key findings that incorporates only the important elements, such as why the patient was hospitalized, what were key findings and key responses to therapy, what is pending at the time of discharge, what medications the patient is currently taking, and what are the follow‐up plans, rather than a lengthy expose of all the findings.[13, 36, 41, 42]
Lastly, our study results should be taken in the context of its limitations. As a single‐center study, findings may lack generalizability. In particular, the results may not generalize to hospitals that lack access to statewide reporting. We were also not able to assess readmission for patients who may have been readmitted to a hospital outside of Maryland. Although we adjusted for pertinent variables such as age, gender, healthcare payer, hospital service, comorbidity index, discharge location, LOS, and expected readmission rates, there may be other relevant confounders that we failed to capture or measure optimally. Median days to complete the discharge summary in this study was 8 days, which is longer than practices at other institutions, and may also limit this study's generalizability.[15, 36, 42] However, prior research supports our findings,[15] and a systematic review found that only 29% and 52% of discharge summaries were completed by 2 weeks and 4 weeks, respectively.[9] Finally, as noted above and perhaps most important, it is possible that discharge summary turnaround time does not in itself causally impact readmissions, but rather reflects an underlying commitment of the inpatient team to effectively coordinate care following hospital discharge.
CONCLUSION
In sum, this study delineates an underappreciated but important relationship of timely discharge summary completion and readmission outcomes. The discharge summary may be a relevant metric reflecting quality of patient care. Healthcare providers may begin to target timely discharge summaries as a potential focal point of quality‐improvement projects with the goal to facilitate better patient outcomes.
Disclosures
The authors certify that no party having a direct interest in the results of the research supporting this article has or will confer a benefit on us or on any organization with which we are associated, and, if applicable, the authors certify that all financial and material support for this research (eg, Centers for Medicare and Medicaid Services, National Institutes of Health, or National Health Service grants) and work are clearly identified. This study was supported by funding opportunity, number CMS‐1C1‐12‐0001, from the Centers for Medicare and Medicaid Services and Center for Medicare and Medicaid Innovation. Its contents are solely the responsibility of the authors and do not necessarily represent the official views of the Department of Health and Human Services or any of its agencies.
- , , , et al. Development and sustainability of an inpatient‐to‐outpatient discharge handoff tool: a quality improvement project. Jt Comm J Qual Patient Saf. 2014;40(5):219–227.
- , , , , , . Documentation of mandated discharge summary components in transitions from acute to subacute care. In: Henriksen K, Battles JB, Keyes MA, et al., eds. Advances in Patient Safety: New Directions and Alternative Approaches. Vol. 2. Culture and Redesign. Rockville, MD: Agency for Healthcare Research and Quality; 2008.
- , , , . Better transitions: improving comprehension of discharge instructions. Front Health Serv Manage. 2009;25(3):11–32.
- , , , . Structured discharge education improves early outcome in orthopedic patients. Int J Orthop Trauma Nurs. 2010;14(2):66–74.
- , , , et al. Hospital discharge documentation and risk of rehospitalisation. BMJ Qual Saf. 2011;20(9):773–778.
- , , . The hospital discharge: a review of a high risk care transition with highlights of a reengineered discharge process. J Patient Saf. 2007;3(2):97–106.
- , , , , . Interventions to reduce 30‐day rehospitalization: a systematic review. Ann Intern Med. 2011;155(8):520–528.
- , , , , , . Effect of hospital follow‐up appointment on clinical event outcomes and mortality. Arch Intern Med. 2010;170(11):955–960.
- , , , , , . Deficits in communication and information transfer between hospital‐based and primary care physicians: implications for patient safety and continuity of care. JAMA. 2007;297(8):831–841.
- , , , , . Provider characteristics, clinical‐work processes and their relationship to discharge summary quality for sub‐acute care patients. J Gen Intern Med. 2012;27(1):78–84.
- , , , et al. Contemporary evidence about hospital strategies for reducing 30‐day readmissions: a national study. J Am Coll Cardiol. 2012;60(7):607–614.
- , , , . Effect of discharge summary availability during post‐discharge visits on hospital readmission. J Gen Intern Med. 2002;17(3):186–192.
- , , , et al. Association of discharge summary quality with readmission risk for patients hospitalized with heart failure exacerbation. Circ Cardiovasc Qual Outcomes. 2015;8(1):109–111.
- , , , et al. The independent association of provider and information continuity on outcomes after hospital discharge: implications for hospitalists. J Hosp Med. 2010;5(7):398–405.
- , , , , . Timeliness in discharge summary dissemination is associated with patients' clinical outcomes. J Eval Clin Pract. 2013;19(1):76–79.
- , , , et al. Communication and information deficits in patients discharged to rehabilitation facilities: an evaluation of five acute care hospitals. J Hosp Med. 2009;4(8):E28–E33.
- , , . Preventing readmissions through comprehensive discharge planning. Prof Case Manag. 2013;18(2):56–63; quiz 64–65.
- , , , et al. Effect of a postdischarge virtual ward on readmission or death for high‐risk patients: a randomized clinical trial. JAMA. 2014;312(13):1305–1312..
- , , . Risk factors for early unplanned hospital readmission in the elderly. J Gen Intern Med. 1991;6(3):223–228.
- , , , , . Differences between early and late readmissions among patients: a cohort study. Ann Intern Med. 2015;162(11):741–749.
- , , , et al. Post‐acute care payment reform demonstration report to congress supplement‐interim report. Centers for Medicare 14(3):1–14; quiz 88–89.
- , , , et al. Comprehensive discharge planning and home follow‐up of hospitalized elders: a randomized clinical trial. JAMA. 1999;281(7):613–620.
- , , , . Posthospital care transitions: patterns, complications, and risk identification. Health Serv Res. 2004;39(5):1449–1465.
- , , , et al. Transitions of care consensus policy statement: American College of Physicians, Society of General Internal Medicine, Society of Hospital Medicine, American Geriatrics Society, American College of Emergency Physicians, and Society for Academic Emergency Medicine. J Hosp Med. 2009;4(6):364–370.
- , , , et al. Association of self‐reported hospital discharge handoffs with 30‐day readmissions. JAMA Intern Med. 2013;173(8):624–629.
- , . Socioeconomic disparities in health: pathways and policies. Health Aff (Millwood). 2002;21(2):60–76.
- , , , . Comorbidity measures for use with administrative data. Med Care. 1998;36(1):8–27.
- , , , , , . Functional status impairment is associated with unplanned readmissions. Arch Phys Med Rehabil. 2013;94(10):1951–1958.
- Centers for Medicare 35(10):1044–1059.
- , , , et al. Understanding and execution of discharge instructions. Am J Med Qual. 2013;28(5):383–391.
- , , , , . Beyond the hospital gates: elucidating the interactive association of social support, depressive symptoms, and physical function with 30‐day readmissions. Am J Phys Med Rehabil. 2015;94(7):555–567.
- , , , et al. Improving the discharge process by embedding a discharge facilitator in a resident team. J Hosp Med. 2011;6(9):494–500.
- , , , et al. Hospital variation in quality of discharge summaries for patients hospitalized with heart failure exacerbation. Circ Cardiovasc Qual Outcomes. 2015;8(1):77–86
- , , , . Addressing the business of discharge: building a case for an electronic discharge summary. J Hosp Med. 2011;6(1):37–42.
- , , , , . Joint commission requirements for discharge instructions in patients with heart failure: is understanding important for preventing readmissions? J Card Fail. 2014;20(9):641–649.
- , , , et al. Association of communication between hospital‐based physicians and primary care providers with patient outcomes. J Gen Intern Med. 2009;24(3):381–386.
- , , , et al. Underlying reasons associated with hospital readmission following surgery in the united states. JAMA. 2015;313(5):483–495.
- , , , , . Assessing quality and efficiency of discharge summaries. Am J Med Qual. 2005;20(6):337–343.
- , , , et al. Comprehensive quality of discharge summaries at an academic medical center. J Hosp Med. 2013;8(8):436–443.
Across the continuum of care, the discharge summary is a critical tool for communication among care providers.[1] In the United States, the Joint Commission policies mandate that all hospital providers complete a discharge summary for patients with specific components to foster effective communication with future providers.[2] Because outpatient providers and emergency physicians rely on clinical information in the discharge summary to ensure appropriate postdischarge continuity of care, timely documentation is potentially an essential aspect of readmission reduction initiatives.[3, 4, 5] Prior reports indicate that poor discharge documentation of follow‐up plan‐of‐care increases the risk of hospitalization, whereas structured instructions, patient education, and direct communications with primary care physicians (PCPs) reduce repeat hospital visits.[6, 7, 8, 9] However, the current literature is limited in its narrow focus on the contents of discharge summaries, considered only same‐hospital readmissions, or considered readmissions within 3 months of discharge.[10, 11, 12, 13] Moreover, some prior research has suggested no association between discharge summary timeliness with readmission,[12, 13, 14] whereas another study did find a relationship,[15] hence the need to study this further is important. Filling this gap in knowledge could provide an avenue to track and improve quality of patient care, as delays in discharge summaries have been linked with pot‐discharge adverse outcomes and patient safety concerns.[15, 16, 17, 18] Because readmissions often occur soon after discharge, having timely discharge summaries may be particularly important to outcomes.[19, 20]
This research began under the framework of evaluating a bundle of care coordination strategies that were implemented at the Johns Hopkins Health System. These strategies were informed by the early Centers for Medicare and Medicaid Services (CMS) demonstration projects and other best practices that have been documented in the literature to improve utilization and improve communication during transitions of care.[21, 22, 23, 24, 25] Later they were augmented through a contract with the Center of Medicare and Medicaid Innovation to improve access to healthcare services and improve patient outcomes through improved care coordination processes. One of the domains our institution has increased efforts to improve is in provider handoffs. Toward that goal, we have worked to disentangle the effects of different factors of provider‐to‐provider communication that may influence readmissions.[26] For example, effective written provider handoffs in the form of accurate and timely discharge summaries was considered a key care coordination component of this program, but there was institutional resistance to endorsing an expectation that discharge summary turnaround should be shortened. To build a case for this concept, we sought to test the hypothesis that, at our hospital, longer time to complete hospital discharge summaries was associated with increased readmission rates. Unique to this analysis is that, in the state of Maryland, there is statewide reporting of readmissions, so we were able to account for intra‐ and interhospital readmissions for an all‐payer population. The authors anticipated that findings from this study would help inform discharge quality‐improvement initiatives and reemphasize the importance of timely discharge documentation across all disciplines as part of quality patient care.
METHODS
Study Population and Setting
We conducted a single‐center, retrospective cohort study of 87,994 consecutive patients discharged from Johns Hopkins Hospital, which is a 1000‐bed, tertiary academic medical center in Baltimore, Maryland between January 1, 2013 and December 31, 2014. One thousand ninety‐three (1.2%) of the records on days to complete the discharge summary were missing and were excluded from the analysis.
Data Source and Covariates
Data were derived from several sources. The Johns Hopkins Hospital data mart financial database, used for mandatory reporting to the State of Maryland, provided the following patient data: age, gender, race/ethnicity, payer (Medicare, Medicaid, and other) as a proxy for socioeconomic status,[27] hospital service prior to discharge (gynecologyobstetrics, medicine, neurosciences, oncology, pediatrics, and surgical sciences), hospital length of stay (LOS) prior to discharge, Agency for Healthcare Research and Quality (AHRQ) Comorbidity Index (which is an update to the original Elixhauser methodology[28]), and all‐payerrefined diagnosis‐related group (APRDRG) and severity of illness (SOI) combinations (a tool to group patients into clinically comparable disease and SOI categories expected to use similar resources and experience similar outcomes). The Health Services Cost Review Commission (HSCRC) in Maryland provided the observed readmission rate in Maryland for each APRDRG‐SOI combination and served as an expected readmission rate. This risk stratification methodology is similar to the approach used in previous studies.[26, 29] Discharge summary turnaround time was obtained from institutional administrative databases used to track compliance with discharge summary completion. Discharge location (home, facility, home with homecare or hospice, or other) was obtained from Curaspan databases (Curaspan Health Group, Inc., Newton, MA).
Primary Outcome: 30‐Day Readmission
The primary outcome was unplanned rehospitalizations to an acute care hospital in Maryland within 30 days of discharge from Johns Hopkins Hospital. This was as defined by the Maryland HSCRC using an algorithm to exclude readmissions that were likely to be scheduled, as defined by the index admission diagnosis and readmission diagnosis; this algorithm is updated based on the CMS all‐cause readmission algorithm.[30, 31]
Primary Exposure: Days to Complete the Discharge Summary
Discharge summary completion time was defined as the date when the discharge attending physician electronically signs the discharge summary. At our institution, an auto‐fax system sends documents (eg, discharge summaries, clinic notes) to linked providers (eg, primary care providers) shortly after midnight from the day the document is signed by an attending physician. During the period of the project, the policy for discharge summaries at the Johns Hopkins Hospital went from requiring them to be completed within 30 days to 14 days, and we were hoping to use our analyses to inform decision makers why this was important. To emphasize the need for timely completion of discharge summaries, we dichotomized the number of days to complete the discharge summary into >3 versus 3 days (20th percentile cutoff) and modeled it as a continuous variable (per 3‐day increase in days to complete the discharge summary).
Statistical Analysis
To evaluate differences in patient characteristics by readmission status, analysis of variance and 2 tests were used for continuous and dichotomous variables, respectively. Logistic regression was used to evaluate the association between days to complete the discharge summary >3 days and readmission status, adjusting for potentially confounding variables. Before inclusion in the logistic regression model, we confirmed a lack of multicollinearity in the multivariable regression model using variance inflation factors. We evaluated residual versus predicted value plots and residual versus fitted value plots with a locally weighted scatterplot smoothing line. In a sensitivity analysis we evaluated the association between readmission status and different cutoffs (>8 days, 50th percentile; and >14 days, 70% percentile). In a separate analysis, we used interaction terms to test whether the association between the association between days to complete the discharge summary >3 days and hospital readmission varied by the covariates in the analysis (age, sex, race, payer, hospital service, discharge location, LOS, APRDRG‐SOI expected readmission rate, and AHRQ Comorbidity Index). We observed a significant interaction between 30‐day readmission and days to complete the discharge summary >3 days by hospital service. Hence, we separately calculated the adjusted mean readmission rates separately for each hospital service using the least squared means method for the multivariable logistic regression analysis and adjusting for the previously mentioned covariates. In a separate analysis, we used linear regression to evaluate the association between LOS and days to complete the discharge summary, adjusting for potentially confounding variables. Statistical significance was defined as a 2‐sided P < 0.05. Data were analyzed with R (version 2.15.0; R Foundation for Statistical Computing, Vienna, Austria;
RESULTS
Readmitted Patients
In the study period, 14,248 out of 87,994 (16.2%) consecutive eligible patients were readmitted to a hospital in Maryland from patients discharged from Johns Hopkins Hospital between January 1, 2013 and December 31, 2014. A total of 11,027 (77.4%) of the readmissions were back to Johns Hopkins Hospital. Table 1 compares characteristics of readmitted versus nonreadmitted patients, with the following variables being significantly different between these patient groups: age, gender, healthcare payer, hospital service, discharge location, length of stay expected readmission rate, AHRQ Comorbidity Index, and days to complete inpatient discharge summary.
| Characteristics | All Patients, N = 87,994 | Not Readmitted, N = 73,746 | Readmitted, N = 14,248 | P Value |
|---|---|---|---|---|
| ||||
| Age, y | 42.1 (25.1) | 41.3 (25.4) | 46.4 (23.1) | <0.001 |
| Male | 43,210 (49.1%) | 35,851 (48.6%) | 7,359 (51.6%) | <0.001 |
| Race | <0.001 | |||
| Caucasian | 45,705 (51.9%) | 3,8661 (52.4%) | 7,044 (49.4%) | |
| African American | 32,777 (37.2%) | 2,6841 (36.4%) | 5,936 (41.7%) | |
| Other | 9,512 (10.8%) | 8,244 (11.2%) | 1,268 (8.9%) | |
| Payer | <0.001 | |||
| Medicare | 22,345 (25.4%) | 17,614 (23.9%) | 4,731 (33.2%) | |
| Medicaid | 24,080 (27.4%) | 20,100 (27.3%) | 3,980 (27.9%) | |
| Other | 41,569 (47.2%) | 36,032 (48.9%) | 5,537 (38.9%) | |
| Hospital service | <0.001 | |||
| Gynecologyobstetrics | 9,299 (10.6%) | 8,829 (12.0%) | 470 (3.3%) | |
| Medicine | 26,036 (29.6%) | 20,069 (27.2%) | 5,967 (41.9%) | |
| Neurosciences | 8,269 (9.4%) | 7,331 (9.9%) | 938 (6.6%) | |
| Oncology | 5,222 (5.9%) | 3,898 (5.3%) | 1,324 (9.3%) | |
| Pediatrics | 17,029 (19.4%) | 14,684 (19.9%) | 2,345 (16.5%) | |
| Surgical sciences | 22,139 (25.2%) | 18,935 (25.7%) | 3,204 (22.5%) | |
| Discharge location | <0.001 | |||
| Home | 65,478 (74.4%) | 56,359 (76.4%) | 9,119 (64.0%) | |
| Home with homecare or hospice | 9,524 (10.8%) | 7,440 (10.1%) | 2,084 (14.6%) | |
| Facility (SNF, rehabilitation facility) | 5,398 (6.1%) | 4,131 (5.6%) | 1,267 (8.9%) | |
| Other | 7,594 (8.6%) | 5,816 (7.9%) | 1,778 (12.5%) | |
| Length of stay, d | 5.5 (8.6) | 5.1 (7.8) | 7.5 (11.6) | <0.001 |
| APRDRG‐SOI Expected Readmission Rate, % | 14.4 (9.5) | 13.3 (9.2) | 20.1 (9.0) | <0.001 |
| AHRQ Comorbidity Index (1 point) | 2.5 (1.4) | 2.4 (1.4) | 3.0 (1.8) | <0.001 |
| Discharge summary completed >3 days | 66,242 (75.3%) | 55,329 (75.0%) | 10,913 (76.6%) | <0.001 |
Association Between Days to Complete the Discharge Summary and Readmission
After hospital discharge, median (IQR) number of days to complete discharge summaries was 8 (416) days. After hospital discharge, median (IQR) number of days to complete discharge summaries and the number of days from discharge to readmission was 8 (416) and 11 (519) days, respectively (P < 0.001). Six thousand one hundred one patients (42.8%) were readmitted before their discharge summary was completed. The median (IQR) days to complete discharge summaries by hospital service in order from shortest to longest was: oncology, 6 (212) days; surgical sciences, 6 (312) days; pediatrics, 7 (315) days; gynecologyobstetrics, 8 (415) days; medicine, 9 (420) days; neurosciences, 12 (621) days.
When we divided the number of days to complete the discharge summary into deciles (02, 2.13, 3.14, 4.16, 6.18, 8.210, 10.114, 14.119, 19.130, >30), a longer number of days to complete discharge summaries had higher unadjusted and adjusted readmission rates (Figure 1). In unadjusted analysis, Table 2 shows that older age, male sex, African American race, oncological versus medicine hospital service, discharge location, longer LOS, higher APRDRG‐SOI expected readmission rate, and higher AHRQ Comorbidity Index were associated with readmission. Days to complete the discharge summary >3 days versus 3 days was associated with a higher readmission rate, with an unadjusted odds ratio (OR) and 95% confidence interval (CI) of 1.09 (95% CI: 1.04 to 1.13, P < 0.001).
| Characteristic | Bivariable Analysis* | Multivariable Analysis* | ||
|---|---|---|---|---|
| OR (95% CI) | P Value | OR (95% CI) | P Value | |
| ||||
| Age, 10 y | 1.09 (1.08 to 1.09) | <0.001 | 0.97 (0.95 to 0.98) | <0.001 |
| Male | 1.13 (1.09 to 1.17) | <0.001 | 1.01 (0.97 to 1.05) | 0.76 |
| Race | ||||
| Caucasian | Referent | Referent | ||
| African American | 1.21 (1.17 to 1.26) | <0.001 | 1.01 (0.96 to 1.05) | 0.74 |
| Other | 0.84 (0.79 to 0.90) | <0.001 | 0.92 (0.86 to 0.98) | 0.01 |
| Payer | ||||
| Medicare | Referent | Referent | ||
| Medicaid | 0.74 (0.70 to 0.77) | <0.001 | 1.03 (0.97 to 1.09) | 0.42 |
| Other | 0.57 (0.55 to 0.60) | <0.001 | 0.86 (0.82 to 0.91) | <0.001 |
| Hospital service | ||||
| Medicine | Referent | Referent | ||
| Gynecologyobstetrics | 0.18 (0.16 to 0.20) | <0.001 | 0.50 (0.45 to 0.56) | <0.001 |
| Neurosciences | 0.43 (0.40 to 0.46) | <0.001 | 0.76 (0.70 to 0.82) | <0.001 |
| Oncology | 1.14 (1.07 to 1.22) | <0.001 | 1.18 (1.10 to 1.28) | <0.001 |
| Pediatrics | 0.54 (0.51 to 0.57) | <0.001 | 0.77 (0.71 to 0.83) | <0.001 |
| Surgical sciences | 0.57 (0.54 to 0.60) | <0.001 | 0.92 (0.87 to 0.97) | 0.002 |
| Discharge location | ||||
| Home | Referent | |||
| Facility (SNF, rehabilitation facility) | 1.90 (1.77 to 2.03) | <0.001 | 1.11 (1.02 to 1.19) | 0.009 |
| Home with homecare or hospice | 1.73 (1.64 to 1.83) | <0.001 | 1.26 (1.19 to 1.34) | <0.001 |
| Other | 1.89 (1.78 to 2.00) | <0.001 | 1.25 (1.18 to 1.34) | <0.001 |
| Length of stay, d | 1.03 (1.02 to 1.03) | <0.001 | 1.00 (1.00 to 1.01) | <0.001 |
| APRDRG‐SOI expected readmission rate, % | 1.08 (1.07 to 1.08) | <0.001 | 1.06 (1.06 to 1.06) | <0.001 |
| AHRQ Comorbidity Index (1 point) | 1.27 (1.26 to 1.28) | <0.001 | 1.11 (1.09 to 1.12) | <0.001 |
| Discharge summary completed >3 days | 1.09 (1.04 to 1.14) | <0.001 | 1.09 (1.05 to 1.14) | <0.001 |
Multivariable and Secondary Analyses
In adjusted analysis (Table 2), patients discharged from an oncologic service relative to a medicine hospital service (OR: 1.19, 95% CI: 1.10 to 1.28, P < 0.001), patients discharged to a facility, home with homecare or hospice, or other location compared to home (facility OR: 1.11, 95% CI: 1.02 to 1.19, P = 0.009; home with homecare or hospice OR: 1.26, 95% CI: 1.19 to 1.34, P < 0.001; other OR: 1.25, 95% CI: 1.18 to 1.34, P < 0.001), patients with longer LOS (OR: 1.11 per day, 95% CI: 1.10 to 1.12, P < 0.001), patients with a higher expected readmission rates (OR: 1.01 per percent, 95% CI: 1.00 to 1.01, P < 0.001), and patients with a higher AHRQ comorbidity index (OR: 1.06 per 1 point, 95% CI: 1.06 to 1.06, P < 0.001) had higher 30‐day readmission rates. Overall, days to complete the discharge summary >3 days versus 3 days was associated with a higher readmission rate (OR: 1.09, 95% CI: 1.05 to 1.14, P < 0.001).
In a sensitivity analysis, discharge summary completion >8 days (median) versus 8 days was associated with higher unadjusted readmission rate (OR: 1.11, 95% CI: 1.07 to 1.15, P < 0.001) and a higher adjusted readmission rate (OR: 1.06, 95% CI: 1.02 to 1.10, P < 0.001). Discharge summary completion >14 days (70th percentile) versus 14 days was also associated with higher unadjusted readmission rate (OR: 1.15, 95% CI: 1.08 to 1.21, P < 0.001) and a higher adjusted readmission rate (OR: 1.09, 95% CI: 1.02 to 1.16, P = 0.008). The association between days to complete the discharge summary >3 days and readmissions was found to vary significantly by hospital service (P = 0.03). For comparing days to complete the discharge summary >3 versus 3 days, Table 3 shows that neurosciences, pediatrics, oncology, and medicine hospital services were associated with significantly increased adjusted mean readmission rates. Additionally, when days to complete the discharge summary was modeled as a continuous variable, we found that for every 3 days the odds of readmission increased by 1% (OR: 1.01, 95% CI: 1.00 to 1.01, P < 0.001).
| Days to Complete Discharge Summary by Hospital Service | Adjusted Mean Readmission Rate (95% CI)* | P Value |
|---|---|---|
| ||
| Gynecologyobstetrics | 0.30 | |
| 03 days, n = 1,792 | 5.4 (4.1 to 6.7) | |
| >3 days, n = 7,507 | 6.0 (4.9 to 7.0) | |
| Medicine | 0.04 | |
| 03 days, n = 6,137 | 21.1 (20.0 to 22.3) | |
| >3 days, n = 19,899 | 22.4 (21.6 to 23.2) | |
| Neurosciences | 0.02 | |
| 03 days, n = 1,116 | 10.1 (8.2 to 12.1) | |
| >3 days, n = 7,153 | 12.5 (11.6 to 13.5) | |
| Oncology | 0.01 | |
| 03 days, n = 1,885 | 25.0 (22.6 to 27.4) | |
| >3 days, n = 3,337 | 28.2 (26.6 to 30.2) | |
| Pediatrics | 0.001 | |
| 03 days, n = 4,561 | 9.5 (6.9 to 12.2) | |
| >3 days, n = 12,468 | 11.4 (8.9 to 13.9) | |
| Surgical sciences | 0.89 | |
| 03 days, n = 6,261 | 15.2 (14.2 to 16.1) | |
| >3 days, n = 15,878 | 15.1 (14.4 to 15.8) | |
In an unadjusted analysis, we found that the relationship between LOS and days to complete the discharge summary was not significant ( coefficient and 95% CI:, 0.01, 0.02 to 0.00, P = 0.20). However, we found a small but significant relationship in our multivariable analysis, such that each hospitalization day was associated with a 0.01 (95% CI: 0.00 to 0.02, P = 0.03) increase in days to complete the discharge summary.
DISCUSSION
In this single‐center retrospective analysis, the number of days to complete the discharge summary was significantly associated with readmissions after hospitalization. This association was independent of age, gender, comorbidity index, payer, discharge location, length of hospital stay, expected readmission rate based on diagnosis and severity of illness, and all hospital services. The odds of readmission for patients with delayed discharge summaries was small but significant. This is important in the current landscape of readmissions, particularly for institutions who are challenged to reduce readmission rates, and a small relative difference in readmissions may be the difference between getting penalized or not. In the context of prior studies, the results highlight the role of timely discharge summary as an under‐recognized metric, which may be a valid litmus test for care coordination. The findings also emphasize the potential of early summaries to expedite communication and to help facilitate quality of patient care. Hence, the study results extend the literature examining the relationship of delay in discharge summary with unfavorable patient outcomes.[15, 32]
In contrast to prior reports with limited focus on same‐hospital readmissions,[18, 33, 34, 35] readmissions beyond 30 days,[12] or focused on a specific patient population,[13, 36] this study evaluates both intra‐ and interhospital 30‐day readmissions in Maryland in an all‐payer, multi‐institution, diverse patient population. Additionally, prior research is conflicting with respect to whether timely discharges summaries are significantly associated with increased hospital readmissions.[12, 13, 14, 15] Although it is not surprising that inadequate care during hospitalization could result in readmissions, the role of discharge summaries remain underappreciated. Having a timely discharge summary may not always prevent readmissions, but our study showed that 43% of readmission occurred before the discharge summary completion. Not having a completed discharge summary at the time of readmission may have been a driver for the positive association between timely completion and 30‐day readmission we observed. This study highlights that delay in the discharge summary could be a marker of poor transitions of care, because suboptimal dissemination of critical information to care providers may result in discontinuity of patient care posthospitalization.
A plausible mechanism of the association between discharge summary delays and readmissions could be the provision of collateral information, which may potentially alter the threshold for readmissions. For example, in the emergency room/emergency department (ER/ED) setting, discharge summaries may help with preventable readmissions. For patients who present repeatedly with the same complaint, timely summaries to ER/ED providers may help reframe the patient complaints, such as patient has concern X, which was previously identified to be related to diagnosis Y. As others have shown, the content of discharge summaries, format, and accessibility (electronic vs paper chart), as well as timely distribution of summaries, are key factors that impact quality outcomes.[2, 12, 15, 37, 38] By detailing prior hospital information (ie, discharge medications, prior presentations, tests completed), summaries could help prevent errors in medication dosing, reduce unnecessary testing, and help facilitate admission triage. Summaries may have information regarding a new diagnosis such as the results of an endoscopic evaluation that revealed the source of occult gastrointestinal bleeding, which could help contextualize a complaint of repeat melena and redirect goals of care. Discussions of goals of care in the discharge summary may guide primary providers in continued care management plans.
Our study findings underscore a positive correlation between late discharge summaries and readmissions. However, the extent that this is a causal relationship is unclear; the association of delay in days to complete the discharge summary with readmission may be an epiphenomenon related to processes related to quality of clinical care. For example, delays in discharge summary completion could be a marker of other system issues, such as a stressed work environment. It is possible that providers who fail to complete timely discharge summaries may also fail to do other important functions related to transitions of care and care coordination. However, even if this is so, timely discharge summaries could become a focal point for discussion for optimization of care transitions. A discharge summary could be delayed because the patient has already been readmitted before the summary was distributed, thus making that original summary less relevant. Delays could also be a reflection of the data complexity for patients with longer hospital stays. This is supported by the small but significant relationship between LOS and days to complete the discharge summary in this study. Lastly, delays in discharge summary completion may also be a proxy of provider communication and can reflect the culture of communication at the institution.
Although unplanned hospital readmission is an important outcome, many readmissions may be related to other factors such as disease progression, rather than late summaries or the lack of postdischarge communication. For instance, prior reports did not find any association between the PCP seeing the discharge summaries or direct communications with the PCP and 30‐day clinical outcomes for readmission and death.[26, 39] However, these studies were limited in their use of self‐reported handoffs, did not measure quality of information transfer, and failed to capture a broader audience beyond the PCP, such as ED physicians or specialists.
Our results suggest that the relationship between days to complete discharge summaries and 30‐day readmissions may vary depending on whether the hospitalization is primarily surgical/procedural versus medical treatment. A recent study found that most readmissions after surgery were associated with new complications related to the procedure and not exacerbation of prior index hospitalization complications.[40] Hence, treatment for common causes of hospital readmissions after surgical or gynecological procedures, such as wound infections, acute anemia, ileus, or dehydration, may not necessarily require a completed discharge summary for appropriate management. However, we caution extending this finding to clinical practice before further studies are conducted on specific procedures and in different clinical settings.
Results from this study also support institutional policies that specify the need for practitioners to complete discharge summaries contemporaneously, such as at the time of discharge or within a couple of days. Unlike other forms of communication that are optional, discharge summaries are required, so we recommend that practitioners be held accountable for short turnaround times. For example, providers could be graded and rated on timely completions of discharge summaries, among other performance variables. Anecdotally at our institutions, we have heard from practitioners that it takes less time to complete them when you do them on the day of discharge, because the hospitalization course is fresher in their mind and they have to wade through less information in the medical record to complete an accurate discharge summary. To this point, a barrier to on‐time completion is that providers may have misconceptions about what is really vital information to convey to the next provider. In agreement with past research and in the era of the electronic medical record system, we recommend that the discharge summary should be a quick synthesis of key findings that incorporates only the important elements, such as why the patient was hospitalized, what were key findings and key responses to therapy, what is pending at the time of discharge, what medications the patient is currently taking, and what are the follow‐up plans, rather than a lengthy expose of all the findings.[13, 36, 41, 42]
Lastly, our study results should be taken in the context of its limitations. As a single‐center study, findings may lack generalizability. In particular, the results may not generalize to hospitals that lack access to statewide reporting. We were also not able to assess readmission for patients who may have been readmitted to a hospital outside of Maryland. Although we adjusted for pertinent variables such as age, gender, healthcare payer, hospital service, comorbidity index, discharge location, LOS, and expected readmission rates, there may be other relevant confounders that we failed to capture or measure optimally. Median days to complete the discharge summary in this study was 8 days, which is longer than practices at other institutions, and may also limit this study's generalizability.[15, 36, 42] However, prior research supports our findings,[15] and a systematic review found that only 29% and 52% of discharge summaries were completed by 2 weeks and 4 weeks, respectively.[9] Finally, as noted above and perhaps most important, it is possible that discharge summary turnaround time does not in itself causally impact readmissions, but rather reflects an underlying commitment of the inpatient team to effectively coordinate care following hospital discharge.
CONCLUSION
In sum, this study delineates an underappreciated but important relationship of timely discharge summary completion and readmission outcomes. The discharge summary may be a relevant metric reflecting quality of patient care. Healthcare providers may begin to target timely discharge summaries as a potential focal point of quality‐improvement projects with the goal to facilitate better patient outcomes.
Disclosures
The authors certify that no party having a direct interest in the results of the research supporting this article has or will confer a benefit on us or on any organization with which we are associated, and, if applicable, the authors certify that all financial and material support for this research (eg, Centers for Medicare and Medicaid Services, National Institutes of Health, or National Health Service grants) and work are clearly identified. This study was supported by funding opportunity, number CMS‐1C1‐12‐0001, from the Centers for Medicare and Medicaid Services and Center for Medicare and Medicaid Innovation. Its contents are solely the responsibility of the authors and do not necessarily represent the official views of the Department of Health and Human Services or any of its agencies.
- , , , et al. Development and sustainability of an inpatient‐to‐outpatient discharge handoff tool: a quality improvement project. Jt Comm J Qual Patient Saf. 2014;40(5):219–227.
- , , , , , . Documentation of mandated discharge summary components in transitions from acute to subacute care. In: Henriksen K, Battles JB, Keyes MA, et al., eds. Advances in Patient Safety: New Directions and Alternative Approaches. Vol. 2. Culture and Redesign. Rockville, MD: Agency for Healthcare Research and Quality; 2008.
- , , , . Better transitions: improving comprehension of discharge instructions. Front Health Serv Manage. 2009;25(3):11–32.
- , , , . Structured discharge education improves early outcome in orthopedic patients. Int J Orthop Trauma Nurs. 2010;14(2):66–74.
- , , , et al. Hospital discharge documentation and risk of rehospitalisation. BMJ Qual Saf. 2011;20(9):773–778.
- , , . The hospital discharge: a review of a high risk care transition with highlights of a reengineered discharge process. J Patient Saf. 2007;3(2):97–106.
- , , , , . Interventions to reduce 30‐day rehospitalization: a systematic review. Ann Intern Med. 2011;155(8):520–528.
- , , , , , . Effect of hospital follow‐up appointment on clinical event outcomes and mortality. Arch Intern Med. 2010;170(11):955–960.
- , , , , , . Deficits in communication and information transfer between hospital‐based and primary care physicians: implications for patient safety and continuity of care. JAMA. 2007;297(8):831–841.
- , , , , . Provider characteristics, clinical‐work processes and their relationship to discharge summary quality for sub‐acute care patients. J Gen Intern Med. 2012;27(1):78–84.
- , , , et al. Contemporary evidence about hospital strategies for reducing 30‐day readmissions: a national study. J Am Coll Cardiol. 2012;60(7):607–614.
- , , , . Effect of discharge summary availability during post‐discharge visits on hospital readmission. J Gen Intern Med. 2002;17(3):186–192.
- , , , et al. Association of discharge summary quality with readmission risk for patients hospitalized with heart failure exacerbation. Circ Cardiovasc Qual Outcomes. 2015;8(1):109–111.
- , , , et al. The independent association of provider and information continuity on outcomes after hospital discharge: implications for hospitalists. J Hosp Med. 2010;5(7):398–405.
- , , , , . Timeliness in discharge summary dissemination is associated with patients' clinical outcomes. J Eval Clin Pract. 2013;19(1):76–79.
- , , , et al. Communication and information deficits in patients discharged to rehabilitation facilities: an evaluation of five acute care hospitals. J Hosp Med. 2009;4(8):E28–E33.
- , , . Preventing readmissions through comprehensive discharge planning. Prof Case Manag. 2013;18(2):56–63; quiz 64–65.
- , , , et al. Effect of a postdischarge virtual ward on readmission or death for high‐risk patients: a randomized clinical trial. JAMA. 2014;312(13):1305–1312..
- , , . Risk factors for early unplanned hospital readmission in the elderly. J Gen Intern Med. 1991;6(3):223–228.
- , , , , . Differences between early and late readmissions among patients: a cohort study. Ann Intern Med. 2015;162(11):741–749.
- , , , et al. Post‐acute care payment reform demonstration report to congress supplement‐interim report. Centers for Medicare 14(3):1–14; quiz 88–89.
- , , , et al. Comprehensive discharge planning and home follow‐up of hospitalized elders: a randomized clinical trial. JAMA. 1999;281(7):613–620.
- , , , . Posthospital care transitions: patterns, complications, and risk identification. Health Serv Res. 2004;39(5):1449–1465.
- , , , et al. Transitions of care consensus policy statement: American College of Physicians, Society of General Internal Medicine, Society of Hospital Medicine, American Geriatrics Society, American College of Emergency Physicians, and Society for Academic Emergency Medicine. J Hosp Med. 2009;4(6):364–370.
- , , , et al. Association of self‐reported hospital discharge handoffs with 30‐day readmissions. JAMA Intern Med. 2013;173(8):624–629.
- , . Socioeconomic disparities in health: pathways and policies. Health Aff (Millwood). 2002;21(2):60–76.
- , , , . Comorbidity measures for use with administrative data. Med Care. 1998;36(1):8–27.
- , , , , , . Functional status impairment is associated with unplanned readmissions. Arch Phys Med Rehabil. 2013;94(10):1951–1958.
- Centers for Medicare 35(10):1044–1059.
- , , , et al. Understanding and execution of discharge instructions. Am J Med Qual. 2013;28(5):383–391.
- , , , , . Beyond the hospital gates: elucidating the interactive association of social support, depressive symptoms, and physical function with 30‐day readmissions. Am J Phys Med Rehabil. 2015;94(7):555–567.
- , , , et al. Improving the discharge process by embedding a discharge facilitator in a resident team. J Hosp Med. 2011;6(9):494–500.
- , , , et al. Hospital variation in quality of discharge summaries for patients hospitalized with heart failure exacerbation. Circ Cardiovasc Qual Outcomes. 2015;8(1):77–86
- , , , . Addressing the business of discharge: building a case for an electronic discharge summary. J Hosp Med. 2011;6(1):37–42.
- , , , , . Joint commission requirements for discharge instructions in patients with heart failure: is understanding important for preventing readmissions? J Card Fail. 2014;20(9):641–649.
- , , , et al. Association of communication between hospital‐based physicians and primary care providers with patient outcomes. J Gen Intern Med. 2009;24(3):381–386.
- , , , et al. Underlying reasons associated with hospital readmission following surgery in the united states. JAMA. 2015;313(5):483–495.
- , , , , . Assessing quality and efficiency of discharge summaries. Am J Med Qual. 2005;20(6):337–343.
- , , , et al. Comprehensive quality of discharge summaries at an academic medical center. J Hosp Med. 2013;8(8):436–443.
© 2016 Society of Hospital Medicine