User login
The Nuremberg Code in 1947,1 the Declaration of Helsinki in 1964,2 and the Belmont Report in 19793 were cornerstones in the establishment of ethical principles in the medical field. These documents specifically highlight the concept of informed consent, which maintains that to practice ethical medicine, physicians must fully inform patients of all therapeutic benefits and especially risks as well as treatment alternatives before they consent to therapeutic intervention. Educating patients about risks of treatment is obligatory. Risk communication involves a mutual exchange of information between physicians and patients; the physician presents risk information in an understandable manner that adequately conveys pertinent data that is critical for the patient to make an informed therapeutic decision.4
An inherent problem with risk education is that patients may be terrified about risks associated with treatment. Some patients will refuse needed treatment because of fear.5 When patients have concerns about the safety profile of a treatment regimen and potential adverse effects, they may be less compliant with treatment.6 The intelligent noncompliance phenomenon occurs when a patient knowingly makes the choice to not adhere to treatment, and concern regarding treatment risks relative to benefits is a common reason underlying this phenomenon.7,8
Behavioral economists have studied how individuals weigh risks. Kahneman and Tversky’s9 prospect theory asserts that individuals tend to overweigh unlikely risks and underweigh more certain risks, which they call the certainty effect; it is the basis of the human tendency to avoid risks in situations of likely gain and to pursue risks in situations of likely loss. The tendency to overweigh rare risks is even more pronounced for affect-rich events such as serious side effects.10 The way data are presented can affect how patients interpret the information. Context and framing of data affect patients’ perceptions.11 We describe several ways to present safety data using graphical presentation of psoriasis treatment safety data as an example and explain how each one can affect patients’ perception of treatment risks.
Approaches to Presenting Safety Data
There are numerous ways to present safety data to patients, including verbal, numeric, and visual strategies.12 Many methods of presentation are a combination of these strategies. Graphs are visual strategies to further categorize and present numeric data, and physicians may choose to incorporate these aids when presenting safety information to patients. Graphical presentations give the patient a mental picture of the data. Numerous types of graphs can be constructed. Kalb et al13 determined the effect of psoriasis treatment on the risk of serious infection from the Psoriasis Longitudinal Assessment and Registry (PSOLAR). We used the results from this study to demonstrate multiple ways of presenting safety data (Figures 1–3).
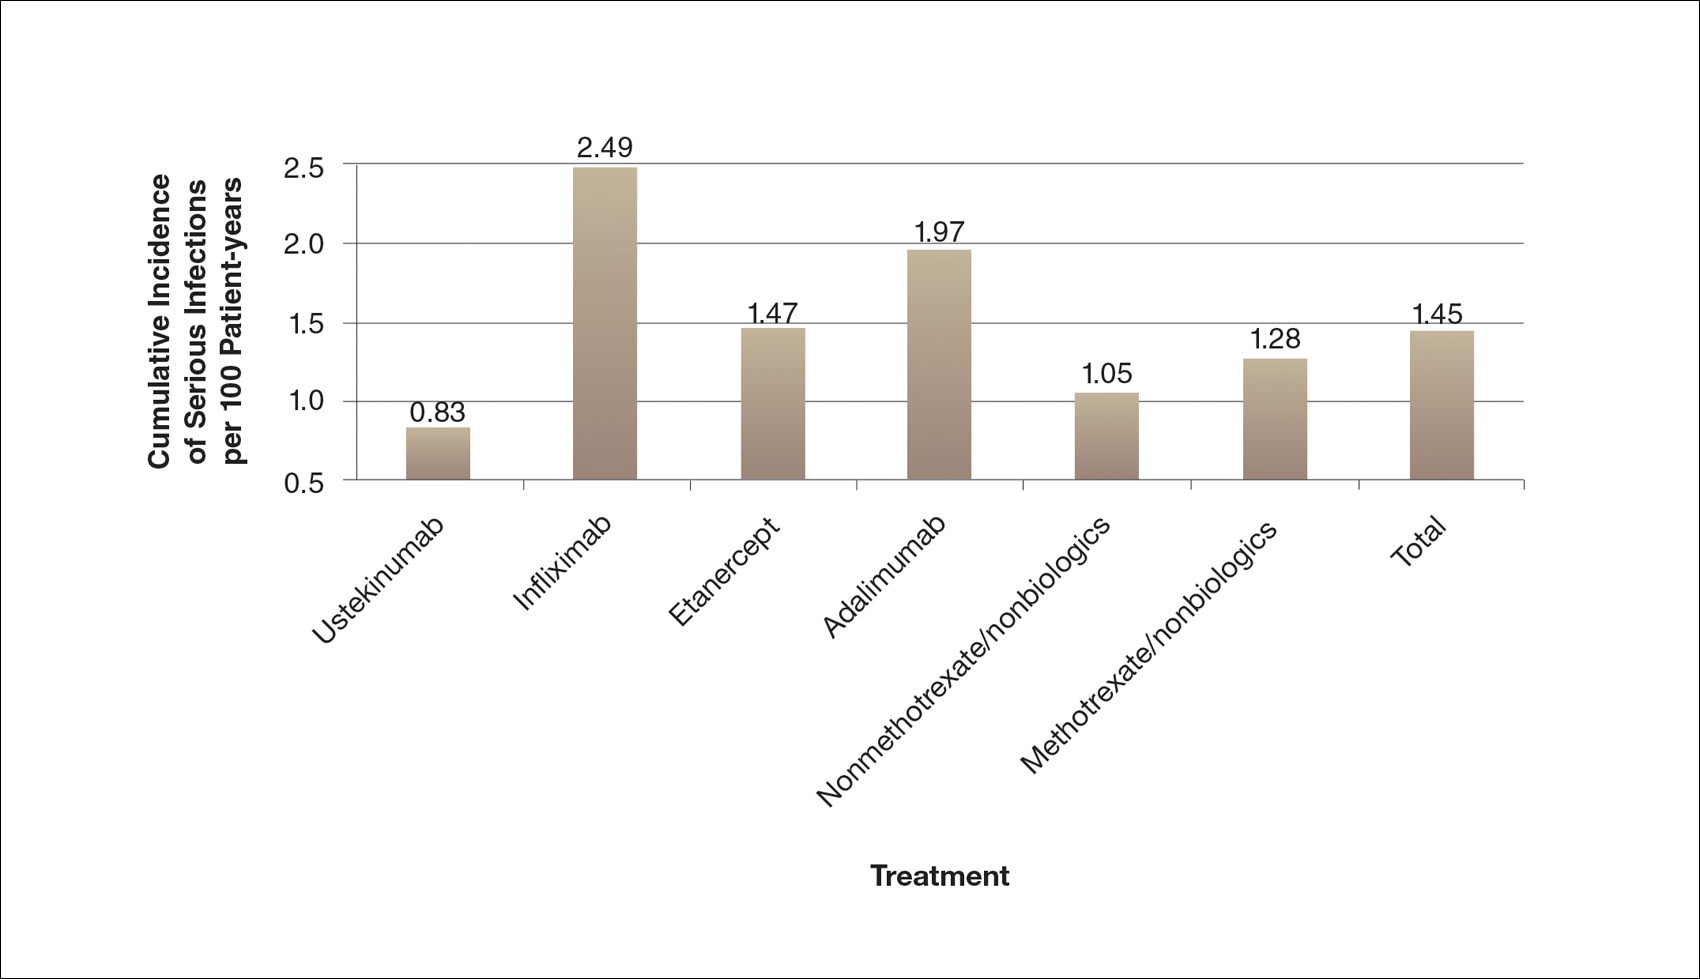
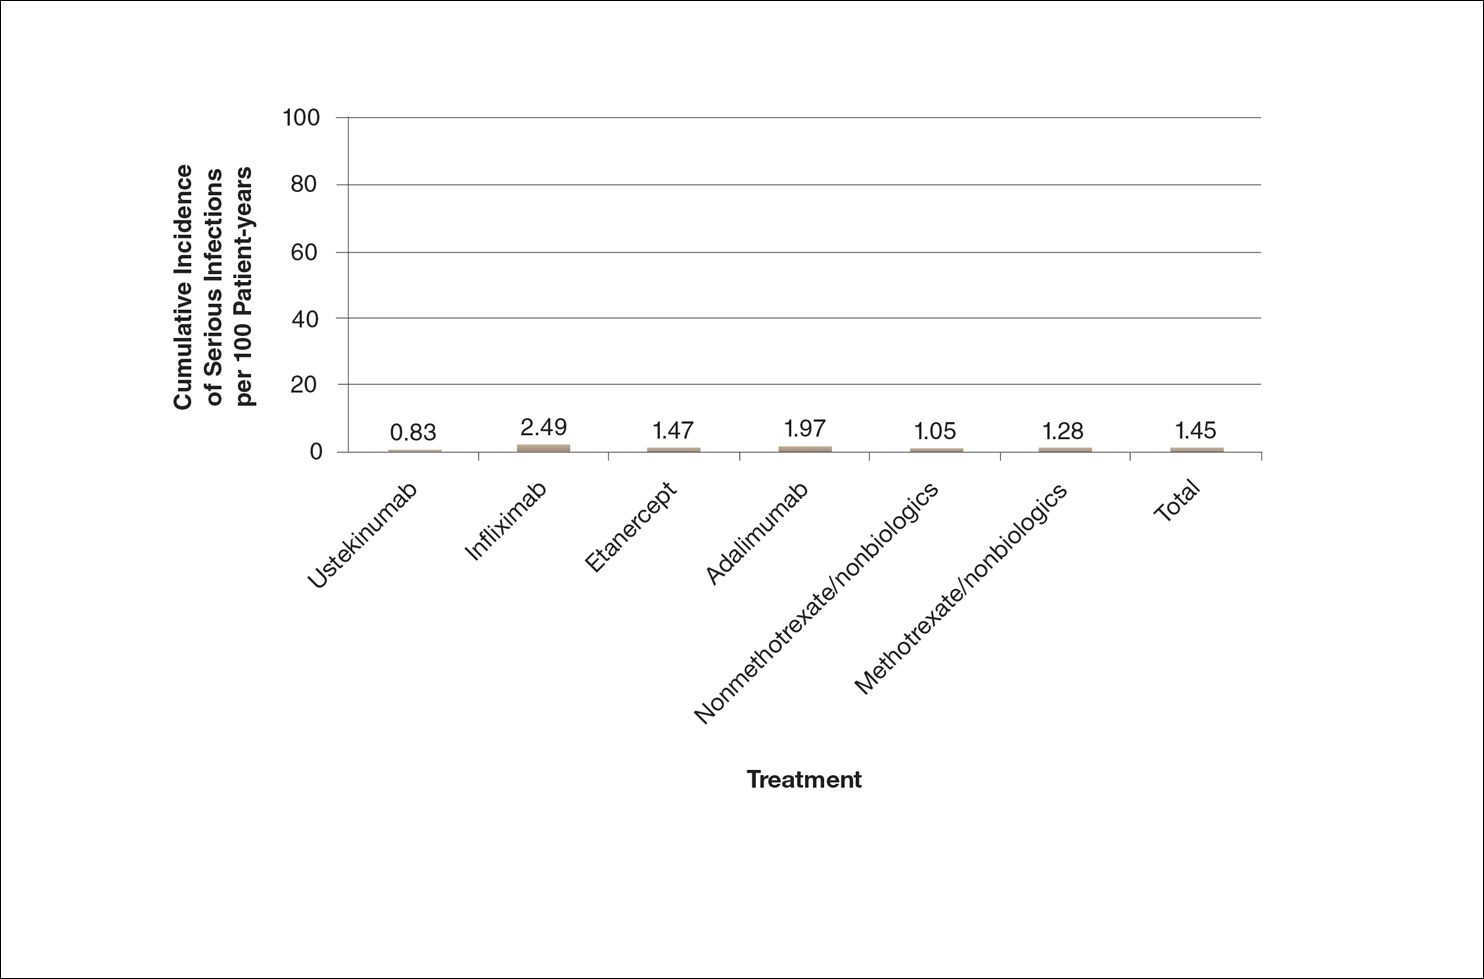
A graphical presentation with a truncated y-axis is a common approach (Figure 1). Graphs with truncated axes are sometimes used to conserve space or to accentuate certain differences in the graph that would otherwise be less obvious without the zoomed in y-axis.14 These graphs present quantitatively accurate information that can be visually misleading at the same time. Truncated axes accentuate differences, creating mental impressions that are not reflective of the magnitude of the numeric differences. Alternatively, a graph with a full y-axis includes both the maximum and minimum data values on the y-axis (Figure 2). The y-axis also extends maximally to the total number of patients or patient-years studied. This type of graph presents all of the numeric data without distortion.
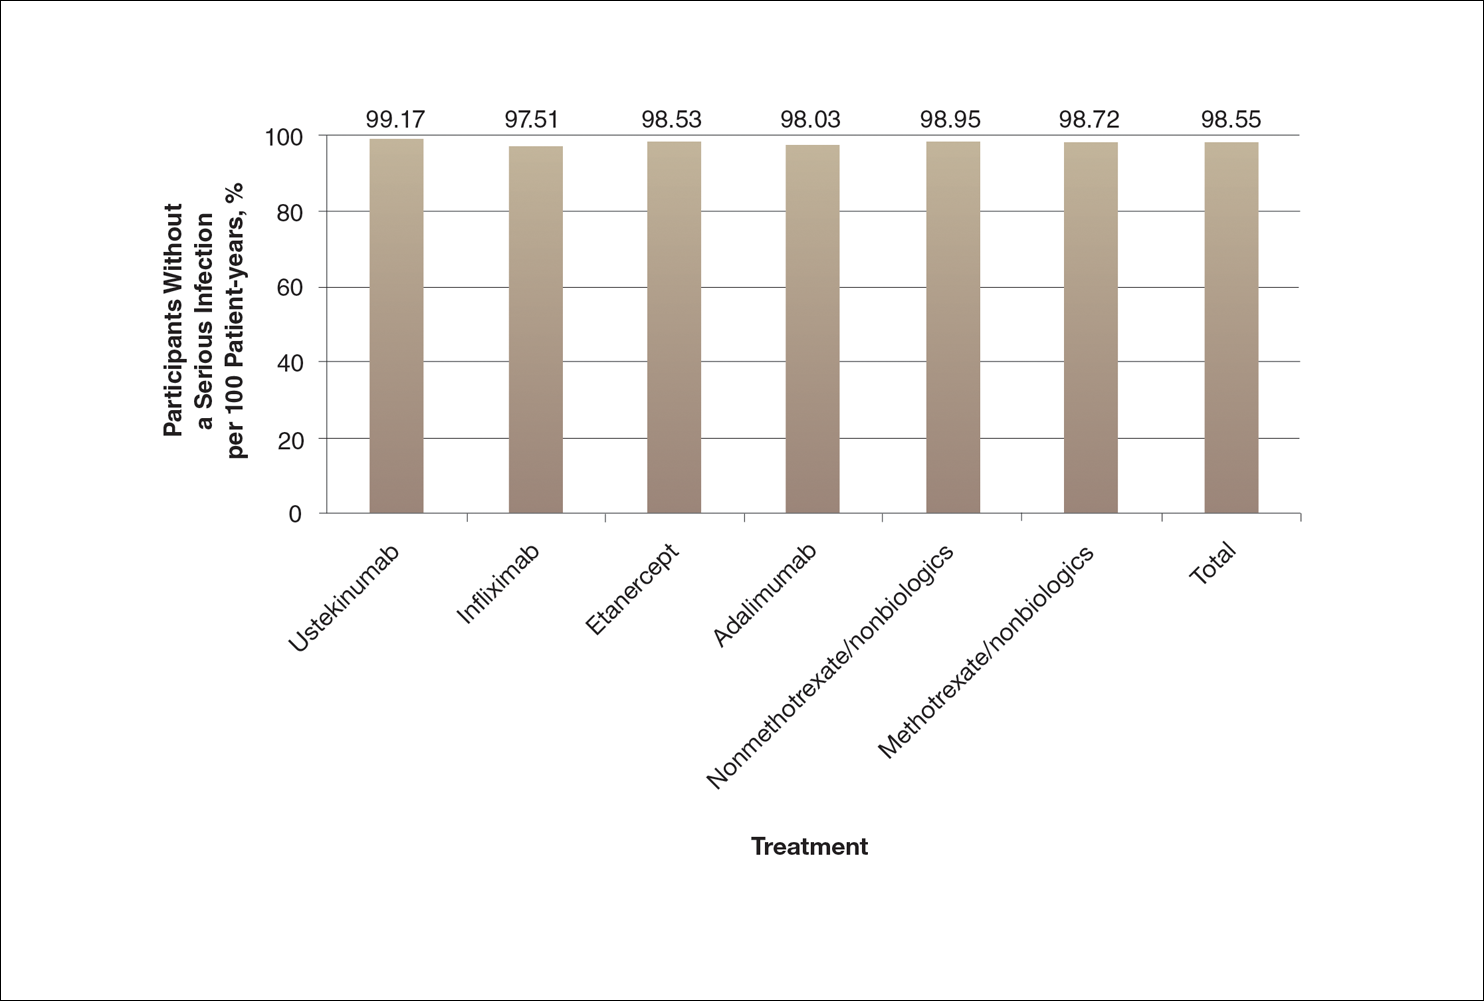
A graph also can present the percentage of patients or patient-years that do not have an adverse effect (Figure 3). This inverse presentation of the data does not emphasize rare cases of patients who have had adverse effects; instead, it emphasizes the large percentage of patients who did not have adverse effects and presents a far more reassuring perspective, even though mathematically the information is identical.
Focus on the Patients Who Do Not Have Adverse Effects of Treatments
Fear of adverse effects is one of the most commonly reported causes of poor treatment adherence.15 New therapies for psoriasis are highly effective and safe, but as with all treatments, they also are associated with some risks. Patients may latch onto those risks too tightly or perhaps, in other circumstances, not tightly enough. The method used by a physician to present safety data to a patient may determine the patient’s perception about treatments.
When trying to give patients an accurate impression of treatment risks, it may be helpful to avoid approaches that focus on presenting the (few) cases of severe adverse drug effects since patients (and physicians) are likely to overweigh the unlikely risk of having an adverse effect if presented with this information. It may be more reassuring to focus on presenting information about the chance of not having an adverse drug effect, assuming the physician’s goal is to be reassuring.
Poor communication with patients when presenting safety data can foster exaggerated fears of an unlikely consequence to the point that patients can be left undertreated and sustaining disease symptoms.16 Physicians may strive to do no harm to their patients, but without careful presentation of safety data in the process of helping the patient make an informed decision, it is possible to do mental harm to patients in the form of fear or even, in the case of nonadherence or treatment refusal, physical harm in the form of continued disease symptoms.
One limitation of this review is that we only used graphical presentation of data as an example. Similar concerns apply to numerical data presentation. Telling a patient the risk of a severe adverse reaction is doubled by a certain treatment may be terrifying, though if the baseline risk is rare, doubling the baseline risk may represent only a minimal increase in the absolute risk. Telling a patient the risk is only 1 in 1000 may still be alarming because many patients tend to focus on the 1, but telling a patient that 999 of 1000 patients do not have a problem can be much more reassuring.
The physician’s goal—to help patients make informed decisions about their treatment—calls for him/her to assimilate safety data into useful information that the patient can use to make an informed decision.17 Overly comforting or alarming, confusing, and inaccurate information can misguide the patient, violating the ethical principle of nonmaleficence. Although there is an obligation to educate patients about risks, there may not be a purely objective way to do it. When physicians present objective data to patients, whether in numerical or graphical form, there will be an unavoidable subjective interpretation of the data. The form of presentation will have a critical effect on patients’ subjective perceptions. Physicians can present objective data in such a way as to be reassuring or frightening.
Conclusion
Despite physicians’ best-intentioned efforts, it may be impossible to avoid presenting safety data in a way that will be subjectively interpreted by patients. Physicians have a choice in how they present data to patients; their best judgment should be used in how they present data to inform patients, guide them, and offer them the best treatment outcomes.
Acknowledgment
We thank Scott Jaros, BA (Winston-Salem, North Carolina), for his assistance in the revision of the manuscript.
- Freyhofer HH. The Nuremberg Medical Trial: The Holocaust and the Origin of the Nuremberg Medical Code. New York, NY: Peter Lang Publishing; 2004.
- Carlson R, Boyd KM, Webb DJ. The revision of the Declaration of Helsinki: past, present and future. Br J Clin Pharmacol. 2004;57:695-713.
- Office for Human Research Protections. The Belmont Report. Rockville, MD: US Department of Health and Human Services; 1979.
- Edwards A, Elwyn G, Mulley A. Explaining risks: turning numerical data into meaningful pictures. BMJ. 2002;324:827-830.
- Hayden C, Neame R, Tarrant C. Patients’ adherence-related beliefs about methotrexate: a qualitative study of the role of written patient information. BMJ Open. 2015;5:e006918.
- Horne R, Weinman J. Patients’ beliefs about prescribed medicines and their role in adherence to treatment in chronic physical illness. J Psychosom Res. 1999;47:555-567.
- Weintraub M. Intelligent noncompliance with special emphasis on the elderly. Contemp Pharm Pract. 1981;4:8-11.
- Horne R. Representations of medication and treatment: advances in theory and measurement. In: Petrie KJ, Weinman JA, eds. Perceptions of Health and Illness: Current Research and Applications. London, England: Routledge, Taylor & Francis Group; 1997:155-188.
- Kahneman D, Tversky A. Prospect theory: an analysis of decision under risk. Econometrica. 1979;47:263-291.
- Rottenstreich Y, Hsee CK. Money, kisses, and electric shocks: on the affective psychology of risk. Psychol Sci. 2001;12:185-190.
- Kessler JB, Zhang CY. Behavioural economics and health. In: Detels R, Gulliford M, Abdool Karim Q, et al, eds. Oxford Textbook of Global Public Health. 6th ed. Oxford, UK: Oxford University Press; 2015:775-789.
- Lipkus IM. Numeric, verbal, and visual formats of conveying health risks: suggested best practices and future recommendations [published online September 14, 2007]. Med Decis Making. 2007;27:696-713.
- Kalb RE, Fiorentino DF, Lebwohl MG, et al. Risk of serious infection with biologic and systemic treatment of psoriasis: results from the Psoriasis Longitudinal Assessment and Registry (PSOLAR). JAMA Dermatol. 2015;151:961-969.
- Rensberger B. Slanting the slopes of graphs. The Washington Post. May 10, 1995. http://www.washingtonpost.com/archive/1995/05/10/slanting-the-slope-of-graphs/08a34412-60a2-4719-86e5-d7433938c166/. Accessed September 21, 2016.
- Horne R, Weinman J. Patients’ beliefs about prescribed medicines and their role in adherence to treatment in chronic physical illness. J Psychosom Res. 1999;47:555-567.
- Hahn RA. The nocebo phenomenon: concept, evidence, and implications for public health. Prev Med. 1997;26(5, pt 1):607-611.
- Paling J. Strategies to help patients understand risks. BMJ. 2003;327:745-748.
The Nuremberg Code in 1947,1 the Declaration of Helsinki in 1964,2 and the Belmont Report in 19793 were cornerstones in the establishment of ethical principles in the medical field. These documents specifically highlight the concept of informed consent, which maintains that to practice ethical medicine, physicians must fully inform patients of all therapeutic benefits and especially risks as well as treatment alternatives before they consent to therapeutic intervention. Educating patients about risks of treatment is obligatory. Risk communication involves a mutual exchange of information between physicians and patients; the physician presents risk information in an understandable manner that adequately conveys pertinent data that is critical for the patient to make an informed therapeutic decision.4
An inherent problem with risk education is that patients may be terrified about risks associated with treatment. Some patients will refuse needed treatment because of fear.5 When patients have concerns about the safety profile of a treatment regimen and potential adverse effects, they may be less compliant with treatment.6 The intelligent noncompliance phenomenon occurs when a patient knowingly makes the choice to not adhere to treatment, and concern regarding treatment risks relative to benefits is a common reason underlying this phenomenon.7,8
Behavioral economists have studied how individuals weigh risks. Kahneman and Tversky’s9 prospect theory asserts that individuals tend to overweigh unlikely risks and underweigh more certain risks, which they call the certainty effect; it is the basis of the human tendency to avoid risks in situations of likely gain and to pursue risks in situations of likely loss. The tendency to overweigh rare risks is even more pronounced for affect-rich events such as serious side effects.10 The way data are presented can affect how patients interpret the information. Context and framing of data affect patients’ perceptions.11 We describe several ways to present safety data using graphical presentation of psoriasis treatment safety data as an example and explain how each one can affect patients’ perception of treatment risks.
Approaches to Presenting Safety Data
There are numerous ways to present safety data to patients, including verbal, numeric, and visual strategies.12 Many methods of presentation are a combination of these strategies. Graphs are visual strategies to further categorize and present numeric data, and physicians may choose to incorporate these aids when presenting safety information to patients. Graphical presentations give the patient a mental picture of the data. Numerous types of graphs can be constructed. Kalb et al13 determined the effect of psoriasis treatment on the risk of serious infection from the Psoriasis Longitudinal Assessment and Registry (PSOLAR). We used the results from this study to demonstrate multiple ways of presenting safety data (Figures 1–3).
A graphical presentation with a truncated y-axis is a common approach (Figure 1). Graphs with truncated axes are sometimes used to conserve space or to accentuate certain differences in the graph that would otherwise be less obvious without the zoomed in y-axis.14 These graphs present quantitatively accurate information that can be visually misleading at the same time. Truncated axes accentuate differences, creating mental impressions that are not reflective of the magnitude of the numeric differences. Alternatively, a graph with a full y-axis includes both the maximum and minimum data values on the y-axis (Figure 2). The y-axis also extends maximally to the total number of patients or patient-years studied. This type of graph presents all of the numeric data without distortion.
A graph also can present the percentage of patients or patient-years that do not have an adverse effect (Figure 3). This inverse presentation of the data does not emphasize rare cases of patients who have had adverse effects; instead, it emphasizes the large percentage of patients who did not have adverse effects and presents a far more reassuring perspective, even though mathematically the information is identical.
Focus on the Patients Who Do Not Have Adverse Effects of Treatments
Fear of adverse effects is one of the most commonly reported causes of poor treatment adherence.15 New therapies for psoriasis are highly effective and safe, but as with all treatments, they also are associated with some risks. Patients may latch onto those risks too tightly or perhaps, in other circumstances, not tightly enough. The method used by a physician to present safety data to a patient may determine the patient’s perception about treatments.
When trying to give patients an accurate impression of treatment risks, it may be helpful to avoid approaches that focus on presenting the (few) cases of severe adverse drug effects since patients (and physicians) are likely to overweigh the unlikely risk of having an adverse effect if presented with this information. It may be more reassuring to focus on presenting information about the chance of not having an adverse drug effect, assuming the physician’s goal is to be reassuring.
Poor communication with patients when presenting safety data can foster exaggerated fears of an unlikely consequence to the point that patients can be left undertreated and sustaining disease symptoms.16 Physicians may strive to do no harm to their patients, but without careful presentation of safety data in the process of helping the patient make an informed decision, it is possible to do mental harm to patients in the form of fear or even, in the case of nonadherence or treatment refusal, physical harm in the form of continued disease symptoms.
One limitation of this review is that we only used graphical presentation of data as an example. Similar concerns apply to numerical data presentation. Telling a patient the risk of a severe adverse reaction is doubled by a certain treatment may be terrifying, though if the baseline risk is rare, doubling the baseline risk may represent only a minimal increase in the absolute risk. Telling a patient the risk is only 1 in 1000 may still be alarming because many patients tend to focus on the 1, but telling a patient that 999 of 1000 patients do not have a problem can be much more reassuring.
The physician’s goal—to help patients make informed decisions about their treatment—calls for him/her to assimilate safety data into useful information that the patient can use to make an informed decision.17 Overly comforting or alarming, confusing, and inaccurate information can misguide the patient, violating the ethical principle of nonmaleficence. Although there is an obligation to educate patients about risks, there may not be a purely objective way to do it. When physicians present objective data to patients, whether in numerical or graphical form, there will be an unavoidable subjective interpretation of the data. The form of presentation will have a critical effect on patients’ subjective perceptions. Physicians can present objective data in such a way as to be reassuring or frightening.
Conclusion
Despite physicians’ best-intentioned efforts, it may be impossible to avoid presenting safety data in a way that will be subjectively interpreted by patients. Physicians have a choice in how they present data to patients; their best judgment should be used in how they present data to inform patients, guide them, and offer them the best treatment outcomes.
Acknowledgment
We thank Scott Jaros, BA (Winston-Salem, North Carolina), for his assistance in the revision of the manuscript.
- Freyhofer HH. The Nuremberg Medical Trial: The Holocaust and the Origin of the Nuremberg Medical Code. New York, NY: Peter Lang Publishing; 2004.
- Carlson R, Boyd KM, Webb DJ. The revision of the Declaration of Helsinki: past, present and future. Br J Clin Pharmacol. 2004;57:695-713.
- Office for Human Research Protections. The Belmont Report. Rockville, MD: US Department of Health and Human Services; 1979.
- Edwards A, Elwyn G, Mulley A. Explaining risks: turning numerical data into meaningful pictures. BMJ. 2002;324:827-830.
- Hayden C, Neame R, Tarrant C. Patients’ adherence-related beliefs about methotrexate: a qualitative study of the role of written patient information. BMJ Open. 2015;5:e006918.
- Horne R, Weinman J. Patients’ beliefs about prescribed medicines and their role in adherence to treatment in chronic physical illness. J Psychosom Res. 1999;47:555-567.
- Weintraub M. Intelligent noncompliance with special emphasis on the elderly. Contemp Pharm Pract. 1981;4:8-11.
- Horne R. Representations of medication and treatment: advances in theory and measurement. In: Petrie KJ, Weinman JA, eds. Perceptions of Health and Illness: Current Research and Applications. London, England: Routledge, Taylor & Francis Group; 1997:155-188.
- Kahneman D, Tversky A. Prospect theory: an analysis of decision under risk. Econometrica. 1979;47:263-291.
- Rottenstreich Y, Hsee CK. Money, kisses, and electric shocks: on the affective psychology of risk. Psychol Sci. 2001;12:185-190.
- Kessler JB, Zhang CY. Behavioural economics and health. In: Detels R, Gulliford M, Abdool Karim Q, et al, eds. Oxford Textbook of Global Public Health. 6th ed. Oxford, UK: Oxford University Press; 2015:775-789.
- Lipkus IM. Numeric, verbal, and visual formats of conveying health risks: suggested best practices and future recommendations [published online September 14, 2007]. Med Decis Making. 2007;27:696-713.
- Kalb RE, Fiorentino DF, Lebwohl MG, et al. Risk of serious infection with biologic and systemic treatment of psoriasis: results from the Psoriasis Longitudinal Assessment and Registry (PSOLAR). JAMA Dermatol. 2015;151:961-969.
- Rensberger B. Slanting the slopes of graphs. The Washington Post. May 10, 1995. http://www.washingtonpost.com/archive/1995/05/10/slanting-the-slope-of-graphs/08a34412-60a2-4719-86e5-d7433938c166/. Accessed September 21, 2016.
- Horne R, Weinman J. Patients’ beliefs about prescribed medicines and their role in adherence to treatment in chronic physical illness. J Psychosom Res. 1999;47:555-567.
- Hahn RA. The nocebo phenomenon: concept, evidence, and implications for public health. Prev Med. 1997;26(5, pt 1):607-611.
- Paling J. Strategies to help patients understand risks. BMJ. 2003;327:745-748.
Practice Points
- Physicians can guide patients’ perceptions of drug safety by the way safety data are presented.
- For patients who are concerned about rare treatment risks, presenting data on the patients who have not experienced adverse effects can be reassuring.