User login
Overuse of inpatient stat laboratory orders (stat is an abbreviation of the Latin word statim, meaning immediately, without delay; alternatively, some consider it an acronym for short turnaround time) is a major problem in the modern healthcare system.[1, 2, 3, 4, 5] Ordering laboratory tests stat is a common way to expedite processing, with expectation of results being reported within 1 hour from the time ordered, according to the College of American Pathologists.[6] However, stat orders are also requested for convenience,[2] to expedite discharge,[7] or to meet expectation of turnaround times.[8, 9, 10] Overuse of stat orders increases cost and may reduce the effectiveness of a system. Reduction of excessive stat order requests helps support safe and efficient patient care[11, 12] and may reduce laboratory costs.[13, 14]
Several studies have examined interventions to optimize stat laboratory utilization.[14, 15] Potentially effective interventions include establishment of stat ordering guidelines, utilization of point‐of‐care testing, and prompt feedback via computerized physician order entry (CPOE) systems.[16, 17, 18] However, limited evidence is available regarding the effectiveness of audit and feedback in reducing stat ordering frequency.
Our institution shared the challenge of a high frequency of stat laboratory test orders. An interdisciplinary working group comprising leadership in the medicine, surgery, informatics, laboratory medicine, and quality and patient safety departments was formed to approach this problem and identify potential interventions. The objectives of this study are to describe the patterns of stat orders at our institution as well as to assess the effectiveness of the targeted individual feedback intervention in reducing utilization of stat laboratory test orders.
METHODS
Design
This study is a retrospective analysis of administrative data for a quality‐improvement project. The study was deemed exempt from review by the Beth Israel Medical Center Institutional Review Board.
Setting
Beth Israel Medical Center is an 856‐bed, urban, tertiary‐care teaching hospital with a capacity of 504 medical and surgical beds. In October 2009, 47.8% of inpatient laboratory tests (excluding the emergency department) were ordered as stat, according to an electronic audit of our institution's CPOE system, GE Centricity Enterprise (GE Medical Systems Information Technologies, Milwaukee, WI). Another audit using the same data query for the period of December 2009 revealed that 50 of 488 providers (attending physicians, nurse practitioners, physician assistants, fellows, and residents) accounted for 51% of total stat laboratory orders, and that Medicine and General Surgery residents accounted for 43 of these 50 providers. These findings prompted us to develop interventions that targeted high utilizers of stat laboratory orders, especially Medicine and General Surgery residents.
Teaching Session
Medicine and General Surgery residents were given a 1‐hour educational session at a teaching conference in January 2010. At this session, residents were instructed that ordering stat laboratory tests was appropriate when the results were needed urgently to make clinical decisions as quickly as possible. This session also explained the potential consequences associated with excessive stat laboratory orders and provided department‐specific data on current stat laboratory utilization.
Individual Feedback
From January to May 2010, a list of stat laboratory orders by provider was generated each month by the laboratory department's database. The top 10 providers who most frequently placed stat orders were identified and given individual feedback by their direct supervisors based on data from the prior month (feedback provided from February to June 2010). Medicine and General Surgery residents were counseled by their residency program directors, and nontrainee providers by their immediate supervising physicians. Feedback and counseling were given via brief individual meetings, phone calls, or e‐mail. Supervisors chose the method that ensured the most timely delivery of feedback. Feedback and counseling consisted of explaining the effort to reduce stat laboratory ordering and the rationale behind this, alerting providers that they were outliers, and encouraging them to change their behavior. No punitive consequences were discussed; the feedback sessions were purely informative in nature. When an individual was ranked again in the top 10 after receiving feedback, he or she received repeated feedback.
Data Collection and Measured Outcomes
We retrospectively collected data on monthly laboratory test orders by providers from September 2009 to June 2010. The data were extracted from the electronic medical record (EMR) system and included any inpatient laboratory orders at the institution. Laboratory orders placed in the emergency department were excluded. Providers were divided into nontrainees (attending physicians, nurse practitioners, and physician assistants) and trainee providers (residents and fellows). Trainee providers were further categorized by educational levels (postgraduate year [PGY]‐1 vs PGY‐2 or higher) and specialty (Medicine vs General Surgery vs other). Fellows in medical and surgical subspecialties were categorized as other.
The primary outcome measure was the proportion of stat orders out of total laboratory orders for individuals. The proportion of stat orders out of total orders was selected to assess individuals' tendency to utilize stat laboratory orders.
Statistical Analysis
In the first analysis, stat and total laboratory orders were aggregated for each provider. Providers who ordered <10 laboratory tests during the study period were excluded. We calculated the proportion of stat out of total laboratory orders for each provider, and compared it by specialty, by educational level, and by feedback status. Median and interquartile range (IQR) were reported due to non‐normal distribution, and the Wilcoxon rank‐sum test was used for comparisons.
In the second analysis, we determined pre‐feedback and post‐feedback periods for providers who received feedback. The feedback month was defined as the month immediately after a provider was ranked in the top 10 for the first time during the intervention period. For each provider, stat orders and total laboratory orders during months before and after the feedback month, excluding the feedback month, were calculated. The change in the proportion of stat laboratory orders out of all orders from pre‐ to post‐feedback was then calculated for each provider for whom both pre‐ and post‐feedback data were available. Because providers may have utilized an unusually high proportion of stat orders during the months in which they were ranked in the top 10 (for example, due to being on rotations in which many orders are placed stat, such as the intensive care units), we conducted a sensitivity analysis excluding those months. Further, for comparison, we conducted the same analysis for providers who did not receive feedback and were ranked 11 to 30 in any month during the intervention period. In those providers, we considered the month immediately after a provider was ranked in the 11 to 30 range for the first time as the hypothetical feedback month. The proportional change in the stat laboratory ordering was analyzed using the paired Student t test.
In the third analysis, we calculated the proportion of stat laboratory orders each month for each provider. Individual provider data were excluded if total laboratory orders for the month were <10. We then calculated the average proportion of stat orders for each specialty and educational level among trainee providers every month, and plotted and compared the trends.
All analyses were performed with JMP software version 9.0 (SAS Institute, Inc., Cary, NC). All statistical tests were 2‐sided, and P < 0.05 was considered significant.
RESULTS
We identified 1045 providers who ordered 1 laboratory test from September 2009 to June 2010. Of those, 716 were nontrainee providers and 329 were trainee providers. Among the trainee providers, 126 were Medicine residents, 33 were General Surgery residents, and 103 were PGY‐1. A total of 772,734 laboratory tests were ordered during the study period, and 349,658 (45.2%) tests were ordered as stat. Of all stat orders, 179,901 (51.5%) were ordered by Medicine residents and 52,225 (14.9%) were ordered by General Surgery residents.
Thirty‐seven providers received individual feedback during the intervention period. This group consisted of 8 nontrainee providers (nurse practitioners and physician assistants), 21 Medicine residents (5 were PGY‐1), and 8 General Surgery residents (all PGY‐1). This group ordered a total of 84,435 stat laboratory tests from September 2009 to June 2010 and was responsible for 24.2% of all stat laboratory test orders at the institution.
Provider Analysis
After exclusion of providers who ordered <10 laboratory tests from September 2009 to June 2010, a total of 807 providers remained. The median proportion of stat orders out of total orders was 40% among all providers and 41.6% for nontrainee providers (N = 500), 38.7% for Medicine residents (N = 125), 80.2% for General Surgery residents (N = 32), and 24.2% for other trainee providers (N = 150). The proportion of stat orders differed significantly by specialty and educational level, but also even among providers in the same specialty at the same educational level. Among PGY‐1 residents, the stat‐ordering proportion ranged from 6.9% to 49.1% for Medicine (N = 54) and 69.0% to 97.1% for General Surgery (N = 16). The proportion of stat orders was significantly higher among providers who received feedback compared with those who did not (median, 72.4% [IQR, 55.0%89.5%] vs 39.0% [IQR, 14.9%65.7%], P < 0.001). When stratified by specialty and educational level, the statistical significance remained in nontrainee providers and trainee providers with higher educational level, but not in PGY‐1 residents (Table 1).
| All Providers | Feedback Given | Feedback Not Given | |||||
|---|---|---|---|---|---|---|---|
| N | Stat % | N | Stat % | N | Stat % | P Valuea | |
| |||||||
| Total | 807 | 40 (15.869.0) | 37 | 72.4 (55.089.5) | 770 | 39.0 (14.965.7) | <0.001 |
| Nontrainee providersb | 500 | 41.6 (13.571.5) | 8 | 91.7 (64.097.5) | 492 | 40.2 (13.270.9) | <0.001 |
| Trainee providersc | 307 | 37.8 (19.162.7) | 29 | 69.3 (44.380.9) | 278 | 35.1 (17.655.6) | <0.001 |
| Medicine | 125 | 38.7 (26.850.4) | 21 | 58.8 (36.872.6) | 104 | 36.1 (25.945.6) | <0.001 |
| PGY‐1 | 54 | 28.1 (23.935.2) | 5 | 32.0 (25.536.8) | 49 | 27.9 (23.534.6) | 0.52 |
| PGY‐2 and higher | 71 | 46.5 (39.160.4) | 16 | 63.9 (54.575.7) | 55 | 45.1 (36.554.9) | <0.001 |
| General surgery | 32 | 80.2 (69.690.1) | 8 | 89.5 (79.392.7) | 24 | 78.7 (67.987.4) | <0.05 |
| PGY‐1 | 16 | 86.4 (79.191.1) | 8 | 89.5 (79.392.7) | 8 | 84.0 (73.289.1) | 0.25 |
| PGY‐2 and higher | 16 | 74.4 (65.485.3) | |||||
| Other | 150 | 24.2 (9.055.0) | |||||
| PGY‐1 | 31 | 28.2 (18.478.3) | |||||
| PGY‐2 or higher | 119 | 20.9 (5.651.3) | |||||
Stat Ordering Pattern Change by Individual Feedback
Among 37 providers who received individual feedback, 8 providers were ranked in the top 10 more than once and received repeated feedback. Twenty‐seven of 37 providers had both pre‐feedback and post‐feedback data and were included in the analysis. Of those, 7 were nontrainee providers, 16 were Medicine residents (5 were PGY‐1), and 4 were General Surgery residents (all PGY‐1). The proportion of stat laboratory orders per provider decreased by 15.7% (95% confidence interval [CI]: 5.6% to 25.9%, P = 0.004) after feedback (Table 2). The decrease remained significant after excluding the months in which providers were ranked in the top 10 (11.4%; 95% CI: 0.7% to 22.1%, P = 0.04).
| Top 10 Providers (Received Feedback) | Providers Ranked in 1130 (No Feedback) | |||||||||
|---|---|---|---|---|---|---|---|---|---|---|
| N | Mean Stat % | Mean Difference (95% CI) | P Value | N | Mean Stat % | Mean Difference (95% CI) | P Value | |||
| Pre | Post | Pre | Post | |||||||
| ||||||||||
| Total | 27 | 71.2 | 55.5 | 15.7 (25.9 to 5.6) | 0.004 | 39 | 64.6 | 60.2 | 4.5 (11.0 to 2.1) | 0.18 |
| Nontrainee providers | 7 | 94.6 | 73.2 | 21.4 (46.9 to 4.1) | 0.09 | 12 | 84.4 | 80.6 | 3.8 (11.9 to 4.3) | 0.32 |
| Trainee providers | 20 | 63.0 | 49.3 | 13.7 (25.6 to 1.9) | 0.03 | 27 | 55.8 | 51.1 | 4.7 (13.9 to 4.4) | 0.30 |
| Medicine | 16 | 55.8 | 45.0 | 10.8 (23.3 to 1.6) | 0.08 | 21 | 46.2 | 41.3 | 4.8 (16.3 to 6.7) | 0.39 |
| General Surgery | 4 | 91.9 | 66.4 | 25.4 (78.9 to 28.0) | 0.23 | 6 | 89.6 | 85.2 | 4.4 (20.5 to 11.6) | 0.51 |
| PGY‐1 | 9 | 58.9 | 47.7 | 11.2 (32.0 to 9.5) | 0.25 | 15 | 55.2 | 49.2 | 6.0 (18.9 to 6.9) | 0.33 |
| PGY‐2 or Higher | 11 | 66.4 | 50.6 | 15.8 (32.7 to 1.1) | 0.06 | 12 | 56.6 | 53.5 | 3.1 (18.3 to 12.1) | 0.66 |
In comparison, a total of 57 providers who did not receive feedback were in the 11 to 30 range during the intervention period. Three Obstetrics and Gynecology residents and 3 Family Medicine residents were excluded from the analysis to match specialty with providers who received feedback. Thirty‐nine of 51 providers had adequate data and were included in the analysis, comprising 12 nontrainee providers, 21 Medicine residents (10 were PGY‐1), and 6 General Surgery residents (5 were PGY‐1). Among them, the proportion of stat laboratory orders per provider did not change significantly, with a 4.5% decrease (95% CI: 2.1% to 11.0%, P = 0.18; Table 2).
Stat Ordering Trends Among Trainee Providers
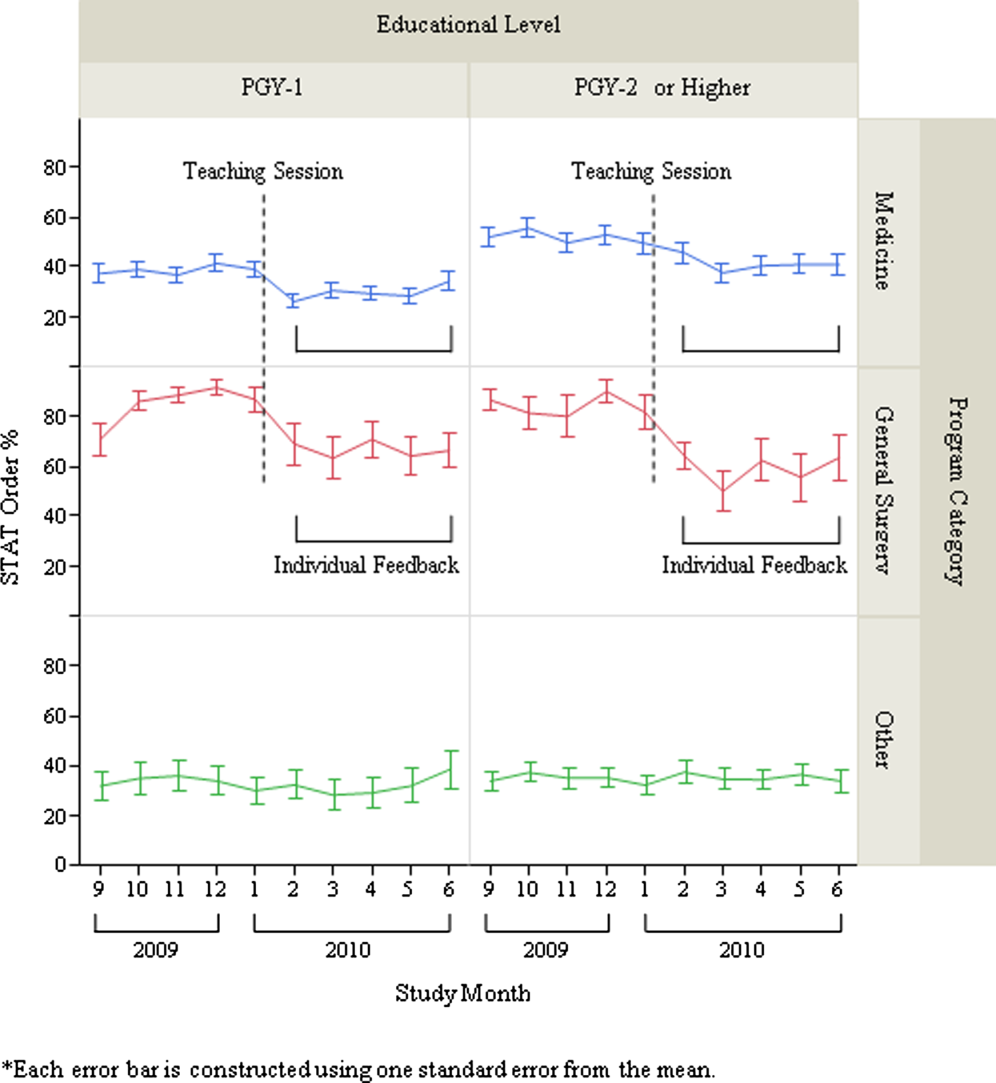
After exclusion of data for the month with <10 total laboratory tests per provider, a total of 303 trainee providers remained, providing 2322 data points for analysis. Of the 303, 125 were Medicine residents (54 were PGY‐1), 32 were General Surgery residents (16 were PGY‐1), and 146 were others (31 were PGY‐1). The monthly trends for the average proportion of stat orders among those providers are shown in Figure 1. The decrease in the proportion of stat orders was observed after January 2010 in Medicine and General Surgery residents both in PGY‐1 and PGY‐2 or higher, but no change was observed in other trainee providers.

DISCUSSION
We describe a series of interventions implemented at our institution to decrease the utilization of stat laboratory orders. Based on an audit of laboratory‐ordering data, we decided to target high utilizers of stat laboratory tests, especially Medicine and General Surgery residents. After presenting an educational session to those residents, we gave individual feedback to the highest utilizers of stat laboratory orders. Providers who received feedback decreased their utilization of stat laboratory orders, but the stat ordering pattern did not change among those who did not receive feedback.
The individual feedback intervention involved key stakeholders for resident and nontrainee provider education (directors of the Medicine and General Surgery residency programs and other direct clinical supervisors). The targeted feedback was delivered via direct supervisors and was provided more than once as needed, which are key factors for effective feedback in modifying behavior in professional practice.[19] Allowing the supervisors to choose the most appropriate form of feedback for each individual (meetings, phone calls, or e‐mail) enabled timely and individually tailored feedback and contributed to successful implementation. We feel intervention had high educational value for residents, as it promoted residents' engagement in proper systems‐based practice, one of the 6 core competencies of the Accreditation Council for Graduate Medical Education (ACGME).
We utilized the EMR to obtain provider‐specific data for feedback and analysis. As previously suggested, the use of the EMR for audit and feedback was effective in providing timely, actionable, and individualized feedback with peer benchmarking.[20, 21] We used the raw number of stat laboratory orders for audit and the proportion of stat orders out of total orders to assess the individual behavioral patterns. Although the proportional use of stat orders is affected by patient acuity and workplace or rotation site, it also seems largely affected by provider's preference or practice patterns, as we saw the variance among providers of the same specialty and educational level. The changes in the stat ordering trends only seen among Medicine and General Surgery residents suggests that our interventions successfully decreased the overall utilization of stat laboratory orders among targeted providers, and it seems less likely that those decreases are due to changes in patient acuity, changes in rotation sites, or learning curve among trainee providers. When averaged over the 10‐month study period, as shown in Table 1, the providers who received feedback ordered a higher proportion of stat tests than those who did not receive feedback, except for PGY‐1 residents. This suggests that although auditing based on the number of stat laboratory orders identified providers who tended to order more stat tests than others, it may not be a reliable indicator for PGY‐1 residents, whose number of laboratory orders highly fluctuates by rotation.
There are certain limitations to our study. First, we assumed that the top utilizers were inappropriately ordering stat laboratory tests. Because there is no clear consensus as to what constitutes appropriate stat testing,[7] it was difficult, if not impossible, to determine which specific orders were inappropriate. However, high variability of the stat ordering pattern in the analysis provides some evidence that high stat utilizers customarily order more stat testing as compared with others. A recent study also revealed that the median stat ordering percentage was 35.9% among 52 US institutions.[13] At our institution, 47.8% of laboratory tests were ordered stat prior to the intervention, higher than the benchmark, providing the rationale for our intervention.
Second, the intervention was conducted in a time‐series fashion and no randomization was employed. The comparison of providers who received feedback with those who did not is subject to selection bias, and the difference in the change in stat ordering pattern between these 2 groups may be partially due to variability of work location, rotation type, or acuity of patients. However, we performed a sensitivity analysis excluding the months when the providers were ranked in the top 10, assuming that they may have ordered an unusually high proportion of stat tests due to high acuity of patients (eg, rotation in the intensive care units) during those months. Robust results in this analysis support our contention that individual feedback was effective. In addition, we cannot completely rule out the possibility that the changes in stat ordering practice may be solely due to natural maturation effects within an academic year among trainee providers, especially PGY‐1 residents. However, relatively acute changes in the stat ordering trends only among targeted provider groups around January 2010, corresponding to the timing of interventions, suggest otherwise.
Third, we were not able to test if the intervention or decrease in stat orders adversely affected patient care. For example, if, after receiving feedback, providers did not order some tests stat that should have been ordered that way, this could have negatively affected patient care. Additionally, we did not evaluate whether reduction in stat laboratory orders improved timeliness of the reporting of stat laboratory results.
Lastly, the sustained effect and feasibility of this intervention were not tested. Past studies suggest educational interventions in laboratory ordering behavior would most likely need to be continued to maintain its effectiveness.[22, 23] Although we acknowledge that sustainability of this type of intervention may be difficult, we feel we have demonstrated that there is still value associated with giving personalized feedback.
This study has implications for future interventions and research. Use of automated, EMR‐based feedback on laboratory ordering performance may be effective in reducing excessive stat ordering and may obviate the need for time‐consuming efforts by supervisors. Development of quality indicators that more accurately assess stat ordering patterns, potentially adjusted for working sites and patient acuity, may be necessary. Studies that measure the impact of decreasing stat laboratory orders on turnaround times and cost may be of value.
CONCLUSION
At our urban, tertiary‐care teaching institution, stat ordering frequency was highly variable among providers. Targeted individual feedback to providers who ordered a large number of stat laboratory tests decreased their stat laboratory order utilization.
- . Turnaround time, part 2: stats too high, yet labs cope. MLO Med Lab Obs. 1993;25(9):33–38.
- . Laboratory turnaround time. Am J Clin Pathol. 1996;105(6):676–688.
- . No more STAT testing. MLO Med Lab Obs. 2005;37(8):22, 24, 26.
- , , . Phlebotomy, stat testing and laboratory organization: an intriguing relationship. Clin Chem Lab Med. 2012;50(12):2065–2068.
- , , , et al. Laboratory request appropriateness in emergency: impact on hospital organization. Clin Chem Lab Med. 2006;44(6):760–764.
- College of American Pathologists.Definitions used in past Q‐PROBES studies (1991–2011). Available at: http://www.cap.org/apps/docs/q_probes/q‐probes_definitions.pdf. Updated September 29, 2011. Accessed July 31, 2013.
- , , . Practice Parameter. STAT testing? A guideline for meeting clinician turnaround time requirements. Am J Clin Pathol. 1996;105(6):671–675.
- , . Intralaboratory performance and laboratorians' expectations for stat turnaround times: a College of American Pathologists Q‐Probes study of four cerebrospinal fluid determinations. Arch Pathol Lab Med. 1991;115(10):977–983.
- , , , . How fast is fast enough for clinical laboratory turnaround time? Measurement of the interval between result entry and inquiries for reports. Am J Clin Pathol. 1997;108(4):400–405.
- , . Strategies of organization and service for the critical‐care laboratory. Clin Chem. 1990;36(8):1557–1561.
- , , , , . Evaluation of stat and routine turnaround times as a component of laboratory quality. Am J Clin Pathol. 1989;91(3):331–335.
- , . Laboratory results: Timeliness as a quality attribute and strategy. Am J Clin Pathol. 2001;116(3):311–315.
- , , , . Utilization of stat test priority in the clinical laboratory: a College of American Pathologists Q‐Probes study of 52 institutions. Arch Pathol Lab Med. 2013;137(2):220–227.
- . Controlling the use of stat testing. Pathologist. 1984;38(8):474–477.
- , , . Optimizing the availability of ‘stat' laboratory tests using Shewhart ‘C' control charts. Ann Clin Biochem. 2002;39(part 2):140–144.
- , , . Evaluating stat testing options in an academic health center: therapeutic turnaround time and staff satisfaction. Clin Chem. 1998;44(8):1597–1603.
- , , . Impact of a physician's order entry (POE) system on physicians' ordering patterns and patient length of stay. Int J Med Inform. 2002;65(3):213–223.
- , . Instrumentation for STAT analyses. Clin Lab Med. 1988;8(4):689–697.
- , , , et al. Audit and feedback: effects on professional practice and healthcare outcomes. Cochrane Database Syst Rev. 2012;6:CD000259.
- , , , , , . The feasibility of automating audit and feedback for ART guideline adherence in Malawi. J Am Med Inform Assoc. 2011;18(6):868–874.
- , , , et al. Effect of an outpatient antimicrobial stewardship intervention on broad‐spectrum antibiotic prescribing by primary care pediatricians: a randomized trial. JAMA. 2013;309(22):2345–2352.
- . An educational program to modify laboratory use by house staff. J Med Educ. 1977;52(7):578–581.
- , , . Ordering of laboratory tests in a teaching hospital: can it be improved? JAMA. 1983;249(22):3076–3080.
Overuse of inpatient stat laboratory orders (stat is an abbreviation of the Latin word statim, meaning immediately, without delay; alternatively, some consider it an acronym for short turnaround time) is a major problem in the modern healthcare system.[1, 2, 3, 4, 5] Ordering laboratory tests stat is a common way to expedite processing, with expectation of results being reported within 1 hour from the time ordered, according to the College of American Pathologists.[6] However, stat orders are also requested for convenience,[2] to expedite discharge,[7] or to meet expectation of turnaround times.[8, 9, 10] Overuse of stat orders increases cost and may reduce the effectiveness of a system. Reduction of excessive stat order requests helps support safe and efficient patient care[11, 12] and may reduce laboratory costs.[13, 14]
Several studies have examined interventions to optimize stat laboratory utilization.[14, 15] Potentially effective interventions include establishment of stat ordering guidelines, utilization of point‐of‐care testing, and prompt feedback via computerized physician order entry (CPOE) systems.[16, 17, 18] However, limited evidence is available regarding the effectiveness of audit and feedback in reducing stat ordering frequency.
Our institution shared the challenge of a high frequency of stat laboratory test orders. An interdisciplinary working group comprising leadership in the medicine, surgery, informatics, laboratory medicine, and quality and patient safety departments was formed to approach this problem and identify potential interventions. The objectives of this study are to describe the patterns of stat orders at our institution as well as to assess the effectiveness of the targeted individual feedback intervention in reducing utilization of stat laboratory test orders.
METHODS
Design
This study is a retrospective analysis of administrative data for a quality‐improvement project. The study was deemed exempt from review by the Beth Israel Medical Center Institutional Review Board.
Setting
Beth Israel Medical Center is an 856‐bed, urban, tertiary‐care teaching hospital with a capacity of 504 medical and surgical beds. In October 2009, 47.8% of inpatient laboratory tests (excluding the emergency department) were ordered as stat, according to an electronic audit of our institution's CPOE system, GE Centricity Enterprise (GE Medical Systems Information Technologies, Milwaukee, WI). Another audit using the same data query for the period of December 2009 revealed that 50 of 488 providers (attending physicians, nurse practitioners, physician assistants, fellows, and residents) accounted for 51% of total stat laboratory orders, and that Medicine and General Surgery residents accounted for 43 of these 50 providers. These findings prompted us to develop interventions that targeted high utilizers of stat laboratory orders, especially Medicine and General Surgery residents.
Teaching Session
Medicine and General Surgery residents were given a 1‐hour educational session at a teaching conference in January 2010. At this session, residents were instructed that ordering stat laboratory tests was appropriate when the results were needed urgently to make clinical decisions as quickly as possible. This session also explained the potential consequences associated with excessive stat laboratory orders and provided department‐specific data on current stat laboratory utilization.
Individual Feedback
From January to May 2010, a list of stat laboratory orders by provider was generated each month by the laboratory department's database. The top 10 providers who most frequently placed stat orders were identified and given individual feedback by their direct supervisors based on data from the prior month (feedback provided from February to June 2010). Medicine and General Surgery residents were counseled by their residency program directors, and nontrainee providers by their immediate supervising physicians. Feedback and counseling were given via brief individual meetings, phone calls, or e‐mail. Supervisors chose the method that ensured the most timely delivery of feedback. Feedback and counseling consisted of explaining the effort to reduce stat laboratory ordering and the rationale behind this, alerting providers that they were outliers, and encouraging them to change their behavior. No punitive consequences were discussed; the feedback sessions were purely informative in nature. When an individual was ranked again in the top 10 after receiving feedback, he or she received repeated feedback.
Data Collection and Measured Outcomes
We retrospectively collected data on monthly laboratory test orders by providers from September 2009 to June 2010. The data were extracted from the electronic medical record (EMR) system and included any inpatient laboratory orders at the institution. Laboratory orders placed in the emergency department were excluded. Providers were divided into nontrainees (attending physicians, nurse practitioners, and physician assistants) and trainee providers (residents and fellows). Trainee providers were further categorized by educational levels (postgraduate year [PGY]‐1 vs PGY‐2 or higher) and specialty (Medicine vs General Surgery vs other). Fellows in medical and surgical subspecialties were categorized as other.
The primary outcome measure was the proportion of stat orders out of total laboratory orders for individuals. The proportion of stat orders out of total orders was selected to assess individuals' tendency to utilize stat laboratory orders.
Statistical Analysis
In the first analysis, stat and total laboratory orders were aggregated for each provider. Providers who ordered <10 laboratory tests during the study period were excluded. We calculated the proportion of stat out of total laboratory orders for each provider, and compared it by specialty, by educational level, and by feedback status. Median and interquartile range (IQR) were reported due to non‐normal distribution, and the Wilcoxon rank‐sum test was used for comparisons.
In the second analysis, we determined pre‐feedback and post‐feedback periods for providers who received feedback. The feedback month was defined as the month immediately after a provider was ranked in the top 10 for the first time during the intervention period. For each provider, stat orders and total laboratory orders during months before and after the feedback month, excluding the feedback month, were calculated. The change in the proportion of stat laboratory orders out of all orders from pre‐ to post‐feedback was then calculated for each provider for whom both pre‐ and post‐feedback data were available. Because providers may have utilized an unusually high proportion of stat orders during the months in which they were ranked in the top 10 (for example, due to being on rotations in which many orders are placed stat, such as the intensive care units), we conducted a sensitivity analysis excluding those months. Further, for comparison, we conducted the same analysis for providers who did not receive feedback and were ranked 11 to 30 in any month during the intervention period. In those providers, we considered the month immediately after a provider was ranked in the 11 to 30 range for the first time as the hypothetical feedback month. The proportional change in the stat laboratory ordering was analyzed using the paired Student t test.
In the third analysis, we calculated the proportion of stat laboratory orders each month for each provider. Individual provider data were excluded if total laboratory orders for the month were <10. We then calculated the average proportion of stat orders for each specialty and educational level among trainee providers every month, and plotted and compared the trends.
All analyses were performed with JMP software version 9.0 (SAS Institute, Inc., Cary, NC). All statistical tests were 2‐sided, and P < 0.05 was considered significant.
RESULTS
We identified 1045 providers who ordered 1 laboratory test from September 2009 to June 2010. Of those, 716 were nontrainee providers and 329 were trainee providers. Among the trainee providers, 126 were Medicine residents, 33 were General Surgery residents, and 103 were PGY‐1. A total of 772,734 laboratory tests were ordered during the study period, and 349,658 (45.2%) tests were ordered as stat. Of all stat orders, 179,901 (51.5%) were ordered by Medicine residents and 52,225 (14.9%) were ordered by General Surgery residents.
Thirty‐seven providers received individual feedback during the intervention period. This group consisted of 8 nontrainee providers (nurse practitioners and physician assistants), 21 Medicine residents (5 were PGY‐1), and 8 General Surgery residents (all PGY‐1). This group ordered a total of 84,435 stat laboratory tests from September 2009 to June 2010 and was responsible for 24.2% of all stat laboratory test orders at the institution.
Provider Analysis
After exclusion of providers who ordered <10 laboratory tests from September 2009 to June 2010, a total of 807 providers remained. The median proportion of stat orders out of total orders was 40% among all providers and 41.6% for nontrainee providers (N = 500), 38.7% for Medicine residents (N = 125), 80.2% for General Surgery residents (N = 32), and 24.2% for other trainee providers (N = 150). The proportion of stat orders differed significantly by specialty and educational level, but also even among providers in the same specialty at the same educational level. Among PGY‐1 residents, the stat‐ordering proportion ranged from 6.9% to 49.1% for Medicine (N = 54) and 69.0% to 97.1% for General Surgery (N = 16). The proportion of stat orders was significantly higher among providers who received feedback compared with those who did not (median, 72.4% [IQR, 55.0%89.5%] vs 39.0% [IQR, 14.9%65.7%], P < 0.001). When stratified by specialty and educational level, the statistical significance remained in nontrainee providers and trainee providers with higher educational level, but not in PGY‐1 residents (Table 1).
| All Providers | Feedback Given | Feedback Not Given | |||||
|---|---|---|---|---|---|---|---|
| N | Stat % | N | Stat % | N | Stat % | P Valuea | |
| |||||||
| Total | 807 | 40 (15.869.0) | 37 | 72.4 (55.089.5) | 770 | 39.0 (14.965.7) | <0.001 |
| Nontrainee providersb | 500 | 41.6 (13.571.5) | 8 | 91.7 (64.097.5) | 492 | 40.2 (13.270.9) | <0.001 |
| Trainee providersc | 307 | 37.8 (19.162.7) | 29 | 69.3 (44.380.9) | 278 | 35.1 (17.655.6) | <0.001 |
| Medicine | 125 | 38.7 (26.850.4) | 21 | 58.8 (36.872.6) | 104 | 36.1 (25.945.6) | <0.001 |
| PGY‐1 | 54 | 28.1 (23.935.2) | 5 | 32.0 (25.536.8) | 49 | 27.9 (23.534.6) | 0.52 |
| PGY‐2 and higher | 71 | 46.5 (39.160.4) | 16 | 63.9 (54.575.7) | 55 | 45.1 (36.554.9) | <0.001 |
| General surgery | 32 | 80.2 (69.690.1) | 8 | 89.5 (79.392.7) | 24 | 78.7 (67.987.4) | <0.05 |
| PGY‐1 | 16 | 86.4 (79.191.1) | 8 | 89.5 (79.392.7) | 8 | 84.0 (73.289.1) | 0.25 |
| PGY‐2 and higher | 16 | 74.4 (65.485.3) | |||||
| Other | 150 | 24.2 (9.055.0) | |||||
| PGY‐1 | 31 | 28.2 (18.478.3) | |||||
| PGY‐2 or higher | 119 | 20.9 (5.651.3) | |||||
Stat Ordering Pattern Change by Individual Feedback
Among 37 providers who received individual feedback, 8 providers were ranked in the top 10 more than once and received repeated feedback. Twenty‐seven of 37 providers had both pre‐feedback and post‐feedback data and were included in the analysis. Of those, 7 were nontrainee providers, 16 were Medicine residents (5 were PGY‐1), and 4 were General Surgery residents (all PGY‐1). The proportion of stat laboratory orders per provider decreased by 15.7% (95% confidence interval [CI]: 5.6% to 25.9%, P = 0.004) after feedback (Table 2). The decrease remained significant after excluding the months in which providers were ranked in the top 10 (11.4%; 95% CI: 0.7% to 22.1%, P = 0.04).
| Top 10 Providers (Received Feedback) | Providers Ranked in 1130 (No Feedback) | |||||||||
|---|---|---|---|---|---|---|---|---|---|---|
| N | Mean Stat % | Mean Difference (95% CI) | P Value | N | Mean Stat % | Mean Difference (95% CI) | P Value | |||
| Pre | Post | Pre | Post | |||||||
| ||||||||||
| Total | 27 | 71.2 | 55.5 | 15.7 (25.9 to 5.6) | 0.004 | 39 | 64.6 | 60.2 | 4.5 (11.0 to 2.1) | 0.18 |
| Nontrainee providers | 7 | 94.6 | 73.2 | 21.4 (46.9 to 4.1) | 0.09 | 12 | 84.4 | 80.6 | 3.8 (11.9 to 4.3) | 0.32 |
| Trainee providers | 20 | 63.0 | 49.3 | 13.7 (25.6 to 1.9) | 0.03 | 27 | 55.8 | 51.1 | 4.7 (13.9 to 4.4) | 0.30 |
| Medicine | 16 | 55.8 | 45.0 | 10.8 (23.3 to 1.6) | 0.08 | 21 | 46.2 | 41.3 | 4.8 (16.3 to 6.7) | 0.39 |
| General Surgery | 4 | 91.9 | 66.4 | 25.4 (78.9 to 28.0) | 0.23 | 6 | 89.6 | 85.2 | 4.4 (20.5 to 11.6) | 0.51 |
| PGY‐1 | 9 | 58.9 | 47.7 | 11.2 (32.0 to 9.5) | 0.25 | 15 | 55.2 | 49.2 | 6.0 (18.9 to 6.9) | 0.33 |
| PGY‐2 or Higher | 11 | 66.4 | 50.6 | 15.8 (32.7 to 1.1) | 0.06 | 12 | 56.6 | 53.5 | 3.1 (18.3 to 12.1) | 0.66 |
In comparison, a total of 57 providers who did not receive feedback were in the 11 to 30 range during the intervention period. Three Obstetrics and Gynecology residents and 3 Family Medicine residents were excluded from the analysis to match specialty with providers who received feedback. Thirty‐nine of 51 providers had adequate data and were included in the analysis, comprising 12 nontrainee providers, 21 Medicine residents (10 were PGY‐1), and 6 General Surgery residents (5 were PGY‐1). Among them, the proportion of stat laboratory orders per provider did not change significantly, with a 4.5% decrease (95% CI: 2.1% to 11.0%, P = 0.18; Table 2).
Stat Ordering Trends Among Trainee Providers
After exclusion of data for the month with <10 total laboratory tests per provider, a total of 303 trainee providers remained, providing 2322 data points for analysis. Of the 303, 125 were Medicine residents (54 were PGY‐1), 32 were General Surgery residents (16 were PGY‐1), and 146 were others (31 were PGY‐1). The monthly trends for the average proportion of stat orders among those providers are shown in Figure 1. The decrease in the proportion of stat orders was observed after January 2010 in Medicine and General Surgery residents both in PGY‐1 and PGY‐2 or higher, but no change was observed in other trainee providers.
DISCUSSION
We describe a series of interventions implemented at our institution to decrease the utilization of stat laboratory orders. Based on an audit of laboratory‐ordering data, we decided to target high utilizers of stat laboratory tests, especially Medicine and General Surgery residents. After presenting an educational session to those residents, we gave individual feedback to the highest utilizers of stat laboratory orders. Providers who received feedback decreased their utilization of stat laboratory orders, but the stat ordering pattern did not change among those who did not receive feedback.
The individual feedback intervention involved key stakeholders for resident and nontrainee provider education (directors of the Medicine and General Surgery residency programs and other direct clinical supervisors). The targeted feedback was delivered via direct supervisors and was provided more than once as needed, which are key factors for effective feedback in modifying behavior in professional practice.[19] Allowing the supervisors to choose the most appropriate form of feedback for each individual (meetings, phone calls, or e‐mail) enabled timely and individually tailored feedback and contributed to successful implementation. We feel intervention had high educational value for residents, as it promoted residents' engagement in proper systems‐based practice, one of the 6 core competencies of the Accreditation Council for Graduate Medical Education (ACGME).
We utilized the EMR to obtain provider‐specific data for feedback and analysis. As previously suggested, the use of the EMR for audit and feedback was effective in providing timely, actionable, and individualized feedback with peer benchmarking.[20, 21] We used the raw number of stat laboratory orders for audit and the proportion of stat orders out of total orders to assess the individual behavioral patterns. Although the proportional use of stat orders is affected by patient acuity and workplace or rotation site, it also seems largely affected by provider's preference or practice patterns, as we saw the variance among providers of the same specialty and educational level. The changes in the stat ordering trends only seen among Medicine and General Surgery residents suggests that our interventions successfully decreased the overall utilization of stat laboratory orders among targeted providers, and it seems less likely that those decreases are due to changes in patient acuity, changes in rotation sites, or learning curve among trainee providers. When averaged over the 10‐month study period, as shown in Table 1, the providers who received feedback ordered a higher proportion of stat tests than those who did not receive feedback, except for PGY‐1 residents. This suggests that although auditing based on the number of stat laboratory orders identified providers who tended to order more stat tests than others, it may not be a reliable indicator for PGY‐1 residents, whose number of laboratory orders highly fluctuates by rotation.
There are certain limitations to our study. First, we assumed that the top utilizers were inappropriately ordering stat laboratory tests. Because there is no clear consensus as to what constitutes appropriate stat testing,[7] it was difficult, if not impossible, to determine which specific orders were inappropriate. However, high variability of the stat ordering pattern in the analysis provides some evidence that high stat utilizers customarily order more stat testing as compared with others. A recent study also revealed that the median stat ordering percentage was 35.9% among 52 US institutions.[13] At our institution, 47.8% of laboratory tests were ordered stat prior to the intervention, higher than the benchmark, providing the rationale for our intervention.
Second, the intervention was conducted in a time‐series fashion and no randomization was employed. The comparison of providers who received feedback with those who did not is subject to selection bias, and the difference in the change in stat ordering pattern between these 2 groups may be partially due to variability of work location, rotation type, or acuity of patients. However, we performed a sensitivity analysis excluding the months when the providers were ranked in the top 10, assuming that they may have ordered an unusually high proportion of stat tests due to high acuity of patients (eg, rotation in the intensive care units) during those months. Robust results in this analysis support our contention that individual feedback was effective. In addition, we cannot completely rule out the possibility that the changes in stat ordering practice may be solely due to natural maturation effects within an academic year among trainee providers, especially PGY‐1 residents. However, relatively acute changes in the stat ordering trends only among targeted provider groups around January 2010, corresponding to the timing of interventions, suggest otherwise.
Third, we were not able to test if the intervention or decrease in stat orders adversely affected patient care. For example, if, after receiving feedback, providers did not order some tests stat that should have been ordered that way, this could have negatively affected patient care. Additionally, we did not evaluate whether reduction in stat laboratory orders improved timeliness of the reporting of stat laboratory results.
Lastly, the sustained effect and feasibility of this intervention were not tested. Past studies suggest educational interventions in laboratory ordering behavior would most likely need to be continued to maintain its effectiveness.[22, 23] Although we acknowledge that sustainability of this type of intervention may be difficult, we feel we have demonstrated that there is still value associated with giving personalized feedback.
This study has implications for future interventions and research. Use of automated, EMR‐based feedback on laboratory ordering performance may be effective in reducing excessive stat ordering and may obviate the need for time‐consuming efforts by supervisors. Development of quality indicators that more accurately assess stat ordering patterns, potentially adjusted for working sites and patient acuity, may be necessary. Studies that measure the impact of decreasing stat laboratory orders on turnaround times and cost may be of value.
CONCLUSION
At our urban, tertiary‐care teaching institution, stat ordering frequency was highly variable among providers. Targeted individual feedback to providers who ordered a large number of stat laboratory tests decreased their stat laboratory order utilization.
- . Turnaround time, part 2: stats too high, yet labs cope. MLO Med Lab Obs. 1993;25(9):33–38.
- . Laboratory turnaround time. Am J Clin Pathol. 1996;105(6):676–688.
- . No more STAT testing. MLO Med Lab Obs. 2005;37(8):22, 24, 26.
- , , . Phlebotomy, stat testing and laboratory organization: an intriguing relationship. Clin Chem Lab Med. 2012;50(12):2065–2068.
- , , , et al. Laboratory request appropriateness in emergency: impact on hospital organization. Clin Chem Lab Med. 2006;44(6):760–764.
- College of American Pathologists.Definitions used in past Q‐PROBES studies (1991–2011). Available at: http://www.cap.org/apps/docs/q_probes/q‐probes_definitions.pdf. Updated September 29, 2011. Accessed July 31, 2013.
- , , . Practice Parameter. STAT testing? A guideline for meeting clinician turnaround time requirements. Am J Clin Pathol. 1996;105(6):671–675.
- , . Intralaboratory performance and laboratorians' expectations for stat turnaround times: a College of American Pathologists Q‐Probes study of four cerebrospinal fluid determinations. Arch Pathol Lab Med. 1991;115(10):977–983.
- , , , . How fast is fast enough for clinical laboratory turnaround time? Measurement of the interval between result entry and inquiries for reports. Am J Clin Pathol. 1997;108(4):400–405.
- , . Strategies of organization and service for the critical‐care laboratory. Clin Chem. 1990;36(8):1557–1561.
- , , , , . Evaluation of stat and routine turnaround times as a component of laboratory quality. Am J Clin Pathol. 1989;91(3):331–335.
- , . Laboratory results: Timeliness as a quality attribute and strategy. Am J Clin Pathol. 2001;116(3):311–315.
- , , , . Utilization of stat test priority in the clinical laboratory: a College of American Pathologists Q‐Probes study of 52 institutions. Arch Pathol Lab Med. 2013;137(2):220–227.
- . Controlling the use of stat testing. Pathologist. 1984;38(8):474–477.
- , , . Optimizing the availability of ‘stat' laboratory tests using Shewhart ‘C' control charts. Ann Clin Biochem. 2002;39(part 2):140–144.
- , , . Evaluating stat testing options in an academic health center: therapeutic turnaround time and staff satisfaction. Clin Chem. 1998;44(8):1597–1603.
- , , . Impact of a physician's order entry (POE) system on physicians' ordering patterns and patient length of stay. Int J Med Inform. 2002;65(3):213–223.
- , . Instrumentation for STAT analyses. Clin Lab Med. 1988;8(4):689–697.
- , , , et al. Audit and feedback: effects on professional practice and healthcare outcomes. Cochrane Database Syst Rev. 2012;6:CD000259.
- , , , , , . The feasibility of automating audit and feedback for ART guideline adherence in Malawi. J Am Med Inform Assoc. 2011;18(6):868–874.
- , , , et al. Effect of an outpatient antimicrobial stewardship intervention on broad‐spectrum antibiotic prescribing by primary care pediatricians: a randomized trial. JAMA. 2013;309(22):2345–2352.
- . An educational program to modify laboratory use by house staff. J Med Educ. 1977;52(7):578–581.
- , , . Ordering of laboratory tests in a teaching hospital: can it be improved? JAMA. 1983;249(22):3076–3080.
© 2013 Society of Hospital Medicine