User login
SCHOLAR Project
The structure and function of academic hospital medicine programs (AHPs) has evolved significantly with the growth of hospital medicine.[1, 2, 3, 4] Many AHPs formed in response to regulatory and financial changes, which drove demand for increased trainee oversight, improved clinical efficiency, and growth in nonteaching services staffed by hospitalists. Differences in local organizational contexts and needs have contributed to great variability in AHP program design and operations. As AHPs have become more established, the need to engage academic hospitalists in scholarship and activities that support professional development and promotion has been recognized. Defining sustainable and successful positions for academic hospitalists is a priority called for by leaders in the field.[5, 6]
In this rapidly evolving context, AHPs have employed a variety of approaches to organizing clinical and academic faculty roles, without guiding evidence or consensus‐based performance benchmarks. A number of AHPs have achieved success along traditional academic metrics of research, scholarship, and education. Currently, it is not known whether specific approaches to AHP organization, structure, or definition of faculty roles are associated with achievement of more traditional markers of academic success.
The Academic Committee of the Society of Hospital Medicine (SHM), and the Academic Hospitalist Task Force of the Society of General Internal Medicine (SGIM) had separately initiated projects to explore characteristics associated with success in AHPs. In 2012, these organizations combined efforts to jointly develop and implement the SCHOLAR (SuCcessful HOspitaLists in Academics and Research) project. The goals were to identify successful AHPs using objective criteria, and to then study those groups in greater detail to generate insights that would be broadly relevant to the field. Efforts to clarify the factors within AHPs linked to success by traditional academic metrics will benefit hospitalists, their leaders, and key stakeholders striving to achieve optimal balance between clinical and academic roles. We describe the initial work of the SCHOLAR project, our definitions of academic success in AHPs, and the characteristics of a cohort of exemplary AHPs who achieved the highest levels on these metrics.
METHODS
Defining Success
The 11 members of the SCHOLAR project held a variety of clinical and academic roles within a geographically diverse group of AHPs. We sought to create a functional definition of success applicable to AHPs. As no gold standard currently exists, we used a consensus process among task force members to arrive at a definition that was quantifiable, feasible, and meaningful. The first step was brainstorming on conference calls held 1 to 2 times monthly over 4 months. Potential defining characteristics that emerged from these discussions related to research, teaching, and administrative activities. When potential characteristics were proposed, we considered how to operationalize each one. Each characteristic was discussed until there was consensus from the entire group. Those around education and administration were the most complex, as many roles are locally driven and defined, and challenging to quantify. For this reason, we focused on promotion as a more global approach to assessing academic hospitalist success in these areas. Although criteria for academic advancement also vary across institutions, we felt that promotion generally reflected having met some threshold of academic success. We also wanted to recognize that scholarship occurs outside the context of funded research. Ultimately, 3 key domains emerged: research grant funding, faculty promotion, and scholarship.
After these 3 domains were identified, the group sought to define quantitative metrics to assess performance. These discussions occurred on subsequent calls over a 4‐month period. Between calls, group members gathered additional information to facilitate assessment of the feasibility of proposed metrics, reporting on progress via email. Again, group consensus was sought for each metric considered. Data on grant funding and successful promotions were available from a previous survey conducted through the SHM in 2011. Leaders from 170 AHPs were contacted, with 50 providing complete responses to the 21‐item questionnaire (see Supporting Information, Appendix 1, in the online version of this article). Results of the survey, heretofore referred to as the Leaders of Academic Hospitalist Programs survey (LAHP‐50), have been described elsewhere.[7] For the purposes of this study, we used the self‐reported data about grant funding and promotions contained in the survey to reflect the current state of the field. Although the survey response rate was approximately 30%, the survey was not anonymous, and many reputationally prominent academic hospitalist programs were represented. For these reasons, the group members felt that the survey results were relevant for the purposes of assessing academic success.
In the LAHP‐50, funding was defined as principal investigator or coinvestigator roles on federally and nonfederally funded research, clinical trials, internal grants, and any other extramurally funded projects. Mean and median funding for the overall sample was calculated. Through a separate question, each program's total faculty full‐time equivalent (FTE) count was reported, allowing us to adjust for group size by assessing both total funding per group and funding/FTE for each responding AHP.
Promotions were defined by the self‐reported number of faculty at each of the following ranks: instructor, assistant professor, associate professor, full professor, and professor above scale/emeritus. In addition, a category of nonacademic track (eg, adjunct faculty, clinical associate) was included to capture hospitalists that did not fit into the traditional promotions categories. We did not distinguish between tenure‐track and nontenure‐track academic ranks. LAHP‐50 survey respondents reported the number of faculty in their group at each academic rank. Given that the majority of academic hospitalists hold a rank of assistant professor or lower,[6, 8, 9] and that the number of full professors was only 3% in the LAHP‐50 cohort, we combined the faculty at the associate and full professor ranks, defining successfully promoted faculty as the percent of hospitalists above the rank of assistant professor.
We created a new metric to assess scholarly output. We had considerable discussion of ways to assess the numbers of peer‐reviewed manuscripts generated by AHPs. However, the group had concerns about the feasibility of identification and attribution of authors to specific AHPs through literature searches. We considered examining only publications in the Journal of Hospital Medicine and the Journal of General Internal Medicine, but felt that this would exclude significant work published by hospitalists in fields of medical education or health services research that would more likely appear in alternate journals. Instead, we quantified scholarship based on the number of abstracts presented at national meetings. We focused on meetings of the SHM and SGIM as the primary professional societies representing hospital medicine. The group felt that even work published outside of the journals of our professional societies would likely be presented at those meetings. We used the following strategy: We reviewed research abstracts accepted for presentation as posters or oral abstracts at the 2010 and 2011 SHM national meetings, and research abstracts with a primary or secondary category of hospital medicine at the 2010 and 2011 SGIM national meetings. By including submissions at both SGIM and SHM meetings, we accounted for the fact that some programs may gravitate more to one society meeting or another. We did not include abstracts in the clinical vignettes or innovations categories. We tallied the number of abstracts by group affiliation of the authors for each of the 4 meetings above and created a cumulative total per group for the 2‐year period. Abstracts with authors from different AHPs were counted once for each individual group. Members of the study group reviewed abstracts from each of the meetings in pairs. Reviewers worked separately and compared tallies of results to ensure consistent tabulations. Internet searches were conducted to identify or confirm author affiliations if it was not apparent in the abstract author list. Abstract tallies were compiled without regard to whether programs had completed the LAHP‐50 survey; thus, we collected data on programs that did not respond to the LAHP‐50 survey.
Identification of the SCHOLAR Cohort
To identify our cohort of top‐performing AHPs, we combined the funding and promotions data from the LAHP‐50 sample with the abstract data. We limited our sample to adult hospital medicine groups to reduce heterogeneity. We created rank lists of programs in each category (grant funding, successful promotions, and scholarship), using data from the LAHP‐50 survey to rank programs on funding and promotions, and data from our abstract counts to rank on scholarship. We limited the top‐performing list in each category to 10 institutions as a cutoff. Because we set a threshold of at least $1 million in total funding, we identified only 9 top performing AHPs with regard to grant funding. We also calculated mean funding/FTE. We chose to rank programs only by funding/FTE rather than total funding per program to better account for group size. For successful promotions, we ranked programs by the percentage of senior faculty. For abstract counts, we included programs whose faculty presented abstracts at a minimum of 2 separate meetings, and ranked programs based on the total number of abstracts per group.
This process resulted in separate lists of top performing programs in each of the 3 domains we associated with academic success, arranged in descending order by grant dollars/FTE, percent of senior faculty, and abstract counts (Table 1). Seventeen different programs were represented across these 3 top 10 lists. One program appeared on all 3 lists, 8 programs appeared on 2 lists, and the remainder appeared on a single list (Table 2). Seven of these programs were identified solely based on abstract presentations, diversifying our top groups beyond only those who completed the LAHP‐50 survey. We considered all of these programs to represent high performance in academic hospital medicine. The group selected this inclusive approach because we recognized that any 1 metric was potentially limited, and we sought to identify diverse pathways to success.
| Funding | Promotions | Scholarship | |
|---|---|---|---|
| Grant $/FTE | Total Grant $ | Senior Faculty, No. (%) | Total Abstract Count |
| |||
| $1,409,090 | $15,500,000 | 3 (60%) | 23 |
| $1,000,000 | $9,000,000 | 3 (60%) | 21 |
| $750,000 | $8,000,000 | 4 (57%) | 20 |
| $478,609 | $6,700,535 | 9 (53%) | 15 |
| $347,826 | $3,000,000 | 8 (44%) | 11 |
| $86,956 | $3,000,000 | 14 (41%) | 11 |
| $66,666 | $2,000,000 | 17 (36%) | 10 |
| $46,153 | $1,500,000 | 9 (33%) | 10 |
| $38,461 | $1,000,000 | 2 (33%) | 9 |
| 4 (31%) | 9 | ||
| Selection Criteria for SCHOLAR Cohort | No. of Programs |
|---|---|
| |
| Abstracts, funding, and promotions | 1 |
| Abstracts plus promotions | 4 |
| Abstracts plus funding | 3 |
| Funding plus promotion | 1 |
| Funding only | 1 |
| Abstract only | 7 |
| Total | 17 |
| Top 10 abstract count | |
| 4 meetings | 2 |
| 3 meetings | 2 |
| 2 meetings | 6 |
The 17 unique adult AHPs appearing on at least 1 of the top 10 lists comprised the SCHOLAR cohort of programs that we studied in greater detail. Data reflecting program demographics were solicited directly from leaders of the AHPs identified in the SCHOLAR cohort, including size and age of program, reporting structure, number of faculty at various academic ranks (for programs that did not complete the LAHP‐50 survey), and number of faculty with fellowship training (defined as any postresidency fellowship program).
Subsequently, we performed comparative analyses between the programs in the SCHOLAR cohort to the general population of AHPs reflected by the LAHP‐50 sample. Because abstract presentations were not recorded in the original LAHP‐50 survey instrument, it was not possible to perform a benchmarking comparison for the scholarship domain.
Data Analysis
To measure the success of the SCHOLAR cohort we compared the grant funding and proportion of successfully promoted faculty at the SCHOLAR programs to those in the overall LAHP‐50 sample. Differences in mean and median grant funding were compared using t tests and Mann‐Whitney rank sum tests. Proportion of promoted faculty were compared using 2 tests. A 2‐tailed of 0.05 was used to test significance of differences.
RESULTS
Demographics
Among the AHPs in the SCHOLAR cohort, the mean program age was 13.2 years (range, 618 years), and the mean program size was 36 faculty (range, 1895; median, 28). On average, 15% of faculty members at SCHOLAR programs were fellowship trained (range, 0%37%). Reporting structure among the SCHOLAR programs was as follows: 53% were an independent division or section of the department of medicine; 29% were a section within general internal medicine, and 18% were an independent clinical group.
Grant Funding
Table 3 compares grant funding in the SCHOLAR programs to programs in the overall LAHP‐50 sample. Mean funding per group and mean funding per FTE were significantly higher in the SCHOLAR group than in the overall sample.
| Funding (Millions) | ||
|---|---|---|
| LAHP‐50 Overall Sample | SCHOLAR | |
| ||
| Median grant funding/AHP | 0.060 | 1.500* |
| Mean grant funding/AHP | 1.147 (015) | 3.984* (015) |
| Median grant funding/FTE | 0.004 | 0.038* |
| Mean grant funding/FTE | 0.095 (01.4) | 0.364* (01.4) |
Thirteen of the SCHOLAR programs were represented in the initial LAHP‐50, but 2 did not report a dollar amount for grants and contracts. Therefore, data for total grant funding were available for only 65% (11 of 17) of the programs in the SCHOLAR cohort. Of note, 28% of AHPs in the overall LAHP‐50 sample reported no external funding sources.
Faculty Promotion
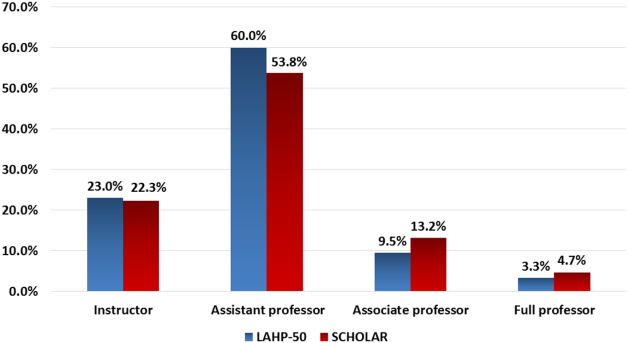
Figure 1 demonstrates the proportion of faculty at various academic ranks. The percent of faculty above the rank of assistant professor in the SCHOLAR programs exceeded those in the overall LAHP‐50 by 5% (17.9% vs 12.8%, P = 0.01). Of note, 6% of the hospitalists at AHPs in the SCHOLAR programs were on nonfaculty tracks.
Scholarship
Mean abstract output over the 2‐year period measured was 10.8 (range, 323) in the SCHOLAR cohort. Because we did not collect these data for the LAHP‐50 group, comparative analyses were not possible.
DISCUSSION
Using a definition of academic success that incorporated metrics of grant funding, faculty promotion, and scholarly output, we identified a unique subset of successful AHPsthe SCHOLAR cohort. The programs represented in the SCHOLAR cohort were generally large and relatively mature. Despite this, the cohort consisted of mostly junior faculty, had a paucity of fellowship‐trained hospitalists, and not all reported grant funding.
Prior published work reported complementary findings.[6, 8, 9] A survey of 20 large, well‐established academic hospitalist programs in 2008 found that the majority of hospitalists were junior faculty with a limited publication portfolio. Of the 266 respondents in that study, 86% reported an academic rank at or below assistant professor; funding was not explored.[9] Our similar findings 4 years later add to this work by demonstrating trends over time, and suggest that progress toward creating successful pathways for academic advancement has been slow. In a 2012 survey of the SHM membership, 28% of hospitalists with academic appointments reported no current or future plans to engage in research.[8] These findings suggest that faculty in AHPs may define scholarship through nontraditional pathways, or in some cases choose not to pursue or prioritize scholarship altogether.
Our findings also add to the literature with regard to our assessment of funding, which was variable across the SCHOLAR group. The broad range of funding in the SCHOLAR programs for which we have data (grant dollars $0$15 million per program) suggests that opportunities to improve supported scholarship remain, even among a selected cohort of successful AHPs. The predominance of junior faculty in the SCHOLAR programs may be a reason for this variation. Junior faculty may be engaged in research with funding directed to senior mentors outside their AHP. Alternatively, they may pursue meaningful local hospital quality improvement or educational innovations not supported by external grants, or hold leadership roles in education, quality, or information technology that allow for advancement and promotion without external grant funding. As the scope and impact of these roles increases, senior leaders with alternate sources of support may rely less on research funds; this too may explain some of the differences. Our findings are congruent with results of a study that reviewed original research published by hospitalists, and concluded that the majority of hospitalist research was not externally funded.[8] Our approach for assessing grant funding by adjusting for FTE had the potential to inadvertently favor smaller well‐funded groups over larger ones; however, programs in our sample were similarly represented when ranked by funding/FTE or total grant dollars. As many successful AHPs do concentrate their research funding among a core of focused hospitalist researchers, our definition may not be the ideal metric for some programs.
We chose to define scholarship based on abstract output, rather than peer‐reviewed publications. Although this choice was necessary from a feasibility perspective, it may have excluded programs that prioritize peer‐reviewed publications over abstracts. Although we were unable to incorporate a search strategy to accurately and comprehensively track the publication output attributed specifically to hospitalist researchers and quantify it by program, others have since defined such an approach.[8] However, tracking abstracts theoretically allowed insights into a larger volume of innovative and creative work generated by top AHPs by potentially including work in the earlier stages of development.
We used a consensus‐based definition of success to define our SCHOLAR cohort. There are other ways to measure academic success, which if applied, may have yielded a different sample of programs. For example, over half of the original research articles published in the Journal of Hospital Medicine over a 7‐year span were generated from 5 academic centers.[8] This definition of success may be equally credible, though we note that 4 of these 5 programs were also included in the SCHOLAR cohort. We feel our broader approach was more reflective of the variety of pathways to success available to academic hospitalists. Before our metrics are applied as a benchmarking tool, however, they should ideally be combined with factors not measured in our study to ensure a more comprehensive or balanced reflection of academic success. Factors such as mentorship, level of hospitalist engagement,[10] prevalence of leadership opportunities, operational and fiscal infrastructure, and the impact of local quality, safety, and value efforts should be considered.
Comparison of successfully promoted faculty at AHPs across the country is inherently limited by the wide variation in promotion standards across different institutions; controlling for such differences was not possible with our methodology. For example, it appears that several programs with relatively few senior faculty may have met metrics leading to their inclusion in the SCHOLAR group because of their small program size. Future benchmarking efforts for promotion at AHPs should take scaling into account and consider both total number as well as percentage of senior faculty when evaluating success.
Our methodology has several limitations. Survey data were self‐reported and not independently validated, and as such are subject to recall and reporting biases. Response bias inherently excluded some AHPs that may have met our grant funding or promotions criteria had they participated in the initial LAHP‐50 survey, though we identified and included additional programs through our scholarship metric, increasing the representativeness of the SCHOLAR cohort. Given the dynamic nature of the field, the age of the data we relied upon for analysis limits the generalizability of our specific benchmarks to current practice. However, the development of academic success occurs over the long‐term, and published data on academic hospitalist productivity are consistent with this slower time course.[8] Despite these limitations, our data inform the general topic of gauging performance of AHPs, underscoring the challenges of developing and applying metrics of success, and highlight the variability of performance on selected metrics even among a relatively small group of 17 programs.
In conclusion, we have created a method to quantify academic success that may be useful to academic hospitalists and their group leaders as they set targets for improvement in the field. Even among our SCHOLAR cohort, room for ongoing improvement in development of funded scholarship and a core of senior faculty exists. Further investigation into the unique features of successful groups will offer insight to leaders in academic hospital medicine regarding infrastructure and processes that should be embraced to raise the bar for all AHPs. In addition, efforts to further define and validate nontraditional approaches to scholarship that allow for successful promotion at AHPs would be informative. We view our work less as a singular approach to benchmarking standards for AHPs, and more a call to action to continue efforts to balance scholarly activity and broad professional development of academic hospitalists with increasing clinical demands.
Acknowledgements
The authors thank all of the AHP leaders who participated in the SCHOLAR project. They also thank the Society of Hospital Medicine and Society of General Internal Medicine and the SHM Academic Committee and SGIM Academic Hospitalist Task Force for their support of this work.
Disclosures
The work reported here was supported by the Department of Veterans Affairs, Veterans Health Administration, South Texas Veterans Health Care System. The views expressed in this article are those of the authors and do not necessarily reflect the position or policy of the Department of Veterans Affairs. The authors report no conflicts of interest.
- , , , , . Characteristics of primary care providers who adopted the hospitalist model from 2001 to 2009. J Hosp Med. 2015;10(2):75–82.
- , , , . Growth in the care of older patients by hospitalists in the United States. N Engl J Med. 2009;360(11):1102–1112.
- , , , , . Updating threshold‐based identification of hospitalists in 2012 Medicare pay data. J Hosp Med. 2016;11(1):45–47.
- , , , . Use of hospitalists by Medicare beneficiaries: a national picture. Medicare Medicaid Res Rev. 2014;4(2).
- , , , , , . Challenges and opportunities in Academic Hospital Medicine: report from the Academic Hospital Medicine Summit. J Hosp Med. 2009;4(4):240–246.
- , , , . Survey of US academic hospitalist leaders about mentorship and academic activities in hospitalist groups. J Hosp Med. 2011;6(1):5–9.
- , , , , , . The structure of hospital medicine programs at academic medical centers [abstract]. J Hosp Med. 2012;7(suppl 2):s92.
- , , , , . Research and publication trends in hospital medicine. J Hosp Med. 2014;9(3):148–154.
- , , , , , . Mentorship, productivity, and promotion among academic hospitalists. J Gen Intern Med. 2012;27(1):23–27.
- , , , et al. The key principles and characteristics of an effective hospital medicine group: an assessment guide for hospitals and hospitalists. J Hosp Med. 2014;9(2):123–128.
The structure and function of academic hospital medicine programs (AHPs) has evolved significantly with the growth of hospital medicine.[1, 2, 3, 4] Many AHPs formed in response to regulatory and financial changes, which drove demand for increased trainee oversight, improved clinical efficiency, and growth in nonteaching services staffed by hospitalists. Differences in local organizational contexts and needs have contributed to great variability in AHP program design and operations. As AHPs have become more established, the need to engage academic hospitalists in scholarship and activities that support professional development and promotion has been recognized. Defining sustainable and successful positions for academic hospitalists is a priority called for by leaders in the field.[5, 6]
In this rapidly evolving context, AHPs have employed a variety of approaches to organizing clinical and academic faculty roles, without guiding evidence or consensus‐based performance benchmarks. A number of AHPs have achieved success along traditional academic metrics of research, scholarship, and education. Currently, it is not known whether specific approaches to AHP organization, structure, or definition of faculty roles are associated with achievement of more traditional markers of academic success.
The Academic Committee of the Society of Hospital Medicine (SHM), and the Academic Hospitalist Task Force of the Society of General Internal Medicine (SGIM) had separately initiated projects to explore characteristics associated with success in AHPs. In 2012, these organizations combined efforts to jointly develop and implement the SCHOLAR (SuCcessful HOspitaLists in Academics and Research) project. The goals were to identify successful AHPs using objective criteria, and to then study those groups in greater detail to generate insights that would be broadly relevant to the field. Efforts to clarify the factors within AHPs linked to success by traditional academic metrics will benefit hospitalists, their leaders, and key stakeholders striving to achieve optimal balance between clinical and academic roles. We describe the initial work of the SCHOLAR project, our definitions of academic success in AHPs, and the characteristics of a cohort of exemplary AHPs who achieved the highest levels on these metrics.
METHODS
Defining Success
The 11 members of the SCHOLAR project held a variety of clinical and academic roles within a geographically diverse group of AHPs. We sought to create a functional definition of success applicable to AHPs. As no gold standard currently exists, we used a consensus process among task force members to arrive at a definition that was quantifiable, feasible, and meaningful. The first step was brainstorming on conference calls held 1 to 2 times monthly over 4 months. Potential defining characteristics that emerged from these discussions related to research, teaching, and administrative activities. When potential characteristics were proposed, we considered how to operationalize each one. Each characteristic was discussed until there was consensus from the entire group. Those around education and administration were the most complex, as many roles are locally driven and defined, and challenging to quantify. For this reason, we focused on promotion as a more global approach to assessing academic hospitalist success in these areas. Although criteria for academic advancement also vary across institutions, we felt that promotion generally reflected having met some threshold of academic success. We also wanted to recognize that scholarship occurs outside the context of funded research. Ultimately, 3 key domains emerged: research grant funding, faculty promotion, and scholarship.
After these 3 domains were identified, the group sought to define quantitative metrics to assess performance. These discussions occurred on subsequent calls over a 4‐month period. Between calls, group members gathered additional information to facilitate assessment of the feasibility of proposed metrics, reporting on progress via email. Again, group consensus was sought for each metric considered. Data on grant funding and successful promotions were available from a previous survey conducted through the SHM in 2011. Leaders from 170 AHPs were contacted, with 50 providing complete responses to the 21‐item questionnaire (see Supporting Information, Appendix 1, in the online version of this article). Results of the survey, heretofore referred to as the Leaders of Academic Hospitalist Programs survey (LAHP‐50), have been described elsewhere.[7] For the purposes of this study, we used the self‐reported data about grant funding and promotions contained in the survey to reflect the current state of the field. Although the survey response rate was approximately 30%, the survey was not anonymous, and many reputationally prominent academic hospitalist programs were represented. For these reasons, the group members felt that the survey results were relevant for the purposes of assessing academic success.
In the LAHP‐50, funding was defined as principal investigator or coinvestigator roles on federally and nonfederally funded research, clinical trials, internal grants, and any other extramurally funded projects. Mean and median funding for the overall sample was calculated. Through a separate question, each program's total faculty full‐time equivalent (FTE) count was reported, allowing us to adjust for group size by assessing both total funding per group and funding/FTE for each responding AHP.
Promotions were defined by the self‐reported number of faculty at each of the following ranks: instructor, assistant professor, associate professor, full professor, and professor above scale/emeritus. In addition, a category of nonacademic track (eg, adjunct faculty, clinical associate) was included to capture hospitalists that did not fit into the traditional promotions categories. We did not distinguish between tenure‐track and nontenure‐track academic ranks. LAHP‐50 survey respondents reported the number of faculty in their group at each academic rank. Given that the majority of academic hospitalists hold a rank of assistant professor or lower,[6, 8, 9] and that the number of full professors was only 3% in the LAHP‐50 cohort, we combined the faculty at the associate and full professor ranks, defining successfully promoted faculty as the percent of hospitalists above the rank of assistant professor.
We created a new metric to assess scholarly output. We had considerable discussion of ways to assess the numbers of peer‐reviewed manuscripts generated by AHPs. However, the group had concerns about the feasibility of identification and attribution of authors to specific AHPs through literature searches. We considered examining only publications in the Journal of Hospital Medicine and the Journal of General Internal Medicine, but felt that this would exclude significant work published by hospitalists in fields of medical education or health services research that would more likely appear in alternate journals. Instead, we quantified scholarship based on the number of abstracts presented at national meetings. We focused on meetings of the SHM and SGIM as the primary professional societies representing hospital medicine. The group felt that even work published outside of the journals of our professional societies would likely be presented at those meetings. We used the following strategy: We reviewed research abstracts accepted for presentation as posters or oral abstracts at the 2010 and 2011 SHM national meetings, and research abstracts with a primary or secondary category of hospital medicine at the 2010 and 2011 SGIM national meetings. By including submissions at both SGIM and SHM meetings, we accounted for the fact that some programs may gravitate more to one society meeting or another. We did not include abstracts in the clinical vignettes or innovations categories. We tallied the number of abstracts by group affiliation of the authors for each of the 4 meetings above and created a cumulative total per group for the 2‐year period. Abstracts with authors from different AHPs were counted once for each individual group. Members of the study group reviewed abstracts from each of the meetings in pairs. Reviewers worked separately and compared tallies of results to ensure consistent tabulations. Internet searches were conducted to identify or confirm author affiliations if it was not apparent in the abstract author list. Abstract tallies were compiled without regard to whether programs had completed the LAHP‐50 survey; thus, we collected data on programs that did not respond to the LAHP‐50 survey.
Identification of the SCHOLAR Cohort
To identify our cohort of top‐performing AHPs, we combined the funding and promotions data from the LAHP‐50 sample with the abstract data. We limited our sample to adult hospital medicine groups to reduce heterogeneity. We created rank lists of programs in each category (grant funding, successful promotions, and scholarship), using data from the LAHP‐50 survey to rank programs on funding and promotions, and data from our abstract counts to rank on scholarship. We limited the top‐performing list in each category to 10 institutions as a cutoff. Because we set a threshold of at least $1 million in total funding, we identified only 9 top performing AHPs with regard to grant funding. We also calculated mean funding/FTE. We chose to rank programs only by funding/FTE rather than total funding per program to better account for group size. For successful promotions, we ranked programs by the percentage of senior faculty. For abstract counts, we included programs whose faculty presented abstracts at a minimum of 2 separate meetings, and ranked programs based on the total number of abstracts per group.
This process resulted in separate lists of top performing programs in each of the 3 domains we associated with academic success, arranged in descending order by grant dollars/FTE, percent of senior faculty, and abstract counts (Table 1). Seventeen different programs were represented across these 3 top 10 lists. One program appeared on all 3 lists, 8 programs appeared on 2 lists, and the remainder appeared on a single list (Table 2). Seven of these programs were identified solely based on abstract presentations, diversifying our top groups beyond only those who completed the LAHP‐50 survey. We considered all of these programs to represent high performance in academic hospital medicine. The group selected this inclusive approach because we recognized that any 1 metric was potentially limited, and we sought to identify diverse pathways to success.
| Funding | Promotions | Scholarship | |
|---|---|---|---|
| Grant $/FTE | Total Grant $ | Senior Faculty, No. (%) | Total Abstract Count |
| |||
| $1,409,090 | $15,500,000 | 3 (60%) | 23 |
| $1,000,000 | $9,000,000 | 3 (60%) | 21 |
| $750,000 | $8,000,000 | 4 (57%) | 20 |
| $478,609 | $6,700,535 | 9 (53%) | 15 |
| $347,826 | $3,000,000 | 8 (44%) | 11 |
| $86,956 | $3,000,000 | 14 (41%) | 11 |
| $66,666 | $2,000,000 | 17 (36%) | 10 |
| $46,153 | $1,500,000 | 9 (33%) | 10 |
| $38,461 | $1,000,000 | 2 (33%) | 9 |
| 4 (31%) | 9 | ||
| Selection Criteria for SCHOLAR Cohort | No. of Programs |
|---|---|
| |
| Abstracts, funding, and promotions | 1 |
| Abstracts plus promotions | 4 |
| Abstracts plus funding | 3 |
| Funding plus promotion | 1 |
| Funding only | 1 |
| Abstract only | 7 |
| Total | 17 |
| Top 10 abstract count | |
| 4 meetings | 2 |
| 3 meetings | 2 |
| 2 meetings | 6 |
The 17 unique adult AHPs appearing on at least 1 of the top 10 lists comprised the SCHOLAR cohort of programs that we studied in greater detail. Data reflecting program demographics were solicited directly from leaders of the AHPs identified in the SCHOLAR cohort, including size and age of program, reporting structure, number of faculty at various academic ranks (for programs that did not complete the LAHP‐50 survey), and number of faculty with fellowship training (defined as any postresidency fellowship program).
Subsequently, we performed comparative analyses between the programs in the SCHOLAR cohort to the general population of AHPs reflected by the LAHP‐50 sample. Because abstract presentations were not recorded in the original LAHP‐50 survey instrument, it was not possible to perform a benchmarking comparison for the scholarship domain.
Data Analysis
To measure the success of the SCHOLAR cohort we compared the grant funding and proportion of successfully promoted faculty at the SCHOLAR programs to those in the overall LAHP‐50 sample. Differences in mean and median grant funding were compared using t tests and Mann‐Whitney rank sum tests. Proportion of promoted faculty were compared using 2 tests. A 2‐tailed of 0.05 was used to test significance of differences.
RESULTS
Demographics
Among the AHPs in the SCHOLAR cohort, the mean program age was 13.2 years (range, 618 years), and the mean program size was 36 faculty (range, 1895; median, 28). On average, 15% of faculty members at SCHOLAR programs were fellowship trained (range, 0%37%). Reporting structure among the SCHOLAR programs was as follows: 53% were an independent division or section of the department of medicine; 29% were a section within general internal medicine, and 18% were an independent clinical group.
Grant Funding
Table 3 compares grant funding in the SCHOLAR programs to programs in the overall LAHP‐50 sample. Mean funding per group and mean funding per FTE were significantly higher in the SCHOLAR group than in the overall sample.
| Funding (Millions) | ||
|---|---|---|
| LAHP‐50 Overall Sample | SCHOLAR | |
| ||
| Median grant funding/AHP | 0.060 | 1.500* |
| Mean grant funding/AHP | 1.147 (015) | 3.984* (015) |
| Median grant funding/FTE | 0.004 | 0.038* |
| Mean grant funding/FTE | 0.095 (01.4) | 0.364* (01.4) |
Thirteen of the SCHOLAR programs were represented in the initial LAHP‐50, but 2 did not report a dollar amount for grants and contracts. Therefore, data for total grant funding were available for only 65% (11 of 17) of the programs in the SCHOLAR cohort. Of note, 28% of AHPs in the overall LAHP‐50 sample reported no external funding sources.
Faculty Promotion
Figure 1 demonstrates the proportion of faculty at various academic ranks. The percent of faculty above the rank of assistant professor in the SCHOLAR programs exceeded those in the overall LAHP‐50 by 5% (17.9% vs 12.8%, P = 0.01). Of note, 6% of the hospitalists at AHPs in the SCHOLAR programs were on nonfaculty tracks.
Scholarship
Mean abstract output over the 2‐year period measured was 10.8 (range, 323) in the SCHOLAR cohort. Because we did not collect these data for the LAHP‐50 group, comparative analyses were not possible.
DISCUSSION
Using a definition of academic success that incorporated metrics of grant funding, faculty promotion, and scholarly output, we identified a unique subset of successful AHPsthe SCHOLAR cohort. The programs represented in the SCHOLAR cohort were generally large and relatively mature. Despite this, the cohort consisted of mostly junior faculty, had a paucity of fellowship‐trained hospitalists, and not all reported grant funding.
Prior published work reported complementary findings.[6, 8, 9] A survey of 20 large, well‐established academic hospitalist programs in 2008 found that the majority of hospitalists were junior faculty with a limited publication portfolio. Of the 266 respondents in that study, 86% reported an academic rank at or below assistant professor; funding was not explored.[9] Our similar findings 4 years later add to this work by demonstrating trends over time, and suggest that progress toward creating successful pathways for academic advancement has been slow. In a 2012 survey of the SHM membership, 28% of hospitalists with academic appointments reported no current or future plans to engage in research.[8] These findings suggest that faculty in AHPs may define scholarship through nontraditional pathways, or in some cases choose not to pursue or prioritize scholarship altogether.
Our findings also add to the literature with regard to our assessment of funding, which was variable across the SCHOLAR group. The broad range of funding in the SCHOLAR programs for which we have data (grant dollars $0$15 million per program) suggests that opportunities to improve supported scholarship remain, even among a selected cohort of successful AHPs. The predominance of junior faculty in the SCHOLAR programs may be a reason for this variation. Junior faculty may be engaged in research with funding directed to senior mentors outside their AHP. Alternatively, they may pursue meaningful local hospital quality improvement or educational innovations not supported by external grants, or hold leadership roles in education, quality, or information technology that allow for advancement and promotion without external grant funding. As the scope and impact of these roles increases, senior leaders with alternate sources of support may rely less on research funds; this too may explain some of the differences. Our findings are congruent with results of a study that reviewed original research published by hospitalists, and concluded that the majority of hospitalist research was not externally funded.[8] Our approach for assessing grant funding by adjusting for FTE had the potential to inadvertently favor smaller well‐funded groups over larger ones; however, programs in our sample were similarly represented when ranked by funding/FTE or total grant dollars. As many successful AHPs do concentrate their research funding among a core of focused hospitalist researchers, our definition may not be the ideal metric for some programs.
We chose to define scholarship based on abstract output, rather than peer‐reviewed publications. Although this choice was necessary from a feasibility perspective, it may have excluded programs that prioritize peer‐reviewed publications over abstracts. Although we were unable to incorporate a search strategy to accurately and comprehensively track the publication output attributed specifically to hospitalist researchers and quantify it by program, others have since defined such an approach.[8] However, tracking abstracts theoretically allowed insights into a larger volume of innovative and creative work generated by top AHPs by potentially including work in the earlier stages of development.
We used a consensus‐based definition of success to define our SCHOLAR cohort. There are other ways to measure academic success, which if applied, may have yielded a different sample of programs. For example, over half of the original research articles published in the Journal of Hospital Medicine over a 7‐year span were generated from 5 academic centers.[8] This definition of success may be equally credible, though we note that 4 of these 5 programs were also included in the SCHOLAR cohort. We feel our broader approach was more reflective of the variety of pathways to success available to academic hospitalists. Before our metrics are applied as a benchmarking tool, however, they should ideally be combined with factors not measured in our study to ensure a more comprehensive or balanced reflection of academic success. Factors such as mentorship, level of hospitalist engagement,[10] prevalence of leadership opportunities, operational and fiscal infrastructure, and the impact of local quality, safety, and value efforts should be considered.
Comparison of successfully promoted faculty at AHPs across the country is inherently limited by the wide variation in promotion standards across different institutions; controlling for such differences was not possible with our methodology. For example, it appears that several programs with relatively few senior faculty may have met metrics leading to their inclusion in the SCHOLAR group because of their small program size. Future benchmarking efforts for promotion at AHPs should take scaling into account and consider both total number as well as percentage of senior faculty when evaluating success.
Our methodology has several limitations. Survey data were self‐reported and not independently validated, and as such are subject to recall and reporting biases. Response bias inherently excluded some AHPs that may have met our grant funding or promotions criteria had they participated in the initial LAHP‐50 survey, though we identified and included additional programs through our scholarship metric, increasing the representativeness of the SCHOLAR cohort. Given the dynamic nature of the field, the age of the data we relied upon for analysis limits the generalizability of our specific benchmarks to current practice. However, the development of academic success occurs over the long‐term, and published data on academic hospitalist productivity are consistent with this slower time course.[8] Despite these limitations, our data inform the general topic of gauging performance of AHPs, underscoring the challenges of developing and applying metrics of success, and highlight the variability of performance on selected metrics even among a relatively small group of 17 programs.
In conclusion, we have created a method to quantify academic success that may be useful to academic hospitalists and their group leaders as they set targets for improvement in the field. Even among our SCHOLAR cohort, room for ongoing improvement in development of funded scholarship and a core of senior faculty exists. Further investigation into the unique features of successful groups will offer insight to leaders in academic hospital medicine regarding infrastructure and processes that should be embraced to raise the bar for all AHPs. In addition, efforts to further define and validate nontraditional approaches to scholarship that allow for successful promotion at AHPs would be informative. We view our work less as a singular approach to benchmarking standards for AHPs, and more a call to action to continue efforts to balance scholarly activity and broad professional development of academic hospitalists with increasing clinical demands.
Acknowledgements
The authors thank all of the AHP leaders who participated in the SCHOLAR project. They also thank the Society of Hospital Medicine and Society of General Internal Medicine and the SHM Academic Committee and SGIM Academic Hospitalist Task Force for their support of this work.
Disclosures
The work reported here was supported by the Department of Veterans Affairs, Veterans Health Administration, South Texas Veterans Health Care System. The views expressed in this article are those of the authors and do not necessarily reflect the position or policy of the Department of Veterans Affairs. The authors report no conflicts of interest.
- , , , , . Characteristics of primary care providers who adopted the hospitalist model from 2001 to 2009. J Hosp Med. 2015;10(2):75–82.
- , , , . Growth in the care of older patients by hospitalists in the United States. N Engl J Med. 2009;360(11):1102–1112.
- , , , , . Updating threshold‐based identification of hospitalists in 2012 Medicare pay data. J Hosp Med. 2016;11(1):45–47.
- , , , . Use of hospitalists by Medicare beneficiaries: a national picture. Medicare Medicaid Res Rev. 2014;4(2).
- , , , , , . Challenges and opportunities in Academic Hospital Medicine: report from the Academic Hospital Medicine Summit. J Hosp Med. 2009;4(4):240–246.
- , , , . Survey of US academic hospitalist leaders about mentorship and academic activities in hospitalist groups. J Hosp Med. 2011;6(1):5–9.
- , , , , , . The structure of hospital medicine programs at academic medical centers [abstract]. J Hosp Med. 2012;7(suppl 2):s92.
- , , , , . Research and publication trends in hospital medicine. J Hosp Med. 2014;9(3):148–154.
- , , , , , . Mentorship, productivity, and promotion among academic hospitalists. J Gen Intern Med. 2012;27(1):23–27.
- , , , et al. The key principles and characteristics of an effective hospital medicine group: an assessment guide for hospitals and hospitalists. J Hosp Med. 2014;9(2):123–128.

Stat Laboratory Order Feedback
Overuse of inpatient stat laboratory orders (stat is an abbreviation of the Latin word statim, meaning immediately, without delay; alternatively, some consider it an acronym for short turnaround time) is a major problem in the modern healthcare system.[1, 2, 3, 4, 5] Ordering laboratory tests stat is a common way to expedite processing, with expectation of results being reported within 1 hour from the time ordered, according to the College of American Pathologists.[6] However, stat orders are also requested for convenience,[2] to expedite discharge,[7] or to meet expectation of turnaround times.[8, 9, 10] Overuse of stat orders increases cost and may reduce the effectiveness of a system. Reduction of excessive stat order requests helps support safe and efficient patient care[11, 12] and may reduce laboratory costs.[13, 14]
Several studies have examined interventions to optimize stat laboratory utilization.[14, 15] Potentially effective interventions include establishment of stat ordering guidelines, utilization of point‐of‐care testing, and prompt feedback via computerized physician order entry (CPOE) systems.[16, 17, 18] However, limited evidence is available regarding the effectiveness of audit and feedback in reducing stat ordering frequency.
Our institution shared the challenge of a high frequency of stat laboratory test orders. An interdisciplinary working group comprising leadership in the medicine, surgery, informatics, laboratory medicine, and quality and patient safety departments was formed to approach this problem and identify potential interventions. The objectives of this study are to describe the patterns of stat orders at our institution as well as to assess the effectiveness of the targeted individual feedback intervention in reducing utilization of stat laboratory test orders.
METHODS
Design
This study is a retrospective analysis of administrative data for a quality‐improvement project. The study was deemed exempt from review by the Beth Israel Medical Center Institutional Review Board.
Setting
Beth Israel Medical Center is an 856‐bed, urban, tertiary‐care teaching hospital with a capacity of 504 medical and surgical beds. In October 2009, 47.8% of inpatient laboratory tests (excluding the emergency department) were ordered as stat, according to an electronic audit of our institution's CPOE system, GE Centricity Enterprise (GE Medical Systems Information Technologies, Milwaukee, WI). Another audit using the same data query for the period of December 2009 revealed that 50 of 488 providers (attending physicians, nurse practitioners, physician assistants, fellows, and residents) accounted for 51% of total stat laboratory orders, and that Medicine and General Surgery residents accounted for 43 of these 50 providers. These findings prompted us to develop interventions that targeted high utilizers of stat laboratory orders, especially Medicine and General Surgery residents.
Teaching Session
Medicine and General Surgery residents were given a 1‐hour educational session at a teaching conference in January 2010. At this session, residents were instructed that ordering stat laboratory tests was appropriate when the results were needed urgently to make clinical decisions as quickly as possible. This session also explained the potential consequences associated with excessive stat laboratory orders and provided department‐specific data on current stat laboratory utilization.
Individual Feedback
From January to May 2010, a list of stat laboratory orders by provider was generated each month by the laboratory department's database. The top 10 providers who most frequently placed stat orders were identified and given individual feedback by their direct supervisors based on data from the prior month (feedback provided from February to June 2010). Medicine and General Surgery residents were counseled by their residency program directors, and nontrainee providers by their immediate supervising physicians. Feedback and counseling were given via brief individual meetings, phone calls, or e‐mail. Supervisors chose the method that ensured the most timely delivery of feedback. Feedback and counseling consisted of explaining the effort to reduce stat laboratory ordering and the rationale behind this, alerting providers that they were outliers, and encouraging them to change their behavior. No punitive consequences were discussed; the feedback sessions were purely informative in nature. When an individual was ranked again in the top 10 after receiving feedback, he or she received repeated feedback.
Data Collection and Measured Outcomes
We retrospectively collected data on monthly laboratory test orders by providers from September 2009 to June 2010. The data were extracted from the electronic medical record (EMR) system and included any inpatient laboratory orders at the institution. Laboratory orders placed in the emergency department were excluded. Providers were divided into nontrainees (attending physicians, nurse practitioners, and physician assistants) and trainee providers (residents and fellows). Trainee providers were further categorized by educational levels (postgraduate year [PGY]‐1 vs PGY‐2 or higher) and specialty (Medicine vs General Surgery vs other). Fellows in medical and surgical subspecialties were categorized as other.
The primary outcome measure was the proportion of stat orders out of total laboratory orders for individuals. The proportion of stat orders out of total orders was selected to assess individuals' tendency to utilize stat laboratory orders.
Statistical Analysis
In the first analysis, stat and total laboratory orders were aggregated for each provider. Providers who ordered <10 laboratory tests during the study period were excluded. We calculated the proportion of stat out of total laboratory orders for each provider, and compared it by specialty, by educational level, and by feedback status. Median and interquartile range (IQR) were reported due to non‐normal distribution, and the Wilcoxon rank‐sum test was used for comparisons.
In the second analysis, we determined pre‐feedback and post‐feedback periods for providers who received feedback. The feedback month was defined as the month immediately after a provider was ranked in the top 10 for the first time during the intervention period. For each provider, stat orders and total laboratory orders during months before and after the feedback month, excluding the feedback month, were calculated. The change in the proportion of stat laboratory orders out of all orders from pre‐ to post‐feedback was then calculated for each provider for whom both pre‐ and post‐feedback data were available. Because providers may have utilized an unusually high proportion of stat orders during the months in which they were ranked in the top 10 (for example, due to being on rotations in which many orders are placed stat, such as the intensive care units), we conducted a sensitivity analysis excluding those months. Further, for comparison, we conducted the same analysis for providers who did not receive feedback and were ranked 11 to 30 in any month during the intervention period. In those providers, we considered the month immediately after a provider was ranked in the 11 to 30 range for the first time as the hypothetical feedback month. The proportional change in the stat laboratory ordering was analyzed using the paired Student t test.
In the third analysis, we calculated the proportion of stat laboratory orders each month for each provider. Individual provider data were excluded if total laboratory orders for the month were <10. We then calculated the average proportion of stat orders for each specialty and educational level among trainee providers every month, and plotted and compared the trends.
All analyses were performed with JMP software version 9.0 (SAS Institute, Inc., Cary, NC). All statistical tests were 2‐sided, and P < 0.05 was considered significant.
RESULTS
We identified 1045 providers who ordered 1 laboratory test from September 2009 to June 2010. Of those, 716 were nontrainee providers and 329 were trainee providers. Among the trainee providers, 126 were Medicine residents, 33 were General Surgery residents, and 103 were PGY‐1. A total of 772,734 laboratory tests were ordered during the study period, and 349,658 (45.2%) tests were ordered as stat. Of all stat orders, 179,901 (51.5%) were ordered by Medicine residents and 52,225 (14.9%) were ordered by General Surgery residents.
Thirty‐seven providers received individual feedback during the intervention period. This group consisted of 8 nontrainee providers (nurse practitioners and physician assistants), 21 Medicine residents (5 were PGY‐1), and 8 General Surgery residents (all PGY‐1). This group ordered a total of 84,435 stat laboratory tests from September 2009 to June 2010 and was responsible for 24.2% of all stat laboratory test orders at the institution.
Provider Analysis
After exclusion of providers who ordered <10 laboratory tests from September 2009 to June 2010, a total of 807 providers remained. The median proportion of stat orders out of total orders was 40% among all providers and 41.6% for nontrainee providers (N = 500), 38.7% for Medicine residents (N = 125), 80.2% for General Surgery residents (N = 32), and 24.2% for other trainee providers (N = 150). The proportion of stat orders differed significantly by specialty and educational level, but also even among providers in the same specialty at the same educational level. Among PGY‐1 residents, the stat‐ordering proportion ranged from 6.9% to 49.1% for Medicine (N = 54) and 69.0% to 97.1% for General Surgery (N = 16). The proportion of stat orders was significantly higher among providers who received feedback compared with those who did not (median, 72.4% [IQR, 55.0%89.5%] vs 39.0% [IQR, 14.9%65.7%], P < 0.001). When stratified by specialty and educational level, the statistical significance remained in nontrainee providers and trainee providers with higher educational level, but not in PGY‐1 residents (Table 1).
| All Providers | Feedback Given | Feedback Not Given | |||||
|---|---|---|---|---|---|---|---|
| N | Stat % | N | Stat % | N | Stat % | P Valuea | |
| |||||||
| Total | 807 | 40 (15.869.0) | 37 | 72.4 (55.089.5) | 770 | 39.0 (14.965.7) | <0.001 |
| Nontrainee providersb | 500 | 41.6 (13.571.5) | 8 | 91.7 (64.097.5) | 492 | 40.2 (13.270.9) | <0.001 |
| Trainee providersc | 307 | 37.8 (19.162.7) | 29 | 69.3 (44.380.9) | 278 | 35.1 (17.655.6) | <0.001 |
| Medicine | 125 | 38.7 (26.850.4) | 21 | 58.8 (36.872.6) | 104 | 36.1 (25.945.6) | <0.001 |
| PGY‐1 | 54 | 28.1 (23.935.2) | 5 | 32.0 (25.536.8) | 49 | 27.9 (23.534.6) | 0.52 |
| PGY‐2 and higher | 71 | 46.5 (39.160.4) | 16 | 63.9 (54.575.7) | 55 | 45.1 (36.554.9) | <0.001 |
| General surgery | 32 | 80.2 (69.690.1) | 8 | 89.5 (79.392.7) | 24 | 78.7 (67.987.4) | <0.05 |
| PGY‐1 | 16 | 86.4 (79.191.1) | 8 | 89.5 (79.392.7) | 8 | 84.0 (73.289.1) | 0.25 |
| PGY‐2 and higher | 16 | 74.4 (65.485.3) | |||||
| Other | 150 | 24.2 (9.055.0) | |||||
| PGY‐1 | 31 | 28.2 (18.478.3) | |||||
| PGY‐2 or higher | 119 | 20.9 (5.651.3) | |||||
Stat Ordering Pattern Change by Individual Feedback
Among 37 providers who received individual feedback, 8 providers were ranked in the top 10 more than once and received repeated feedback. Twenty‐seven of 37 providers had both pre‐feedback and post‐feedback data and were included in the analysis. Of those, 7 were nontrainee providers, 16 were Medicine residents (5 were PGY‐1), and 4 were General Surgery residents (all PGY‐1). The proportion of stat laboratory orders per provider decreased by 15.7% (95% confidence interval [CI]: 5.6% to 25.9%, P = 0.004) after feedback (Table 2). The decrease remained significant after excluding the months in which providers were ranked in the top 10 (11.4%; 95% CI: 0.7% to 22.1%, P = 0.04).
| Top 10 Providers (Received Feedback) | Providers Ranked in 1130 (No Feedback) | |||||||||
|---|---|---|---|---|---|---|---|---|---|---|
| N | Mean Stat % | Mean Difference (95% CI) | P Value | N | Mean Stat % | Mean Difference (95% CI) | P Value | |||
| Pre | Post | Pre | Post | |||||||
| ||||||||||
| Total | 27 | 71.2 | 55.5 | 15.7 (25.9 to 5.6) | 0.004 | 39 | 64.6 | 60.2 | 4.5 (11.0 to 2.1) | 0.18 |
| Nontrainee providers | 7 | 94.6 | 73.2 | 21.4 (46.9 to 4.1) | 0.09 | 12 | 84.4 | 80.6 | 3.8 (11.9 to 4.3) | 0.32 |
| Trainee providers | 20 | 63.0 | 49.3 | 13.7 (25.6 to 1.9) | 0.03 | 27 | 55.8 | 51.1 | 4.7 (13.9 to 4.4) | 0.30 |
| Medicine | 16 | 55.8 | 45.0 | 10.8 (23.3 to 1.6) | 0.08 | 21 | 46.2 | 41.3 | 4.8 (16.3 to 6.7) | 0.39 |
| General Surgery | 4 | 91.9 | 66.4 | 25.4 (78.9 to 28.0) | 0.23 | 6 | 89.6 | 85.2 | 4.4 (20.5 to 11.6) | 0.51 |
| PGY‐1 | 9 | 58.9 | 47.7 | 11.2 (32.0 to 9.5) | 0.25 | 15 | 55.2 | 49.2 | 6.0 (18.9 to 6.9) | 0.33 |
| PGY‐2 or Higher | 11 | 66.4 | 50.6 | 15.8 (32.7 to 1.1) | 0.06 | 12 | 56.6 | 53.5 | 3.1 (18.3 to 12.1) | 0.66 |
In comparison, a total of 57 providers who did not receive feedback were in the 11 to 30 range during the intervention period. Three Obstetrics and Gynecology residents and 3 Family Medicine residents were excluded from the analysis to match specialty with providers who received feedback. Thirty‐nine of 51 providers had adequate data and were included in the analysis, comprising 12 nontrainee providers, 21 Medicine residents (10 were PGY‐1), and 6 General Surgery residents (5 were PGY‐1). Among them, the proportion of stat laboratory orders per provider did not change significantly, with a 4.5% decrease (95% CI: 2.1% to 11.0%, P = 0.18; Table 2).
Stat Ordering Trends Among Trainee Providers
After exclusion of data for the month with <10 total laboratory tests per provider, a total of 303 trainee providers remained, providing 2322 data points for analysis. Of the 303, 125 were Medicine residents (54 were PGY‐1), 32 were General Surgery residents (16 were PGY‐1), and 146 were others (31 were PGY‐1). The monthly trends for the average proportion of stat orders among those providers are shown in Figure 1. The decrease in the proportion of stat orders was observed after January 2010 in Medicine and General Surgery residents both in PGY‐1 and PGY‐2 or higher, but no change was observed in other trainee providers.

DISCUSSION
We describe a series of interventions implemented at our institution to decrease the utilization of stat laboratory orders. Based on an audit of laboratory‐ordering data, we decided to target high utilizers of stat laboratory tests, especially Medicine and General Surgery residents. After presenting an educational session to those residents, we gave individual feedback to the highest utilizers of stat laboratory orders. Providers who received feedback decreased their utilization of stat laboratory orders, but the stat ordering pattern did not change among those who did not receive feedback.
The individual feedback intervention involved key stakeholders for resident and nontrainee provider education (directors of the Medicine and General Surgery residency programs and other direct clinical supervisors). The targeted feedback was delivered via direct supervisors and was provided more than once as needed, which are key factors for effective feedback in modifying behavior in professional practice.[19] Allowing the supervisors to choose the most appropriate form of feedback for each individual (meetings, phone calls, or e‐mail) enabled timely and individually tailored feedback and contributed to successful implementation. We feel intervention had high educational value for residents, as it promoted residents' engagement in proper systems‐based practice, one of the 6 core competencies of the Accreditation Council for Graduate Medical Education (ACGME).
We utilized the EMR to obtain provider‐specific data for feedback and analysis. As previously suggested, the use of the EMR for audit and feedback was effective in providing timely, actionable, and individualized feedback with peer benchmarking.[20, 21] We used the raw number of stat laboratory orders for audit and the proportion of stat orders out of total orders to assess the individual behavioral patterns. Although the proportional use of stat orders is affected by patient acuity and workplace or rotation site, it also seems largely affected by provider's preference or practice patterns, as we saw the variance among providers of the same specialty and educational level. The changes in the stat ordering trends only seen among Medicine and General Surgery residents suggests that our interventions successfully decreased the overall utilization of stat laboratory orders among targeted providers, and it seems less likely that those decreases are due to changes in patient acuity, changes in rotation sites, or learning curve among trainee providers. When averaged over the 10‐month study period, as shown in Table 1, the providers who received feedback ordered a higher proportion of stat tests than those who did not receive feedback, except for PGY‐1 residents. This suggests that although auditing based on the number of stat laboratory orders identified providers who tended to order more stat tests than others, it may not be a reliable indicator for PGY‐1 residents, whose number of laboratory orders highly fluctuates by rotation.
There are certain limitations to our study. First, we assumed that the top utilizers were inappropriately ordering stat laboratory tests. Because there is no clear consensus as to what constitutes appropriate stat testing,[7] it was difficult, if not impossible, to determine which specific orders were inappropriate. However, high variability of the stat ordering pattern in the analysis provides some evidence that high stat utilizers customarily order more stat testing as compared with others. A recent study also revealed that the median stat ordering percentage was 35.9% among 52 US institutions.[13] At our institution, 47.8% of laboratory tests were ordered stat prior to the intervention, higher than the benchmark, providing the rationale for our intervention.
Second, the intervention was conducted in a time‐series fashion and no randomization was employed. The comparison of providers who received feedback with those who did not is subject to selection bias, and the difference in the change in stat ordering pattern between these 2 groups may be partially due to variability of work location, rotation type, or acuity of patients. However, we performed a sensitivity analysis excluding the months when the providers were ranked in the top 10, assuming that they may have ordered an unusually high proportion of stat tests due to high acuity of patients (eg, rotation in the intensive care units) during those months. Robust results in this analysis support our contention that individual feedback was effective. In addition, we cannot completely rule out the possibility that the changes in stat ordering practice may be solely due to natural maturation effects within an academic year among trainee providers, especially PGY‐1 residents. However, relatively acute changes in the stat ordering trends only among targeted provider groups around January 2010, corresponding to the timing of interventions, suggest otherwise.
Third, we were not able to test if the intervention or decrease in stat orders adversely affected patient care. For example, if, after receiving feedback, providers did not order some tests stat that should have been ordered that way, this could have negatively affected patient care. Additionally, we did not evaluate whether reduction in stat laboratory orders improved timeliness of the reporting of stat laboratory results.
Lastly, the sustained effect and feasibility of this intervention were not tested. Past studies suggest educational interventions in laboratory ordering behavior would most likely need to be continued to maintain its effectiveness.[22, 23] Although we acknowledge that sustainability of this type of intervention may be difficult, we feel we have demonstrated that there is still value associated with giving personalized feedback.
This study has implications for future interventions and research. Use of automated, EMR‐based feedback on laboratory ordering performance may be effective in reducing excessive stat ordering and may obviate the need for time‐consuming efforts by supervisors. Development of quality indicators that more accurately assess stat ordering patterns, potentially adjusted for working sites and patient acuity, may be necessary. Studies that measure the impact of decreasing stat laboratory orders on turnaround times and cost may be of value.
CONCLUSION
At our urban, tertiary‐care teaching institution, stat ordering frequency was highly variable among providers. Targeted individual feedback to providers who ordered a large number of stat laboratory tests decreased their stat laboratory order utilization.
- . Turnaround time, part 2: stats too high, yet labs cope. MLO Med Lab Obs. 1993;25(9):33–38.
- . Laboratory turnaround time. Am J Clin Pathol. 1996;105(6):676–688.
- . No more STAT testing. MLO Med Lab Obs. 2005;37(8):22, 24, 26.
- , , . Phlebotomy, stat testing and laboratory organization: an intriguing relationship. Clin Chem Lab Med. 2012;50(12):2065–2068.
- , , , et al. Laboratory request appropriateness in emergency: impact on hospital organization. Clin Chem Lab Med. 2006;44(6):760–764.
- College of American Pathologists.Definitions used in past Q‐PROBES studies (1991–2011). Available at: http://www.cap.org/apps/docs/q_probes/q‐probes_definitions.pdf. Updated September 29, 2011. Accessed July 31, 2013.
- , , . Practice Parameter. STAT testing? A guideline for meeting clinician turnaround time requirements. Am J Clin Pathol. 1996;105(6):671–675.
- , . Intralaboratory performance and laboratorians' expectations for stat turnaround times: a College of American Pathologists Q‐Probes study of four cerebrospinal fluid determinations. Arch Pathol Lab Med. 1991;115(10):977–983.
- , , , . How fast is fast enough for clinical laboratory turnaround time? Measurement of the interval between result entry and inquiries for reports. Am J Clin Pathol. 1997;108(4):400–405.
- , . Strategies of organization and service for the critical‐care laboratory. Clin Chem. 1990;36(8):1557–1561.
- , , , , . Evaluation of stat and routine turnaround times as a component of laboratory quality. Am J Clin Pathol. 1989;91(3):331–335.
- , . Laboratory results: Timeliness as a quality attribute and strategy. Am J Clin Pathol. 2001;116(3):311–315.
- , , , . Utilization of stat test priority in the clinical laboratory: a College of American Pathologists Q‐Probes study of 52 institutions. Arch Pathol Lab Med. 2013;137(2):220–227.
- . Controlling the use of stat testing. Pathologist. 1984;38(8):474–477.
- , , . Optimizing the availability of ‘stat' laboratory tests using Shewhart ‘C' control charts. Ann Clin Biochem. 2002;39(part 2):140–144.
- , , . Evaluating stat testing options in an academic health center: therapeutic turnaround time and staff satisfaction. Clin Chem. 1998;44(8):1597–1603.
- , , . Impact of a physician's order entry (POE) system on physicians' ordering patterns and patient length of stay. Int J Med Inform. 2002;65(3):213–223.
- , . Instrumentation for STAT analyses. Clin Lab Med. 1988;8(4):689–697.
- , , , et al. Audit and feedback: effects on professional practice and healthcare outcomes. Cochrane Database Syst Rev. 2012;6:CD000259.
- , , , , , . The feasibility of automating audit and feedback for ART guideline adherence in Malawi. J Am Med Inform Assoc. 2011;18(6):868–874.
- , , , et al. Effect of an outpatient antimicrobial stewardship intervention on broad‐spectrum antibiotic prescribing by primary care pediatricians: a randomized trial. JAMA. 2013;309(22):2345–2352.
- . An educational program to modify laboratory use by house staff. J Med Educ. 1977;52(7):578–581.
- , , . Ordering of laboratory tests in a teaching hospital: can it be improved? JAMA. 1983;249(22):3076–3080.
Overuse of inpatient stat laboratory orders (stat is an abbreviation of the Latin word statim, meaning immediately, without delay; alternatively, some consider it an acronym for short turnaround time) is a major problem in the modern healthcare system.[1, 2, 3, 4, 5] Ordering laboratory tests stat is a common way to expedite processing, with expectation of results being reported within 1 hour from the time ordered, according to the College of American Pathologists.[6] However, stat orders are also requested for convenience,[2] to expedite discharge,[7] or to meet expectation of turnaround times.[8, 9, 10] Overuse of stat orders increases cost and may reduce the effectiveness of a system. Reduction of excessive stat order requests helps support safe and efficient patient care[11, 12] and may reduce laboratory costs.[13, 14]
Several studies have examined interventions to optimize stat laboratory utilization.[14, 15] Potentially effective interventions include establishment of stat ordering guidelines, utilization of point‐of‐care testing, and prompt feedback via computerized physician order entry (CPOE) systems.[16, 17, 18] However, limited evidence is available regarding the effectiveness of audit and feedback in reducing stat ordering frequency.
Our institution shared the challenge of a high frequency of stat laboratory test orders. An interdisciplinary working group comprising leadership in the medicine, surgery, informatics, laboratory medicine, and quality and patient safety departments was formed to approach this problem and identify potential interventions. The objectives of this study are to describe the patterns of stat orders at our institution as well as to assess the effectiveness of the targeted individual feedback intervention in reducing utilization of stat laboratory test orders.
METHODS
Design
This study is a retrospective analysis of administrative data for a quality‐improvement project. The study was deemed exempt from review by the Beth Israel Medical Center Institutional Review Board.
Setting
Beth Israel Medical Center is an 856‐bed, urban, tertiary‐care teaching hospital with a capacity of 504 medical and surgical beds. In October 2009, 47.8% of inpatient laboratory tests (excluding the emergency department) were ordered as stat, according to an electronic audit of our institution's CPOE system, GE Centricity Enterprise (GE Medical Systems Information Technologies, Milwaukee, WI). Another audit using the same data query for the period of December 2009 revealed that 50 of 488 providers (attending physicians, nurse practitioners, physician assistants, fellows, and residents) accounted for 51% of total stat laboratory orders, and that Medicine and General Surgery residents accounted for 43 of these 50 providers. These findings prompted us to develop interventions that targeted high utilizers of stat laboratory orders, especially Medicine and General Surgery residents.
Teaching Session
Medicine and General Surgery residents were given a 1‐hour educational session at a teaching conference in January 2010. At this session, residents were instructed that ordering stat laboratory tests was appropriate when the results were needed urgently to make clinical decisions as quickly as possible. This session also explained the potential consequences associated with excessive stat laboratory orders and provided department‐specific data on current stat laboratory utilization.
Individual Feedback
From January to May 2010, a list of stat laboratory orders by provider was generated each month by the laboratory department's database. The top 10 providers who most frequently placed stat orders were identified and given individual feedback by their direct supervisors based on data from the prior month (feedback provided from February to June 2010). Medicine and General Surgery residents were counseled by their residency program directors, and nontrainee providers by their immediate supervising physicians. Feedback and counseling were given via brief individual meetings, phone calls, or e‐mail. Supervisors chose the method that ensured the most timely delivery of feedback. Feedback and counseling consisted of explaining the effort to reduce stat laboratory ordering and the rationale behind this, alerting providers that they were outliers, and encouraging them to change their behavior. No punitive consequences were discussed; the feedback sessions were purely informative in nature. When an individual was ranked again in the top 10 after receiving feedback, he or she received repeated feedback.
Data Collection and Measured Outcomes
We retrospectively collected data on monthly laboratory test orders by providers from September 2009 to June 2010. The data were extracted from the electronic medical record (EMR) system and included any inpatient laboratory orders at the institution. Laboratory orders placed in the emergency department were excluded. Providers were divided into nontrainees (attending physicians, nurse practitioners, and physician assistants) and trainee providers (residents and fellows). Trainee providers were further categorized by educational levels (postgraduate year [PGY]‐1 vs PGY‐2 or higher) and specialty (Medicine vs General Surgery vs other). Fellows in medical and surgical subspecialties were categorized as other.
The primary outcome measure was the proportion of stat orders out of total laboratory orders for individuals. The proportion of stat orders out of total orders was selected to assess individuals' tendency to utilize stat laboratory orders.
Statistical Analysis
In the first analysis, stat and total laboratory orders were aggregated for each provider. Providers who ordered <10 laboratory tests during the study period were excluded. We calculated the proportion of stat out of total laboratory orders for each provider, and compared it by specialty, by educational level, and by feedback status. Median and interquartile range (IQR) were reported due to non‐normal distribution, and the Wilcoxon rank‐sum test was used for comparisons.
In the second analysis, we determined pre‐feedback and post‐feedback periods for providers who received feedback. The feedback month was defined as the month immediately after a provider was ranked in the top 10 for the first time during the intervention period. For each provider, stat orders and total laboratory orders during months before and after the feedback month, excluding the feedback month, were calculated. The change in the proportion of stat laboratory orders out of all orders from pre‐ to post‐feedback was then calculated for each provider for whom both pre‐ and post‐feedback data were available. Because providers may have utilized an unusually high proportion of stat orders during the months in which they were ranked in the top 10 (for example, due to being on rotations in which many orders are placed stat, such as the intensive care units), we conducted a sensitivity analysis excluding those months. Further, for comparison, we conducted the same analysis for providers who did not receive feedback and were ranked 11 to 30 in any month during the intervention period. In those providers, we considered the month immediately after a provider was ranked in the 11 to 30 range for the first time as the hypothetical feedback month. The proportional change in the stat laboratory ordering was analyzed using the paired Student t test.
In the third analysis, we calculated the proportion of stat laboratory orders each month for each provider. Individual provider data were excluded if total laboratory orders for the month were <10. We then calculated the average proportion of stat orders for each specialty and educational level among trainee providers every month, and plotted and compared the trends.
All analyses were performed with JMP software version 9.0 (SAS Institute, Inc., Cary, NC). All statistical tests were 2‐sided, and P < 0.05 was considered significant.
RESULTS
We identified 1045 providers who ordered 1 laboratory test from September 2009 to June 2010. Of those, 716 were nontrainee providers and 329 were trainee providers. Among the trainee providers, 126 were Medicine residents, 33 were General Surgery residents, and 103 were PGY‐1. A total of 772,734 laboratory tests were ordered during the study period, and 349,658 (45.2%) tests were ordered as stat. Of all stat orders, 179,901 (51.5%) were ordered by Medicine residents and 52,225 (14.9%) were ordered by General Surgery residents.
Thirty‐seven providers received individual feedback during the intervention period. This group consisted of 8 nontrainee providers (nurse practitioners and physician assistants), 21 Medicine residents (5 were PGY‐1), and 8 General Surgery residents (all PGY‐1). This group ordered a total of 84,435 stat laboratory tests from September 2009 to June 2010 and was responsible for 24.2% of all stat laboratory test orders at the institution.
Provider Analysis
After exclusion of providers who ordered <10 laboratory tests from September 2009 to June 2010, a total of 807 providers remained. The median proportion of stat orders out of total orders was 40% among all providers and 41.6% for nontrainee providers (N = 500), 38.7% for Medicine residents (N = 125), 80.2% for General Surgery residents (N = 32), and 24.2% for other trainee providers (N = 150). The proportion of stat orders differed significantly by specialty and educational level, but also even among providers in the same specialty at the same educational level. Among PGY‐1 residents, the stat‐ordering proportion ranged from 6.9% to 49.1% for Medicine (N = 54) and 69.0% to 97.1% for General Surgery (N = 16). The proportion of stat orders was significantly higher among providers who received feedback compared with those who did not (median, 72.4% [IQR, 55.0%89.5%] vs 39.0% [IQR, 14.9%65.7%], P < 0.001). When stratified by specialty and educational level, the statistical significance remained in nontrainee providers and trainee providers with higher educational level, but not in PGY‐1 residents (Table 1).
| All Providers | Feedback Given | Feedback Not Given | |||||
|---|---|---|---|---|---|---|---|
| N | Stat % | N | Stat % | N | Stat % | P Valuea | |
| |||||||
| Total | 807 | 40 (15.869.0) | 37 | 72.4 (55.089.5) | 770 | 39.0 (14.965.7) | <0.001 |
| Nontrainee providersb | 500 | 41.6 (13.571.5) | 8 | 91.7 (64.097.5) | 492 | 40.2 (13.270.9) | <0.001 |
| Trainee providersc | 307 | 37.8 (19.162.7) | 29 | 69.3 (44.380.9) | 278 | 35.1 (17.655.6) | <0.001 |
| Medicine | 125 | 38.7 (26.850.4) | 21 | 58.8 (36.872.6) | 104 | 36.1 (25.945.6) | <0.001 |
| PGY‐1 | 54 | 28.1 (23.935.2) | 5 | 32.0 (25.536.8) | 49 | 27.9 (23.534.6) | 0.52 |
| PGY‐2 and higher | 71 | 46.5 (39.160.4) | 16 | 63.9 (54.575.7) | 55 | 45.1 (36.554.9) | <0.001 |
| General surgery | 32 | 80.2 (69.690.1) | 8 | 89.5 (79.392.7) | 24 | 78.7 (67.987.4) | <0.05 |
| PGY‐1 | 16 | 86.4 (79.191.1) | 8 | 89.5 (79.392.7) | 8 | 84.0 (73.289.1) | 0.25 |
| PGY‐2 and higher | 16 | 74.4 (65.485.3) | |||||
| Other | 150 | 24.2 (9.055.0) | |||||
| PGY‐1 | 31 | 28.2 (18.478.3) | |||||
| PGY‐2 or higher | 119 | 20.9 (5.651.3) | |||||
Stat Ordering Pattern Change by Individual Feedback
Among 37 providers who received individual feedback, 8 providers were ranked in the top 10 more than once and received repeated feedback. Twenty‐seven of 37 providers had both pre‐feedback and post‐feedback data and were included in the analysis. Of those, 7 were nontrainee providers, 16 were Medicine residents (5 were PGY‐1), and 4 were General Surgery residents (all PGY‐1). The proportion of stat laboratory orders per provider decreased by 15.7% (95% confidence interval [CI]: 5.6% to 25.9%, P = 0.004) after feedback (Table 2). The decrease remained significant after excluding the months in which providers were ranked in the top 10 (11.4%; 95% CI: 0.7% to 22.1%, P = 0.04).
| Top 10 Providers (Received Feedback) | Providers Ranked in 1130 (No Feedback) | |||||||||
|---|---|---|---|---|---|---|---|---|---|---|
| N | Mean Stat % | Mean Difference (95% CI) | P Value | N | Mean Stat % | Mean Difference (95% CI) | P Value | |||
| Pre | Post | Pre | Post | |||||||
| ||||||||||
| Total | 27 | 71.2 | 55.5 | 15.7 (25.9 to 5.6) | 0.004 | 39 | 64.6 | 60.2 | 4.5 (11.0 to 2.1) | 0.18 |
| Nontrainee providers | 7 | 94.6 | 73.2 | 21.4 (46.9 to 4.1) | 0.09 | 12 | 84.4 | 80.6 | 3.8 (11.9 to 4.3) | 0.32 |
| Trainee providers | 20 | 63.0 | 49.3 | 13.7 (25.6 to 1.9) | 0.03 | 27 | 55.8 | 51.1 | 4.7 (13.9 to 4.4) | 0.30 |
| Medicine | 16 | 55.8 | 45.0 | 10.8 (23.3 to 1.6) | 0.08 | 21 | 46.2 | 41.3 | 4.8 (16.3 to 6.7) | 0.39 |
| General Surgery | 4 | 91.9 | 66.4 | 25.4 (78.9 to 28.0) | 0.23 | 6 | 89.6 | 85.2 | 4.4 (20.5 to 11.6) | 0.51 |
| PGY‐1 | 9 | 58.9 | 47.7 | 11.2 (32.0 to 9.5) | 0.25 | 15 | 55.2 | 49.2 | 6.0 (18.9 to 6.9) | 0.33 |
| PGY‐2 or Higher | 11 | 66.4 | 50.6 | 15.8 (32.7 to 1.1) | 0.06 | 12 | 56.6 | 53.5 | 3.1 (18.3 to 12.1) | 0.66 |
In comparison, a total of 57 providers who did not receive feedback were in the 11 to 30 range during the intervention period. Three Obstetrics and Gynecology residents and 3 Family Medicine residents were excluded from the analysis to match specialty with providers who received feedback. Thirty‐nine of 51 providers had adequate data and were included in the analysis, comprising 12 nontrainee providers, 21 Medicine residents (10 were PGY‐1), and 6 General Surgery residents (5 were PGY‐1). Among them, the proportion of stat laboratory orders per provider did not change significantly, with a 4.5% decrease (95% CI: 2.1% to 11.0%, P = 0.18; Table 2).
Stat Ordering Trends Among Trainee Providers
After exclusion of data for the month with <10 total laboratory tests per provider, a total of 303 trainee providers remained, providing 2322 data points for analysis. Of the 303, 125 were Medicine residents (54 were PGY‐1), 32 were General Surgery residents (16 were PGY‐1), and 146 were others (31 were PGY‐1). The monthly trends for the average proportion of stat orders among those providers are shown in Figure 1. The decrease in the proportion of stat orders was observed after January 2010 in Medicine and General Surgery residents both in PGY‐1 and PGY‐2 or higher, but no change was observed in other trainee providers.
DISCUSSION
We describe a series of interventions implemented at our institution to decrease the utilization of stat laboratory orders. Based on an audit of laboratory‐ordering data, we decided to target high utilizers of stat laboratory tests, especially Medicine and General Surgery residents. After presenting an educational session to those residents, we gave individual feedback to the highest utilizers of stat laboratory orders. Providers who received feedback decreased their utilization of stat laboratory orders, but the stat ordering pattern did not change among those who did not receive feedback.
The individual feedback intervention involved key stakeholders for resident and nontrainee provider education (directors of the Medicine and General Surgery residency programs and other direct clinical supervisors). The targeted feedback was delivered via direct supervisors and was provided more than once as needed, which are key factors for effective feedback in modifying behavior in professional practice.[19] Allowing the supervisors to choose the most appropriate form of feedback for each individual (meetings, phone calls, or e‐mail) enabled timely and individually tailored feedback and contributed to successful implementation. We feel intervention had high educational value for residents, as it promoted residents' engagement in proper systems‐based practice, one of the 6 core competencies of the Accreditation Council for Graduate Medical Education (ACGME).
We utilized the EMR to obtain provider‐specific data for feedback and analysis. As previously suggested, the use of the EMR for audit and feedback was effective in providing timely, actionable, and individualized feedback with peer benchmarking.[20, 21] We used the raw number of stat laboratory orders for audit and the proportion of stat orders out of total orders to assess the individual behavioral patterns. Although the proportional use of stat orders is affected by patient acuity and workplace or rotation site, it also seems largely affected by provider's preference or practice patterns, as we saw the variance among providers of the same specialty and educational level. The changes in the stat ordering trends only seen among Medicine and General Surgery residents suggests that our interventions successfully decreased the overall utilization of stat laboratory orders among targeted providers, and it seems less likely that those decreases are due to changes in patient acuity, changes in rotation sites, or learning curve among trainee providers. When averaged over the 10‐month study period, as shown in Table 1, the providers who received feedback ordered a higher proportion of stat tests than those who did not receive feedback, except for PGY‐1 residents. This suggests that although auditing based on the number of stat laboratory orders identified providers who tended to order more stat tests than others, it may not be a reliable indicator for PGY‐1 residents, whose number of laboratory orders highly fluctuates by rotation.
There are certain limitations to our study. First, we assumed that the top utilizers were inappropriately ordering stat laboratory tests. Because there is no clear consensus as to what constitutes appropriate stat testing,[7] it was difficult, if not impossible, to determine which specific orders were inappropriate. However, high variability of the stat ordering pattern in the analysis provides some evidence that high stat utilizers customarily order more stat testing as compared with others. A recent study also revealed that the median stat ordering percentage was 35.9% among 52 US institutions.[13] At our institution, 47.8% of laboratory tests were ordered stat prior to the intervention, higher than the benchmark, providing the rationale for our intervention.
Second, the intervention was conducted in a time‐series fashion and no randomization was employed. The comparison of providers who received feedback with those who did not is subject to selection bias, and the difference in the change in stat ordering pattern between these 2 groups may be partially due to variability of work location, rotation type, or acuity of patients. However, we performed a sensitivity analysis excluding the months when the providers were ranked in the top 10, assuming that they may have ordered an unusually high proportion of stat tests due to high acuity of patients (eg, rotation in the intensive care units) during those months. Robust results in this analysis support our contention that individual feedback was effective. In addition, we cannot completely rule out the possibility that the changes in stat ordering practice may be solely due to natural maturation effects within an academic year among trainee providers, especially PGY‐1 residents. However, relatively acute changes in the stat ordering trends only among targeted provider groups around January 2010, corresponding to the timing of interventions, suggest otherwise.
Third, we were not able to test if the intervention or decrease in stat orders adversely affected patient care. For example, if, after receiving feedback, providers did not order some tests stat that should have been ordered that way, this could have negatively affected patient care. Additionally, we did not evaluate whether reduction in stat laboratory orders improved timeliness of the reporting of stat laboratory results.
Lastly, the sustained effect and feasibility of this intervention were not tested. Past studies suggest educational interventions in laboratory ordering behavior would most likely need to be continued to maintain its effectiveness.[22, 23] Although we acknowledge that sustainability of this type of intervention may be difficult, we feel we have demonstrated that there is still value associated with giving personalized feedback.
This study has implications for future interventions and research. Use of automated, EMR‐based feedback on laboratory ordering performance may be effective in reducing excessive stat ordering and may obviate the need for time‐consuming efforts by supervisors. Development of quality indicators that more accurately assess stat ordering patterns, potentially adjusted for working sites and patient acuity, may be necessary. Studies that measure the impact of decreasing stat laboratory orders on turnaround times and cost may be of value.
CONCLUSION
At our urban, tertiary‐care teaching institution, stat ordering frequency was highly variable among providers. Targeted individual feedback to providers who ordered a large number of stat laboratory tests decreased their stat laboratory order utilization.
- . Turnaround time, part 2: stats too high, yet labs cope. MLO Med Lab Obs. 1993;25(9):33–38.
- . Laboratory turnaround time. Am J Clin Pathol. 1996;105(6):676–688.
- . No more STAT testing. MLO Med Lab Obs. 2005;37(8):22, 24, 26.
- , , . Phlebotomy, stat testing and laboratory organization: an intriguing relationship. Clin Chem Lab Med. 2012;50(12):2065–2068.
- , , , et al. Laboratory request appropriateness in emergency: impact on hospital organization. Clin Chem Lab Med. 2006;44(6):760–764.
- College of American Pathologists.Definitions used in past Q‐PROBES studies (1991–2011). Available at: http://www.cap.org/apps/docs/q_probes/q‐probes_definitions.pdf. Updated September 29, 2011. Accessed July 31, 2013.
- , , . Practice Parameter. STAT testing? A guideline for meeting clinician turnaround time requirements. Am J Clin Pathol. 1996;105(6):671–675.
- , . Intralaboratory performance and laboratorians' expectations for stat turnaround times: a College of American Pathologists Q‐Probes study of four cerebrospinal fluid determinations. Arch Pathol Lab Med. 1991;115(10):977–983.
- , , , . How fast is fast enough for clinical laboratory turnaround time? Measurement of the interval between result entry and inquiries for reports. Am J Clin Pathol. 1997;108(4):400–405.
- , . Strategies of organization and service for the critical‐care laboratory. Clin Chem. 1990;36(8):1557–1561.
- , , , , . Evaluation of stat and routine turnaround times as a component of laboratory quality. Am J Clin Pathol. 1989;91(3):331–335.
- , . Laboratory results: Timeliness as a quality attribute and strategy. Am J Clin Pathol. 2001;116(3):311–315.
- , , , . Utilization of stat test priority in the clinical laboratory: a College of American Pathologists Q‐Probes study of 52 institutions. Arch Pathol Lab Med. 2013;137(2):220–227.
- . Controlling the use of stat testing. Pathologist. 1984;38(8):474–477.
- , , . Optimizing the availability of ‘stat' laboratory tests using Shewhart ‘C' control charts. Ann Clin Biochem. 2002;39(part 2):140–144.
- , , . Evaluating stat testing options in an academic health center: therapeutic turnaround time and staff satisfaction. Clin Chem. 1998;44(8):1597–1603.
- , , . Impact of a physician's order entry (POE) system on physicians' ordering patterns and patient length of stay. Int J Med Inform. 2002;65(3):213–223.
- , . Instrumentation for STAT analyses. Clin Lab Med. 1988;8(4):689–697.
- , , , et al. Audit and feedback: effects on professional practice and healthcare outcomes. Cochrane Database Syst Rev. 2012;6:CD000259.
- , , , , , . The feasibility of automating audit and feedback for ART guideline adherence in Malawi. J Am Med Inform Assoc. 2011;18(6):868–874.
- , , , et al. Effect of an outpatient antimicrobial stewardship intervention on broad‐spectrum antibiotic prescribing by primary care pediatricians: a randomized trial. JAMA. 2013;309(22):2345–2352.
- . An educational program to modify laboratory use by house staff. J Med Educ. 1977;52(7):578–581.
- , , . Ordering of laboratory tests in a teaching hospital: can it be improved? JAMA. 1983;249(22):3076–3080.
© 2013 Society of Hospital Medicine
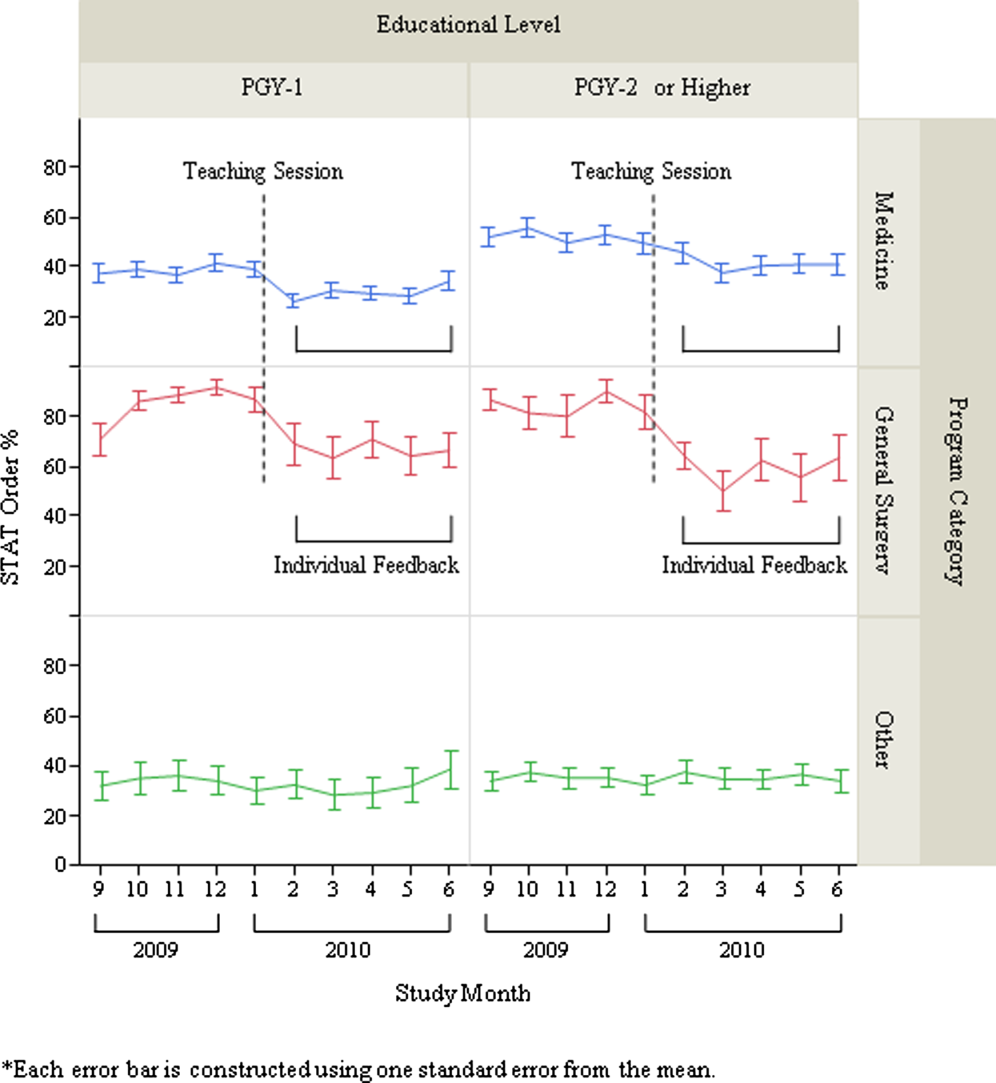
Survey of Hospitalist Supervision
In 2003, the Accreditation Council for Graduate Medical Education (ACGME) announced the first in a series of guidelines related to the regulation and oversight of residency training.1 The initial iteration specifically focused on the total and consecutive numbers of duty hours worked by trainees. These limitations began a new era of shift work in internal medicine residency training. With decreases in housestaff admitting capacity, clinical work has frequently been offloaded to non‐teaching or attending‐only services, increasing the demand for hospitalists to fill the void in physician‐staffed care in the hospital.2, 3 Since the implementation of the 2003 ACGME guidelines and a growing focus on patient safety, there has been increased study of, and call for, oversight of trainees in medicine; among these was the 2008 Institute of Medicine report,4 calling for 24/7 attending‐level supervision. The updated ACGME requirements,5 effective July 1, 2011, mandate enhanced on‐site supervision of trainee physicians. These new regulations not only define varying levels of supervision for trainees, including direct supervision with the physical presence of a supervisor and the degree of availability of said supervisor, they also describe ensuring the quality of supervision provided.5 While continuous attending‐level supervision is not yet mandated, many residency programs look to their academic hospitalists to fill the supervisory void, particularly at night. However, what specific roles hospitalists play in the nighttime supervision of trainees or the impact of this supervision remains unclear. To date, no study has examined a broad sample of hospitalist programs in teaching hospitals and the types of resident oversight they provide. We aimed to describe the current state of academic hospitalists in the clinical supervision of housestaff, specifically during the overnight period, and hospitalist perceptions of how the new ACGME requirements would impact traineehospitalist interactions.
METHODS
The Housestaff Oversight Subcommittee, a working group of the Society of General Internal Medicine (SGIM) Academic Hospitalist Task Force, surveyed a sample of academic hospitalist program leaders to assess the current status of trainee supervision performed by hospitalists. Programs were considered academic if they were located in the primary hospital of a residency that participates in the National Resident Matching Program for Internal Medicine. To obtain a broad geographic spectrum of academic hospitalist programs, all programs, both university and community‐based, in 4 states and 2 metropolitan regions were sampled: Washington, Oregon, Texas, Maryland, and the Philadelphia and Chicago metropolitan areas. Hospitalist program leaders were identified by members of the Taskforce using individual program websites and by querying departmental leadership at eligible teaching hospitals. Respondents were contacted by e‐mail for participation. None of the authors of the manuscript were participants in the survey.
The survey was developed by consensus of the working group after reviewing the salient literature and included additional questions queried to internal medicine program directors.6 The 19‐item SurveyMonkey instrument included questions about hospitalists' role in trainees' education and evaluation. A Likert‐type scale was used to assess perceptions regarding the impact of on‐site hospitalist supervision on trainee autonomy and hospitalist workload (1 = strongly disagree to 5 = strongly agree). Descriptive statistics were performed and, where appropriate, t test and Fisher's exact test were performed to identify associations between program characteristics and perceptions. Stata SE was used (STATA Corp, College Station, TX) for all statistical analysis.
RESULTS
The survey was sent to 47 individuals identified as likely hospitalist program leaders and completed by 41 individuals (87%). However, 7 respondents turned out not to be program leaders and were therefore excluded, resulting in a 72% (34/47) survey response rate.
The programs for which we did not obtain responses were similar to respondent programs, and did not include a larger proportion of community‐based programs or overrepresent a specific geographic region. Twenty‐five (73%) of the 34 hospitalist program leaders were male, with an average age of 44.3 years, and an average of 12 years post‐residency training (range, 530 years). They reported leading groups with an average of 18 full‐time equivalent (FTE) faculty (range, 350 persons).
Relationship of Hospitalist Programs With the Residency Program
The majority (32/34, 94%) of respondents describe their program as having traditional housestaffhospitalist interactions on an attending‐covered housestaff teaching service. Other hospitalists' clinical roles included: attending on uncovered (non‐housestaff services; 29/34, 85%); nighttime coverage (24/34, 70%); attending on consult services with housestaff (24/34, 70%). All respondents reported that hospitalist faculty are expected to participate in housestaff teaching or to fulfill other educational roles within the residency training program. These educational roles include participating in didactics or educational conferences, and serving as advisors. Additionally, the faculty of 30 (88%) programs have a formal evaluative role over the housestaff they supervise on teaching services (eg, members of formal housestaff evaluation committee). Finally, 28 (82%) programs have faculty who play administrative roles in the residency programs, such as involvement in program leadership or recruitment. Although 63% of the corresponding internal medicine residency programs have a formal housestaff supervision policy, only 43% of program leaders stated that their hospitalists receive formal faculty development on how to provide this supervision to resident trainees. Instead, the majority of hospitalist programs were described as having teaching expectations in the absence of a formal policy.
Twenty‐one programs (21/34, 61%) described having an attending hospitalist physician on‐site overnight to provide ongoing patient care or admit new patients. Of those with on‐site attending coverage, a minority of programs (8/21, 38%) reported having a formal defined supervisory role of housestaff trainees for hospitalists during the overnight period. In these 8 programs, this defined role included a requirement for housestaff to present newly admitted patients or contact hospitalists with questions regarding patient management. Twenty‐four percent (5/21) of the programs with nighttime coverage stated that the role of the nocturnal attending was only to cover the non‐teaching services, without housestaff interaction or supervision. The remainder of programs (8/21, 38%) describe only informal interactions between housestaff and hospitalist faculty, without clearly defined expectations for supervision.
Perceptions of New Regulations and Night Work
Hospitalist leaders viewed increased supervision of housestaff both positively and negatively. Leaders were asked their level of agreement with the potential impact of increased hospitalist nighttime supervision. Of respondents, 85% (27/32) agreed that formal overnight supervision by an attending hospitalist would improve patient safety, and 60% (20/33) agreed that formal overnight supervision would improve traineehospitalist relationships. In addition, 60% (20/33) of respondents felt that nighttime supervision of housestaff by faculty hospitalists would improve resident education. However, approximately 40% (13/33) expressed concern that increased on‐site hospitalist supervision would hamper resident decision‐making autonomy, and 75% (25/33) agreed that a formal housestaff supervisory role would increase hospitalist work load. The perception of increased workload was influenced by a hospitalist program's current supervisory role. Hospitalists programs providing formal nighttime supervision for housestaff, compared to those with informal or poorly defined faculty roles, were less likely to perceive these new regulations as resulting in an increase in hospitalist workload (3.72 vs 4.42; P = 0.02). In addition, hospitalist programs with a formal nighttime role were more likely to identify lack of specific parameters for attending‐level contact as a barrier to residents not contacting their supervisors during the overnight period (2.54 vs 3.54; P = 0.03). No differences in perception of the regulations were noted for those hospitalist programs which had existing faculty development on clinical supervision.
DISCUSSION
This study provides important information about how academic hospitalists currently contribute to the supervision of internal medicine residents. While academic hospitalist groups frequently have faculty providing clinical care on‐site at night, and often hospitalists provide overnight supervision of internal medicine trainees, formal supervision of trainees is not uniform, and few hospitalists groups have a mechanism to provide training or faculty development on how to effectively supervise resident trainees. Hospitalist leaders expressed concerns that creating additional formal overnight supervisory responsibilities may add to an already burdened overnight hospitalist. Formalizing this supervisory role, including explicit role definitions and faculty training for trainee supervision, is necessary.
Though our sample size is small, we captured a diverse geographic range of both university and community‐based academic hospitalist programs by surveying group leaders in several distinct regions. We are unable to comment on differences between responding and non‐responding hospitalist programs, but there does not appear to be a systematic difference between these groups.
Our findings are consistent with work describing a lack of structured conceptual frameworks in effectively supervising trainees,7, 8 and also, at times, nebulous expectations for hospitalist faculty. We found that the existence of a formal supervisory policy within the associated residency program, as well as defined roles for hospitalists, increases the likelihood of positive perceptions of the new ACGME supervisory recommendations. However, the existence of these requirements does not mean that all programs are capable of following them. While additional discussion is required to best delineate a formal overnight hospitalist role in trainee supervision, clearly defining expectations for both faculty and trainees, and their interactions, may alleviate the struggles that exist in programs with ill‐defined roles for hospitalist faculty supervision. While faculty duty hours standards do not exist, additional duties of nighttime coverage for hospitalists suggests that close attention should be paid to burn‐out.9 Faculty development on nighttime supervision and teaching may help maximize both learning and patient care efficiency, and provide a framework for this often unstructured educational time.
Acknowledgements
The research reported here was supported by the Department of Veterans Affairs, Veterans Health Administration, Health Services Research and Development Service (REA 05‐129, CDA 07‐022). The views expressed in this article are those of the authors and do not necessarily reflect the position or policy of the Department of Veterans Affairs.
- ,,.New requirements for resident duty hours.JAMA.2002;288:1112–1114.
- ,,,,.Cost implications of reduced work hours and workloads for resident physicians.N Engl J Med.2009;360:2202–2215.
- Why have working hour restrictions apparently not improved patient safety?BMJ.2011;342:d1200.
- Ulmer C, Wolman DM, Johns MME, eds.Resident Duty Hours: Enhancing Sleep, Supervision, and Safety.Washington, DC:National Academies Press;2008.
- ,,;for the ACGME Duty Hour Task Force.The new recommendations on duty hours from the ACGME Task Force.N Engl J Med.2010;363.
- Association of Program Directors in Internal Medicine (APDIM) Survey 2009. Available at: http://www.im.org/toolbox/surveys/SurveyDataand Reports/APDIMSurveyData/Documents/2009_APDIM_summary_web. pdf. Accessed on July 30, 2012.
- ,,,,.Clinical oversight: conceptualizing the relationship between supervision and safety.J Gen Intern Med.2007;22(8):1080–1085.
- ,,, et al.Strategies for effective on‐call supervision for internal medicine residents: the SUPERB/SAFETY model.J Grad Med Educ.2010;2(1):46–52.
- ,,,,,.Career satisfaction and burn‐out in academic hospital medicine.Arch Intern Med.2011;171(8):782–785.
In 2003, the Accreditation Council for Graduate Medical Education (ACGME) announced the first in a series of guidelines related to the regulation and oversight of residency training.1 The initial iteration specifically focused on the total and consecutive numbers of duty hours worked by trainees. These limitations began a new era of shift work in internal medicine residency training. With decreases in housestaff admitting capacity, clinical work has frequently been offloaded to non‐teaching or attending‐only services, increasing the demand for hospitalists to fill the void in physician‐staffed care in the hospital.2, 3 Since the implementation of the 2003 ACGME guidelines and a growing focus on patient safety, there has been increased study of, and call for, oversight of trainees in medicine; among these was the 2008 Institute of Medicine report,4 calling for 24/7 attending‐level supervision. The updated ACGME requirements,5 effective July 1, 2011, mandate enhanced on‐site supervision of trainee physicians. These new regulations not only define varying levels of supervision for trainees, including direct supervision with the physical presence of a supervisor and the degree of availability of said supervisor, they also describe ensuring the quality of supervision provided.5 While continuous attending‐level supervision is not yet mandated, many residency programs look to their academic hospitalists to fill the supervisory void, particularly at night. However, what specific roles hospitalists play in the nighttime supervision of trainees or the impact of this supervision remains unclear. To date, no study has examined a broad sample of hospitalist programs in teaching hospitals and the types of resident oversight they provide. We aimed to describe the current state of academic hospitalists in the clinical supervision of housestaff, specifically during the overnight period, and hospitalist perceptions of how the new ACGME requirements would impact traineehospitalist interactions.
METHODS
The Housestaff Oversight Subcommittee, a working group of the Society of General Internal Medicine (SGIM) Academic Hospitalist Task Force, surveyed a sample of academic hospitalist program leaders to assess the current status of trainee supervision performed by hospitalists. Programs were considered academic if they were located in the primary hospital of a residency that participates in the National Resident Matching Program for Internal Medicine. To obtain a broad geographic spectrum of academic hospitalist programs, all programs, both university and community‐based, in 4 states and 2 metropolitan regions were sampled: Washington, Oregon, Texas, Maryland, and the Philadelphia and Chicago metropolitan areas. Hospitalist program leaders were identified by members of the Taskforce using individual program websites and by querying departmental leadership at eligible teaching hospitals. Respondents were contacted by e‐mail for participation. None of the authors of the manuscript were participants in the survey.
The survey was developed by consensus of the working group after reviewing the salient literature and included additional questions queried to internal medicine program directors.6 The 19‐item SurveyMonkey instrument included questions about hospitalists' role in trainees' education and evaluation. A Likert‐type scale was used to assess perceptions regarding the impact of on‐site hospitalist supervision on trainee autonomy and hospitalist workload (1 = strongly disagree to 5 = strongly agree). Descriptive statistics were performed and, where appropriate, t test and Fisher's exact test were performed to identify associations between program characteristics and perceptions. Stata SE was used (STATA Corp, College Station, TX) for all statistical analysis.
RESULTS
The survey was sent to 47 individuals identified as likely hospitalist program leaders and completed by 41 individuals (87%). However, 7 respondents turned out not to be program leaders and were therefore excluded, resulting in a 72% (34/47) survey response rate.
The programs for which we did not obtain responses were similar to respondent programs, and did not include a larger proportion of community‐based programs or overrepresent a specific geographic region. Twenty‐five (73%) of the 34 hospitalist program leaders were male, with an average age of 44.3 years, and an average of 12 years post‐residency training (range, 530 years). They reported leading groups with an average of 18 full‐time equivalent (FTE) faculty (range, 350 persons).
Relationship of Hospitalist Programs With the Residency Program
The majority (32/34, 94%) of respondents describe their program as having traditional housestaffhospitalist interactions on an attending‐covered housestaff teaching service. Other hospitalists' clinical roles included: attending on uncovered (non‐housestaff services; 29/34, 85%); nighttime coverage (24/34, 70%); attending on consult services with housestaff (24/34, 70%). All respondents reported that hospitalist faculty are expected to participate in housestaff teaching or to fulfill other educational roles within the residency training program. These educational roles include participating in didactics or educational conferences, and serving as advisors. Additionally, the faculty of 30 (88%) programs have a formal evaluative role over the housestaff they supervise on teaching services (eg, members of formal housestaff evaluation committee). Finally, 28 (82%) programs have faculty who play administrative roles in the residency programs, such as involvement in program leadership or recruitment. Although 63% of the corresponding internal medicine residency programs have a formal housestaff supervision policy, only 43% of program leaders stated that their hospitalists receive formal faculty development on how to provide this supervision to resident trainees. Instead, the majority of hospitalist programs were described as having teaching expectations in the absence of a formal policy.
Twenty‐one programs (21/34, 61%) described having an attending hospitalist physician on‐site overnight to provide ongoing patient care or admit new patients. Of those with on‐site attending coverage, a minority of programs (8/21, 38%) reported having a formal defined supervisory role of housestaff trainees for hospitalists during the overnight period. In these 8 programs, this defined role included a requirement for housestaff to present newly admitted patients or contact hospitalists with questions regarding patient management. Twenty‐four percent (5/21) of the programs with nighttime coverage stated that the role of the nocturnal attending was only to cover the non‐teaching services, without housestaff interaction or supervision. The remainder of programs (8/21, 38%) describe only informal interactions between housestaff and hospitalist faculty, without clearly defined expectations for supervision.
Perceptions of New Regulations and Night Work
Hospitalist leaders viewed increased supervision of housestaff both positively and negatively. Leaders were asked their level of agreement with the potential impact of increased hospitalist nighttime supervision. Of respondents, 85% (27/32) agreed that formal overnight supervision by an attending hospitalist would improve patient safety, and 60% (20/33) agreed that formal overnight supervision would improve traineehospitalist relationships. In addition, 60% (20/33) of respondents felt that nighttime supervision of housestaff by faculty hospitalists would improve resident education. However, approximately 40% (13/33) expressed concern that increased on‐site hospitalist supervision would hamper resident decision‐making autonomy, and 75% (25/33) agreed that a formal housestaff supervisory role would increase hospitalist work load. The perception of increased workload was influenced by a hospitalist program's current supervisory role. Hospitalists programs providing formal nighttime supervision for housestaff, compared to those with informal or poorly defined faculty roles, were less likely to perceive these new regulations as resulting in an increase in hospitalist workload (3.72 vs 4.42; P = 0.02). In addition, hospitalist programs with a formal nighttime role were more likely to identify lack of specific parameters for attending‐level contact as a barrier to residents not contacting their supervisors during the overnight period (2.54 vs 3.54; P = 0.03). No differences in perception of the regulations were noted for those hospitalist programs which had existing faculty development on clinical supervision.
DISCUSSION
This study provides important information about how academic hospitalists currently contribute to the supervision of internal medicine residents. While academic hospitalist groups frequently have faculty providing clinical care on‐site at night, and often hospitalists provide overnight supervision of internal medicine trainees, formal supervision of trainees is not uniform, and few hospitalists groups have a mechanism to provide training or faculty development on how to effectively supervise resident trainees. Hospitalist leaders expressed concerns that creating additional formal overnight supervisory responsibilities may add to an already burdened overnight hospitalist. Formalizing this supervisory role, including explicit role definitions and faculty training for trainee supervision, is necessary.
Though our sample size is small, we captured a diverse geographic range of both university and community‐based academic hospitalist programs by surveying group leaders in several distinct regions. We are unable to comment on differences between responding and non‐responding hospitalist programs, but there does not appear to be a systematic difference between these groups.
Our findings are consistent with work describing a lack of structured conceptual frameworks in effectively supervising trainees,7, 8 and also, at times, nebulous expectations for hospitalist faculty. We found that the existence of a formal supervisory policy within the associated residency program, as well as defined roles for hospitalists, increases the likelihood of positive perceptions of the new ACGME supervisory recommendations. However, the existence of these requirements does not mean that all programs are capable of following them. While additional discussion is required to best delineate a formal overnight hospitalist role in trainee supervision, clearly defining expectations for both faculty and trainees, and their interactions, may alleviate the struggles that exist in programs with ill‐defined roles for hospitalist faculty supervision. While faculty duty hours standards do not exist, additional duties of nighttime coverage for hospitalists suggests that close attention should be paid to burn‐out.9 Faculty development on nighttime supervision and teaching may help maximize both learning and patient care efficiency, and provide a framework for this often unstructured educational time.
Acknowledgements
The research reported here was supported by the Department of Veterans Affairs, Veterans Health Administration, Health Services Research and Development Service (REA 05‐129, CDA 07‐022). The views expressed in this article are those of the authors and do not necessarily reflect the position or policy of the Department of Veterans Affairs.
- ,,.New requirements for resident duty hours.JAMA.2002;288:1112–1114.
- ,,,,.Cost implications of reduced work hours and workloads for resident physicians.N Engl J Med.2009;360:2202–2215.
- Why have working hour restrictions apparently not improved patient safety?BMJ.2011;342:d1200.
- Ulmer C, Wolman DM, Johns MME, eds.Resident Duty Hours: Enhancing Sleep, Supervision, and Safety.Washington, DC:National Academies Press;2008.
- ,,;for the ACGME Duty Hour Task Force.The new recommendations on duty hours from the ACGME Task Force.N Engl J Med.2010;363.
- Association of Program Directors in Internal Medicine (APDIM) Survey 2009. Available at: http://www.im.org/toolbox/surveys/SurveyDataand Reports/APDIMSurveyData/Documents/2009_APDIM_summary_web. pdf. Accessed on July 30, 2012.
- ,,,,.Clinical oversight: conceptualizing the relationship between supervision and safety.J Gen Intern Med.2007;22(8):1080–1085.
- ,,, et al.Strategies for effective on‐call supervision for internal medicine residents: the SUPERB/SAFETY model.J Grad Med Educ.2010;2(1):46–52.
- ,,,,,.Career satisfaction and burn‐out in academic hospital medicine.Arch Intern Med.2011;171(8):782–785.