User login
Stat Laboratory Order Feedback
Overuse of inpatient stat laboratory orders (stat is an abbreviation of the Latin word statim, meaning immediately, without delay; alternatively, some consider it an acronym for short turnaround time) is a major problem in the modern healthcare system.[1, 2, 3, 4, 5] Ordering laboratory tests stat is a common way to expedite processing, with expectation of results being reported within 1 hour from the time ordered, according to the College of American Pathologists.[6] However, stat orders are also requested for convenience,[2] to expedite discharge,[7] or to meet expectation of turnaround times.[8, 9, 10] Overuse of stat orders increases cost and may reduce the effectiveness of a system. Reduction of excessive stat order requests helps support safe and efficient patient care[11, 12] and may reduce laboratory costs.[13, 14]
Several studies have examined interventions to optimize stat laboratory utilization.[14, 15] Potentially effective interventions include establishment of stat ordering guidelines, utilization of point‐of‐care testing, and prompt feedback via computerized physician order entry (CPOE) systems.[16, 17, 18] However, limited evidence is available regarding the effectiveness of audit and feedback in reducing stat ordering frequency.
Our institution shared the challenge of a high frequency of stat laboratory test orders. An interdisciplinary working group comprising leadership in the medicine, surgery, informatics, laboratory medicine, and quality and patient safety departments was formed to approach this problem and identify potential interventions. The objectives of this study are to describe the patterns of stat orders at our institution as well as to assess the effectiveness of the targeted individual feedback intervention in reducing utilization of stat laboratory test orders.
METHODS
Design
This study is a retrospective analysis of administrative data for a quality‐improvement project. The study was deemed exempt from review by the Beth Israel Medical Center Institutional Review Board.
Setting
Beth Israel Medical Center is an 856‐bed, urban, tertiary‐care teaching hospital with a capacity of 504 medical and surgical beds. In October 2009, 47.8% of inpatient laboratory tests (excluding the emergency department) were ordered as stat, according to an electronic audit of our institution's CPOE system, GE Centricity Enterprise (GE Medical Systems Information Technologies, Milwaukee, WI). Another audit using the same data query for the period of December 2009 revealed that 50 of 488 providers (attending physicians, nurse practitioners, physician assistants, fellows, and residents) accounted for 51% of total stat laboratory orders, and that Medicine and General Surgery residents accounted for 43 of these 50 providers. These findings prompted us to develop interventions that targeted high utilizers of stat laboratory orders, especially Medicine and General Surgery residents.
Teaching Session
Medicine and General Surgery residents were given a 1‐hour educational session at a teaching conference in January 2010. At this session, residents were instructed that ordering stat laboratory tests was appropriate when the results were needed urgently to make clinical decisions as quickly as possible. This session also explained the potential consequences associated with excessive stat laboratory orders and provided department‐specific data on current stat laboratory utilization.
Individual Feedback
From January to May 2010, a list of stat laboratory orders by provider was generated each month by the laboratory department's database. The top 10 providers who most frequently placed stat orders were identified and given individual feedback by their direct supervisors based on data from the prior month (feedback provided from February to June 2010). Medicine and General Surgery residents were counseled by their residency program directors, and nontrainee providers by their immediate supervising physicians. Feedback and counseling were given via brief individual meetings, phone calls, or e‐mail. Supervisors chose the method that ensured the most timely delivery of feedback. Feedback and counseling consisted of explaining the effort to reduce stat laboratory ordering and the rationale behind this, alerting providers that they were outliers, and encouraging them to change their behavior. No punitive consequences were discussed; the feedback sessions were purely informative in nature. When an individual was ranked again in the top 10 after receiving feedback, he or she received repeated feedback.
Data Collection and Measured Outcomes
We retrospectively collected data on monthly laboratory test orders by providers from September 2009 to June 2010. The data were extracted from the electronic medical record (EMR) system and included any inpatient laboratory orders at the institution. Laboratory orders placed in the emergency department were excluded. Providers were divided into nontrainees (attending physicians, nurse practitioners, and physician assistants) and trainee providers (residents and fellows). Trainee providers were further categorized by educational levels (postgraduate year [PGY]‐1 vs PGY‐2 or higher) and specialty (Medicine vs General Surgery vs other). Fellows in medical and surgical subspecialties were categorized as other.
The primary outcome measure was the proportion of stat orders out of total laboratory orders for individuals. The proportion of stat orders out of total orders was selected to assess individuals' tendency to utilize stat laboratory orders.
Statistical Analysis
In the first analysis, stat and total laboratory orders were aggregated for each provider. Providers who ordered <10 laboratory tests during the study period were excluded. We calculated the proportion of stat out of total laboratory orders for each provider, and compared it by specialty, by educational level, and by feedback status. Median and interquartile range (IQR) were reported due to non‐normal distribution, and the Wilcoxon rank‐sum test was used for comparisons.
In the second analysis, we determined pre‐feedback and post‐feedback periods for providers who received feedback. The feedback month was defined as the month immediately after a provider was ranked in the top 10 for the first time during the intervention period. For each provider, stat orders and total laboratory orders during months before and after the feedback month, excluding the feedback month, were calculated. The change in the proportion of stat laboratory orders out of all orders from pre‐ to post‐feedback was then calculated for each provider for whom both pre‐ and post‐feedback data were available. Because providers may have utilized an unusually high proportion of stat orders during the months in which they were ranked in the top 10 (for example, due to being on rotations in which many orders are placed stat, such as the intensive care units), we conducted a sensitivity analysis excluding those months. Further, for comparison, we conducted the same analysis for providers who did not receive feedback and were ranked 11 to 30 in any month during the intervention period. In those providers, we considered the month immediately after a provider was ranked in the 11 to 30 range for the first time as the hypothetical feedback month. The proportional change in the stat laboratory ordering was analyzed using the paired Student t test.
In the third analysis, we calculated the proportion of stat laboratory orders each month for each provider. Individual provider data were excluded if total laboratory orders for the month were <10. We then calculated the average proportion of stat orders for each specialty and educational level among trainee providers every month, and plotted and compared the trends.
All analyses were performed with JMP software version 9.0 (SAS Institute, Inc., Cary, NC). All statistical tests were 2‐sided, and P < 0.05 was considered significant.
RESULTS
We identified 1045 providers who ordered 1 laboratory test from September 2009 to June 2010. Of those, 716 were nontrainee providers and 329 were trainee providers. Among the trainee providers, 126 were Medicine residents, 33 were General Surgery residents, and 103 were PGY‐1. A total of 772,734 laboratory tests were ordered during the study period, and 349,658 (45.2%) tests were ordered as stat. Of all stat orders, 179,901 (51.5%) were ordered by Medicine residents and 52,225 (14.9%) were ordered by General Surgery residents.
Thirty‐seven providers received individual feedback during the intervention period. This group consisted of 8 nontrainee providers (nurse practitioners and physician assistants), 21 Medicine residents (5 were PGY‐1), and 8 General Surgery residents (all PGY‐1). This group ordered a total of 84,435 stat laboratory tests from September 2009 to June 2010 and was responsible for 24.2% of all stat laboratory test orders at the institution.
Provider Analysis
After exclusion of providers who ordered <10 laboratory tests from September 2009 to June 2010, a total of 807 providers remained. The median proportion of stat orders out of total orders was 40% among all providers and 41.6% for nontrainee providers (N = 500), 38.7% for Medicine residents (N = 125), 80.2% for General Surgery residents (N = 32), and 24.2% for other trainee providers (N = 150). The proportion of stat orders differed significantly by specialty and educational level, but also even among providers in the same specialty at the same educational level. Among PGY‐1 residents, the stat‐ordering proportion ranged from 6.9% to 49.1% for Medicine (N = 54) and 69.0% to 97.1% for General Surgery (N = 16). The proportion of stat orders was significantly higher among providers who received feedback compared with those who did not (median, 72.4% [IQR, 55.0%89.5%] vs 39.0% [IQR, 14.9%65.7%], P < 0.001). When stratified by specialty and educational level, the statistical significance remained in nontrainee providers and trainee providers with higher educational level, but not in PGY‐1 residents (Table 1).
| All Providers | Feedback Given | Feedback Not Given | |||||
|---|---|---|---|---|---|---|---|
| N | Stat % | N | Stat % | N | Stat % | P Valuea | |
| |||||||
| Total | 807 | 40 (15.869.0) | 37 | 72.4 (55.089.5) | 770 | 39.0 (14.965.7) | <0.001 |
| Nontrainee providersb | 500 | 41.6 (13.571.5) | 8 | 91.7 (64.097.5) | 492 | 40.2 (13.270.9) | <0.001 |
| Trainee providersc | 307 | 37.8 (19.162.7) | 29 | 69.3 (44.380.9) | 278 | 35.1 (17.655.6) | <0.001 |
| Medicine | 125 | 38.7 (26.850.4) | 21 | 58.8 (36.872.6) | 104 | 36.1 (25.945.6) | <0.001 |
| PGY‐1 | 54 | 28.1 (23.935.2) | 5 | 32.0 (25.536.8) | 49 | 27.9 (23.534.6) | 0.52 |
| PGY‐2 and higher | 71 | 46.5 (39.160.4) | 16 | 63.9 (54.575.7) | 55 | 45.1 (36.554.9) | <0.001 |
| General surgery | 32 | 80.2 (69.690.1) | 8 | 89.5 (79.392.7) | 24 | 78.7 (67.987.4) | <0.05 |
| PGY‐1 | 16 | 86.4 (79.191.1) | 8 | 89.5 (79.392.7) | 8 | 84.0 (73.289.1) | 0.25 |
| PGY‐2 and higher | 16 | 74.4 (65.485.3) | |||||
| Other | 150 | 24.2 (9.055.0) | |||||
| PGY‐1 | 31 | 28.2 (18.478.3) | |||||
| PGY‐2 or higher | 119 | 20.9 (5.651.3) | |||||
Stat Ordering Pattern Change by Individual Feedback
Among 37 providers who received individual feedback, 8 providers were ranked in the top 10 more than once and received repeated feedback. Twenty‐seven of 37 providers had both pre‐feedback and post‐feedback data and were included in the analysis. Of those, 7 were nontrainee providers, 16 were Medicine residents (5 were PGY‐1), and 4 were General Surgery residents (all PGY‐1). The proportion of stat laboratory orders per provider decreased by 15.7% (95% confidence interval [CI]: 5.6% to 25.9%, P = 0.004) after feedback (Table 2). The decrease remained significant after excluding the months in which providers were ranked in the top 10 (11.4%; 95% CI: 0.7% to 22.1%, P = 0.04).
| Top 10 Providers (Received Feedback) | Providers Ranked in 1130 (No Feedback) | |||||||||
|---|---|---|---|---|---|---|---|---|---|---|
| N | Mean Stat % | Mean Difference (95% CI) | P Value | N | Mean Stat % | Mean Difference (95% CI) | P Value | |||
| Pre | Post | Pre | Post | |||||||
| ||||||||||
| Total | 27 | 71.2 | 55.5 | 15.7 (25.9 to 5.6) | 0.004 | 39 | 64.6 | 60.2 | 4.5 (11.0 to 2.1) | 0.18 |
| Nontrainee providers | 7 | 94.6 | 73.2 | 21.4 (46.9 to 4.1) | 0.09 | 12 | 84.4 | 80.6 | 3.8 (11.9 to 4.3) | 0.32 |
| Trainee providers | 20 | 63.0 | 49.3 | 13.7 (25.6 to 1.9) | 0.03 | 27 | 55.8 | 51.1 | 4.7 (13.9 to 4.4) | 0.30 |
| Medicine | 16 | 55.8 | 45.0 | 10.8 (23.3 to 1.6) | 0.08 | 21 | 46.2 | 41.3 | 4.8 (16.3 to 6.7) | 0.39 |
| General Surgery | 4 | 91.9 | 66.4 | 25.4 (78.9 to 28.0) | 0.23 | 6 | 89.6 | 85.2 | 4.4 (20.5 to 11.6) | 0.51 |
| PGY‐1 | 9 | 58.9 | 47.7 | 11.2 (32.0 to 9.5) | 0.25 | 15 | 55.2 | 49.2 | 6.0 (18.9 to 6.9) | 0.33 |
| PGY‐2 or Higher | 11 | 66.4 | 50.6 | 15.8 (32.7 to 1.1) | 0.06 | 12 | 56.6 | 53.5 | 3.1 (18.3 to 12.1) | 0.66 |
In comparison, a total of 57 providers who did not receive feedback were in the 11 to 30 range during the intervention period. Three Obstetrics and Gynecology residents and 3 Family Medicine residents were excluded from the analysis to match specialty with providers who received feedback. Thirty‐nine of 51 providers had adequate data and were included in the analysis, comprising 12 nontrainee providers, 21 Medicine residents (10 were PGY‐1), and 6 General Surgery residents (5 were PGY‐1). Among them, the proportion of stat laboratory orders per provider did not change significantly, with a 4.5% decrease (95% CI: 2.1% to 11.0%, P = 0.18; Table 2).
Stat Ordering Trends Among Trainee Providers
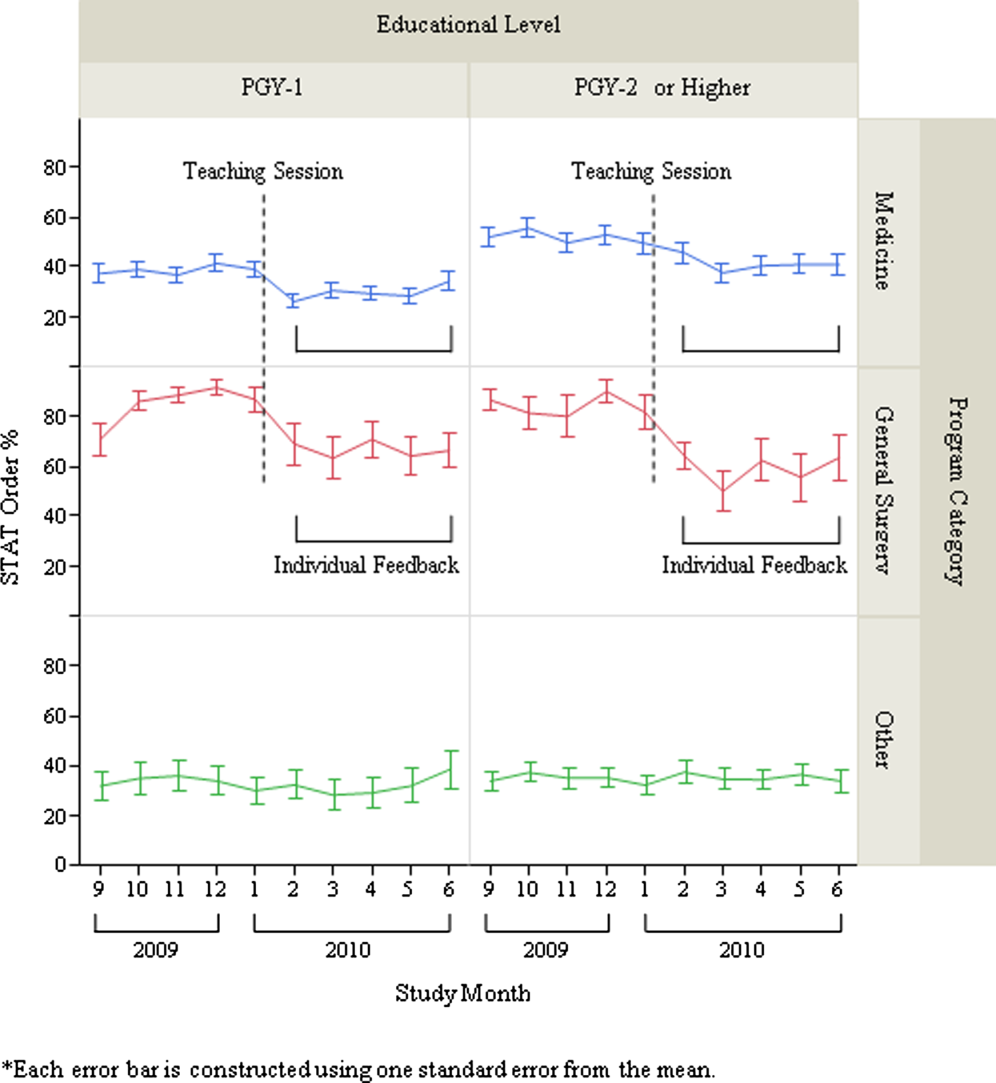
After exclusion of data for the month with <10 total laboratory tests per provider, a total of 303 trainee providers remained, providing 2322 data points for analysis. Of the 303, 125 were Medicine residents (54 were PGY‐1), 32 were General Surgery residents (16 were PGY‐1), and 146 were others (31 were PGY‐1). The monthly trends for the average proportion of stat orders among those providers are shown in Figure 1. The decrease in the proportion of stat orders was observed after January 2010 in Medicine and General Surgery residents both in PGY‐1 and PGY‐2 or higher, but no change was observed in other trainee providers.

DISCUSSION
We describe a series of interventions implemented at our institution to decrease the utilization of stat laboratory orders. Based on an audit of laboratory‐ordering data, we decided to target high utilizers of stat laboratory tests, especially Medicine and General Surgery residents. After presenting an educational session to those residents, we gave individual feedback to the highest utilizers of stat laboratory orders. Providers who received feedback decreased their utilization of stat laboratory orders, but the stat ordering pattern did not change among those who did not receive feedback.
The individual feedback intervention involved key stakeholders for resident and nontrainee provider education (directors of the Medicine and General Surgery residency programs and other direct clinical supervisors). The targeted feedback was delivered via direct supervisors and was provided more than once as needed, which are key factors for effective feedback in modifying behavior in professional practice.[19] Allowing the supervisors to choose the most appropriate form of feedback for each individual (meetings, phone calls, or e‐mail) enabled timely and individually tailored feedback and contributed to successful implementation. We feel intervention had high educational value for residents, as it promoted residents' engagement in proper systems‐based practice, one of the 6 core competencies of the Accreditation Council for Graduate Medical Education (ACGME).
We utilized the EMR to obtain provider‐specific data for feedback and analysis. As previously suggested, the use of the EMR for audit and feedback was effective in providing timely, actionable, and individualized feedback with peer benchmarking.[20, 21] We used the raw number of stat laboratory orders for audit and the proportion of stat orders out of total orders to assess the individual behavioral patterns. Although the proportional use of stat orders is affected by patient acuity and workplace or rotation site, it also seems largely affected by provider's preference or practice patterns, as we saw the variance among providers of the same specialty and educational level. The changes in the stat ordering trends only seen among Medicine and General Surgery residents suggests that our interventions successfully decreased the overall utilization of stat laboratory orders among targeted providers, and it seems less likely that those decreases are due to changes in patient acuity, changes in rotation sites, or learning curve among trainee providers. When averaged over the 10‐month study period, as shown in Table 1, the providers who received feedback ordered a higher proportion of stat tests than those who did not receive feedback, except for PGY‐1 residents. This suggests that although auditing based on the number of stat laboratory orders identified providers who tended to order more stat tests than others, it may not be a reliable indicator for PGY‐1 residents, whose number of laboratory orders highly fluctuates by rotation.
There are certain limitations to our study. First, we assumed that the top utilizers were inappropriately ordering stat laboratory tests. Because there is no clear consensus as to what constitutes appropriate stat testing,[7] it was difficult, if not impossible, to determine which specific orders were inappropriate. However, high variability of the stat ordering pattern in the analysis provides some evidence that high stat utilizers customarily order more stat testing as compared with others. A recent study also revealed that the median stat ordering percentage was 35.9% among 52 US institutions.[13] At our institution, 47.8% of laboratory tests were ordered stat prior to the intervention, higher than the benchmark, providing the rationale for our intervention.
Second, the intervention was conducted in a time‐series fashion and no randomization was employed. The comparison of providers who received feedback with those who did not is subject to selection bias, and the difference in the change in stat ordering pattern between these 2 groups may be partially due to variability of work location, rotation type, or acuity of patients. However, we performed a sensitivity analysis excluding the months when the providers were ranked in the top 10, assuming that they may have ordered an unusually high proportion of stat tests due to high acuity of patients (eg, rotation in the intensive care units) during those months. Robust results in this analysis support our contention that individual feedback was effective. In addition, we cannot completely rule out the possibility that the changes in stat ordering practice may be solely due to natural maturation effects within an academic year among trainee providers, especially PGY‐1 residents. However, relatively acute changes in the stat ordering trends only among targeted provider groups around January 2010, corresponding to the timing of interventions, suggest otherwise.
Third, we were not able to test if the intervention or decrease in stat orders adversely affected patient care. For example, if, after receiving feedback, providers did not order some tests stat that should have been ordered that way, this could have negatively affected patient care. Additionally, we did not evaluate whether reduction in stat laboratory orders improved timeliness of the reporting of stat laboratory results.
Lastly, the sustained effect and feasibility of this intervention were not tested. Past studies suggest educational interventions in laboratory ordering behavior would most likely need to be continued to maintain its effectiveness.[22, 23] Although we acknowledge that sustainability of this type of intervention may be difficult, we feel we have demonstrated that there is still value associated with giving personalized feedback.
This study has implications for future interventions and research. Use of automated, EMR‐based feedback on laboratory ordering performance may be effective in reducing excessive stat ordering and may obviate the need for time‐consuming efforts by supervisors. Development of quality indicators that more accurately assess stat ordering patterns, potentially adjusted for working sites and patient acuity, may be necessary. Studies that measure the impact of decreasing stat laboratory orders on turnaround times and cost may be of value.
CONCLUSION
At our urban, tertiary‐care teaching institution, stat ordering frequency was highly variable among providers. Targeted individual feedback to providers who ordered a large number of stat laboratory tests decreased their stat laboratory order utilization.
- . Turnaround time, part 2: stats too high, yet labs cope. MLO Med Lab Obs. 1993;25(9):33–38.
- . Laboratory turnaround time. Am J Clin Pathol. 1996;105(6):676–688.
- . No more STAT testing. MLO Med Lab Obs. 2005;37(8):22, 24, 26.
- , , . Phlebotomy, stat testing and laboratory organization: an intriguing relationship. Clin Chem Lab Med. 2012;50(12):2065–2068.
- , , , et al. Laboratory request appropriateness in emergency: impact on hospital organization. Clin Chem Lab Med. 2006;44(6):760–764.
- College of American Pathologists.Definitions used in past Q‐PROBES studies (1991–2011). Available at: http://www.cap.org/apps/docs/q_probes/q‐probes_definitions.pdf. Updated September 29, 2011. Accessed July 31, 2013.
- , , . Practice Parameter. STAT testing? A guideline for meeting clinician turnaround time requirements. Am J Clin Pathol. 1996;105(6):671–675.
- , . Intralaboratory performance and laboratorians' expectations for stat turnaround times: a College of American Pathologists Q‐Probes study of four cerebrospinal fluid determinations. Arch Pathol Lab Med. 1991;115(10):977–983.
- , , , . How fast is fast enough for clinical laboratory turnaround time? Measurement of the interval between result entry and inquiries for reports. Am J Clin Pathol. 1997;108(4):400–405.
- , . Strategies of organization and service for the critical‐care laboratory. Clin Chem. 1990;36(8):1557–1561.
- , , , , . Evaluation of stat and routine turnaround times as a component of laboratory quality. Am J Clin Pathol. 1989;91(3):331–335.
- , . Laboratory results: Timeliness as a quality attribute and strategy. Am J Clin Pathol. 2001;116(3):311–315.
- , , , . Utilization of stat test priority in the clinical laboratory: a College of American Pathologists Q‐Probes study of 52 institutions. Arch Pathol Lab Med. 2013;137(2):220–227.
- . Controlling the use of stat testing. Pathologist. 1984;38(8):474–477.
- , , . Optimizing the availability of ‘stat' laboratory tests using Shewhart ‘C' control charts. Ann Clin Biochem. 2002;39(part 2):140–144.
- , , . Evaluating stat testing options in an academic health center: therapeutic turnaround time and staff satisfaction. Clin Chem. 1998;44(8):1597–1603.
- , , . Impact of a physician's order entry (POE) system on physicians' ordering patterns and patient length of stay. Int J Med Inform. 2002;65(3):213–223.
- , . Instrumentation for STAT analyses. Clin Lab Med. 1988;8(4):689–697.
- , , , et al. Audit and feedback: effects on professional practice and healthcare outcomes. Cochrane Database Syst Rev. 2012;6:CD000259.
- , , , , , . The feasibility of automating audit and feedback for ART guideline adherence in Malawi. J Am Med Inform Assoc. 2011;18(6):868–874.
- , , , et al. Effect of an outpatient antimicrobial stewardship intervention on broad‐spectrum antibiotic prescribing by primary care pediatricians: a randomized trial. JAMA. 2013;309(22):2345–2352.
- . An educational program to modify laboratory use by house staff. J Med Educ. 1977;52(7):578–581.
- , , . Ordering of laboratory tests in a teaching hospital: can it be improved? JAMA. 1983;249(22):3076–3080.
Overuse of inpatient stat laboratory orders (stat is an abbreviation of the Latin word statim, meaning immediately, without delay; alternatively, some consider it an acronym for short turnaround time) is a major problem in the modern healthcare system.[1, 2, 3, 4, 5] Ordering laboratory tests stat is a common way to expedite processing, with expectation of results being reported within 1 hour from the time ordered, according to the College of American Pathologists.[6] However, stat orders are also requested for convenience,[2] to expedite discharge,[7] or to meet expectation of turnaround times.[8, 9, 10] Overuse of stat orders increases cost and may reduce the effectiveness of a system. Reduction of excessive stat order requests helps support safe and efficient patient care[11, 12] and may reduce laboratory costs.[13, 14]
Several studies have examined interventions to optimize stat laboratory utilization.[14, 15] Potentially effective interventions include establishment of stat ordering guidelines, utilization of point‐of‐care testing, and prompt feedback via computerized physician order entry (CPOE) systems.[16, 17, 18] However, limited evidence is available regarding the effectiveness of audit and feedback in reducing stat ordering frequency.
Our institution shared the challenge of a high frequency of stat laboratory test orders. An interdisciplinary working group comprising leadership in the medicine, surgery, informatics, laboratory medicine, and quality and patient safety departments was formed to approach this problem and identify potential interventions. The objectives of this study are to describe the patterns of stat orders at our institution as well as to assess the effectiveness of the targeted individual feedback intervention in reducing utilization of stat laboratory test orders.
METHODS
Design
This study is a retrospective analysis of administrative data for a quality‐improvement project. The study was deemed exempt from review by the Beth Israel Medical Center Institutional Review Board.
Setting
Beth Israel Medical Center is an 856‐bed, urban, tertiary‐care teaching hospital with a capacity of 504 medical and surgical beds. In October 2009, 47.8% of inpatient laboratory tests (excluding the emergency department) were ordered as stat, according to an electronic audit of our institution's CPOE system, GE Centricity Enterprise (GE Medical Systems Information Technologies, Milwaukee, WI). Another audit using the same data query for the period of December 2009 revealed that 50 of 488 providers (attending physicians, nurse practitioners, physician assistants, fellows, and residents) accounted for 51% of total stat laboratory orders, and that Medicine and General Surgery residents accounted for 43 of these 50 providers. These findings prompted us to develop interventions that targeted high utilizers of stat laboratory orders, especially Medicine and General Surgery residents.
Teaching Session
Medicine and General Surgery residents were given a 1‐hour educational session at a teaching conference in January 2010. At this session, residents were instructed that ordering stat laboratory tests was appropriate when the results were needed urgently to make clinical decisions as quickly as possible. This session also explained the potential consequences associated with excessive stat laboratory orders and provided department‐specific data on current stat laboratory utilization.
Individual Feedback
From January to May 2010, a list of stat laboratory orders by provider was generated each month by the laboratory department's database. The top 10 providers who most frequently placed stat orders were identified and given individual feedback by their direct supervisors based on data from the prior month (feedback provided from February to June 2010). Medicine and General Surgery residents were counseled by their residency program directors, and nontrainee providers by their immediate supervising physicians. Feedback and counseling were given via brief individual meetings, phone calls, or e‐mail. Supervisors chose the method that ensured the most timely delivery of feedback. Feedback and counseling consisted of explaining the effort to reduce stat laboratory ordering and the rationale behind this, alerting providers that they were outliers, and encouraging them to change their behavior. No punitive consequences were discussed; the feedback sessions were purely informative in nature. When an individual was ranked again in the top 10 after receiving feedback, he or she received repeated feedback.
Data Collection and Measured Outcomes
We retrospectively collected data on monthly laboratory test orders by providers from September 2009 to June 2010. The data were extracted from the electronic medical record (EMR) system and included any inpatient laboratory orders at the institution. Laboratory orders placed in the emergency department were excluded. Providers were divided into nontrainees (attending physicians, nurse practitioners, and physician assistants) and trainee providers (residents and fellows). Trainee providers were further categorized by educational levels (postgraduate year [PGY]‐1 vs PGY‐2 or higher) and specialty (Medicine vs General Surgery vs other). Fellows in medical and surgical subspecialties were categorized as other.
The primary outcome measure was the proportion of stat orders out of total laboratory orders for individuals. The proportion of stat orders out of total orders was selected to assess individuals' tendency to utilize stat laboratory orders.
Statistical Analysis
In the first analysis, stat and total laboratory orders were aggregated for each provider. Providers who ordered <10 laboratory tests during the study period were excluded. We calculated the proportion of stat out of total laboratory orders for each provider, and compared it by specialty, by educational level, and by feedback status. Median and interquartile range (IQR) were reported due to non‐normal distribution, and the Wilcoxon rank‐sum test was used for comparisons.
In the second analysis, we determined pre‐feedback and post‐feedback periods for providers who received feedback. The feedback month was defined as the month immediately after a provider was ranked in the top 10 for the first time during the intervention period. For each provider, stat orders and total laboratory orders during months before and after the feedback month, excluding the feedback month, were calculated. The change in the proportion of stat laboratory orders out of all orders from pre‐ to post‐feedback was then calculated for each provider for whom both pre‐ and post‐feedback data were available. Because providers may have utilized an unusually high proportion of stat orders during the months in which they were ranked in the top 10 (for example, due to being on rotations in which many orders are placed stat, such as the intensive care units), we conducted a sensitivity analysis excluding those months. Further, for comparison, we conducted the same analysis for providers who did not receive feedback and were ranked 11 to 30 in any month during the intervention period. In those providers, we considered the month immediately after a provider was ranked in the 11 to 30 range for the first time as the hypothetical feedback month. The proportional change in the stat laboratory ordering was analyzed using the paired Student t test.
In the third analysis, we calculated the proportion of stat laboratory orders each month for each provider. Individual provider data were excluded if total laboratory orders for the month were <10. We then calculated the average proportion of stat orders for each specialty and educational level among trainee providers every month, and plotted and compared the trends.
All analyses were performed with JMP software version 9.0 (SAS Institute, Inc., Cary, NC). All statistical tests were 2‐sided, and P < 0.05 was considered significant.
RESULTS
We identified 1045 providers who ordered 1 laboratory test from September 2009 to June 2010. Of those, 716 were nontrainee providers and 329 were trainee providers. Among the trainee providers, 126 were Medicine residents, 33 were General Surgery residents, and 103 were PGY‐1. A total of 772,734 laboratory tests were ordered during the study period, and 349,658 (45.2%) tests were ordered as stat. Of all stat orders, 179,901 (51.5%) were ordered by Medicine residents and 52,225 (14.9%) were ordered by General Surgery residents.
Thirty‐seven providers received individual feedback during the intervention period. This group consisted of 8 nontrainee providers (nurse practitioners and physician assistants), 21 Medicine residents (5 were PGY‐1), and 8 General Surgery residents (all PGY‐1). This group ordered a total of 84,435 stat laboratory tests from September 2009 to June 2010 and was responsible for 24.2% of all stat laboratory test orders at the institution.
Provider Analysis
After exclusion of providers who ordered <10 laboratory tests from September 2009 to June 2010, a total of 807 providers remained. The median proportion of stat orders out of total orders was 40% among all providers and 41.6% for nontrainee providers (N = 500), 38.7% for Medicine residents (N = 125), 80.2% for General Surgery residents (N = 32), and 24.2% for other trainee providers (N = 150). The proportion of stat orders differed significantly by specialty and educational level, but also even among providers in the same specialty at the same educational level. Among PGY‐1 residents, the stat‐ordering proportion ranged from 6.9% to 49.1% for Medicine (N = 54) and 69.0% to 97.1% for General Surgery (N = 16). The proportion of stat orders was significantly higher among providers who received feedback compared with those who did not (median, 72.4% [IQR, 55.0%89.5%] vs 39.0% [IQR, 14.9%65.7%], P < 0.001). When stratified by specialty and educational level, the statistical significance remained in nontrainee providers and trainee providers with higher educational level, but not in PGY‐1 residents (Table 1).
| All Providers | Feedback Given | Feedback Not Given | |||||
|---|---|---|---|---|---|---|---|
| N | Stat % | N | Stat % | N | Stat % | P Valuea | |
| |||||||
| Total | 807 | 40 (15.869.0) | 37 | 72.4 (55.089.5) | 770 | 39.0 (14.965.7) | <0.001 |
| Nontrainee providersb | 500 | 41.6 (13.571.5) | 8 | 91.7 (64.097.5) | 492 | 40.2 (13.270.9) | <0.001 |
| Trainee providersc | 307 | 37.8 (19.162.7) | 29 | 69.3 (44.380.9) | 278 | 35.1 (17.655.6) | <0.001 |
| Medicine | 125 | 38.7 (26.850.4) | 21 | 58.8 (36.872.6) | 104 | 36.1 (25.945.6) | <0.001 |
| PGY‐1 | 54 | 28.1 (23.935.2) | 5 | 32.0 (25.536.8) | 49 | 27.9 (23.534.6) | 0.52 |
| PGY‐2 and higher | 71 | 46.5 (39.160.4) | 16 | 63.9 (54.575.7) | 55 | 45.1 (36.554.9) | <0.001 |
| General surgery | 32 | 80.2 (69.690.1) | 8 | 89.5 (79.392.7) | 24 | 78.7 (67.987.4) | <0.05 |
| PGY‐1 | 16 | 86.4 (79.191.1) | 8 | 89.5 (79.392.7) | 8 | 84.0 (73.289.1) | 0.25 |
| PGY‐2 and higher | 16 | 74.4 (65.485.3) | |||||
| Other | 150 | 24.2 (9.055.0) | |||||
| PGY‐1 | 31 | 28.2 (18.478.3) | |||||
| PGY‐2 or higher | 119 | 20.9 (5.651.3) | |||||
Stat Ordering Pattern Change by Individual Feedback
Among 37 providers who received individual feedback, 8 providers were ranked in the top 10 more than once and received repeated feedback. Twenty‐seven of 37 providers had both pre‐feedback and post‐feedback data and were included in the analysis. Of those, 7 were nontrainee providers, 16 were Medicine residents (5 were PGY‐1), and 4 were General Surgery residents (all PGY‐1). The proportion of stat laboratory orders per provider decreased by 15.7% (95% confidence interval [CI]: 5.6% to 25.9%, P = 0.004) after feedback (Table 2). The decrease remained significant after excluding the months in which providers were ranked in the top 10 (11.4%; 95% CI: 0.7% to 22.1%, P = 0.04).
| Top 10 Providers (Received Feedback) | Providers Ranked in 1130 (No Feedback) | |||||||||
|---|---|---|---|---|---|---|---|---|---|---|
| N | Mean Stat % | Mean Difference (95% CI) | P Value | N | Mean Stat % | Mean Difference (95% CI) | P Value | |||
| Pre | Post | Pre | Post | |||||||
| ||||||||||
| Total | 27 | 71.2 | 55.5 | 15.7 (25.9 to 5.6) | 0.004 | 39 | 64.6 | 60.2 | 4.5 (11.0 to 2.1) | 0.18 |
| Nontrainee providers | 7 | 94.6 | 73.2 | 21.4 (46.9 to 4.1) | 0.09 | 12 | 84.4 | 80.6 | 3.8 (11.9 to 4.3) | 0.32 |
| Trainee providers | 20 | 63.0 | 49.3 | 13.7 (25.6 to 1.9) | 0.03 | 27 | 55.8 | 51.1 | 4.7 (13.9 to 4.4) | 0.30 |
| Medicine | 16 | 55.8 | 45.0 | 10.8 (23.3 to 1.6) | 0.08 | 21 | 46.2 | 41.3 | 4.8 (16.3 to 6.7) | 0.39 |
| General Surgery | 4 | 91.9 | 66.4 | 25.4 (78.9 to 28.0) | 0.23 | 6 | 89.6 | 85.2 | 4.4 (20.5 to 11.6) | 0.51 |
| PGY‐1 | 9 | 58.9 | 47.7 | 11.2 (32.0 to 9.5) | 0.25 | 15 | 55.2 | 49.2 | 6.0 (18.9 to 6.9) | 0.33 |
| PGY‐2 or Higher | 11 | 66.4 | 50.6 | 15.8 (32.7 to 1.1) | 0.06 | 12 | 56.6 | 53.5 | 3.1 (18.3 to 12.1) | 0.66 |
In comparison, a total of 57 providers who did not receive feedback were in the 11 to 30 range during the intervention period. Three Obstetrics and Gynecology residents and 3 Family Medicine residents were excluded from the analysis to match specialty with providers who received feedback. Thirty‐nine of 51 providers had adequate data and were included in the analysis, comprising 12 nontrainee providers, 21 Medicine residents (10 were PGY‐1), and 6 General Surgery residents (5 were PGY‐1). Among them, the proportion of stat laboratory orders per provider did not change significantly, with a 4.5% decrease (95% CI: 2.1% to 11.0%, P = 0.18; Table 2).
Stat Ordering Trends Among Trainee Providers
After exclusion of data for the month with <10 total laboratory tests per provider, a total of 303 trainee providers remained, providing 2322 data points for analysis. Of the 303, 125 were Medicine residents (54 were PGY‐1), 32 were General Surgery residents (16 were PGY‐1), and 146 were others (31 were PGY‐1). The monthly trends for the average proportion of stat orders among those providers are shown in Figure 1. The decrease in the proportion of stat orders was observed after January 2010 in Medicine and General Surgery residents both in PGY‐1 and PGY‐2 or higher, but no change was observed in other trainee providers.
DISCUSSION
We describe a series of interventions implemented at our institution to decrease the utilization of stat laboratory orders. Based on an audit of laboratory‐ordering data, we decided to target high utilizers of stat laboratory tests, especially Medicine and General Surgery residents. After presenting an educational session to those residents, we gave individual feedback to the highest utilizers of stat laboratory orders. Providers who received feedback decreased their utilization of stat laboratory orders, but the stat ordering pattern did not change among those who did not receive feedback.
The individual feedback intervention involved key stakeholders for resident and nontrainee provider education (directors of the Medicine and General Surgery residency programs and other direct clinical supervisors). The targeted feedback was delivered via direct supervisors and was provided more than once as needed, which are key factors for effective feedback in modifying behavior in professional practice.[19] Allowing the supervisors to choose the most appropriate form of feedback for each individual (meetings, phone calls, or e‐mail) enabled timely and individually tailored feedback and contributed to successful implementation. We feel intervention had high educational value for residents, as it promoted residents' engagement in proper systems‐based practice, one of the 6 core competencies of the Accreditation Council for Graduate Medical Education (ACGME).
We utilized the EMR to obtain provider‐specific data for feedback and analysis. As previously suggested, the use of the EMR for audit and feedback was effective in providing timely, actionable, and individualized feedback with peer benchmarking.[20, 21] We used the raw number of stat laboratory orders for audit and the proportion of stat orders out of total orders to assess the individual behavioral patterns. Although the proportional use of stat orders is affected by patient acuity and workplace or rotation site, it also seems largely affected by provider's preference or practice patterns, as we saw the variance among providers of the same specialty and educational level. The changes in the stat ordering trends only seen among Medicine and General Surgery residents suggests that our interventions successfully decreased the overall utilization of stat laboratory orders among targeted providers, and it seems less likely that those decreases are due to changes in patient acuity, changes in rotation sites, or learning curve among trainee providers. When averaged over the 10‐month study period, as shown in Table 1, the providers who received feedback ordered a higher proportion of stat tests than those who did not receive feedback, except for PGY‐1 residents. This suggests that although auditing based on the number of stat laboratory orders identified providers who tended to order more stat tests than others, it may not be a reliable indicator for PGY‐1 residents, whose number of laboratory orders highly fluctuates by rotation.
There are certain limitations to our study. First, we assumed that the top utilizers were inappropriately ordering stat laboratory tests. Because there is no clear consensus as to what constitutes appropriate stat testing,[7] it was difficult, if not impossible, to determine which specific orders were inappropriate. However, high variability of the stat ordering pattern in the analysis provides some evidence that high stat utilizers customarily order more stat testing as compared with others. A recent study also revealed that the median stat ordering percentage was 35.9% among 52 US institutions.[13] At our institution, 47.8% of laboratory tests were ordered stat prior to the intervention, higher than the benchmark, providing the rationale for our intervention.
Second, the intervention was conducted in a time‐series fashion and no randomization was employed. The comparison of providers who received feedback with those who did not is subject to selection bias, and the difference in the change in stat ordering pattern between these 2 groups may be partially due to variability of work location, rotation type, or acuity of patients. However, we performed a sensitivity analysis excluding the months when the providers were ranked in the top 10, assuming that they may have ordered an unusually high proportion of stat tests due to high acuity of patients (eg, rotation in the intensive care units) during those months. Robust results in this analysis support our contention that individual feedback was effective. In addition, we cannot completely rule out the possibility that the changes in stat ordering practice may be solely due to natural maturation effects within an academic year among trainee providers, especially PGY‐1 residents. However, relatively acute changes in the stat ordering trends only among targeted provider groups around January 2010, corresponding to the timing of interventions, suggest otherwise.
Third, we were not able to test if the intervention or decrease in stat orders adversely affected patient care. For example, if, after receiving feedback, providers did not order some tests stat that should have been ordered that way, this could have negatively affected patient care. Additionally, we did not evaluate whether reduction in stat laboratory orders improved timeliness of the reporting of stat laboratory results.
Lastly, the sustained effect and feasibility of this intervention were not tested. Past studies suggest educational interventions in laboratory ordering behavior would most likely need to be continued to maintain its effectiveness.[22, 23] Although we acknowledge that sustainability of this type of intervention may be difficult, we feel we have demonstrated that there is still value associated with giving personalized feedback.
This study has implications for future interventions and research. Use of automated, EMR‐based feedback on laboratory ordering performance may be effective in reducing excessive stat ordering and may obviate the need for time‐consuming efforts by supervisors. Development of quality indicators that more accurately assess stat ordering patterns, potentially adjusted for working sites and patient acuity, may be necessary. Studies that measure the impact of decreasing stat laboratory orders on turnaround times and cost may be of value.
CONCLUSION
At our urban, tertiary‐care teaching institution, stat ordering frequency was highly variable among providers. Targeted individual feedback to providers who ordered a large number of stat laboratory tests decreased their stat laboratory order utilization.
- . Turnaround time, part 2: stats too high, yet labs cope. MLO Med Lab Obs. 1993;25(9):33–38.
- . Laboratory turnaround time. Am J Clin Pathol. 1996;105(6):676–688.
- . No more STAT testing. MLO Med Lab Obs. 2005;37(8):22, 24, 26.
- , , . Phlebotomy, stat testing and laboratory organization: an intriguing relationship. Clin Chem Lab Med. 2012;50(12):2065–2068.
- , , , et al. Laboratory request appropriateness in emergency: impact on hospital organization. Clin Chem Lab Med. 2006;44(6):760–764.
- College of American Pathologists.Definitions used in past Q‐PROBES studies (1991–2011). Available at: http://www.cap.org/apps/docs/q_probes/q‐probes_definitions.pdf. Updated September 29, 2011. Accessed July 31, 2013.
- , , . Practice Parameter. STAT testing? A guideline for meeting clinician turnaround time requirements. Am J Clin Pathol. 1996;105(6):671–675.
- , . Intralaboratory performance and laboratorians' expectations for stat turnaround times: a College of American Pathologists Q‐Probes study of four cerebrospinal fluid determinations. Arch Pathol Lab Med. 1991;115(10):977–983.
- , , , . How fast is fast enough for clinical laboratory turnaround time? Measurement of the interval between result entry and inquiries for reports. Am J Clin Pathol. 1997;108(4):400–405.
- , . Strategies of organization and service for the critical‐care laboratory. Clin Chem. 1990;36(8):1557–1561.
- , , , , . Evaluation of stat and routine turnaround times as a component of laboratory quality. Am J Clin Pathol. 1989;91(3):331–335.
- , . Laboratory results: Timeliness as a quality attribute and strategy. Am J Clin Pathol. 2001;116(3):311–315.
- , , , . Utilization of stat test priority in the clinical laboratory: a College of American Pathologists Q‐Probes study of 52 institutions. Arch Pathol Lab Med. 2013;137(2):220–227.
- . Controlling the use of stat testing. Pathologist. 1984;38(8):474–477.
- , , . Optimizing the availability of ‘stat' laboratory tests using Shewhart ‘C' control charts. Ann Clin Biochem. 2002;39(part 2):140–144.
- , , . Evaluating stat testing options in an academic health center: therapeutic turnaround time and staff satisfaction. Clin Chem. 1998;44(8):1597–1603.
- , , . Impact of a physician's order entry (POE) system on physicians' ordering patterns and patient length of stay. Int J Med Inform. 2002;65(3):213–223.
- , . Instrumentation for STAT analyses. Clin Lab Med. 1988;8(4):689–697.
- , , , et al. Audit and feedback: effects on professional practice and healthcare outcomes. Cochrane Database Syst Rev. 2012;6:CD000259.
- , , , , , . The feasibility of automating audit and feedback for ART guideline adherence in Malawi. J Am Med Inform Assoc. 2011;18(6):868–874.
- , , , et al. Effect of an outpatient antimicrobial stewardship intervention on broad‐spectrum antibiotic prescribing by primary care pediatricians: a randomized trial. JAMA. 2013;309(22):2345–2352.
- . An educational program to modify laboratory use by house staff. J Med Educ. 1977;52(7):578–581.
- , , . Ordering of laboratory tests in a teaching hospital: can it be improved? JAMA. 1983;249(22):3076–3080.
© 2013 Society of Hospital Medicine
Outcomes for Inpatient Gainsharing
Hospitals are challenged to improve quality while reducing costs, yet traditional methods of cost containment have had limited success in aligning the goals of hospitals and physicians. Physicians directly control more than 80% of total medical costs.1 The current fee‐for‐service system encourages procedures and the use of hospital resources. Without the proper incentives to gain active participation and collaboration of the medical staff in improving the efficiency of care, the ability to manage medical costs and improve hospital operational and financial performance is hampered. A further challenge is to encourage physicians to improve the quality of care and maintain safe medical practice. While several examples of pay‐for‐performance (P4P) have previously been attempted to increase efficiency, gainsharing offers real opportunities to achieve these outcomes.
Previous reports regarding the results of gainsharing programs describe its use in outpatient settings and its limited ability to reduce costs for inpatient care for surgical implants such as coronary stents2 or orthopedic prostheses.3 The present study represents the largest series to date using a gainsharing model in a comprehensive program of inpatient care at a tertiary care medical center.
Patients and Methods
Beth Israel Medical Center is a 1000‐bed tertiary care university‐affiliated teaching hospital, located in New York City. The hospital serves a large and ethnically diverse community predominantly located in the lower east side of Manhattan and discharged about 50,000 patients per year during the study period of July 2006 through June 2009.
Applied Medical Software, Inc. (AMS, Collingswood, NJ) analyzed hospital data for case mix and severity. To establish best practice norms (BPNs), AMS used inpatient discharge data (UB‐92) to determine costs by APR‐DRG's4 during calendar year 2005, prior to the inception of the program to establish BPNs. Costs were allocated into specific areas listed in Table 1. A minimum of 10 cases was necessary in each DRG. Cost outliers (as defined by the mean cost of the APR DRG plus 3 standard deviations) were excluded. These data were used to establish a baseline for each physician and a BPN, which was set at the top 25th percentile for each specific APR DRG. BPNs were determined after exclusions using the following criteria:
Each eligible physician had to have at least 10 admissions within their specialty;
Each eligible DRG had to have at least 5 qualifying physicians within a medical specialty;
Each eligible APR DRG had to have at least 3 qualifying admissions;
If the above criteria are met, the BPN was set at the mean of the top 25th percentile of physicians (25% of the physicians with the lowest costs).
| |
| Per diem hospital bed cost | Pharmacy |
| Critical care (ICU and CCU) | Laboratory |
| Medical surgical supplies and implants | Cardiopulmonary care |
| Operating room costs | Blood bank |
| Radiology | Intravenous therapy |
Once BPNs were determined, patients were grouped by physician and compared to the BPN for a particular APR DRG. All patients of participating physicians with qualifying APR DRGs were included in the analysis reports summarizing these results, computed quarterly and distributed to each physician. Obstetrical and psychiatric admissions were excluded in the program. APR DRG data for each physician was compared from year to year to determine whether an individual physician demonstrated measurable improvement in performance.
The gainsharing program was implemented in 2006. Physician participation was voluntary. Payments were made to physicians without any risk or penalties from participation. Incentives were based on individual performance. Incentives for nonsurgical admissions were intended to offset the loss of physician income related to more efficient medical management and a reduced hospital length of stay (LOS). Income for surgical admissions was intended to reward physicians for efficient preoperative and postoperative care.
The methodology provides financial incentives for physicians for each hospital discharge in 2 ways:
Improvement in costs per case against their own historical performance;
Cost per case performance compared to BPN.
In the first year of the gainsharing program, two thirds of the total allowable incentive payments were allocated to physicians' improvement, with one third based on a performance metric. Payments for improvement were phased out over the first 3 years of the gainsharing program, with payments focused fully on performance in Year 3. Cases were adjusted for case‐mix and severity of illness (four levels of APR DRG). Physicians were not penalized for any cases in which costs greatly exceeded BPN. A floor was placed at the BPN and no additional financial incentives were paid for surpassing it. Baselines and BPNs were recalculated yearly.
A key aspect of the gainsharing program was the establishment of specific quality parameters (Table 2) that need to be met before any incentive payments were made. A committee regularly reviewed the quality performance data of each physician to determine eligibility for payments. Physicians were considered to be ineligible for incentive compensation until the next measurement period if there was evidence of failure to adequately meet these measures. At least 80% compliance with core measures (minimum 5 discharges in each domain) was expected. Infectious complication rates were to remain not more than 1 standard deviation above National Healthcare Safety Network rates during the same time period. In addition, payments were withheld from physicians if it was found that the standard of care was not met for any morbidity or mortality that was peer reviewed or if there were any significant patient complaints. Readmission rates were expected to remain at or below the baseline established during the previous 12 months by DRG.
| Quality Measure | Goal |
|---|---|
| |
| Readmissions within 7 days for the same or related diagnosis | Decrease, or less than 10% of discharges |
| Documentationquality and timeliness of medical record and related documentation including date, time, and sign all chart entries | No more than 20% of average monthly discharged medical records incomplete for more than 30 days |
| Consultation with social work/discharge planner within 24 hours of admission for appropriate pts | >80% of all appropriate cases |
| Timely switch from intravenous to oral antibiotics in accordance with hospital policy (%) | >80 |
| Unanticipated return to the operating room | Decrease or < 5% |
| Patient complaints | Decrease |
| Patient satisfaction (HCAHPS) | >75% physician domain |
| Ventilator associated pneumonia | Decrease or < 5% |
| Central line associated blood stream infections | Decrease or < 5 per 1000 catheter days. |
| Surgical site infections | Decrease or within 1 standard deviation of NHSN |
| Antibiotic prophylaxis (%) | >80 |
| Inpatient mortality | Decrease or <1% |
| Medication errors | Decrease or <1% |
| Delinquent medical records | <5 charts delinquent more than 30 days |
| Falls with injury | Decrease or <1% |
| AMI: aspirin on arrival and discharge (%) | >80 |
| AMI‐ACEI or ARB for LVSD (%) | >80 |
| Adult smoking cessation counseling (%) | >80 |
| AMI‐ Beta blocker prescribed at arrival and discharge (%) | >80 |
| CHF: discharge instructions (%) | >80 |
| CHF: Left ventricular function assessment (%) | >80 |
| CHF: ACEI or ARB for left ventricular systolic dysfunction (%) | >80 |
| CHF: smoking cessation counseling (%) | >80 |
| Pneumonia: O2 assessment, pneumococcal vaccine, blood culture and sensitivity before first antibiotic, smoking cessation counseling (%) | >80 |
Employed and private practice community physicians were both eligible for the gainsharing program. Physician participation in the program was voluntary. All patients admitted to the Medical Center received notification on admission about the program. The aggregate costs by DRG were calculated quarterly. Savings over the previous yearif anywere calculated. A total of 20% of the savings was used to administer the program and for incentive payments to physicians.
From July 1, 2006 through September 2008, only commercial managed care cases were eligible for this program. As a result of the approval of the gainsharing program as a demonstration project by the Centers for Medicare and Medicaid Services (CMS), Medicare cases were added to the program starting October 1, 2008.
Physician Payment Calculation Methodology
Performance Incentive
The performance incentive was intended to reward demonstrated levels of performance. Accordingly, a physician's share in hospital savings was in proportion to the relationship between their individual performance and the BPN. This computation was the same for both surgical and medical admissions. The following equation illustrates the computation of performance incentives for participating physicians:
This computation was made at the specific severity level for each hospital discharge. Payment for the performance incentive was made only to physicians at or below the 90th percentile of physicians.
Improvement Incentive
The improvement incentive was intended to encourage positive change. No payments were made from the improvement incentive unless an individual physician demonstrated measurable improvement in operational performance for either surgical or medical admissions. However, because physicians who admitted nonsurgical cases experienced reduced income as they help the hospital to improve operational performance, the methodology for calculating the improvement incentive was different for medical as opposed to surgical cases, as shown below.
For Medical DRGs:
For each severity level the following is calculated:
For Surgical DRGs:
Cost savings were calculated quarterly and defined as the cost per case before the gainsharing program began minus the actual case cost by APR DRG. Student's t‐test was used for continuous data and the categorical data trends were analyzed using Mantel‐Haenszel Chi‐Square.
At least every 6 months, all participating physicians received case‐specific and cost‐centered data about their discharges. They also received a careful explanation of opportunities for financial or quality improvement.
Results
Over the 3‐year period, 184 physicians enrolled, representing 54% of those eligible. The remainder of physicians either decided not to enroll or were not eligible due to inadequate number of index DRG cases or excluded diagnoses. Payer mix was 27% Medicare and 48% of the discharges were commercial and managed care. The remaining cases were a combination of Medicaid and self‐pay. A total of 29,535 commercial and managed care discharges were evaluated from participating physicians (58%) and 20,360 similar discharges from non‐participating physicians. This number of admissions accounted for 29% of all hospital discharges during this time period. Surgical admissions accounted for 43% and nonsurgical admissions for 57%. The distribution of patients by service is shown in Table 3. Pulmonary and cardiology diagnoses were the most frequent reasons for medical admissions. General and head and neck surgery were the most frequent surgical admissions. During the time period of the gainsharing program, the medical center saved $25.1 million for costs attributed to these cases. Participating physicians saved $6.9 million more than non‐participating physicians (P = 0.02, Figure 1), but all discharges demonstrated cost savings during the study period. Cost savings (Figure 2) resulted from savings in medical/surgical supplies and implants (35%), daily hospital costs, (28%), intensive care unit costs (16%) and coronary care unit costs (15%), and operating room costs (8%). Reduction in cost from reduced magnetic resonance imaging (MRI) use was not statistically significant. There were minimal increases in costs due to computed tomography (CT) scan use, cardiopulmonary care, laboratory use, pharmacy and blood bank, but none of these reached statistical significance.
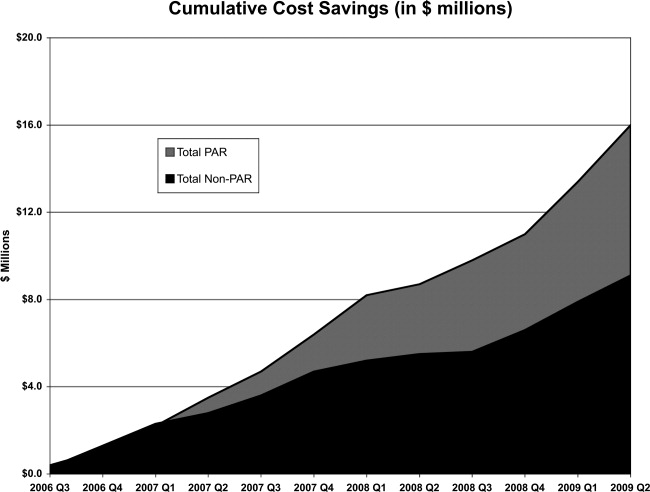
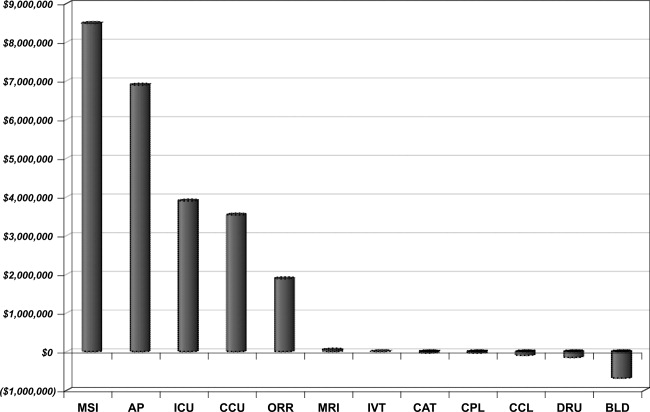
| Admissions by Service | Number (%) |
|---|---|
| |
| Cardiology | 4512 (15.3) |
| Orthopedic surgery | 3994 (13.5) |
| Gastroenterology | 3214 (10.9) |
| General surgery | 2908 (9.8) |
| Cardiovascular surgery | 2432 (8.2) |
| Pulmonary | 2212 (7.5) |
| Neurology | 2064 (7.0) |
| Oncology | 1217 (4.1) |
| Infectious disease | 1171 (4.0) |
| Endocrinology | 906 (3.1) |
| Nephrology | 826 (2.8) |
| Open heart surgery | 656 (2.2) |
| Interventional cardiology | 624 (2.1) |
| Gynecological surgery | 450 (1.5) |
| Urological surgery | 326 (1.1) |
| ENT surgery | 289 (1.0) |
| Obstetrics without delivery | 261 (0.9) |
| Hematology | 253 (0.9) |
| Orthopedicsnonsurgical | 241 (0.8) |
| Rehabilitation | 204 (0.7) |
| Otolaryngology | 183 (0.6) |
| Rheumatology | 165 (0.6) |
| General medicine | 162 (0.5) |
| Neurological surgery | 112 (0.4) |
| Urology | 101 (0.3) |
| Dermatology | 52 (0.2) |
| Grand total | 29535 (100.0) |
Hospital LOS decreased 9.8% from baseline among participating doctors, while LOS decreased 9.0% among non‐participating physicians; this difference was not statistically significant (P = 0.6). Participating physicians reduced costs by an average of $7,871 per quarter, compared to a reduction in costs by $3,018 for admissions by non‐participating physicians (P < 0.0001). The average savings per admission for the participating physicians were $1,835, and for non‐participating physicians were $1,107, a difference of $728 per admission. Overall, cost savings during the three year period averaged $105,000 per physician who participated in the program and $67,000 per physician who did not (P < 0.05). There was not a statistical difference in savings between medical and surgical admissions (P = 0.24).
Deviations from quality thresholds were identified during this time period. Some or all of the gainsharing income was withheld from 8% of participating physicians due to quality issues, incomplete medical records, or administrative reasons. Payouts to participating physicians averaged $1,866 quarterly (range $0‐$27,631). Overall, 9.4% of the hospital savings was directly paid to the participating physicians. Compliance with core measures improved in the following domains from year 2006 to 2009; acute myocardial infarction 94% to 98%, congestive heart failure 76% to 93%, pneumonia 88% to 97%, and surgical care improvement project 90% to 97%, (P = 0.17). There was no measurable increase in 30‐day mortality or readmission by APR‐DRG. The number of incomplete medical records decreased from an average of 43% of the total number of records in the second quarter of 2006 to 30% in the second quarter of 2009 (P < 0.0001). Other quality indicators remained statistically unchanged.
Discussion
The promise of gainsharing may motivate physicians to decrease hospital costs while maintaining quality medical care, since it aligns physician and hospital incentives. Providing a reward to physicians creates positive reinforcement, which is more effective than warnings against poor performing physicians (carrot vs. stick).5, 6 This study is the first and largest of its kind to show the results of a gainsharing program for inpatient medical and surgical admissions and demonstrates that significant cost savings may be achieved. This is similar to previous studies that have shown positive outcomes for pay‐for‐performance programs.7
Participating physicians in the present study accumulated almost $7 million more in savings than non‐participating physicians. Over time this difference has increased, possibly due to a learning curve in educating participating physicians and the way in which information about their performance is given back to them. A significant portion of the hospital's cost savings was through improvements in documentation and completion of medical records. While there was an actual reduction in average length of stay (ALOS), better documentation may also have contributed to adjusting the severity level within each DRG.
Using financial incentives to positively impact on physician behavior is not new. One program in a community‐based hospitalist group reported similar improvements in medical record documentation, as well as improvements in physician meeting attendance and quality goals.8 Another study found that such hospital programs noted improved physician engagement and commitment to best practices and to improving the quality of care.9
There is significant experience in the outpatient setting using pay‐for‐performance programs to enhance quality. Millett et al.10 demonstrated a reduction in smoking among patients with diabetes in a program in the United Kingdom. Another study in Rochester, New York that used pay‐for‐performance incentives demonstrated better diabetes management.11 Mandel and Kotagal12 demonstrated improved asthma care utilizing a quality incentive program.
The use of financial motivation for physicians, as part of a hospital pay‐for‐performance program, has been shown to lead to improvements in quality performance scores when compared to non pay‐for‐performance hospitals.13 Berthiaume demonstrated decreased costs and improvements in risk‐adjusted complications and risk‐adjusted LOS in patents admitted for acute coronary intervention in a pay‐for‐performance program.14 Quality initiatives were integral for the gainsharing program, since measures such as surgical site infections may increase LOS and hospital costs. Core measures related to the care of patients with acute myocardial infarction, heart failure, pneumonia, and surgical prophylaxis steadily improved since the initiation of the gainsharing program. Gainsharing programs also enhance physician compliance with administrative responsibilities such as the completion of medical records.
One unexpected finding of our study was that there was a cost savings per admission even in the patients of physicians who did not participate in the gainsharing program. While the participating physicians showed statistically significant improvements in cost savings, savings were found in both groups. This raises the question as to whether these cost reductions could have been impacted by other factors such as new labor or vendor contracts, better documentation, improved operating room utilization and improved and timely documentation in the medical record. Another possibility is the Hawthorne effect on physicians, who altered their behavior with knowledge that process and outcome measurement were being measured. Physicians who voluntarily sign up for a gainsharing program would be expected to be more committed to the success of this program than physicians who decide to opt out. While this might appear to be a selection bias it does illustrate the point that motivated physicians are more likely to positively change their practice behaviors. However, one might suggest that financial savings directly attributed to the gainsharing program was not the $25.1 million saved during the 3 years overall, but the difference between participating and non‐participating physicians, or $6.9 million.
While the motivation to complete medical records was significant (gainsharing dollars were withheld from doctors with more than 5 incomplete charts for more than 30 days) it was not the only reason why the number of delinquent chart percentage decreased during the study period. While the improvement was significant, there are still more opportunities to reduce the number of incomplete charts. Hospital regulatory inspections and periodic physician education were also likely to have reduced the number of incomplete inpatient charts during this time period and may do so in the future.15
The program focused on the physician activities that have the greatest impact on hospital costs. While optimizing laboratory, blood bank, and pharmacy management decreased hospital costs; we found that improvements in patient LOS, days in an intensive care unit, and management of surgical implants had the greatest impact on costs. Orthopedic surgeons began to use different implants, and all surgeons refrained from opening disposable surgical supplies until needed. Patients in intensive care unit beds stable for transfer were moved to regular medical/surgical rooms earlier. Since the program helped physicians understand the importance of LOS, many physicians increased their rounding on weekends and considered LOS implications before ordering diagnostic procedures that could be performed as an outpatient. Nurses, physician extenders such as physician assistants, and social workers have played an important role in streamlining patient care and hospital discharge; however, they were not directly rewarded under this program.
There are challenges to aligning the incentives of internists compared to procedure‐based specialists. This may be that the result of surgeons receiving payment for bundled care and thus the incentives are already aligned. The incentive of the program for internists, who get paid for each per daily visit, was intended to overcome the lost income resulting from an earlier discharge. Moreover, in the present study, only the discharging physician received incentive payments for each case. Patient care is undoubtedly a team effort and many physicians (radiologists, anesthesiologists, pathologists, emergency medicine physicians, consultant specialty physicians, etc.) are clearly left out in the present gainsharing program. Aligning the incentives of these physicians might be necessary. Furthermore, the actions of other members of the medical team and consultants, by their behaviors, could limit the incentive payments for the discharging physician. The discharging physician is often unable to control the transfer of a patient from a high‐cost or severity unit, or improve the timeliness of consulting physicians. Previous authors have raised the issue as to whether a physician should be prevented from payment because of the actions of another member of the medical team.16
Ensuring a fair and transparent system is important in any pay‐for‐performance program. The present gainsharing program required sophisticated data analysis, which added to the costs of the program. To implement such a program, data must be clear and understandable, segregated by DRG and severity adjusted. But should the highest reward payments go to those who perform the best or improve the most? In the present study, some physicians were consistently unable to meet quality benchmarks. This may be related to several factors, 1 of which might be a particular physician's case mix. Some authors have raised concerns that pay‐for‐performance programs may unfairly impact physicians who care for more challenging or patients from disadvantaged socioeconomic circumstances.17 Other authors have questioned whether widespread implementation of such a program could potentially increase healthcare disparities in the community.18 It has been suggested by Greene and Nash that for a program to be successful, physicians who feel they provide good care yet but are not rewarded should be given an independent review.16 Such a process is important to prevent resentment among physicians who are unable to meet benchmarks for payment, despite hard work.19 Conversely, other studies have found that many physicians who receive payments in a pay‐for‐performance system do not necessarily consciously make improvement to enhance financial performance.20 Only 54% of eligible physicians participated in the present gainsharing program. This is likely due to lack of understanding about the program, misperceptions about the ethics of such programs, perceived possible negative patient outcome, conflict of interest and mistrust.21, 22 This underscores the importance of providing understandable performance results, education, and a physician champion to help facilitate communication and enhanced outcomes. What is clear is that the perception by participating physicians is that this program is worthwhile as the number of participating physicians has steadily increased and it has become an incentive for new providers to choose this medical center over others.
In conclusion, the results of the present study show that physicians can help hospitals reduce inpatients costs while maintaining or improving hospital quality. Improvements in patient LOS, implant costs, overall costs per admission, and medical record completion were noted. Further work is needed to improve physician education and better understand the impact of uneven physician case mix. Further efforts are necessary to allow other members of the health care team to participate and benefit from gainsharing.
- ,,, et al.Guided care and the cost of complex healthcare: a preliminary report.Am J Manag Care.2009;15(8):555–559.
- ,.Hospital‐physician gainsharing in cardiology.Health Aff (Millwood).2008;27(3):803–812.
- ,,,.AOA Symposium. Gainsharing in orthopaedics: passing fancy or wave of the future?J Bone Joint Surg Am.2007;89(9):2075–2083.
- All Patient Defined Diagnosis Related Groups™ ‐ 3M Health Information Systems,St Paul, MN.
- ,,, et al.Guided care and the cost of complex healthcare: a preliminary report.Am J Manag Care.2009;15(8):555–559.
- .Best practices in record completion.J Med Pract Manage.2004;20(1):18–22.
- ,,, et al.Return on investment in pay for performance: a diabetes case study.J Healthc Manag.2006;51(6):365–374; discussion 375‐376.
- .Use of pay for performance in a community hospital private hospitalists group: a preliminary report.Trans Am Clin Climatol Assoc.2007;188:263–272.
- .Making the grade with pay for performance: 7 lessons from best‐performing hospitals.Healthc Financ Manage.2006;60(12):79–85.
- ,,,,.Impact of a pay‐for‐performance incentive on support for smoking cessation and on smoking prevalence among people with diabetes.CMAJ.2007;176(12):1705–1710.
- ,,, et al,Effects of paying physicians based on their relative performance for quality.J Gen Intern Med.2007;22(6):872–876.
- ,.Pay for performance alone cannot drive quality.Arch Pediatr Adolesc Med.2007;161(7):650–655.
- .What's the return? Assessing the effect of “pay‐for‐performance” initiatives on the quality of care delivery.Med Care Res Rev.2006;63(1 suppl)( ):29S–48S.
- ,,,,.Aligning financial incentives with “Get With the Guidelines” to improve cardiovascular care.Am J Manag Care.2004;10(7 pt 2):501–504.
- .Sampling best practices. Managing delinquent records.J AHIMA.1997;68(8):28,30.
- ,.Pay for performance: an overview of the literature.Am J Med Qual.2009;24;140–163.
- ,,.Physician‐level P4P:DOA? Can quality‐based payments be resuscitated?Am J Manag Care.2007;13(5):233–236.
- ,,, et al.Will pay for performance and quality reporting affect health care disparities?Health Aff (Millwood).2007;26(3):w405–w414.
- ,,.The experience of pay for performance in English family practice: a qualitative study.Ann Fam Med.2008;8(3):228–234.
- ,,, et al.Will financial incentives stimulate quality improvement? Reactions from frontline physicians.Am J Med Qual.2006;21(6):367–374.
- ,,.Pay for performance in orthopedic surgery.Clin Orthop Relat Res.2007;457:87–95.
- ,.Pay for performance survey of diagnostic radiology faculty and trainees.J Am Coll Radiol.2007;4(6):411–415.
Hospitals are challenged to improve quality while reducing costs, yet traditional methods of cost containment have had limited success in aligning the goals of hospitals and physicians. Physicians directly control more than 80% of total medical costs.1 The current fee‐for‐service system encourages procedures and the use of hospital resources. Without the proper incentives to gain active participation and collaboration of the medical staff in improving the efficiency of care, the ability to manage medical costs and improve hospital operational and financial performance is hampered. A further challenge is to encourage physicians to improve the quality of care and maintain safe medical practice. While several examples of pay‐for‐performance (P4P) have previously been attempted to increase efficiency, gainsharing offers real opportunities to achieve these outcomes.
Previous reports regarding the results of gainsharing programs describe its use in outpatient settings and its limited ability to reduce costs for inpatient care for surgical implants such as coronary stents2 or orthopedic prostheses.3 The present study represents the largest series to date using a gainsharing model in a comprehensive program of inpatient care at a tertiary care medical center.
Patients and Methods
Beth Israel Medical Center is a 1000‐bed tertiary care university‐affiliated teaching hospital, located in New York City. The hospital serves a large and ethnically diverse community predominantly located in the lower east side of Manhattan and discharged about 50,000 patients per year during the study period of July 2006 through June 2009.
Applied Medical Software, Inc. (AMS, Collingswood, NJ) analyzed hospital data for case mix and severity. To establish best practice norms (BPNs), AMS used inpatient discharge data (UB‐92) to determine costs by APR‐DRG's4 during calendar year 2005, prior to the inception of the program to establish BPNs. Costs were allocated into specific areas listed in Table 1. A minimum of 10 cases was necessary in each DRG. Cost outliers (as defined by the mean cost of the APR DRG plus 3 standard deviations) were excluded. These data were used to establish a baseline for each physician and a BPN, which was set at the top 25th percentile for each specific APR DRG. BPNs were determined after exclusions using the following criteria:
Each eligible physician had to have at least 10 admissions within their specialty;
Each eligible DRG had to have at least 5 qualifying physicians within a medical specialty;
Each eligible APR DRG had to have at least 3 qualifying admissions;
If the above criteria are met, the BPN was set at the mean of the top 25th percentile of physicians (25% of the physicians with the lowest costs).
| |
| Per diem hospital bed cost | Pharmacy |
| Critical care (ICU and CCU) | Laboratory |
| Medical surgical supplies and implants | Cardiopulmonary care |
| Operating room costs | Blood bank |
| Radiology | Intravenous therapy |
Once BPNs were determined, patients were grouped by physician and compared to the BPN for a particular APR DRG. All patients of participating physicians with qualifying APR DRGs were included in the analysis reports summarizing these results, computed quarterly and distributed to each physician. Obstetrical and psychiatric admissions were excluded in the program. APR DRG data for each physician was compared from year to year to determine whether an individual physician demonstrated measurable improvement in performance.
The gainsharing program was implemented in 2006. Physician participation was voluntary. Payments were made to physicians without any risk or penalties from participation. Incentives were based on individual performance. Incentives for nonsurgical admissions were intended to offset the loss of physician income related to more efficient medical management and a reduced hospital length of stay (LOS). Income for surgical admissions was intended to reward physicians for efficient preoperative and postoperative care.
The methodology provides financial incentives for physicians for each hospital discharge in 2 ways:
Improvement in costs per case against their own historical performance;
Cost per case performance compared to BPN.
In the first year of the gainsharing program, two thirds of the total allowable incentive payments were allocated to physicians' improvement, with one third based on a performance metric. Payments for improvement were phased out over the first 3 years of the gainsharing program, with payments focused fully on performance in Year 3. Cases were adjusted for case‐mix and severity of illness (four levels of APR DRG). Physicians were not penalized for any cases in which costs greatly exceeded BPN. A floor was placed at the BPN and no additional financial incentives were paid for surpassing it. Baselines and BPNs were recalculated yearly.
A key aspect of the gainsharing program was the establishment of specific quality parameters (Table 2) that need to be met before any incentive payments were made. A committee regularly reviewed the quality performance data of each physician to determine eligibility for payments. Physicians were considered to be ineligible for incentive compensation until the next measurement period if there was evidence of failure to adequately meet these measures. At least 80% compliance with core measures (minimum 5 discharges in each domain) was expected. Infectious complication rates were to remain not more than 1 standard deviation above National Healthcare Safety Network rates during the same time period. In addition, payments were withheld from physicians if it was found that the standard of care was not met for any morbidity or mortality that was peer reviewed or if there were any significant patient complaints. Readmission rates were expected to remain at or below the baseline established during the previous 12 months by DRG.
| Quality Measure | Goal |
|---|---|
| |
| Readmissions within 7 days for the same or related diagnosis | Decrease, or less than 10% of discharges |
| Documentationquality and timeliness of medical record and related documentation including date, time, and sign all chart entries | No more than 20% of average monthly discharged medical records incomplete for more than 30 days |
| Consultation with social work/discharge planner within 24 hours of admission for appropriate pts | >80% of all appropriate cases |
| Timely switch from intravenous to oral antibiotics in accordance with hospital policy (%) | >80 |
| Unanticipated return to the operating room | Decrease or < 5% |
| Patient complaints | Decrease |
| Patient satisfaction (HCAHPS) | >75% physician domain |
| Ventilator associated pneumonia | Decrease or < 5% |
| Central line associated blood stream infections | Decrease or < 5 per 1000 catheter days. |
| Surgical site infections | Decrease or within 1 standard deviation of NHSN |
| Antibiotic prophylaxis (%) | >80 |
| Inpatient mortality | Decrease or <1% |
| Medication errors | Decrease or <1% |
| Delinquent medical records | <5 charts delinquent more than 30 days |
| Falls with injury | Decrease or <1% |
| AMI: aspirin on arrival and discharge (%) | >80 |
| AMI‐ACEI or ARB for LVSD (%) | >80 |
| Adult smoking cessation counseling (%) | >80 |
| AMI‐ Beta blocker prescribed at arrival and discharge (%) | >80 |
| CHF: discharge instructions (%) | >80 |
| CHF: Left ventricular function assessment (%) | >80 |
| CHF: ACEI or ARB for left ventricular systolic dysfunction (%) | >80 |
| CHF: smoking cessation counseling (%) | >80 |
| Pneumonia: O2 assessment, pneumococcal vaccine, blood culture and sensitivity before first antibiotic, smoking cessation counseling (%) | >80 |
Employed and private practice community physicians were both eligible for the gainsharing program. Physician participation in the program was voluntary. All patients admitted to the Medical Center received notification on admission about the program. The aggregate costs by DRG were calculated quarterly. Savings over the previous yearif anywere calculated. A total of 20% of the savings was used to administer the program and for incentive payments to physicians.
From July 1, 2006 through September 2008, only commercial managed care cases were eligible for this program. As a result of the approval of the gainsharing program as a demonstration project by the Centers for Medicare and Medicaid Services (CMS), Medicare cases were added to the program starting October 1, 2008.
Physician Payment Calculation Methodology
Performance Incentive
The performance incentive was intended to reward demonstrated levels of performance. Accordingly, a physician's share in hospital savings was in proportion to the relationship between their individual performance and the BPN. This computation was the same for both surgical and medical admissions. The following equation illustrates the computation of performance incentives for participating physicians:
This computation was made at the specific severity level for each hospital discharge. Payment for the performance incentive was made only to physicians at or below the 90th percentile of physicians.
Improvement Incentive
The improvement incentive was intended to encourage positive change. No payments were made from the improvement incentive unless an individual physician demonstrated measurable improvement in operational performance for either surgical or medical admissions. However, because physicians who admitted nonsurgical cases experienced reduced income as they help the hospital to improve operational performance, the methodology for calculating the improvement incentive was different for medical as opposed to surgical cases, as shown below.
For Medical DRGs:
For each severity level the following is calculated:
For Surgical DRGs:
Cost savings were calculated quarterly and defined as the cost per case before the gainsharing program began minus the actual case cost by APR DRG. Student's t‐test was used for continuous data and the categorical data trends were analyzed using Mantel‐Haenszel Chi‐Square.
At least every 6 months, all participating physicians received case‐specific and cost‐centered data about their discharges. They also received a careful explanation of opportunities for financial or quality improvement.
Results
Over the 3‐year period, 184 physicians enrolled, representing 54% of those eligible. The remainder of physicians either decided not to enroll or were not eligible due to inadequate number of index DRG cases or excluded diagnoses. Payer mix was 27% Medicare and 48% of the discharges were commercial and managed care. The remaining cases were a combination of Medicaid and self‐pay. A total of 29,535 commercial and managed care discharges were evaluated from participating physicians (58%) and 20,360 similar discharges from non‐participating physicians. This number of admissions accounted for 29% of all hospital discharges during this time period. Surgical admissions accounted for 43% and nonsurgical admissions for 57%. The distribution of patients by service is shown in Table 3. Pulmonary and cardiology diagnoses were the most frequent reasons for medical admissions. General and head and neck surgery were the most frequent surgical admissions. During the time period of the gainsharing program, the medical center saved $25.1 million for costs attributed to these cases. Participating physicians saved $6.9 million more than non‐participating physicians (P = 0.02, Figure 1), but all discharges demonstrated cost savings during the study period. Cost savings (Figure 2) resulted from savings in medical/surgical supplies and implants (35%), daily hospital costs, (28%), intensive care unit costs (16%) and coronary care unit costs (15%), and operating room costs (8%). Reduction in cost from reduced magnetic resonance imaging (MRI) use was not statistically significant. There were minimal increases in costs due to computed tomography (CT) scan use, cardiopulmonary care, laboratory use, pharmacy and blood bank, but none of these reached statistical significance.
| Admissions by Service | Number (%) |
|---|---|
| |
| Cardiology | 4512 (15.3) |
| Orthopedic surgery | 3994 (13.5) |
| Gastroenterology | 3214 (10.9) |
| General surgery | 2908 (9.8) |
| Cardiovascular surgery | 2432 (8.2) |
| Pulmonary | 2212 (7.5) |
| Neurology | 2064 (7.0) |
| Oncology | 1217 (4.1) |
| Infectious disease | 1171 (4.0) |
| Endocrinology | 906 (3.1) |
| Nephrology | 826 (2.8) |
| Open heart surgery | 656 (2.2) |
| Interventional cardiology | 624 (2.1) |
| Gynecological surgery | 450 (1.5) |
| Urological surgery | 326 (1.1) |
| ENT surgery | 289 (1.0) |
| Obstetrics without delivery | 261 (0.9) |
| Hematology | 253 (0.9) |
| Orthopedicsnonsurgical | 241 (0.8) |
| Rehabilitation | 204 (0.7) |
| Otolaryngology | 183 (0.6) |
| Rheumatology | 165 (0.6) |
| General medicine | 162 (0.5) |
| Neurological surgery | 112 (0.4) |
| Urology | 101 (0.3) |
| Dermatology | 52 (0.2) |
| Grand total | 29535 (100.0) |
Hospital LOS decreased 9.8% from baseline among participating doctors, while LOS decreased 9.0% among non‐participating physicians; this difference was not statistically significant (P = 0.6). Participating physicians reduced costs by an average of $7,871 per quarter, compared to a reduction in costs by $3,018 for admissions by non‐participating physicians (P < 0.0001). The average savings per admission for the participating physicians were $1,835, and for non‐participating physicians were $1,107, a difference of $728 per admission. Overall, cost savings during the three year period averaged $105,000 per physician who participated in the program and $67,000 per physician who did not (P < 0.05). There was not a statistical difference in savings between medical and surgical admissions (P = 0.24).
Deviations from quality thresholds were identified during this time period. Some or all of the gainsharing income was withheld from 8% of participating physicians due to quality issues, incomplete medical records, or administrative reasons. Payouts to participating physicians averaged $1,866 quarterly (range $0‐$27,631). Overall, 9.4% of the hospital savings was directly paid to the participating physicians. Compliance with core measures improved in the following domains from year 2006 to 2009; acute myocardial infarction 94% to 98%, congestive heart failure 76% to 93%, pneumonia 88% to 97%, and surgical care improvement project 90% to 97%, (P = 0.17). There was no measurable increase in 30‐day mortality or readmission by APR‐DRG. The number of incomplete medical records decreased from an average of 43% of the total number of records in the second quarter of 2006 to 30% in the second quarter of 2009 (P < 0.0001). Other quality indicators remained statistically unchanged.
Discussion
The promise of gainsharing may motivate physicians to decrease hospital costs while maintaining quality medical care, since it aligns physician and hospital incentives. Providing a reward to physicians creates positive reinforcement, which is more effective than warnings against poor performing physicians (carrot vs. stick).5, 6 This study is the first and largest of its kind to show the results of a gainsharing program for inpatient medical and surgical admissions and demonstrates that significant cost savings may be achieved. This is similar to previous studies that have shown positive outcomes for pay‐for‐performance programs.7
Participating physicians in the present study accumulated almost $7 million more in savings than non‐participating physicians. Over time this difference has increased, possibly due to a learning curve in educating participating physicians and the way in which information about their performance is given back to them. A significant portion of the hospital's cost savings was through improvements in documentation and completion of medical records. While there was an actual reduction in average length of stay (ALOS), better documentation may also have contributed to adjusting the severity level within each DRG.
Using financial incentives to positively impact on physician behavior is not new. One program in a community‐based hospitalist group reported similar improvements in medical record documentation, as well as improvements in physician meeting attendance and quality goals.8 Another study found that such hospital programs noted improved physician engagement and commitment to best practices and to improving the quality of care.9
There is significant experience in the outpatient setting using pay‐for‐performance programs to enhance quality. Millett et al.10 demonstrated a reduction in smoking among patients with diabetes in a program in the United Kingdom. Another study in Rochester, New York that used pay‐for‐performance incentives demonstrated better diabetes management.11 Mandel and Kotagal12 demonstrated improved asthma care utilizing a quality incentive program.
The use of financial motivation for physicians, as part of a hospital pay‐for‐performance program, has been shown to lead to improvements in quality performance scores when compared to non pay‐for‐performance hospitals.13 Berthiaume demonstrated decreased costs and improvements in risk‐adjusted complications and risk‐adjusted LOS in patents admitted for acute coronary intervention in a pay‐for‐performance program.14 Quality initiatives were integral for the gainsharing program, since measures such as surgical site infections may increase LOS and hospital costs. Core measures related to the care of patients with acute myocardial infarction, heart failure, pneumonia, and surgical prophylaxis steadily improved since the initiation of the gainsharing program. Gainsharing programs also enhance physician compliance with administrative responsibilities such as the completion of medical records.
One unexpected finding of our study was that there was a cost savings per admission even in the patients of physicians who did not participate in the gainsharing program. While the participating physicians showed statistically significant improvements in cost savings, savings were found in both groups. This raises the question as to whether these cost reductions could have been impacted by other factors such as new labor or vendor contracts, better documentation, improved operating room utilization and improved and timely documentation in the medical record. Another possibility is the Hawthorne effect on physicians, who altered their behavior with knowledge that process and outcome measurement were being measured. Physicians who voluntarily sign up for a gainsharing program would be expected to be more committed to the success of this program than physicians who decide to opt out. While this might appear to be a selection bias it does illustrate the point that motivated physicians are more likely to positively change their practice behaviors. However, one might suggest that financial savings directly attributed to the gainsharing program was not the $25.1 million saved during the 3 years overall, but the difference between participating and non‐participating physicians, or $6.9 million.
While the motivation to complete medical records was significant (gainsharing dollars were withheld from doctors with more than 5 incomplete charts for more than 30 days) it was not the only reason why the number of delinquent chart percentage decreased during the study period. While the improvement was significant, there are still more opportunities to reduce the number of incomplete charts. Hospital regulatory inspections and periodic physician education were also likely to have reduced the number of incomplete inpatient charts during this time period and may do so in the future.15
The program focused on the physician activities that have the greatest impact on hospital costs. While optimizing laboratory, blood bank, and pharmacy management decreased hospital costs; we found that improvements in patient LOS, days in an intensive care unit, and management of surgical implants had the greatest impact on costs. Orthopedic surgeons began to use different implants, and all surgeons refrained from opening disposable surgical supplies until needed. Patients in intensive care unit beds stable for transfer were moved to regular medical/surgical rooms earlier. Since the program helped physicians understand the importance of LOS, many physicians increased their rounding on weekends and considered LOS implications before ordering diagnostic procedures that could be performed as an outpatient. Nurses, physician extenders such as physician assistants, and social workers have played an important role in streamlining patient care and hospital discharge; however, they were not directly rewarded under this program.
There are challenges to aligning the incentives of internists compared to procedure‐based specialists. This may be that the result of surgeons receiving payment for bundled care and thus the incentives are already aligned. The incentive of the program for internists, who get paid for each per daily visit, was intended to overcome the lost income resulting from an earlier discharge. Moreover, in the present study, only the discharging physician received incentive payments for each case. Patient care is undoubtedly a team effort and many physicians (radiologists, anesthesiologists, pathologists, emergency medicine physicians, consultant specialty physicians, etc.) are clearly left out in the present gainsharing program. Aligning the incentives of these physicians might be necessary. Furthermore, the actions of other members of the medical team and consultants, by their behaviors, could limit the incentive payments for the discharging physician. The discharging physician is often unable to control the transfer of a patient from a high‐cost or severity unit, or improve the timeliness of consulting physicians. Previous authors have raised the issue as to whether a physician should be prevented from payment because of the actions of another member of the medical team.16
Ensuring a fair and transparent system is important in any pay‐for‐performance program. The present gainsharing program required sophisticated data analysis, which added to the costs of the program. To implement such a program, data must be clear and understandable, segregated by DRG and severity adjusted. But should the highest reward payments go to those who perform the best or improve the most? In the present study, some physicians were consistently unable to meet quality benchmarks. This may be related to several factors, 1 of which might be a particular physician's case mix. Some authors have raised concerns that pay‐for‐performance programs may unfairly impact physicians who care for more challenging or patients from disadvantaged socioeconomic circumstances.17 Other authors have questioned whether widespread implementation of such a program could potentially increase healthcare disparities in the community.18 It has been suggested by Greene and Nash that for a program to be successful, physicians who feel they provide good care yet but are not rewarded should be given an independent review.16 Such a process is important to prevent resentment among physicians who are unable to meet benchmarks for payment, despite hard work.19 Conversely, other studies have found that many physicians who receive payments in a pay‐for‐performance system do not necessarily consciously make improvement to enhance financial performance.20 Only 54% of eligible physicians participated in the present gainsharing program. This is likely due to lack of understanding about the program, misperceptions about the ethics of such programs, perceived possible negative patient outcome, conflict of interest and mistrust.21, 22 This underscores the importance of providing understandable performance results, education, and a physician champion to help facilitate communication and enhanced outcomes. What is clear is that the perception by participating physicians is that this program is worthwhile as the number of participating physicians has steadily increased and it has become an incentive for new providers to choose this medical center over others.
In conclusion, the results of the present study show that physicians can help hospitals reduce inpatients costs while maintaining or improving hospital quality. Improvements in patient LOS, implant costs, overall costs per admission, and medical record completion were noted. Further work is needed to improve physician education and better understand the impact of uneven physician case mix. Further efforts are necessary to allow other members of the health care team to participate and benefit from gainsharing.
- ,,, et al.Guided care and the cost of complex healthcare: a preliminary report.Am J Manag Care.2009;15(8):555–559.
- ,.Hospital‐physician gainsharing in cardiology.Health Aff (Millwood).2008;27(3):803–812.
- ,,,.AOA Symposium. Gainsharing in orthopaedics: passing fancy or wave of the future?J Bone Joint Surg Am.2007;89(9):2075–2083.
- All Patient Defined Diagnosis Related Groups™ ‐ 3M Health Information Systems,St Paul, MN.
- ,,, et al.Guided care and the cost of complex healthcare: a preliminary report.Am J Manag Care.2009;15(8):555–559.
- .Best practices in record completion.J Med Pract Manage.2004;20(1):18–22.
- ,,, et al.Return on investment in pay for performance: a diabetes case study.J Healthc Manag.2006;51(6):365–374; discussion 375‐376.
- .Use of pay for performance in a community hospital private hospitalists group: a preliminary report.Trans Am Clin Climatol Assoc.2007;188:263–272.
- .Making the grade with pay for performance: 7 lessons from best‐performing hospitals.Healthc Financ Manage.2006;60(12):79–85.
- ,,,,.Impact of a pay‐for‐performance incentive on support for smoking cessation and on smoking prevalence among people with diabetes.CMAJ.2007;176(12):1705–1710.
- ,,, et al,Effects of paying physicians based on their relative performance for quality.J Gen Intern Med.2007;22(6):872–876.
- ,.Pay for performance alone cannot drive quality.Arch Pediatr Adolesc Med.2007;161(7):650–655.
- .What's the return? Assessing the effect of “pay‐for‐performance” initiatives on the quality of care delivery.Med Care Res Rev.2006;63(1 suppl)( ):29S–48S.
- ,,,,.Aligning financial incentives with “Get With the Guidelines” to improve cardiovascular care.Am J Manag Care.2004;10(7 pt 2):501–504.
- .Sampling best practices. Managing delinquent records.J AHIMA.1997;68(8):28,30.
- ,.Pay for performance: an overview of the literature.Am J Med Qual.2009;24;140–163.
- ,,.Physician‐level P4P:DOA? Can quality‐based payments be resuscitated?Am J Manag Care.2007;13(5):233–236.
- ,,, et al.Will pay for performance and quality reporting affect health care disparities?Health Aff (Millwood).2007;26(3):w405–w414.
- ,,.The experience of pay for performance in English family practice: a qualitative study.Ann Fam Med.2008;8(3):228–234.
- ,,, et al.Will financial incentives stimulate quality improvement? Reactions from frontline physicians.Am J Med Qual.2006;21(6):367–374.
- ,,.Pay for performance in orthopedic surgery.Clin Orthop Relat Res.2007;457:87–95.
- ,.Pay for performance survey of diagnostic radiology faculty and trainees.J Am Coll Radiol.2007;4(6):411–415.
- ,,, et al.Guided care and the cost of complex healthcare: a preliminary report.Am J Manag Care.2009;15(8):555–559.
- ,.Hospital‐physician gainsharing in cardiology.Health Aff (Millwood).2008;27(3):803–812.
- ,,,.AOA Symposium. Gainsharing in orthopaedics: passing fancy or wave of the future?J Bone Joint Surg Am.2007;89(9):2075–2083.
- All Patient Defined Diagnosis Related Groups™ ‐ 3M Health Information Systems,St Paul, MN.
- ,,, et al.Guided care and the cost of complex healthcare: a preliminary report.Am J Manag Care.2009;15(8):555–559.
- .Best practices in record completion.J Med Pract Manage.2004;20(1):18–22.
- ,,, et al.Return on investment in pay for performance: a diabetes case study.J Healthc Manag.2006;51(6):365–374; discussion 375‐376.
- .Use of pay for performance in a community hospital private hospitalists group: a preliminary report.Trans Am Clin Climatol Assoc.2007;188:263–272.
- .Making the grade with pay for performance: 7 lessons from best‐performing hospitals.Healthc Financ Manage.2006;60(12):79–85.
- ,,,,.Impact of a pay‐for‐performance incentive on support for smoking cessation and on smoking prevalence among people with diabetes.CMAJ.2007;176(12):1705–1710.
- ,,, et al,Effects of paying physicians based on their relative performance for quality.J Gen Intern Med.2007;22(6):872–876.
- ,.Pay for performance alone cannot drive quality.Arch Pediatr Adolesc Med.2007;161(7):650–655.
- .What's the return? Assessing the effect of “pay‐for‐performance” initiatives on the quality of care delivery.Med Care Res Rev.2006;63(1 suppl)( ):29S–48S.
- ,,,,.Aligning financial incentives with “Get With the Guidelines” to improve cardiovascular care.Am J Manag Care.2004;10(7 pt 2):501–504.
- .Sampling best practices. Managing delinquent records.J AHIMA.1997;68(8):28,30.
- ,.Pay for performance: an overview of the literature.Am J Med Qual.2009;24;140–163.
- ,,.Physician‐level P4P:DOA? Can quality‐based payments be resuscitated?Am J Manag Care.2007;13(5):233–236.
- ,,, et al.Will pay for performance and quality reporting affect health care disparities?Health Aff (Millwood).2007;26(3):w405–w414.
- ,,.The experience of pay for performance in English family practice: a qualitative study.Ann Fam Med.2008;8(3):228–234.
- ,,, et al.Will financial incentives stimulate quality improvement? Reactions from frontline physicians.Am J Med Qual.2006;21(6):367–374.
- ,,.Pay for performance in orthopedic surgery.Clin Orthop Relat Res.2007;457:87–95.
- ,.Pay for performance survey of diagnostic radiology faculty and trainees.J Am Coll Radiol.2007;4(6):411–415.
Copyright © 2010 Society of Hospital Medicine
