User login
Expanding APRN practice and more
Why VA Health Care Is Different
Is VA health care really “all that different” from what veterans would find in the private sector?
As someone who spent more than 25 years managing private sector health care organizations and recently joined VA as its under secretary for health, I’ve had the unique opportunity to compare the health care systems. Over the past several months, I’ve met with veterans and their families, veterans service organizations, VA clinicians, facility staff, and veteran employees at all levels. Through these meetings and travel to dozens of facilities, I’ve come to realize that many of the essential services provided by the VA cannot be found in or even replicated in the private sector.
Over time and in partnership with successive generations of veterans, the VA has evolved into an interconnected, institutionalized system of care and services. And while many of these services aren’t unique to the VA, ours is the only health care organization that combines these services “under one roof” and integrates them in a way that is veteran-centric.
Further, as our country continues to struggle with improving health outcomes and unsustainable increases in health care costs, the VA can play a crucial role. As a long-standing, highly integrated, and patient-focused provider of care, the VA can lead the way in advancing the nation’s health care. This is the appropriate role for government: Do what the private sector cannot or will not do, given the nature of its enterprise.
The VA has 3 core strengths that distinguish its services from those of the private sector in caring for veterans: (1) systemwide clinical expertise regarding service-connected conditions and disorders; (2) a team approach to primary care that is veteran-centric; and (3) a holistic view of the veteran that includes physical, psychosocial, and economic determinants of health, as well as critical support services for family members and caregivers.
First, the VA brings together comprehensive expertise on service-connected health issues in a single health care system. Our clinicians are trained to identify, assess, and treat a wide spectrum of health issues, such as spinal cord injury and limb loss, conditions arising from environmentalexposures, and traumatic brain injury. Additionally, VA specialists have expertise in the treatment of mental health issues, substance abuse, suicide prevention, and posttraumatic stress disorder (PTSD). Further, the VA has a long track record that includes national programs in audiology and speech pathology, blind rehabilitation, chiropractic care, physical med-icine and rehabilitation, prostheticand sensory aids services, recreation therapy, and polytrauma care.
In contrast, knowledge of and expertise in these crucially important health care issues are not nearly as widespread in the private sector. For example, less than 50% of private practice primary care providers (PCPs) regularly perform screening tests for PTSD and depression.1 In addition, only 15% of community-based mental health providers are proficient in treating military and deployment-related issues such as PTSD, and less than 20% of PCPs have sufficient military culture competence to take a veteran’s military history.1
The VA’s second core strength is its team-based, veteran-centric model of primary care that focuses on patient-driven, proactive, and personalized care. This patient aligned care team (PACT) addresses not only disease management, but also disease prevention, wellness, and health promotion. The PACT model often includes PCPs, nurse care managers, social workers, pharmacists, nutritionists, behavioral health professionals, administrative clerks, as well as the veteran, family members, and caregivers. Through PACT, veterans can attend group clinics and educational seminars, access web-based information via a personalized patient portal, and directly communicate with their care team by phone, secure messaging, or telehealth. The PACT approach has proven effective: Several studies examined its impact on reducing avoidable hospitalizations, emergency department visits, and behavioral health issues and on improving communication among health care professionals.2-4
The VA’s third core strength—a holistic approach to patient care— also is not uniformly seen in the private sector. All too often the private sector health care system addresses only the patient’s chief complaint, focusing on the physical manifestation of an illness or the patient’s psychological condition. Ensuring a patient’s well-being requires the integration of the physical, psychological, social, and economic aspects of health and a thorough understanding of how these factors impact treatment compliance. As any health care professional knows, even the best treatment plan cannot succeed without patient compliance. In this regard, the ability to address nonmedical issues is as important as the treatment plan.
By taking a holistic view of health and inviting veterans to do the same, the VA addresses these and other compliance issues head-on. The VA is positioned to provide help, as appropriate, with transportation; caregiver support; homelessness; pharmaceutical benefits; clothing allowances; counseling in readjustment centers; and a full range of physical, psychological, dental, and social services.
As someone who has spent considerable time in the private sector, I can report that delivery of such services is the exception, not the rule, especially given the current system of health care reimbursement. The benefit of a holistic view is underscored by numerous outcome studies showing that the VA performs as well as, if not better than, the private sector. For example, screening and prevention outcomes at the VA have been consistently better than those at community care sites.5
Studies also suggest that standard care measures, such as control of blood pressure and hemoglobin A1c levels, are often better in VA patients compared with non-VA patients. Studies of risk-adjusted mortality rates generally found improved outcomes for VA care or little difference between VA and non-VA care.6-9 Moreover, a recent independent assessment of the VA reported that the VA performed as well as, and in some cases better than, the private sector on a number of key indicators.10
In my first year as the VA under secretary for health, I have come to appreciate these strengths even more and to sharpen my understanding of what makes VA care different from private sector care. Five distinctions are clear:
1. Veteran Patients Are Inherently Different
The VA manages a patient mix that is distinct from what civilian community providers typically treat. The majority of veterans who utilize VA health care are collectively sicker and poorer and have fewer support services than age-matched non-veteran patients.10,11 When compared with the general population, veterans are more likely to have as many as 3 additional comorbid physical conditions as well as a possible mental health diagnosis.
Similarly, the VA also cares for a higher percentage of minorities who, as a group, too often encounter barriers to care in community settings. Given these disproportionately higher numbers of patients facing access issues, the VA has done better than the private sector in reducing barriers to care for many health measures.12 For many veterans, the VA has become a lifeline of health care support and service.
2. Reimbursement and Incentives
The veteran patient population typically requires more time during a typical doctor visit than private sector physicians generally can provide. Ever-changing reimbursement schedules have forced many private sector PCPs to shorten patient visits in order to survive economically. Because VA physicians are salaried, they don’t face the same constraints on time spent with patients. Further, there is less of a mismatch between financial performance and clinical performance and, therefore, less likelihood of inappropriate tests and services.
3. VA Employees’ Sense of Mission
Almost 95% of VA staff believe the work they do is important.13 In annual employee surveys, the VA sees a high commitment to service from its employees. Additionally, 40% of VA staff are veterans, who can relate to veteran patients in ways nonveterans cannot. As under secretary for health, it has been a remarkable experience seeing this sense of mission translated into everyday care and observing the very personal connection between VA employees and patients.
This sense of mission, embedded throughout the organization, has a far-reaching impact that includes the relationships formed with veterans. In stark contrast to the private sector, where patients may receive care from multiple sources and switch providers and insurance companies with increasing frequency, veterans tend to forge lifelong relationships with the VA. In turn, this stable and consistent relationship strengthens doctor-patient communications and provides a solid foundation for shared decision making. These long-term relationships also may improve the continuity of care and the ability to track long-term outcomes.
4. VA’s Unique Integration of Clinical Practice With Education & Research
As someone whose residency included training at VA, I’ve long appreciated the VA’s ability to advance health care, incorporate new learning, and promote best practices. These capabilities are fortified by its 70-year partnership with academic affiliates. Through academic partnerships, the VA trains tens of thousands of health care professionals yearly and conducts cutting-edge research on all the service-connected issues described above, as well as chronic illness, disparities in care, and emerging areas such as personalized medicine.
The VA Research and Development Program is the nation’s only intramural research program entirely dedicated to the health of veterans. Further, more than 60% of VA researchers are clinicians, which means their studies are framed by daily interaction with patients, and their study findings are put into practice more quickly.
5. VA Investment in Large-Scale Capabilities
As the largest integrated health care system in the U.S., the VA can invest in capabilities that are difficult for smaller systems to undertake. For example, the VA electronic medical record platform has enabled the organization to capture veteran health data systemwide for more than 2 decades, longer than almost any other health care enterprise in the country. Additionally, the ability of the VA to house and analyze “big data” is more advanced than that of most other health care systems, in part because of its considerably larger scale. This capability supports the holistic approach to care noted above and makes it possible to consider the numerous social and economic determinants of health and to track outcomes over time. This capability also supports the VA Million Veteran Program (MVP), a research effort that is building a genomic database of 1 million users of VA health care. Through the MVP, researchers will be able to use genomic and clinical data to develop personalized therapies for veterans and address some of America’s most significant research questions.14
As we continue to transform the VA and improve veterans’ health care, it is essential to understand that VA care is different from private sector care. It also is essential to understand—particularly given an environment of intense public scrutiny—that this fundamental distinction is embedded in the VA mission “to care for those who have borne the battle for their country.”
At the same time, it also is crucial to recognize that, although VA care is distinctly different from private sector care, our ongoing transformation means closer collaboration with the private sector—that is, for veterans seeking care from community providers. In this regard, we are working to achieve a tighter integration of the care offered to veterans in both sectors by working to develop a high-performance network that includes care from both VA and the private sector.15
Finally, in the midst of such a transformation, it is imperative to underscore that one factor will remain the same: our long-standing and unwavering commitment to provide patient-centric care and value to every veteran. As the under secretary for health, it is my great privilege to see this commitment daily and to better position the VA to serve our veterans and the nation.
1. Tanielian T, Farris C, Batka C, et al. Ready to Serve: Community-Based Provider Capacity to Deliver Culturally Competent, Quality Mental Health Care to Veterans and Their Families. San Francisco, CA: Rand Corporation; 2014.
2. Kearney LK, Post EP, Pomerantz AS, Zeiss AM. Applying the interprofessional patient aligned care team in the Department of Veterans Affairs: transforming primary care. Am Psychol. 2014;69(4):399-408.
3. Chaiyachati KH, Gordon K, Long T, et al. Continuity in a VA patient-centered medical home reduces emergency department visits. PloS One. 2014;9(5):e96356.
4. Yano EM. Implementation and impact of VA patient centered medical home. U.S. Department of Veterans Affairs website. http://www.hsrd.research.va.gov/research/abstracts.cfm?Project_ID=2141701013. Updated March 24, 2014. Accessed April 5, 2016.
5. Evidence-Based Synthesis Program Center. Comparison of Quality of Care in VA and Non-VA Settings: A Systematic Review. Los Angeles, CA: West Los Angeles VA Medical Center; 2010.
6. Nuti SV, Qin L, Rumsfeld JS, et al. Association of admission to Veterans Affairs hospitals vs non-Veterans Affairs hospitals with mortality and readmission rates among older men hospitalized with acute myocardial infarction, heart failure, or pneumonia. JAMA. 2016;315(6):582-592.
7. Kazis LE, Ren XS, Lee A, et al. Health status in VA patients: results from the Veterans Health Study. Am J Med Qual. 1999;14(1):28-38.
8. Payne SM, Lee A, Clark JA, et al. Utilization of medical services by Veterans Health Study (VHS) respondents. J Ambul Care Manage. 2005;28(2):125-140.
9. Keyhani S, Cheng E, Arling G, et al. Does the inclusion of stroke severity in a 30-day mortality model change standardized mortality rates at Veterans Affairs hospitals? Circ Cardiovasc Qual Outcomes. 2012;5(4):508-513.
10. CMS Alliance to Modernize Healthcare. Independent Assessment of the Healthcare Delivery Systems and Management Processes of the Department of Veterans Affairs. Volume 1: Integrated Report. U.S. Department of Veterans Affairs website. http://www.va.gov/opa/choiceact/documents/assessments/integrated_report.pdf. Published September 2015. Accessed April 4, 2016.
11. Jha AK. Learning from the past to improve VA health care. JAMA. 2016;315(6):560-561.
12. Trivedi AN, Grebla RC, Wright SM, Washington DL. Despite improved quality of care in the Veterans Affairs health system, racial disparity persists for important clinical outcomes. Health Aff (Millwood). 2011;30(4):707-715.
13. U.S. Department of Veterans Affairs. Department of Veterans Affairs 2015 Federal Employee Viewpoint Results. U.S. Department of Veterans Affairs website. http://www.va.gov/OHRM/docs/2015FEVSReportVA.pdf. Accessed April 4, 2016.
14. Kupersmith J, O’Leary T. The Million Veteran Program: building VA’s mega-database for genomic medicine. Health Affairs website. http://healthaffairs.org/blog/2012/11/19/the-million-veteran-program-building-vas-mega-database-for-genomic-medicine. Published November 19, 2012. Accessed February 18, 2016.
15. Shulkin D. Beyond the VA crisis: becoming a high-performance network. N Engl J Med. 2016;374(11):1003-1005.
Is VA health care really “all that different” from what veterans would find in the private sector?
As someone who spent more than 25 years managing private sector health care organizations and recently joined VA as its under secretary for health, I’ve had the unique opportunity to compare the health care systems. Over the past several months, I’ve met with veterans and their families, veterans service organizations, VA clinicians, facility staff, and veteran employees at all levels. Through these meetings and travel to dozens of facilities, I’ve come to realize that many of the essential services provided by the VA cannot be found in or even replicated in the private sector.
Over time and in partnership with successive generations of veterans, the VA has evolved into an interconnected, institutionalized system of care and services. And while many of these services aren’t unique to the VA, ours is the only health care organization that combines these services “under one roof” and integrates them in a way that is veteran-centric.
Further, as our country continues to struggle with improving health outcomes and unsustainable increases in health care costs, the VA can play a crucial role. As a long-standing, highly integrated, and patient-focused provider of care, the VA can lead the way in advancing the nation’s health care. This is the appropriate role for government: Do what the private sector cannot or will not do, given the nature of its enterprise.
The VA has 3 core strengths that distinguish its services from those of the private sector in caring for veterans: (1) systemwide clinical expertise regarding service-connected conditions and disorders; (2) a team approach to primary care that is veteran-centric; and (3) a holistic view of the veteran that includes physical, psychosocial, and economic determinants of health, as well as critical support services for family members and caregivers.
First, the VA brings together comprehensive expertise on service-connected health issues in a single health care system. Our clinicians are trained to identify, assess, and treat a wide spectrum of health issues, such as spinal cord injury and limb loss, conditions arising from environmentalexposures, and traumatic brain injury. Additionally, VA specialists have expertise in the treatment of mental health issues, substance abuse, suicide prevention, and posttraumatic stress disorder (PTSD). Further, the VA has a long track record that includes national programs in audiology and speech pathology, blind rehabilitation, chiropractic care, physical med-icine and rehabilitation, prostheticand sensory aids services, recreation therapy, and polytrauma care.
In contrast, knowledge of and expertise in these crucially important health care issues are not nearly as widespread in the private sector. For example, less than 50% of private practice primary care providers (PCPs) regularly perform screening tests for PTSD and depression.1 In addition, only 15% of community-based mental health providers are proficient in treating military and deployment-related issues such as PTSD, and less than 20% of PCPs have sufficient military culture competence to take a veteran’s military history.1
The VA’s second core strength is its team-based, veteran-centric model of primary care that focuses on patient-driven, proactive, and personalized care. This patient aligned care team (PACT) addresses not only disease management, but also disease prevention, wellness, and health promotion. The PACT model often includes PCPs, nurse care managers, social workers, pharmacists, nutritionists, behavioral health professionals, administrative clerks, as well as the veteran, family members, and caregivers. Through PACT, veterans can attend group clinics and educational seminars, access web-based information via a personalized patient portal, and directly communicate with their care team by phone, secure messaging, or telehealth. The PACT approach has proven effective: Several studies examined its impact on reducing avoidable hospitalizations, emergency department visits, and behavioral health issues and on improving communication among health care professionals.2-4
The VA’s third core strength—a holistic approach to patient care— also is not uniformly seen in the private sector. All too often the private sector health care system addresses only the patient’s chief complaint, focusing on the physical manifestation of an illness or the patient’s psychological condition. Ensuring a patient’s well-being requires the integration of the physical, psychological, social, and economic aspects of health and a thorough understanding of how these factors impact treatment compliance. As any health care professional knows, even the best treatment plan cannot succeed without patient compliance. In this regard, the ability to address nonmedical issues is as important as the treatment plan.
By taking a holistic view of health and inviting veterans to do the same, the VA addresses these and other compliance issues head-on. The VA is positioned to provide help, as appropriate, with transportation; caregiver support; homelessness; pharmaceutical benefits; clothing allowances; counseling in readjustment centers; and a full range of physical, psychological, dental, and social services.
As someone who has spent considerable time in the private sector, I can report that delivery of such services is the exception, not the rule, especially given the current system of health care reimbursement. The benefit of a holistic view is underscored by numerous outcome studies showing that the VA performs as well as, if not better than, the private sector. For example, screening and prevention outcomes at the VA have been consistently better than those at community care sites.5
Studies also suggest that standard care measures, such as control of blood pressure and hemoglobin A1c levels, are often better in VA patients compared with non-VA patients. Studies of risk-adjusted mortality rates generally found improved outcomes for VA care or little difference between VA and non-VA care.6-9 Moreover, a recent independent assessment of the VA reported that the VA performed as well as, and in some cases better than, the private sector on a number of key indicators.10
In my first year as the VA under secretary for health, I have come to appreciate these strengths even more and to sharpen my understanding of what makes VA care different from private sector care. Five distinctions are clear:
1. Veteran Patients Are Inherently Different
The VA manages a patient mix that is distinct from what civilian community providers typically treat. The majority of veterans who utilize VA health care are collectively sicker and poorer and have fewer support services than age-matched non-veteran patients.10,11 When compared with the general population, veterans are more likely to have as many as 3 additional comorbid physical conditions as well as a possible mental health diagnosis.
Similarly, the VA also cares for a higher percentage of minorities who, as a group, too often encounter barriers to care in community settings. Given these disproportionately higher numbers of patients facing access issues, the VA has done better than the private sector in reducing barriers to care for many health measures.12 For many veterans, the VA has become a lifeline of health care support and service.
2. Reimbursement and Incentives
The veteran patient population typically requires more time during a typical doctor visit than private sector physicians generally can provide. Ever-changing reimbursement schedules have forced many private sector PCPs to shorten patient visits in order to survive economically. Because VA physicians are salaried, they don’t face the same constraints on time spent with patients. Further, there is less of a mismatch between financial performance and clinical performance and, therefore, less likelihood of inappropriate tests and services.
3. VA Employees’ Sense of Mission
Almost 95% of VA staff believe the work they do is important.13 In annual employee surveys, the VA sees a high commitment to service from its employees. Additionally, 40% of VA staff are veterans, who can relate to veteran patients in ways nonveterans cannot. As under secretary for health, it has been a remarkable experience seeing this sense of mission translated into everyday care and observing the very personal connection between VA employees and patients.
This sense of mission, embedded throughout the organization, has a far-reaching impact that includes the relationships formed with veterans. In stark contrast to the private sector, where patients may receive care from multiple sources and switch providers and insurance companies with increasing frequency, veterans tend to forge lifelong relationships with the VA. In turn, this stable and consistent relationship strengthens doctor-patient communications and provides a solid foundation for shared decision making. These long-term relationships also may improve the continuity of care and the ability to track long-term outcomes.
4. VA’s Unique Integration of Clinical Practice With Education & Research
As someone whose residency included training at VA, I’ve long appreciated the VA’s ability to advance health care, incorporate new learning, and promote best practices. These capabilities are fortified by its 70-year partnership with academic affiliates. Through academic partnerships, the VA trains tens of thousands of health care professionals yearly and conducts cutting-edge research on all the service-connected issues described above, as well as chronic illness, disparities in care, and emerging areas such as personalized medicine.
The VA Research and Development Program is the nation’s only intramural research program entirely dedicated to the health of veterans. Further, more than 60% of VA researchers are clinicians, which means their studies are framed by daily interaction with patients, and their study findings are put into practice more quickly.
5. VA Investment in Large-Scale Capabilities
As the largest integrated health care system in the U.S., the VA can invest in capabilities that are difficult for smaller systems to undertake. For example, the VA electronic medical record platform has enabled the organization to capture veteran health data systemwide for more than 2 decades, longer than almost any other health care enterprise in the country. Additionally, the ability of the VA to house and analyze “big data” is more advanced than that of most other health care systems, in part because of its considerably larger scale. This capability supports the holistic approach to care noted above and makes it possible to consider the numerous social and economic determinants of health and to track outcomes over time. This capability also supports the VA Million Veteran Program (MVP), a research effort that is building a genomic database of 1 million users of VA health care. Through the MVP, researchers will be able to use genomic and clinical data to develop personalized therapies for veterans and address some of America’s most significant research questions.14
As we continue to transform the VA and improve veterans’ health care, it is essential to understand that VA care is different from private sector care. It also is essential to understand—particularly given an environment of intense public scrutiny—that this fundamental distinction is embedded in the VA mission “to care for those who have borne the battle for their country.”
At the same time, it also is crucial to recognize that, although VA care is distinctly different from private sector care, our ongoing transformation means closer collaboration with the private sector—that is, for veterans seeking care from community providers. In this regard, we are working to achieve a tighter integration of the care offered to veterans in both sectors by working to develop a high-performance network that includes care from both VA and the private sector.15
Finally, in the midst of such a transformation, it is imperative to underscore that one factor will remain the same: our long-standing and unwavering commitment to provide patient-centric care and value to every veteran. As the under secretary for health, it is my great privilege to see this commitment daily and to better position the VA to serve our veterans and the nation.
1. Tanielian T, Farris C, Batka C, et al. Ready to Serve: Community-Based Provider Capacity to Deliver Culturally Competent, Quality Mental Health Care to Veterans and Their Families. San Francisco, CA: Rand Corporation; 2014.
2. Kearney LK, Post EP, Pomerantz AS, Zeiss AM. Applying the interprofessional patient aligned care team in the Department of Veterans Affairs: transforming primary care. Am Psychol. 2014;69(4):399-408.
3. Chaiyachati KH, Gordon K, Long T, et al. Continuity in a VA patient-centered medical home reduces emergency department visits. PloS One. 2014;9(5):e96356.
4. Yano EM. Implementation and impact of VA patient centered medical home. U.S. Department of Veterans Affairs website. http://www.hsrd.research.va.gov/research/abstracts.cfm?Project_ID=2141701013. Updated March 24, 2014. Accessed April 5, 2016.
5. Evidence-Based Synthesis Program Center. Comparison of Quality of Care in VA and Non-VA Settings: A Systematic Review. Los Angeles, CA: West Los Angeles VA Medical Center; 2010.
6. Nuti SV, Qin L, Rumsfeld JS, et al. Association of admission to Veterans Affairs hospitals vs non-Veterans Affairs hospitals with mortality and readmission rates among older men hospitalized with acute myocardial infarction, heart failure, or pneumonia. JAMA. 2016;315(6):582-592.
7. Kazis LE, Ren XS, Lee A, et al. Health status in VA patients: results from the Veterans Health Study. Am J Med Qual. 1999;14(1):28-38.
8. Payne SM, Lee A, Clark JA, et al. Utilization of medical services by Veterans Health Study (VHS) respondents. J Ambul Care Manage. 2005;28(2):125-140.
9. Keyhani S, Cheng E, Arling G, et al. Does the inclusion of stroke severity in a 30-day mortality model change standardized mortality rates at Veterans Affairs hospitals? Circ Cardiovasc Qual Outcomes. 2012;5(4):508-513.
10. CMS Alliance to Modernize Healthcare. Independent Assessment of the Healthcare Delivery Systems and Management Processes of the Department of Veterans Affairs. Volume 1: Integrated Report. U.S. Department of Veterans Affairs website. http://www.va.gov/opa/choiceact/documents/assessments/integrated_report.pdf. Published September 2015. Accessed April 4, 2016.
11. Jha AK. Learning from the past to improve VA health care. JAMA. 2016;315(6):560-561.
12. Trivedi AN, Grebla RC, Wright SM, Washington DL. Despite improved quality of care in the Veterans Affairs health system, racial disparity persists for important clinical outcomes. Health Aff (Millwood). 2011;30(4):707-715.
13. U.S. Department of Veterans Affairs. Department of Veterans Affairs 2015 Federal Employee Viewpoint Results. U.S. Department of Veterans Affairs website. http://www.va.gov/OHRM/docs/2015FEVSReportVA.pdf. Accessed April 4, 2016.
14. Kupersmith J, O’Leary T. The Million Veteran Program: building VA’s mega-database for genomic medicine. Health Affairs website. http://healthaffairs.org/blog/2012/11/19/the-million-veteran-program-building-vas-mega-database-for-genomic-medicine. Published November 19, 2012. Accessed February 18, 2016.
15. Shulkin D. Beyond the VA crisis: becoming a high-performance network. N Engl J Med. 2016;374(11):1003-1005.
Outcomes for Inpatient Gainsharing
Hospitals are challenged to improve quality while reducing costs, yet traditional methods of cost containment have had limited success in aligning the goals of hospitals and physicians. Physicians directly control more than 80% of total medical costs.1 The current fee‐for‐service system encourages procedures and the use of hospital resources. Without the proper incentives to gain active participation and collaboration of the medical staff in improving the efficiency of care, the ability to manage medical costs and improve hospital operational and financial performance is hampered. A further challenge is to encourage physicians to improve the quality of care and maintain safe medical practice. While several examples of pay‐for‐performance (P4P) have previously been attempted to increase efficiency, gainsharing offers real opportunities to achieve these outcomes.
Previous reports regarding the results of gainsharing programs describe its use in outpatient settings and its limited ability to reduce costs for inpatient care for surgical implants such as coronary stents2 or orthopedic prostheses.3 The present study represents the largest series to date using a gainsharing model in a comprehensive program of inpatient care at a tertiary care medical center.
Patients and Methods
Beth Israel Medical Center is a 1000‐bed tertiary care university‐affiliated teaching hospital, located in New York City. The hospital serves a large and ethnically diverse community predominantly located in the lower east side of Manhattan and discharged about 50,000 patients per year during the study period of July 2006 through June 2009.
Applied Medical Software, Inc. (AMS, Collingswood, NJ) analyzed hospital data for case mix and severity. To establish best practice norms (BPNs), AMS used inpatient discharge data (UB‐92) to determine costs by APR‐DRG's4 during calendar year 2005, prior to the inception of the program to establish BPNs. Costs were allocated into specific areas listed in Table 1. A minimum of 10 cases was necessary in each DRG. Cost outliers (as defined by the mean cost of the APR DRG plus 3 standard deviations) were excluded. These data were used to establish a baseline for each physician and a BPN, which was set at the top 25th percentile for each specific APR DRG. BPNs were determined after exclusions using the following criteria:
Each eligible physician had to have at least 10 admissions within their specialty;
Each eligible DRG had to have at least 5 qualifying physicians within a medical specialty;
Each eligible APR DRG had to have at least 3 qualifying admissions;
If the above criteria are met, the BPN was set at the mean of the top 25th percentile of physicians (25% of the physicians with the lowest costs).
| |
| Per diem hospital bed cost | Pharmacy |
| Critical care (ICU and CCU) | Laboratory |
| Medical surgical supplies and implants | Cardiopulmonary care |
| Operating room costs | Blood bank |
| Radiology | Intravenous therapy |
Once BPNs were determined, patients were grouped by physician and compared to the BPN for a particular APR DRG. All patients of participating physicians with qualifying APR DRGs were included in the analysis reports summarizing these results, computed quarterly and distributed to each physician. Obstetrical and psychiatric admissions were excluded in the program. APR DRG data for each physician was compared from year to year to determine whether an individual physician demonstrated measurable improvement in performance.
The gainsharing program was implemented in 2006. Physician participation was voluntary. Payments were made to physicians without any risk or penalties from participation. Incentives were based on individual performance. Incentives for nonsurgical admissions were intended to offset the loss of physician income related to more efficient medical management and a reduced hospital length of stay (LOS). Income for surgical admissions was intended to reward physicians for efficient preoperative and postoperative care.
The methodology provides financial incentives for physicians for each hospital discharge in 2 ways:
Improvement in costs per case against their own historical performance;
Cost per case performance compared to BPN.
In the first year of the gainsharing program, two thirds of the total allowable incentive payments were allocated to physicians' improvement, with one third based on a performance metric. Payments for improvement were phased out over the first 3 years of the gainsharing program, with payments focused fully on performance in Year 3. Cases were adjusted for case‐mix and severity of illness (four levels of APR DRG). Physicians were not penalized for any cases in which costs greatly exceeded BPN. A floor was placed at the BPN and no additional financial incentives were paid for surpassing it. Baselines and BPNs were recalculated yearly.
A key aspect of the gainsharing program was the establishment of specific quality parameters (Table 2) that need to be met before any incentive payments were made. A committee regularly reviewed the quality performance data of each physician to determine eligibility for payments. Physicians were considered to be ineligible for incentive compensation until the next measurement period if there was evidence of failure to adequately meet these measures. At least 80% compliance with core measures (minimum 5 discharges in each domain) was expected. Infectious complication rates were to remain not more than 1 standard deviation above National Healthcare Safety Network rates during the same time period. In addition, payments were withheld from physicians if it was found that the standard of care was not met for any morbidity or mortality that was peer reviewed or if there were any significant patient complaints. Readmission rates were expected to remain at or below the baseline established during the previous 12 months by DRG.
| Quality Measure | Goal |
|---|---|
| |
| Readmissions within 7 days for the same or related diagnosis | Decrease, or less than 10% of discharges |
| Documentationquality and timeliness of medical record and related documentation including date, time, and sign all chart entries | No more than 20% of average monthly discharged medical records incomplete for more than 30 days |
| Consultation with social work/discharge planner within 24 hours of admission for appropriate pts | >80% of all appropriate cases |
| Timely switch from intravenous to oral antibiotics in accordance with hospital policy (%) | >80 |
| Unanticipated return to the operating room | Decrease or < 5% |
| Patient complaints | Decrease |
| Patient satisfaction (HCAHPS) | >75% physician domain |
| Ventilator associated pneumonia | Decrease or < 5% |
| Central line associated blood stream infections | Decrease or < 5 per 1000 catheter days. |
| Surgical site infections | Decrease or within 1 standard deviation of NHSN |
| Antibiotic prophylaxis (%) | >80 |
| Inpatient mortality | Decrease or <1% |
| Medication errors | Decrease or <1% |
| Delinquent medical records | <5 charts delinquent more than 30 days |
| Falls with injury | Decrease or <1% |
| AMI: aspirin on arrival and discharge (%) | >80 |
| AMI‐ACEI or ARB for LVSD (%) | >80 |
| Adult smoking cessation counseling (%) | >80 |
| AMI‐ Beta blocker prescribed at arrival and discharge (%) | >80 |
| CHF: discharge instructions (%) | >80 |
| CHF: Left ventricular function assessment (%) | >80 |
| CHF: ACEI or ARB for left ventricular systolic dysfunction (%) | >80 |
| CHF: smoking cessation counseling (%) | >80 |
| Pneumonia: O2 assessment, pneumococcal vaccine, blood culture and sensitivity before first antibiotic, smoking cessation counseling (%) | >80 |
Employed and private practice community physicians were both eligible for the gainsharing program. Physician participation in the program was voluntary. All patients admitted to the Medical Center received notification on admission about the program. The aggregate costs by DRG were calculated quarterly. Savings over the previous yearif anywere calculated. A total of 20% of the savings was used to administer the program and for incentive payments to physicians.
From July 1, 2006 through September 2008, only commercial managed care cases were eligible for this program. As a result of the approval of the gainsharing program as a demonstration project by the Centers for Medicare and Medicaid Services (CMS), Medicare cases were added to the program starting October 1, 2008.
Physician Payment Calculation Methodology
Performance Incentive
The performance incentive was intended to reward demonstrated levels of performance. Accordingly, a physician's share in hospital savings was in proportion to the relationship between their individual performance and the BPN. This computation was the same for both surgical and medical admissions. The following equation illustrates the computation of performance incentives for participating physicians:
This computation was made at the specific severity level for each hospital discharge. Payment for the performance incentive was made only to physicians at or below the 90th percentile of physicians.
Improvement Incentive
The improvement incentive was intended to encourage positive change. No payments were made from the improvement incentive unless an individual physician demonstrated measurable improvement in operational performance for either surgical or medical admissions. However, because physicians who admitted nonsurgical cases experienced reduced income as they help the hospital to improve operational performance, the methodology for calculating the improvement incentive was different for medical as opposed to surgical cases, as shown below.
For Medical DRGs:
For each severity level the following is calculated:
For Surgical DRGs:
Cost savings were calculated quarterly and defined as the cost per case before the gainsharing program began minus the actual case cost by APR DRG. Student's t‐test was used for continuous data and the categorical data trends were analyzed using Mantel‐Haenszel Chi‐Square.
At least every 6 months, all participating physicians received case‐specific and cost‐centered data about their discharges. They also received a careful explanation of opportunities for financial or quality improvement.
Results
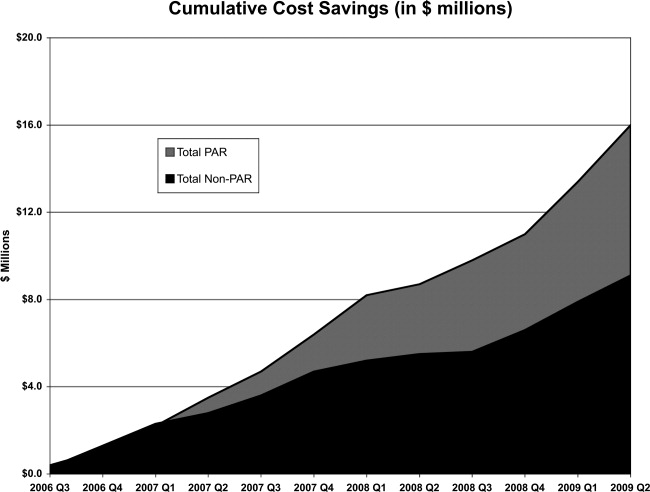
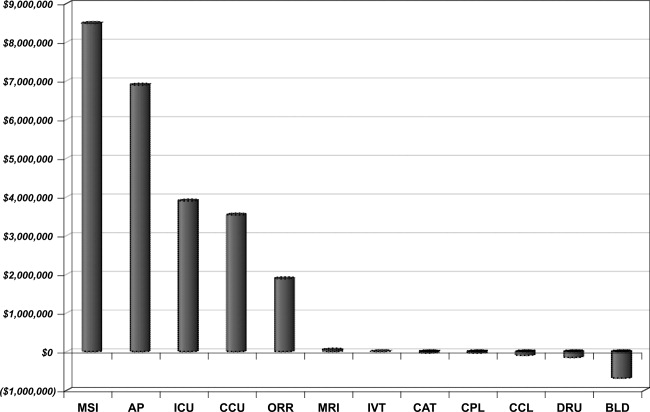
Over the 3‐year period, 184 physicians enrolled, representing 54% of those eligible. The remainder of physicians either decided not to enroll or were not eligible due to inadequate number of index DRG cases or excluded diagnoses. Payer mix was 27% Medicare and 48% of the discharges were commercial and managed care. The remaining cases were a combination of Medicaid and self‐pay. A total of 29,535 commercial and managed care discharges were evaluated from participating physicians (58%) and 20,360 similar discharges from non‐participating physicians. This number of admissions accounted for 29% of all hospital discharges during this time period. Surgical admissions accounted for 43% and nonsurgical admissions for 57%. The distribution of patients by service is shown in Table 3. Pulmonary and cardiology diagnoses were the most frequent reasons for medical admissions. General and head and neck surgery were the most frequent surgical admissions. During the time period of the gainsharing program, the medical center saved $25.1 million for costs attributed to these cases. Participating physicians saved $6.9 million more than non‐participating physicians (P = 0.02, Figure 1), but all discharges demonstrated cost savings during the study period. Cost savings (Figure 2) resulted from savings in medical/surgical supplies and implants (35%), daily hospital costs, (28%), intensive care unit costs (16%) and coronary care unit costs (15%), and operating room costs (8%). Reduction in cost from reduced magnetic resonance imaging (MRI) use was not statistically significant. There were minimal increases in costs due to computed tomography (CT) scan use, cardiopulmonary care, laboratory use, pharmacy and blood bank, but none of these reached statistical significance.
| Admissions by Service | Number (%) |
|---|---|
| |
| Cardiology | 4512 (15.3) |
| Orthopedic surgery | 3994 (13.5) |
| Gastroenterology | 3214 (10.9) |
| General surgery | 2908 (9.8) |
| Cardiovascular surgery | 2432 (8.2) |
| Pulmonary | 2212 (7.5) |
| Neurology | 2064 (7.0) |
| Oncology | 1217 (4.1) |
| Infectious disease | 1171 (4.0) |
| Endocrinology | 906 (3.1) |
| Nephrology | 826 (2.8) |
| Open heart surgery | 656 (2.2) |
| Interventional cardiology | 624 (2.1) |
| Gynecological surgery | 450 (1.5) |
| Urological surgery | 326 (1.1) |
| ENT surgery | 289 (1.0) |
| Obstetrics without delivery | 261 (0.9) |
| Hematology | 253 (0.9) |
| Orthopedicsnonsurgical | 241 (0.8) |
| Rehabilitation | 204 (0.7) |
| Otolaryngology | 183 (0.6) |
| Rheumatology | 165 (0.6) |
| General medicine | 162 (0.5) |
| Neurological surgery | 112 (0.4) |
| Urology | 101 (0.3) |
| Dermatology | 52 (0.2) |
| Grand total | 29535 (100.0) |
Hospital LOS decreased 9.8% from baseline among participating doctors, while LOS decreased 9.0% among non‐participating physicians; this difference was not statistically significant (P = 0.6). Participating physicians reduced costs by an average of $7,871 per quarter, compared to a reduction in costs by $3,018 for admissions by non‐participating physicians (P < 0.0001). The average savings per admission for the participating physicians were $1,835, and for non‐participating physicians were $1,107, a difference of $728 per admission. Overall, cost savings during the three year period averaged $105,000 per physician who participated in the program and $67,000 per physician who did not (P < 0.05). There was not a statistical difference in savings between medical and surgical admissions (P = 0.24).
Deviations from quality thresholds were identified during this time period. Some or all of the gainsharing income was withheld from 8% of participating physicians due to quality issues, incomplete medical records, or administrative reasons. Payouts to participating physicians averaged $1,866 quarterly (range $0‐$27,631). Overall, 9.4% of the hospital savings was directly paid to the participating physicians. Compliance with core measures improved in the following domains from year 2006 to 2009; acute myocardial infarction 94% to 98%, congestive heart failure 76% to 93%, pneumonia 88% to 97%, and surgical care improvement project 90% to 97%, (P = 0.17). There was no measurable increase in 30‐day mortality or readmission by APR‐DRG. The number of incomplete medical records decreased from an average of 43% of the total number of records in the second quarter of 2006 to 30% in the second quarter of 2009 (P < 0.0001). Other quality indicators remained statistically unchanged.
Discussion
The promise of gainsharing may motivate physicians to decrease hospital costs while maintaining quality medical care, since it aligns physician and hospital incentives. Providing a reward to physicians creates positive reinforcement, which is more effective than warnings against poor performing physicians (carrot vs. stick).5, 6 This study is the first and largest of its kind to show the results of a gainsharing program for inpatient medical and surgical admissions and demonstrates that significant cost savings may be achieved. This is similar to previous studies that have shown positive outcomes for pay‐for‐performance programs.7
Participating physicians in the present study accumulated almost $7 million more in savings than non‐participating physicians. Over time this difference has increased, possibly due to a learning curve in educating participating physicians and the way in which information about their performance is given back to them. A significant portion of the hospital's cost savings was through improvements in documentation and completion of medical records. While there was an actual reduction in average length of stay (ALOS), better documentation may also have contributed to adjusting the severity level within each DRG.
Using financial incentives to positively impact on physician behavior is not new. One program in a community‐based hospitalist group reported similar improvements in medical record documentation, as well as improvements in physician meeting attendance and quality goals.8 Another study found that such hospital programs noted improved physician engagement and commitment to best practices and to improving the quality of care.9
There is significant experience in the outpatient setting using pay‐for‐performance programs to enhance quality. Millett et al.10 demonstrated a reduction in smoking among patients with diabetes in a program in the United Kingdom. Another study in Rochester, New York that used pay‐for‐performance incentives demonstrated better diabetes management.11 Mandel and Kotagal12 demonstrated improved asthma care utilizing a quality incentive program.
The use of financial motivation for physicians, as part of a hospital pay‐for‐performance program, has been shown to lead to improvements in quality performance scores when compared to non pay‐for‐performance hospitals.13 Berthiaume demonstrated decreased costs and improvements in risk‐adjusted complications and risk‐adjusted LOS in patents admitted for acute coronary intervention in a pay‐for‐performance program.14 Quality initiatives were integral for the gainsharing program, since measures such as surgical site infections may increase LOS and hospital costs. Core measures related to the care of patients with acute myocardial infarction, heart failure, pneumonia, and surgical prophylaxis steadily improved since the initiation of the gainsharing program. Gainsharing programs also enhance physician compliance with administrative responsibilities such as the completion of medical records.
One unexpected finding of our study was that there was a cost savings per admission even in the patients of physicians who did not participate in the gainsharing program. While the participating physicians showed statistically significant improvements in cost savings, savings were found in both groups. This raises the question as to whether these cost reductions could have been impacted by other factors such as new labor or vendor contracts, better documentation, improved operating room utilization and improved and timely documentation in the medical record. Another possibility is the Hawthorne effect on physicians, who altered their behavior with knowledge that process and outcome measurement were being measured. Physicians who voluntarily sign up for a gainsharing program would be expected to be more committed to the success of this program than physicians who decide to opt out. While this might appear to be a selection bias it does illustrate the point that motivated physicians are more likely to positively change their practice behaviors. However, one might suggest that financial savings directly attributed to the gainsharing program was not the $25.1 million saved during the 3 years overall, but the difference between participating and non‐participating physicians, or $6.9 million.
While the motivation to complete medical records was significant (gainsharing dollars were withheld from doctors with more than 5 incomplete charts for more than 30 days) it was not the only reason why the number of delinquent chart percentage decreased during the study period. While the improvement was significant, there are still more opportunities to reduce the number of incomplete charts. Hospital regulatory inspections and periodic physician education were also likely to have reduced the number of incomplete inpatient charts during this time period and may do so in the future.15
The program focused on the physician activities that have the greatest impact on hospital costs. While optimizing laboratory, blood bank, and pharmacy management decreased hospital costs; we found that improvements in patient LOS, days in an intensive care unit, and management of surgical implants had the greatest impact on costs. Orthopedic surgeons began to use different implants, and all surgeons refrained from opening disposable surgical supplies until needed. Patients in intensive care unit beds stable for transfer were moved to regular medical/surgical rooms earlier. Since the program helped physicians understand the importance of LOS, many physicians increased their rounding on weekends and considered LOS implications before ordering diagnostic procedures that could be performed as an outpatient. Nurses, physician extenders such as physician assistants, and social workers have played an important role in streamlining patient care and hospital discharge; however, they were not directly rewarded under this program.
There are challenges to aligning the incentives of internists compared to procedure‐based specialists. This may be that the result of surgeons receiving payment for bundled care and thus the incentives are already aligned. The incentive of the program for internists, who get paid for each per daily visit, was intended to overcome the lost income resulting from an earlier discharge. Moreover, in the present study, only the discharging physician received incentive payments for each case. Patient care is undoubtedly a team effort and many physicians (radiologists, anesthesiologists, pathologists, emergency medicine physicians, consultant specialty physicians, etc.) are clearly left out in the present gainsharing program. Aligning the incentives of these physicians might be necessary. Furthermore, the actions of other members of the medical team and consultants, by their behaviors, could limit the incentive payments for the discharging physician. The discharging physician is often unable to control the transfer of a patient from a high‐cost or severity unit, or improve the timeliness of consulting physicians. Previous authors have raised the issue as to whether a physician should be prevented from payment because of the actions of another member of the medical team.16
Ensuring a fair and transparent system is important in any pay‐for‐performance program. The present gainsharing program required sophisticated data analysis, which added to the costs of the program. To implement such a program, data must be clear and understandable, segregated by DRG and severity adjusted. But should the highest reward payments go to those who perform the best or improve the most? In the present study, some physicians were consistently unable to meet quality benchmarks. This may be related to several factors, 1 of which might be a particular physician's case mix. Some authors have raised concerns that pay‐for‐performance programs may unfairly impact physicians who care for more challenging or patients from disadvantaged socioeconomic circumstances.17 Other authors have questioned whether widespread implementation of such a program could potentially increase healthcare disparities in the community.18 It has been suggested by Greene and Nash that for a program to be successful, physicians who feel they provide good care yet but are not rewarded should be given an independent review.16 Such a process is important to prevent resentment among physicians who are unable to meet benchmarks for payment, despite hard work.19 Conversely, other studies have found that many physicians who receive payments in a pay‐for‐performance system do not necessarily consciously make improvement to enhance financial performance.20 Only 54% of eligible physicians participated in the present gainsharing program. This is likely due to lack of understanding about the program, misperceptions about the ethics of such programs, perceived possible negative patient outcome, conflict of interest and mistrust.21, 22 This underscores the importance of providing understandable performance results, education, and a physician champion to help facilitate communication and enhanced outcomes. What is clear is that the perception by participating physicians is that this program is worthwhile as the number of participating physicians has steadily increased and it has become an incentive for new providers to choose this medical center over others.
In conclusion, the results of the present study show that physicians can help hospitals reduce inpatients costs while maintaining or improving hospital quality. Improvements in patient LOS, implant costs, overall costs per admission, and medical record completion were noted. Further work is needed to improve physician education and better understand the impact of uneven physician case mix. Further efforts are necessary to allow other members of the health care team to participate and benefit from gainsharing.
- ,,, et al.Guided care and the cost of complex healthcare: a preliminary report.Am J Manag Care.2009;15(8):555–559.
- ,.Hospital‐physician gainsharing in cardiology.Health Aff (Millwood).2008;27(3):803–812.
- ,,,.AOA Symposium. Gainsharing in orthopaedics: passing fancy or wave of the future?J Bone Joint Surg Am.2007;89(9):2075–2083.
- All Patient Defined Diagnosis Related Groups™ ‐ 3M Health Information Systems,St Paul, MN.
- ,,, et al.Guided care and the cost of complex healthcare: a preliminary report.Am J Manag Care.2009;15(8):555–559.
- .Best practices in record completion.J Med Pract Manage.2004;20(1):18–22.
- ,,, et al.Return on investment in pay for performance: a diabetes case study.J Healthc Manag.2006;51(6):365–374; discussion 375‐376.
- .Use of pay for performance in a community hospital private hospitalists group: a preliminary report.Trans Am Clin Climatol Assoc.2007;188:263–272.
- .Making the grade with pay for performance: 7 lessons from best‐performing hospitals.Healthc Financ Manage.2006;60(12):79–85.
- ,,,,.Impact of a pay‐for‐performance incentive on support for smoking cessation and on smoking prevalence among people with diabetes.CMAJ.2007;176(12):1705–1710.
- ,,, et al,Effects of paying physicians based on their relative performance for quality.J Gen Intern Med.2007;22(6):872–876.
- ,.Pay for performance alone cannot drive quality.Arch Pediatr Adolesc Med.2007;161(7):650–655.
- .What's the return? Assessing the effect of “pay‐for‐performance” initiatives on the quality of care delivery.Med Care Res Rev.2006;63(1 suppl)( ):29S–48S.
- ,,,,.Aligning financial incentives with “Get With the Guidelines” to improve cardiovascular care.Am J Manag Care.2004;10(7 pt 2):501–504.
- .Sampling best practices. Managing delinquent records.J AHIMA.1997;68(8):28,30.
- ,.Pay for performance: an overview of the literature.Am J Med Qual.2009;24;140–163.
- ,,.Physician‐level P4P:DOA? Can quality‐based payments be resuscitated?Am J Manag Care.2007;13(5):233–236.
- ,,, et al.Will pay for performance and quality reporting affect health care disparities?Health Aff (Millwood).2007;26(3):w405–w414.
- ,,.The experience of pay for performance in English family practice: a qualitative study.Ann Fam Med.2008;8(3):228–234.
- ,,, et al.Will financial incentives stimulate quality improvement? Reactions from frontline physicians.Am J Med Qual.2006;21(6):367–374.
- ,,.Pay for performance in orthopedic surgery.Clin Orthop Relat Res.2007;457:87–95.
- ,.Pay for performance survey of diagnostic radiology faculty and trainees.J Am Coll Radiol.2007;4(6):411–415.
Hospitals are challenged to improve quality while reducing costs, yet traditional methods of cost containment have had limited success in aligning the goals of hospitals and physicians. Physicians directly control more than 80% of total medical costs.1 The current fee‐for‐service system encourages procedures and the use of hospital resources. Without the proper incentives to gain active participation and collaboration of the medical staff in improving the efficiency of care, the ability to manage medical costs and improve hospital operational and financial performance is hampered. A further challenge is to encourage physicians to improve the quality of care and maintain safe medical practice. While several examples of pay‐for‐performance (P4P) have previously been attempted to increase efficiency, gainsharing offers real opportunities to achieve these outcomes.
Previous reports regarding the results of gainsharing programs describe its use in outpatient settings and its limited ability to reduce costs for inpatient care for surgical implants such as coronary stents2 or orthopedic prostheses.3 The present study represents the largest series to date using a gainsharing model in a comprehensive program of inpatient care at a tertiary care medical center.
Patients and Methods
Beth Israel Medical Center is a 1000‐bed tertiary care university‐affiliated teaching hospital, located in New York City. The hospital serves a large and ethnically diverse community predominantly located in the lower east side of Manhattan and discharged about 50,000 patients per year during the study period of July 2006 through June 2009.
Applied Medical Software, Inc. (AMS, Collingswood, NJ) analyzed hospital data for case mix and severity. To establish best practice norms (BPNs), AMS used inpatient discharge data (UB‐92) to determine costs by APR‐DRG's4 during calendar year 2005, prior to the inception of the program to establish BPNs. Costs were allocated into specific areas listed in Table 1. A minimum of 10 cases was necessary in each DRG. Cost outliers (as defined by the mean cost of the APR DRG plus 3 standard deviations) were excluded. These data were used to establish a baseline for each physician and a BPN, which was set at the top 25th percentile for each specific APR DRG. BPNs were determined after exclusions using the following criteria:
Each eligible physician had to have at least 10 admissions within their specialty;
Each eligible DRG had to have at least 5 qualifying physicians within a medical specialty;
Each eligible APR DRG had to have at least 3 qualifying admissions;
If the above criteria are met, the BPN was set at the mean of the top 25th percentile of physicians (25% of the physicians with the lowest costs).
| |
| Per diem hospital bed cost | Pharmacy |
| Critical care (ICU and CCU) | Laboratory |
| Medical surgical supplies and implants | Cardiopulmonary care |
| Operating room costs | Blood bank |
| Radiology | Intravenous therapy |
Once BPNs were determined, patients were grouped by physician and compared to the BPN for a particular APR DRG. All patients of participating physicians with qualifying APR DRGs were included in the analysis reports summarizing these results, computed quarterly and distributed to each physician. Obstetrical and psychiatric admissions were excluded in the program. APR DRG data for each physician was compared from year to year to determine whether an individual physician demonstrated measurable improvement in performance.
The gainsharing program was implemented in 2006. Physician participation was voluntary. Payments were made to physicians without any risk or penalties from participation. Incentives were based on individual performance. Incentives for nonsurgical admissions were intended to offset the loss of physician income related to more efficient medical management and a reduced hospital length of stay (LOS). Income for surgical admissions was intended to reward physicians for efficient preoperative and postoperative care.
The methodology provides financial incentives for physicians for each hospital discharge in 2 ways:
Improvement in costs per case against their own historical performance;
Cost per case performance compared to BPN.
In the first year of the gainsharing program, two thirds of the total allowable incentive payments were allocated to physicians' improvement, with one third based on a performance metric. Payments for improvement were phased out over the first 3 years of the gainsharing program, with payments focused fully on performance in Year 3. Cases were adjusted for case‐mix and severity of illness (four levels of APR DRG). Physicians were not penalized for any cases in which costs greatly exceeded BPN. A floor was placed at the BPN and no additional financial incentives were paid for surpassing it. Baselines and BPNs were recalculated yearly.
A key aspect of the gainsharing program was the establishment of specific quality parameters (Table 2) that need to be met before any incentive payments were made. A committee regularly reviewed the quality performance data of each physician to determine eligibility for payments. Physicians were considered to be ineligible for incentive compensation until the next measurement period if there was evidence of failure to adequately meet these measures. At least 80% compliance with core measures (minimum 5 discharges in each domain) was expected. Infectious complication rates were to remain not more than 1 standard deviation above National Healthcare Safety Network rates during the same time period. In addition, payments were withheld from physicians if it was found that the standard of care was not met for any morbidity or mortality that was peer reviewed or if there were any significant patient complaints. Readmission rates were expected to remain at or below the baseline established during the previous 12 months by DRG.
| Quality Measure | Goal |
|---|---|
| |
| Readmissions within 7 days for the same or related diagnosis | Decrease, or less than 10% of discharges |
| Documentationquality and timeliness of medical record and related documentation including date, time, and sign all chart entries | No more than 20% of average monthly discharged medical records incomplete for more than 30 days |
| Consultation with social work/discharge planner within 24 hours of admission for appropriate pts | >80% of all appropriate cases |
| Timely switch from intravenous to oral antibiotics in accordance with hospital policy (%) | >80 |
| Unanticipated return to the operating room | Decrease or < 5% |
| Patient complaints | Decrease |
| Patient satisfaction (HCAHPS) | >75% physician domain |
| Ventilator associated pneumonia | Decrease or < 5% |
| Central line associated blood stream infections | Decrease or < 5 per 1000 catheter days. |
| Surgical site infections | Decrease or within 1 standard deviation of NHSN |
| Antibiotic prophylaxis (%) | >80 |
| Inpatient mortality | Decrease or <1% |
| Medication errors | Decrease or <1% |
| Delinquent medical records | <5 charts delinquent more than 30 days |
| Falls with injury | Decrease or <1% |
| AMI: aspirin on arrival and discharge (%) | >80 |
| AMI‐ACEI or ARB for LVSD (%) | >80 |
| Adult smoking cessation counseling (%) | >80 |
| AMI‐ Beta blocker prescribed at arrival and discharge (%) | >80 |
| CHF: discharge instructions (%) | >80 |
| CHF: Left ventricular function assessment (%) | >80 |
| CHF: ACEI or ARB for left ventricular systolic dysfunction (%) | >80 |
| CHF: smoking cessation counseling (%) | >80 |
| Pneumonia: O2 assessment, pneumococcal vaccine, blood culture and sensitivity before first antibiotic, smoking cessation counseling (%) | >80 |
Employed and private practice community physicians were both eligible for the gainsharing program. Physician participation in the program was voluntary. All patients admitted to the Medical Center received notification on admission about the program. The aggregate costs by DRG were calculated quarterly. Savings over the previous yearif anywere calculated. A total of 20% of the savings was used to administer the program and for incentive payments to physicians.
From July 1, 2006 through September 2008, only commercial managed care cases were eligible for this program. As a result of the approval of the gainsharing program as a demonstration project by the Centers for Medicare and Medicaid Services (CMS), Medicare cases were added to the program starting October 1, 2008.
Physician Payment Calculation Methodology
Performance Incentive
The performance incentive was intended to reward demonstrated levels of performance. Accordingly, a physician's share in hospital savings was in proportion to the relationship between their individual performance and the BPN. This computation was the same for both surgical and medical admissions. The following equation illustrates the computation of performance incentives for participating physicians:
This computation was made at the specific severity level for each hospital discharge. Payment for the performance incentive was made only to physicians at or below the 90th percentile of physicians.
Improvement Incentive
The improvement incentive was intended to encourage positive change. No payments were made from the improvement incentive unless an individual physician demonstrated measurable improvement in operational performance for either surgical or medical admissions. However, because physicians who admitted nonsurgical cases experienced reduced income as they help the hospital to improve operational performance, the methodology for calculating the improvement incentive was different for medical as opposed to surgical cases, as shown below.
For Medical DRGs:
For each severity level the following is calculated:
For Surgical DRGs:
Cost savings were calculated quarterly and defined as the cost per case before the gainsharing program began minus the actual case cost by APR DRG. Student's t‐test was used for continuous data and the categorical data trends were analyzed using Mantel‐Haenszel Chi‐Square.
At least every 6 months, all participating physicians received case‐specific and cost‐centered data about their discharges. They also received a careful explanation of opportunities for financial or quality improvement.
Results
Over the 3‐year period, 184 physicians enrolled, representing 54% of those eligible. The remainder of physicians either decided not to enroll or were not eligible due to inadequate number of index DRG cases or excluded diagnoses. Payer mix was 27% Medicare and 48% of the discharges were commercial and managed care. The remaining cases were a combination of Medicaid and self‐pay. A total of 29,535 commercial and managed care discharges were evaluated from participating physicians (58%) and 20,360 similar discharges from non‐participating physicians. This number of admissions accounted for 29% of all hospital discharges during this time period. Surgical admissions accounted for 43% and nonsurgical admissions for 57%. The distribution of patients by service is shown in Table 3. Pulmonary and cardiology diagnoses were the most frequent reasons for medical admissions. General and head and neck surgery were the most frequent surgical admissions. During the time period of the gainsharing program, the medical center saved $25.1 million for costs attributed to these cases. Participating physicians saved $6.9 million more than non‐participating physicians (P = 0.02, Figure 1), but all discharges demonstrated cost savings during the study period. Cost savings (Figure 2) resulted from savings in medical/surgical supplies and implants (35%), daily hospital costs, (28%), intensive care unit costs (16%) and coronary care unit costs (15%), and operating room costs (8%). Reduction in cost from reduced magnetic resonance imaging (MRI) use was not statistically significant. There were minimal increases in costs due to computed tomography (CT) scan use, cardiopulmonary care, laboratory use, pharmacy and blood bank, but none of these reached statistical significance.
| Admissions by Service | Number (%) |
|---|---|
| |
| Cardiology | 4512 (15.3) |
| Orthopedic surgery | 3994 (13.5) |
| Gastroenterology | 3214 (10.9) |
| General surgery | 2908 (9.8) |
| Cardiovascular surgery | 2432 (8.2) |
| Pulmonary | 2212 (7.5) |
| Neurology | 2064 (7.0) |
| Oncology | 1217 (4.1) |
| Infectious disease | 1171 (4.0) |
| Endocrinology | 906 (3.1) |
| Nephrology | 826 (2.8) |
| Open heart surgery | 656 (2.2) |
| Interventional cardiology | 624 (2.1) |
| Gynecological surgery | 450 (1.5) |
| Urological surgery | 326 (1.1) |
| ENT surgery | 289 (1.0) |
| Obstetrics without delivery | 261 (0.9) |
| Hematology | 253 (0.9) |
| Orthopedicsnonsurgical | 241 (0.8) |
| Rehabilitation | 204 (0.7) |
| Otolaryngology | 183 (0.6) |
| Rheumatology | 165 (0.6) |
| General medicine | 162 (0.5) |
| Neurological surgery | 112 (0.4) |
| Urology | 101 (0.3) |
| Dermatology | 52 (0.2) |
| Grand total | 29535 (100.0) |
Hospital LOS decreased 9.8% from baseline among participating doctors, while LOS decreased 9.0% among non‐participating physicians; this difference was not statistically significant (P = 0.6). Participating physicians reduced costs by an average of $7,871 per quarter, compared to a reduction in costs by $3,018 for admissions by non‐participating physicians (P < 0.0001). The average savings per admission for the participating physicians were $1,835, and for non‐participating physicians were $1,107, a difference of $728 per admission. Overall, cost savings during the three year period averaged $105,000 per physician who participated in the program and $67,000 per physician who did not (P < 0.05). There was not a statistical difference in savings between medical and surgical admissions (P = 0.24).
Deviations from quality thresholds were identified during this time period. Some or all of the gainsharing income was withheld from 8% of participating physicians due to quality issues, incomplete medical records, or administrative reasons. Payouts to participating physicians averaged $1,866 quarterly (range $0‐$27,631). Overall, 9.4% of the hospital savings was directly paid to the participating physicians. Compliance with core measures improved in the following domains from year 2006 to 2009; acute myocardial infarction 94% to 98%, congestive heart failure 76% to 93%, pneumonia 88% to 97%, and surgical care improvement project 90% to 97%, (P = 0.17). There was no measurable increase in 30‐day mortality or readmission by APR‐DRG. The number of incomplete medical records decreased from an average of 43% of the total number of records in the second quarter of 2006 to 30% in the second quarter of 2009 (P < 0.0001). Other quality indicators remained statistically unchanged.
Discussion
The promise of gainsharing may motivate physicians to decrease hospital costs while maintaining quality medical care, since it aligns physician and hospital incentives. Providing a reward to physicians creates positive reinforcement, which is more effective than warnings against poor performing physicians (carrot vs. stick).5, 6 This study is the first and largest of its kind to show the results of a gainsharing program for inpatient medical and surgical admissions and demonstrates that significant cost savings may be achieved. This is similar to previous studies that have shown positive outcomes for pay‐for‐performance programs.7
Participating physicians in the present study accumulated almost $7 million more in savings than non‐participating physicians. Over time this difference has increased, possibly due to a learning curve in educating participating physicians and the way in which information about their performance is given back to them. A significant portion of the hospital's cost savings was through improvements in documentation and completion of medical records. While there was an actual reduction in average length of stay (ALOS), better documentation may also have contributed to adjusting the severity level within each DRG.
Using financial incentives to positively impact on physician behavior is not new. One program in a community‐based hospitalist group reported similar improvements in medical record documentation, as well as improvements in physician meeting attendance and quality goals.8 Another study found that such hospital programs noted improved physician engagement and commitment to best practices and to improving the quality of care.9
There is significant experience in the outpatient setting using pay‐for‐performance programs to enhance quality. Millett et al.10 demonstrated a reduction in smoking among patients with diabetes in a program in the United Kingdom. Another study in Rochester, New York that used pay‐for‐performance incentives demonstrated better diabetes management.11 Mandel and Kotagal12 demonstrated improved asthma care utilizing a quality incentive program.
The use of financial motivation for physicians, as part of a hospital pay‐for‐performance program, has been shown to lead to improvements in quality performance scores when compared to non pay‐for‐performance hospitals.13 Berthiaume demonstrated decreased costs and improvements in risk‐adjusted complications and risk‐adjusted LOS in patents admitted for acute coronary intervention in a pay‐for‐performance program.14 Quality initiatives were integral for the gainsharing program, since measures such as surgical site infections may increase LOS and hospital costs. Core measures related to the care of patients with acute myocardial infarction, heart failure, pneumonia, and surgical prophylaxis steadily improved since the initiation of the gainsharing program. Gainsharing programs also enhance physician compliance with administrative responsibilities such as the completion of medical records.
One unexpected finding of our study was that there was a cost savings per admission even in the patients of physicians who did not participate in the gainsharing program. While the participating physicians showed statistically significant improvements in cost savings, savings were found in both groups. This raises the question as to whether these cost reductions could have been impacted by other factors such as new labor or vendor contracts, better documentation, improved operating room utilization and improved and timely documentation in the medical record. Another possibility is the Hawthorne effect on physicians, who altered their behavior with knowledge that process and outcome measurement were being measured. Physicians who voluntarily sign up for a gainsharing program would be expected to be more committed to the success of this program than physicians who decide to opt out. While this might appear to be a selection bias it does illustrate the point that motivated physicians are more likely to positively change their practice behaviors. However, one might suggest that financial savings directly attributed to the gainsharing program was not the $25.1 million saved during the 3 years overall, but the difference between participating and non‐participating physicians, or $6.9 million.
While the motivation to complete medical records was significant (gainsharing dollars were withheld from doctors with more than 5 incomplete charts for more than 30 days) it was not the only reason why the number of delinquent chart percentage decreased during the study period. While the improvement was significant, there are still more opportunities to reduce the number of incomplete charts. Hospital regulatory inspections and periodic physician education were also likely to have reduced the number of incomplete inpatient charts during this time period and may do so in the future.15
The program focused on the physician activities that have the greatest impact on hospital costs. While optimizing laboratory, blood bank, and pharmacy management decreased hospital costs; we found that improvements in patient LOS, days in an intensive care unit, and management of surgical implants had the greatest impact on costs. Orthopedic surgeons began to use different implants, and all surgeons refrained from opening disposable surgical supplies until needed. Patients in intensive care unit beds stable for transfer were moved to regular medical/surgical rooms earlier. Since the program helped physicians understand the importance of LOS, many physicians increased their rounding on weekends and considered LOS implications before ordering diagnostic procedures that could be performed as an outpatient. Nurses, physician extenders such as physician assistants, and social workers have played an important role in streamlining patient care and hospital discharge; however, they were not directly rewarded under this program.
There are challenges to aligning the incentives of internists compared to procedure‐based specialists. This may be that the result of surgeons receiving payment for bundled care and thus the incentives are already aligned. The incentive of the program for internists, who get paid for each per daily visit, was intended to overcome the lost income resulting from an earlier discharge. Moreover, in the present study, only the discharging physician received incentive payments for each case. Patient care is undoubtedly a team effort and many physicians (radiologists, anesthesiologists, pathologists, emergency medicine physicians, consultant specialty physicians, etc.) are clearly left out in the present gainsharing program. Aligning the incentives of these physicians might be necessary. Furthermore, the actions of other members of the medical team and consultants, by their behaviors, could limit the incentive payments for the discharging physician. The discharging physician is often unable to control the transfer of a patient from a high‐cost or severity unit, or improve the timeliness of consulting physicians. Previous authors have raised the issue as to whether a physician should be prevented from payment because of the actions of another member of the medical team.16
Ensuring a fair and transparent system is important in any pay‐for‐performance program. The present gainsharing program required sophisticated data analysis, which added to the costs of the program. To implement such a program, data must be clear and understandable, segregated by DRG and severity adjusted. But should the highest reward payments go to those who perform the best or improve the most? In the present study, some physicians were consistently unable to meet quality benchmarks. This may be related to several factors, 1 of which might be a particular physician's case mix. Some authors have raised concerns that pay‐for‐performance programs may unfairly impact physicians who care for more challenging or patients from disadvantaged socioeconomic circumstances.17 Other authors have questioned whether widespread implementation of such a program could potentially increase healthcare disparities in the community.18 It has been suggested by Greene and Nash that for a program to be successful, physicians who feel they provide good care yet but are not rewarded should be given an independent review.16 Such a process is important to prevent resentment among physicians who are unable to meet benchmarks for payment, despite hard work.19 Conversely, other studies have found that many physicians who receive payments in a pay‐for‐performance system do not necessarily consciously make improvement to enhance financial performance.20 Only 54% of eligible physicians participated in the present gainsharing program. This is likely due to lack of understanding about the program, misperceptions about the ethics of such programs, perceived possible negative patient outcome, conflict of interest and mistrust.21, 22 This underscores the importance of providing understandable performance results, education, and a physician champion to help facilitate communication and enhanced outcomes. What is clear is that the perception by participating physicians is that this program is worthwhile as the number of participating physicians has steadily increased and it has become an incentive for new providers to choose this medical center over others.
In conclusion, the results of the present study show that physicians can help hospitals reduce inpatients costs while maintaining or improving hospital quality. Improvements in patient LOS, implant costs, overall costs per admission, and medical record completion were noted. Further work is needed to improve physician education and better understand the impact of uneven physician case mix. Further efforts are necessary to allow other members of the health care team to participate and benefit from gainsharing.
- ,,, et al.Guided care and the cost of complex healthcare: a preliminary report.Am J Manag Care.2009;15(8):555–559.
- ,.Hospital‐physician gainsharing in cardiology.Health Aff (Millwood).2008;27(3):803–812.
- ,,,.AOA Symposium. Gainsharing in orthopaedics: passing fancy or wave of the future?J Bone Joint Surg Am.2007;89(9):2075–2083.
- All Patient Defined Diagnosis Related Groups™ ‐ 3M Health Information Systems,St Paul, MN.
- ,,, et al.Guided care and the cost of complex healthcare: a preliminary report.Am J Manag Care.2009;15(8):555–559.
- .Best practices in record completion.J Med Pract Manage.2004;20(1):18–22.
- ,,, et al.Return on investment in pay for performance: a diabetes case study.J Healthc Manag.2006;51(6):365–374; discussion 375‐376.
- .Use of pay for performance in a community hospital private hospitalists group: a preliminary report.Trans Am Clin Climatol Assoc.2007;188:263–272.
- .Making the grade with pay for performance: 7 lessons from best‐performing hospitals.Healthc Financ Manage.2006;60(12):79–85.
- ,,,,.Impact of a pay‐for‐performance incentive on support for smoking cessation and on smoking prevalence among people with diabetes.CMAJ.2007;176(12):1705–1710.
- ,,, et al,Effects of paying physicians based on their relative performance for quality.J Gen Intern Med.2007;22(6):872–876.
- ,.Pay for performance alone cannot drive quality.Arch Pediatr Adolesc Med.2007;161(7):650–655.
- .What's the return? Assessing the effect of “pay‐for‐performance” initiatives on the quality of care delivery.Med Care Res Rev.2006;63(1 suppl)( ):29S–48S.
- ,,,,.Aligning financial incentives with “Get With the Guidelines” to improve cardiovascular care.Am J Manag Care.2004;10(7 pt 2):501–504.
- .Sampling best practices. Managing delinquent records.J AHIMA.1997;68(8):28,30.
- ,.Pay for performance: an overview of the literature.Am J Med Qual.2009;24;140–163.
- ,,.Physician‐level P4P:DOA? Can quality‐based payments be resuscitated?Am J Manag Care.2007;13(5):233–236.
- ,,, et al.Will pay for performance and quality reporting affect health care disparities?Health Aff (Millwood).2007;26(3):w405–w414.
- ,,.The experience of pay for performance in English family practice: a qualitative study.Ann Fam Med.2008;8(3):228–234.
- ,,, et al.Will financial incentives stimulate quality improvement? Reactions from frontline physicians.Am J Med Qual.2006;21(6):367–374.
- ,,.Pay for performance in orthopedic surgery.Clin Orthop Relat Res.2007;457:87–95.
- ,.Pay for performance survey of diagnostic radiology faculty and trainees.J Am Coll Radiol.2007;4(6):411–415.
- ,,, et al.Guided care and the cost of complex healthcare: a preliminary report.Am J Manag Care.2009;15(8):555–559.
- ,.Hospital‐physician gainsharing in cardiology.Health Aff (Millwood).2008;27(3):803–812.
- ,,,.AOA Symposium. Gainsharing in orthopaedics: passing fancy or wave of the future?J Bone Joint Surg Am.2007;89(9):2075–2083.
- All Patient Defined Diagnosis Related Groups™ ‐ 3M Health Information Systems,St Paul, MN.
- ,,, et al.Guided care and the cost of complex healthcare: a preliminary report.Am J Manag Care.2009;15(8):555–559.
- .Best practices in record completion.J Med Pract Manage.2004;20(1):18–22.
- ,,, et al.Return on investment in pay for performance: a diabetes case study.J Healthc Manag.2006;51(6):365–374; discussion 375‐376.
- .Use of pay for performance in a community hospital private hospitalists group: a preliminary report.Trans Am Clin Climatol Assoc.2007;188:263–272.
- .Making the grade with pay for performance: 7 lessons from best‐performing hospitals.Healthc Financ Manage.2006;60(12):79–85.
- ,,,,.Impact of a pay‐for‐performance incentive on support for smoking cessation and on smoking prevalence among people with diabetes.CMAJ.2007;176(12):1705–1710.
- ,,, et al,Effects of paying physicians based on their relative performance for quality.J Gen Intern Med.2007;22(6):872–876.
- ,.Pay for performance alone cannot drive quality.Arch Pediatr Adolesc Med.2007;161(7):650–655.
- .What's the return? Assessing the effect of “pay‐for‐performance” initiatives on the quality of care delivery.Med Care Res Rev.2006;63(1 suppl)( ):29S–48S.
- ,,,,.Aligning financial incentives with “Get With the Guidelines” to improve cardiovascular care.Am J Manag Care.2004;10(7 pt 2):501–504.
- .Sampling best practices. Managing delinquent records.J AHIMA.1997;68(8):28,30.
- ,.Pay for performance: an overview of the literature.Am J Med Qual.2009;24;140–163.
- ,,.Physician‐level P4P:DOA? Can quality‐based payments be resuscitated?Am J Manag Care.2007;13(5):233–236.
- ,,, et al.Will pay for performance and quality reporting affect health care disparities?Health Aff (Millwood).2007;26(3):w405–w414.
- ,,.The experience of pay for performance in English family practice: a qualitative study.Ann Fam Med.2008;8(3):228–234.
- ,,, et al.Will financial incentives stimulate quality improvement? Reactions from frontline physicians.Am J Med Qual.2006;21(6):367–374.
- ,,.Pay for performance in orthopedic surgery.Clin Orthop Relat Res.2007;457:87–95.
- ,.Pay for performance survey of diagnostic radiology faculty and trainees.J Am Coll Radiol.2007;4(6):411–415.
Copyright © 2010 Society of Hospital Medicine

Establishing a Rapid Response Team
Medical emergency teams (METs) were introduced more than a decade ago in Australia and the United Kingdom to rapidly identify and manage seriously ill patients at risk of cardiopulmonary arrest and other high‐risk conditions.1 METs, known in the United States as rapid response teams (RRTs), have been slow to be adopted thus far but are quickly gaining ground. Despite numerous studies indicating long‐term patient outcomes are poor following cardiac resuscitation in the hospital, the benefits of early intervention have sometimes been overlooked.25 Several observational studies and a retrospective analysis that included the Medical Emergency Response Improvement Team (MERIT) in Pittsburgh showed that introduction of a MET apparently has the potential to decrease the incidence of unanticipated intensive care unit (ICU) admissions and in‐hospital morbidity and mortality from unexpected cardiopulmonary arrest.69 Furthermore, the use of a MET as a quality improvement tool to detect medical errors and effect systemwide interventions is promising.10 Most recently, the Institute for Healthcare Improvement (IHI) and the American Hospital Association challenged health care organizations to redesign patient safety systems to prevent avoidable deaths in its 100K Lives Campaign. One of the 6 proposed core interventions was the deployment of rapid response teams at the first sign of patient decline.11
Despite these reports of success, a recent large cluster‐randomized controlled trial did not yield the same positive results. In this well‐designed study of 23 Australian hospitals, the Medical Early Response, Intervention and Therapy (MERIT) study investigators found the incidence of cardiac arrest, unplanned ICU admissions, and unexpected death essentially unchanged despite large increases in how often the emergency team was called.12 One possible explanation why these findings conflicted with previous favorable results is that the ultimate impact of a MET may depend on the effectiveness of implementation strategies. To derive the benefits of a MET/RRT, hospitals must increasingly focus on identifying barriers to implementation and address practical issues that may undermine their long‐term effectiveness.
In this article we describe in detail the process of establishing an RRT at our urban, academic hospital and the modifications that became necessary as we rolled out the intervention and encountered obstacles. This analysis was undertaken as a quality improvement (QI) activity. To our knowledge, this is one of the few recent published descriptions of the experiences of implementing an RRT in the United States since earlier work in Pittsburgh.9, 13
METHODS
Temple University Hospital is a tertiary care academic hospital in urban Philadelphia, Pennsylvania. Our RRT was first implemented July 1, 2004, and in the first 12 months of initiation, it was activated 307 times. The RRT at Temple University Hospital was designed to be accessible 24 hours a day, 7 days a week. The daytime team (8 am‐5 pm) is composed of an attending physician (a hospitalist trained as a general internist), a senior internal medicine resident, a critical care nurse, a nurse manager, a pharmacist, and a respiratory therapist. In addition, both a transporter and a member of the admissions office respond to all rapid response team calls but do not get clinically involved in patient care. For nighttime (5 pm‐8 am) and weekend coverage the hospitalist is replaced by an on‐site pulmonary critical care physician, but the remainder of the team is unchanged. All RRT members carry beepers synchronized to provide the location of an RRT activation. In addition, all RRT calls are simultaneously announced on the overhead paging system. No changes were made to the existing cardiac arrest team (code team) at the hospital, which remained a 24‐hour response team for patients found to be in true cardiopulmonary arrest and was comprised of on‐call internal medicine house staff (but no hospitalist attending physician), a respiratory therapist, a pharmacist, a critical care nurse, a nurse manager, and, most notably, an anesthesiologist for emergent intubation and airway management.
The RRT was intended for use within the physical confines of Temple University Hospital and its immediately adjacent grounds. Within the hospital the main locations defined were: inpatient areas, including patient rooms and hallways of the medical‐surgical units of the inpatient tower, as well as the burn, coronary, medical, neurological, neurosurgical, and surgical intensive care units; off‐unit/procedural areas, including diagnostic/emnterventional radiology, the gastroenterology endoscopy suite, the pulmonary procedure suite and pulmonary function lab, the cardiac catheterization/ECHO/stress Lab, the inpatient dialysis unit, and the physical therapy gym, all areas where inpatients are routinely transported during their hospital admission for workup/treatment and where outpatients go for scheduled procedures and therapies; and outpatient/common areas, including all the general medical and subspecialty outpatient clinics in 2 separate outpatient towers (Outpatient Building and Parkinson Pavilion) with direct access from the main hospital building, the outpatient pharmacy, the elevators, the hallways in the outpatient sections of the hospital, all lobbies, and the immediately adjacent outside grounds.
Prior to the launch date of the RRT, clinical criteria were established to help guide staff about when an RRT might be called (Fig. 1). These were based in part on early literature on the clinical markers that most often precede clinical deterioration.14, 15 In addition, 2 much broader categories for RRT activation were added (Inability to reach the patient's primary team of treating physicians for any of the above and Any potentially serious medical errors or adverse events) in order to minimize the need for a very specific physiologic definition to be met in order to activate the team. Physicians, nurses, and other staff with significant daily contact with inpatients and outpatients were in‐serviced about the purpose of the RRT and how to activate the system via the hospital paging operator. Laminated cards with RRT criteria were distributed to all hospital personnel, and educational posters were displayed prominently throughout the hospital.
Each RRT event was to be assessed by team members using a standardized evaluation form (Fig. 2), with primary responsibility going to the physician team leader. In the initial phases of implementation, these forms were kept in the offices of the Section of Hospital Medicine for the use of hospitalist attending physician team leaders. Later on in the year they were kept in the pharmacist's RRT medication bag. These forms were collected at the completion of each RRT event or faxed to a central location and then entered into a database maintained by the hospital's Department of Patient Safety Operations. Weekly debriefing meetings to review all RRT events from the preceding week were attended by representatives from patient safety, respiratory, nursing, hospital medicine, and the pharmacy. Attempts were made to identify the issues that led to selected RRT activations, to obtain patient follow‐up from the clinical event, and to evaluate the performance of the team. Throughout these weekly meetings, QI strategies for improving the effectiveness of the RRT were identified and implemented.
The core outcome measures that were used to assess RRT performance were: appropriateness of the RRT activation, percentage of patients who were stabilized, percentage of patients who were transferred to a higher level of care, and overall team performance.
In the weekly meeting of the RRT evaluation committee, at which each RRT was reviewed by the clinical team, each scenario and details of the event were reviewed to determine whether the RRT activation was appropriate, whether the intervention was successful, and whether there were any issues with the team performance. After a thorough discussion of each case and review of additional data from the chart if necessary, the RRT evaluation committee reached a consensus about each of these measures.
We also tracked the number of code team activations from the year preceding establishment of the RRT (2003‐2004) through the year during which the RRT was established (2004‐2005). Because all calls for both the RRT and the code team go first to the hospital operator, we reviewed the hospital paging operators' logs for the entire 12‐month period to track the rate of code team events to RRT events on a monthly basis.
RESULTS
In a 12‐month period, the RRT was activated 307 times, as recorded in the hospital operator logs. In the year preceding inception of the RRT, there were 272 code team activations. In the first 12 months concurrent with RRT implementation, the code team was activated 258 times. Overall, at their discretion the team leaders converted 13% of the 307 RRT activations to traditional code team activations.
There were 11 RRT activations in July, the first month of implementation, and 14 activations in the second month. At that point, the internal hospital newsletter released a feature on the new RRT, and our patient safety officer/director of patient safety operations made a concerted effort to educate hospital administration and the Graduate Medical Education Committee (GMEC); as a result, utilization picked up. From September onward through the remainder of the academic year, an average of 28 RRT activations occurred each month (range 20‐37), whereas an average of 22 codes took place each month (range 12‐27). The numbers of RRT versus code team activations are plotted in Figure 3. A trend line for the number of code team activations per month in 2003, the year prior to implementation of the RRT, was added for comparison; it conveys the slight overall decrease in the number of codes as the RRT took effect (average of 23 codes per month, range 15‐31).
Physician evaluation forms were returned for 170 of the 307 RRT events (55%). The main inpatient tower was the site of 42% of these RRT activations, followed by the outpatient/common areas, where 19% of the activations occurred, and off‐unit/procedural areas, the site of 18%. Table 2 provides information on specific location, reason for call, and disposition of a sample of the RRT activations in the non‐inpatient areas. Time of day was noted in 76.8% of events. Of these, 82.9% occurred during the traditional day shift (7 am‐7 pm) and 17.1% on night shift (7 pm‐7 am). Most RRT activations occurred between 8 am and 4 pm. Daytime events heavily outnumbered nighttime events regardless of location.
Physician team leaders largely believed a specific underlying clinical diagnosis was responsible for 59% of the RRT activations, followed by adverse drug reactions (3.5%), physician error (1.8%), and nursing error (0.6%). When an underlying clinical diagnosis or organ system was suspected, it was most frequently pulmonary (32%), followed by neurological (14%) and cardiac (11%). It was believed that 32% of events were for other reason not listed. Table 1 provides the breakdown of other underlying diagnoses in RRT events.
| Pulmonary | 32% |
| Hypoxia/Respiratory Distress (32%) | |
| Neurological | 14% |
| Change of mental status (7%) | |
| Syncope (7%) | |
| Cardiac | 11% |
| Hypotension (8%) | |
| Arrhythmia (2%) | |
| Hypertension (1%) | |
| Hematologic | 2% |
| Bleeding (2%) | |
| Endocrine | 1% |
| Hypoglycemia (1%) | |
| Other reason not listed | 32% |
| No reason given | 9% |
| Location | Reason for RRT call | Disposition | |
|---|---|---|---|
| Outpatient clinical | Outpatient orthopedics | Dysrhythmia | ED |
| Outpatient medicine clinic | Hypoxia/respiratory Distress | Stabilized | |
| Outpatient urology | Vomiting | ED | |
| Outpatient Parkinson | Asthma | ED | |
| Outpatient Parkinson | Seizure | ED | |
| Common area/nonclinical | Preadmissions testing | Changed mental status | Unknown |
| Admissions | Changed mental status | Stabilized | |
| Hypoxia/respiratory distress | Stabilized | ||
| Syncope/bradycardia | ED | ||
| Security | Syncope | Improved | |
| Lobby | Hypoxia/respiratory distress | Unknown | |
| Changed mental status | ED | ||
| Hypoxia/respiratory distress | Improved | ||
| Procedures/Off‐unit clinical | Stress test lab | Hypoxia/respiratory distress | Improved |
| Cardiac catheterization lab | Chest pain | ED | |
| Diagnostic imaging | Changed mental status | Improved | |
| Mucus plug in tracheostomy | Improved | ||
| Seizure | ICU | ||
| Syncope | ED | ||
| Hypoxia/respiratory distress | Unknown | ||
| Hypoglycemia | ED | ||
| Dialysis | Bleeding | Stabilized | |
| Gastroenterology procedures | Hypoxia/respiratory distress | ICU | |
| Hypoxia/respiratory distress | Stabilized | ||
| Hypoxia/respiratory distress | ICU | ||
| Interventional radiology | Hypotension/dehydration | Unknown | |
| Hypoxia/respiratory distress | ICU | ||
| Changed mental status | Stabilized | ||
| Hypoxia/Respiratory distress | ICU | ||
| Hypoxia/Respiratory distress | ICU | ||
| Changed mental status | ED | ||
| Hypoxia/Respiratory distress | ICU | ||
| MRI | Hypoxia/Respiratory distress | ED | |
| Hypoxia/respiratory distress | ED | ||
| Hypoxia/respiratory distress | ED | ||
| Changed mental status | ED | ||
| Occupational therapy | Hypotension | ED | |
| Physical therapy | Hypotension | Stabilized | |
| Physical medicine/rehab | Hypoxia/respiratory distress | Unknown | |
| Short procedure unit | Syncope | Stabilized | |
| Hypotension | ICU |
In the judgment of evaluators, the system was utilized appropriately in 98% of the evaluated events. Eighty‐five percent of RRT activations were believed to have prevented further clinical deterioration, though it was also thought that 3% of patients deteriorated despite the efforts of the team. Disposition of the patient following an RRT event was noted 87% of the time, and it was believed that 88% of the patients were stabilized. Of the formally evaluated RRT events, team members were largely satisfied with the response and the functioning of the team, stating for 68% of the events that the team performed without a problem.
Problems Identified and Addressed During Implementation
Though it was encouraging that those surveyed believed the team performed without a problem in 68% of the activations, another way to look at it is that team performance was inadequate in 32% of the cases. Any issues cited on the evaluation sheets, ranging from delays in arrival of team members to missing/delayed arrival of equipment, were seen as opportunities for improvement. For example, very early on in the implementation process, team leaders specifically noted repeatedly encountering a diagnosis of suspected hypoglycemia in patients with a known history of diabetes found with altered mental status. Early clinical assessments by the RRT were severely limited and judged problematic without a simple way to objectively rule out this possibility and/or to attempt immediate treatment, especially because this frequently occurred in non‐inpatient settings. Team members suggested and quickly obtained approval to carry both glucometers and glucose tablets and Glucagon in the pharmacist's fanny pack. In another case, our respiratory therapists arrived promptly to the scene of an RRT call for shortness of breath but were hampered by lack of readily available oxygen tanks. This was promptly remedied, at the recommendation of the committee, by placing additional oxygen tanks near all hospital security stations. Placement of code (crash) carts has also been modified to increase accessibility, especially in nonclinical areas, where delays were perceived to have contributed to poor outcomes. In the future, alphanumeric pagers will be used to allow for more specific and efficient deployment of the team.
Other changes that have been made include the addition to respiratory/pharmacy fanny packs of other key medications such as lorazepam for seizures, equipment such as peripheral catheters for intravenous access, and syringes/needles. It is hoped that in the near future, a state‐of‐the‐art point‐of‐care blood‐testing device, I‐stat, capable of quickly analyzing a blood sample for basic stat lab tests will be added to the pack to expedite triage.16 Perhaps most important, the committee reached a consensus that to improve and encourage real‐time evaluations, it might be best to have the RRT evaluation forms and other paperwork at the point of care to increase yield. The pharmacist now carries blank forms in the fanny pack for convenience. Early on in our RRT implementation process, all these items were noted to be lacking at various times and were requested by team leaders, nurses, and pharmacists in order to be better prepared for various clinical scenarios. In addition, ongoing analysis of the most common RRT diagnoses in the database guided our final decisions in order to keep the size of the fanny pack down to a minimum while providing crucial equipment.
DISCUSSION
We have found the RRT to be an effective but challenging‐to‐implement QI intervention to increase patient safety at our academic institution. The Australian MERIT investigators recently suggested that despite growing evidence of the benefits of MET/RRT systems, long‐term success may depend most on effective implementation strategies.12 We experienced firsthand these challenges in the first year of our new RRT system.
Large system changes in a hospital are especially fraught with danger because of the unique aspects of health care delivery systems. As Reid commented in an editorial about the emerging use of the MET system in the United Kingdom, Despite potential advantages to patients, ensuring appropriate utilization was difficult because of cultural barriers. Traditional hierarchical behaviors that dictate how doctors and nurses react and work got in the way of people calling these life saving teams.17
Our weekly multidisciplinary RRT debriefings were the most crucial component of our implementation strategy. Many latent systems issues were uncovered, as well as more subtle problems such as lack of coordination of care, communication errors, gaps in patient handoffs or sign‐out. Previous studies by the Pittsburgh MERIT team have validated such retrospective categorization of errors uncovered by MET responses.10
However, neither that group nor the Australian MERIT study investigators specifically addressed the importance of the feedback process in RRT implementation. A strength of our system is that modifications to the RRT are made prospectively and in real time based on feedback from active RRT members during debriefing. In fact, the success of our RRT underscores the importance of open communication among hospitalists, house staff, nurses, pharmacists, and ancillary staff in multidisciplinary patient safety and QI endeavors. Everything from the responsibilities of team members to equipment evolved over the 12‐month period in order to improve the function and effectiveness of the team and was almost entirely based on feedback from the RRT doctors and nurses on the front lines. Suggestions from the evaluation forms were given serious consideration at every RRT evaluation committee debriefing. By optimizing the efficient operation of the RRT, we hope to continue to improve outcomes.
We believe a key to the success of our debriefing process was the constant attendance of our patient safety officer/chief medical officer and director of patient safety operations, who both encouraged active participation. Early on in the process, comments were made principally by physician and critical care nurse RRT members, and the dynamic was a bit one‐sided. However, we quickly saw a noticeable and sustained increase in participation by pharmacists and respiratory therapists, and by year's end, they had offered some of the most valuable practical suggestions, which resulted in a more efficient response. As the year went on and real changes were made quickly, all groups were much more vocal and willing to bounce ideas around the room, and the team dynamic and spirit of the group effort improved substantially.
Previous studies have focused on the impact of METs/RRTs on the rate of inpatient cardiac arrests. However, we found that nearly as many RRT events occurred off the inpatient units, for instance, when admitted patients were transported to other areas such as radiology, procedural suites, physical therapy, or dialysis and when scheduled outpatients arrived for their appointments. In addition, a large number of RRT calls came from outpatient departments and common areas of the hospital such as lobbies, hallways, and waiting rooms, mostly involving outpatients and visitors, but not infrequently hospital employees were involved as well. This unexpected and, to our knowledge, previously unreported finding is mirrored in the distribution of RRT activations throughout the course of the day. Most events occurred during the traditional day shift of 7 am‐7 pm, and were heavily clustered between 8 am and 4 pm. In most American hospitals, these are the hours during which outpatients and visitors make up a significant proportion of the hospital population and during which most elective procedures on inpatients occur. Prior to the introduction of our RRT, no specific system was in place for emergent triage, assessment, and expedited treatment of off‐unit patients, outpatients, and visitors. Most often, the code team was mobilized, sometimes taking them to remote locations and making them unavailable for true inpatient cardiopulmonary arrests. Our RRT seems to have the potential to fill a much‐needed gap in patient safety, offering off‐unit patients, outpatients, and visitors a safety net while in our hospital. No prior descriptions of RRT or MET implementation have touched on this area. It would be interesting to see if other hospitals with RRTs have had a similar experience in order to determine whether having an RRT dedicated specifically to the outpatient and common areas of the hospital might provide even more targeted efforts and efficient response times. Thus, the benefits of our RRT seemed to extend beyond a simple reduction in the number of in‐hospital cardiopulmonary arrests and into an unanticipated patient safety black hole.
Implementation of the RRT specifically in academic medical centers has been limited to date. In our opinion, the academic environment is an ideal area for RRTs (because the most critically ill patients often are cared for on teaching services by junior house officers), but it is also a challenging arena in which to make change (because of the complex hierarchy of teaching hospitals). We chose to have an attending physician lead our RRT efforts for the most part. However, residents always participated, and not infrequently led, as key team members. As a commentator on the Australian RRT system pointed out, it is important that junior medical staff [feel empowered] to call for immediate assistance when they are concerned about their patient, but may not have the experience, knowledge, confidence or skills necessary to manage them appropriately.18 We believe that the RRT serves as a valuable educational forum for resident education. Academic centers that develop RRTs must work to integrate the teams into an educational context while simultaneously providing patients with the most experienced and knowledgeable clinical team to address their needs at a time when appropriate clinical decision making is critical. Therefore, the residents who participate in our RRT are formally evaluated by the hospitalists using a standard program evaluation form that encompasses the Accreditation Council for Graduate Medical Education (ACGME) core competencies.19
Through the first year of our RRT system and beyond, activation of the code team and RRT shifted as more RRT activations were recorded and fewer codes were called. Concerted educational efforts and reinforcement of the criteria for calling the RRT had a definite sustained impact of helping staff to become comfortable with using the system. At our institution, it has been difficult to definitively conclude whether RRT calls prevented codes or merely substituted for them at times, especially because 13% of all RRT activations were subsequently converted to code team calls. The Australian MERIT study investigators, despite an excellent study design of a large multicenter trial, also were unable to demonstrate a true decrease in the cardiac arrest rate.12 Much more significant to us, especially in the first year of implementation, was learning that the vast majority of physician RRT leaders perceived activation of the team to occur appropriately and to play a role in preventing clinical deterioration of patients. None of the other RRT or MET implementation studies that we reviewed commented specifically on these areas. It will be interesting to continue to follow these trends, as we expect the use of RRTs to become even more defined. Over time, we will no doubt be better able to determine whether RRTs have a true, sustained impact on preventing patient deterioration and inpatient cardiopulmonary arrests while maintaining a high rate of physician satisfaction that the team is being activated for legitimate reasons.
Our descriptive study had some limitations. The number of RRT evaluations received, while adequate for preliminary analysis, may not accurately represent the 307 activations of the system that occurred in the first 12 months. We suspect that this underreporting, especially in the first half of the year, was in large part a result of relying on team leaders to voluntarily return data forms at the conclusion of each RRT event. RRT evaluations in the second half of the year were more actively distributed at the point of care to the team leader directly by the pharmacist and were more diligently followed up on. Forms are now readily available in the team pharmacist's fanny pack, which was done because of quality improvement feedback from physicians at a debriefing meeting. Since those interventions, there has been a dramatic improvement in the capture of event data and the timely submission of forms. We expect and have demanded close to a 100% return of the forms in the second year of our RRT system, which will vastly improve our analysis. We were also surprised that despite the comprehensiveness of our RRT activation criteria, 32% of physicians were unable to find a match with a clinical indication on the list, indicating unanticipated reasons for calling an RRT. We will continually strive to improve the specificity of future data for planning purposes and training initiatives. However, in some way this confirms our belief that RRTs occur for such a wide variety of reasons that they cannot always be limited to the major clinical categories. On a similar note, we regret not adding a specific category under Outcomes on the evaluation form to include the possibility that RRT members might have offered palliative care or changes in code/do not resuscitate (DNR) status to patients or families. Given that our hospital has both a code team and an RRT begs the question of whether mortality rates might be affected if patients who prior to the RRT might have had a full resuscitation effort were made DNR. In the future, this would be an interesting issue to consider in analysis. Carefully categorizing RRT events is critical to continued success. Further work involving formal team skills training for RRT members, including use of the medical school's clinical simulators for mock RRT scenarios, is planned. These sessions are planned to review performance and clinical decision making for the most common scenarios that we have found to be involved in RRT activations. The 307 activations of the RRT in our first year have clearly set us on the path toward defining predictive rules and directed skills training for earlier identification of patient problems. Further outcome analyses of these efforts will be crucial.
CONCLUSIONS
An RRT was successfully introduced into an academic medical center. The team was heavily utilized in the first 12 months after the program was initiated, especially for off‐unit inpatients and those in outpatient/common areas, perhaps filling a gap in hospital patient safety. The keys to the early success of implementation of our RRT were multidisciplinary input and improvements made in real time. The long‐term effects of the RRT on the culture of patient safety in our institution and throughout the United States remain to be seen but are promising.
- ,,,.The medical emergency team.Anaesth Intensive Care.1995;23(2):183–186.
- ,,, et al.Quality of cardiopulmonary resuscitation during in‐hospital cardiac arrest.JAMA.2005;293:363–365.
- ,,.In‐hospital cardiopulmonary resuscitation.Medicine.1995;74:163–175.
- ,,, et al.In‐hospital cardiac arrest: survival depends mainly on the effectiveness of the emergency response.Resuscitation.2004;62:291–297.
- ,,.Factors influencing survival after in‐hospital cardiopulmonary resuscitation.Resuscitation.2005;66:317–321.
- ,,, et al.A prospective before‐and‐after trial of a medical emergency team.Med J Aust.2003;179:283–287.
- ,,,,,.Effects of a medical emergency team on reduction of incidence of and mortality from unexpected cardiac arrests in hospital: preliminary study.Br Med J.2002;324:1–5.
- ,,, et al.Rates of in‐hospital arrests, deaths and intensive care admissions: the effect of a medical emergency team.Med J Aust.2000;173:236–204.
- ,,,,,.Use of medical emergency team responses to reduce hospital cardiopulmonary arrests.Qual Saf Health Care.2004;13:251–254.
- ,,,,,.Use of medical emergency team (MET) responses to detect medical errors.Qual Saf Health Care.2004;13:255–259.
- Institute for Healthcare Improvement. 100K Lives Campaign [IHI website]. Available at: http://www.ihi.org/IHI/Programs/campaign. Accessed November 10,2005.
- ,,, et al.Introduction of the medical emergency team (MET) system: a cluster‐randomised controlled trial.Lancet.2005;365:2091–2097.
- ,,, et al.Improving the utilization of medical crisis teams (condition C) at an urban tertiary care hospital.J Crit Care.2003;18(2):87–94.
- ,.Developing strategies to prevent in‐hospital cardiac arrest: analyzing responses of physicians and nurses in the hours before the event.Crit Care Med.1994;22:244–247.
- ,,,,.Clinical Antecedents to In‐Hospital Cardiopulmonary Arrest.Chest.1990;98:1388–1392.
- Abbot Point of Care: Abbot Laboratories Online. Available at: http://www.istat.com/website/www/products/analyzers.htm. Accessed November 10,2005.
- .Developing and implementing organisational practice that delivers better, safer care.Qual Saf Health Care.2004;13:247.
- ,.The medical emergency team: does it really make a difference?Intern Med J.2003;33:511–514.
- Accreditation Council for Graduate Medical Education (ACGME). Program requirements for residency education in internal medicine. Effective July 2003; revised July 1, 2004. Available at: http://www.acgme.org/acWebsite/downloads/RRC_progReq/140pr703_u704.pdf. Accessed February 17,2006.
Medical emergency teams (METs) were introduced more than a decade ago in Australia and the United Kingdom to rapidly identify and manage seriously ill patients at risk of cardiopulmonary arrest and other high‐risk conditions.1 METs, known in the United States as rapid response teams (RRTs), have been slow to be adopted thus far but are quickly gaining ground. Despite numerous studies indicating long‐term patient outcomes are poor following cardiac resuscitation in the hospital, the benefits of early intervention have sometimes been overlooked.25 Several observational studies and a retrospective analysis that included the Medical Emergency Response Improvement Team (MERIT) in Pittsburgh showed that introduction of a MET apparently has the potential to decrease the incidence of unanticipated intensive care unit (ICU) admissions and in‐hospital morbidity and mortality from unexpected cardiopulmonary arrest.69 Furthermore, the use of a MET as a quality improvement tool to detect medical errors and effect systemwide interventions is promising.10 Most recently, the Institute for Healthcare Improvement (IHI) and the American Hospital Association challenged health care organizations to redesign patient safety systems to prevent avoidable deaths in its 100K Lives Campaign. One of the 6 proposed core interventions was the deployment of rapid response teams at the first sign of patient decline.11
Despite these reports of success, a recent large cluster‐randomized controlled trial did not yield the same positive results. In this well‐designed study of 23 Australian hospitals, the Medical Early Response, Intervention and Therapy (MERIT) study investigators found the incidence of cardiac arrest, unplanned ICU admissions, and unexpected death essentially unchanged despite large increases in how often the emergency team was called.12 One possible explanation why these findings conflicted with previous favorable results is that the ultimate impact of a MET may depend on the effectiveness of implementation strategies. To derive the benefits of a MET/RRT, hospitals must increasingly focus on identifying barriers to implementation and address practical issues that may undermine their long‐term effectiveness.
In this article we describe in detail the process of establishing an RRT at our urban, academic hospital and the modifications that became necessary as we rolled out the intervention and encountered obstacles. This analysis was undertaken as a quality improvement (QI) activity. To our knowledge, this is one of the few recent published descriptions of the experiences of implementing an RRT in the United States since earlier work in Pittsburgh.9, 13
METHODS
Temple University Hospital is a tertiary care academic hospital in urban Philadelphia, Pennsylvania. Our RRT was first implemented July 1, 2004, and in the first 12 months of initiation, it was activated 307 times. The RRT at Temple University Hospital was designed to be accessible 24 hours a day, 7 days a week. The daytime team (8 am‐5 pm) is composed of an attending physician (a hospitalist trained as a general internist), a senior internal medicine resident, a critical care nurse, a nurse manager, a pharmacist, and a respiratory therapist. In addition, both a transporter and a member of the admissions office respond to all rapid response team calls but do not get clinically involved in patient care. For nighttime (5 pm‐8 am) and weekend coverage the hospitalist is replaced by an on‐site pulmonary critical care physician, but the remainder of the team is unchanged. All RRT members carry beepers synchronized to provide the location of an RRT activation. In addition, all RRT calls are simultaneously announced on the overhead paging system. No changes were made to the existing cardiac arrest team (code team) at the hospital, which remained a 24‐hour response team for patients found to be in true cardiopulmonary arrest and was comprised of on‐call internal medicine house staff (but no hospitalist attending physician), a respiratory therapist, a pharmacist, a critical care nurse, a nurse manager, and, most notably, an anesthesiologist for emergent intubation and airway management.
The RRT was intended for use within the physical confines of Temple University Hospital and its immediately adjacent grounds. Within the hospital the main locations defined were: inpatient areas, including patient rooms and hallways of the medical‐surgical units of the inpatient tower, as well as the burn, coronary, medical, neurological, neurosurgical, and surgical intensive care units; off‐unit/procedural areas, including diagnostic/emnterventional radiology, the gastroenterology endoscopy suite, the pulmonary procedure suite and pulmonary function lab, the cardiac catheterization/ECHO/stress Lab, the inpatient dialysis unit, and the physical therapy gym, all areas where inpatients are routinely transported during their hospital admission for workup/treatment and where outpatients go for scheduled procedures and therapies; and outpatient/common areas, including all the general medical and subspecialty outpatient clinics in 2 separate outpatient towers (Outpatient Building and Parkinson Pavilion) with direct access from the main hospital building, the outpatient pharmacy, the elevators, the hallways in the outpatient sections of the hospital, all lobbies, and the immediately adjacent outside grounds.
Prior to the launch date of the RRT, clinical criteria were established to help guide staff about when an RRT might be called (Fig. 1). These were based in part on early literature on the clinical markers that most often precede clinical deterioration.14, 15 In addition, 2 much broader categories for RRT activation were added (Inability to reach the patient's primary team of treating physicians for any of the above and Any potentially serious medical errors or adverse events) in order to minimize the need for a very specific physiologic definition to be met in order to activate the team. Physicians, nurses, and other staff with significant daily contact with inpatients and outpatients were in‐serviced about the purpose of the RRT and how to activate the system via the hospital paging operator. Laminated cards with RRT criteria were distributed to all hospital personnel, and educational posters were displayed prominently throughout the hospital.
Each RRT event was to be assessed by team members using a standardized evaluation form (Fig. 2), with primary responsibility going to the physician team leader. In the initial phases of implementation, these forms were kept in the offices of the Section of Hospital Medicine for the use of hospitalist attending physician team leaders. Later on in the year they were kept in the pharmacist's RRT medication bag. These forms were collected at the completion of each RRT event or faxed to a central location and then entered into a database maintained by the hospital's Department of Patient Safety Operations. Weekly debriefing meetings to review all RRT events from the preceding week were attended by representatives from patient safety, respiratory, nursing, hospital medicine, and the pharmacy. Attempts were made to identify the issues that led to selected RRT activations, to obtain patient follow‐up from the clinical event, and to evaluate the performance of the team. Throughout these weekly meetings, QI strategies for improving the effectiveness of the RRT were identified and implemented.
The core outcome measures that were used to assess RRT performance were: appropriateness of the RRT activation, percentage of patients who were stabilized, percentage of patients who were transferred to a higher level of care, and overall team performance.
In the weekly meeting of the RRT evaluation committee, at which each RRT was reviewed by the clinical team, each scenario and details of the event were reviewed to determine whether the RRT activation was appropriate, whether the intervention was successful, and whether there were any issues with the team performance. After a thorough discussion of each case and review of additional data from the chart if necessary, the RRT evaluation committee reached a consensus about each of these measures.
We also tracked the number of code team activations from the year preceding establishment of the RRT (2003‐2004) through the year during which the RRT was established (2004‐2005). Because all calls for both the RRT and the code team go first to the hospital operator, we reviewed the hospital paging operators' logs for the entire 12‐month period to track the rate of code team events to RRT events on a monthly basis.
RESULTS
In a 12‐month period, the RRT was activated 307 times, as recorded in the hospital operator logs. In the year preceding inception of the RRT, there were 272 code team activations. In the first 12 months concurrent with RRT implementation, the code team was activated 258 times. Overall, at their discretion the team leaders converted 13% of the 307 RRT activations to traditional code team activations.
There were 11 RRT activations in July, the first month of implementation, and 14 activations in the second month. At that point, the internal hospital newsletter released a feature on the new RRT, and our patient safety officer/director of patient safety operations made a concerted effort to educate hospital administration and the Graduate Medical Education Committee (GMEC); as a result, utilization picked up. From September onward through the remainder of the academic year, an average of 28 RRT activations occurred each month (range 20‐37), whereas an average of 22 codes took place each month (range 12‐27). The numbers of RRT versus code team activations are plotted in Figure 3. A trend line for the number of code team activations per month in 2003, the year prior to implementation of the RRT, was added for comparison; it conveys the slight overall decrease in the number of codes as the RRT took effect (average of 23 codes per month, range 15‐31).
Physician evaluation forms were returned for 170 of the 307 RRT events (55%). The main inpatient tower was the site of 42% of these RRT activations, followed by the outpatient/common areas, where 19% of the activations occurred, and off‐unit/procedural areas, the site of 18%. Table 2 provides information on specific location, reason for call, and disposition of a sample of the RRT activations in the non‐inpatient areas. Time of day was noted in 76.8% of events. Of these, 82.9% occurred during the traditional day shift (7 am‐7 pm) and 17.1% on night shift (7 pm‐7 am). Most RRT activations occurred between 8 am and 4 pm. Daytime events heavily outnumbered nighttime events regardless of location.
Physician team leaders largely believed a specific underlying clinical diagnosis was responsible for 59% of the RRT activations, followed by adverse drug reactions (3.5%), physician error (1.8%), and nursing error (0.6%). When an underlying clinical diagnosis or organ system was suspected, it was most frequently pulmonary (32%), followed by neurological (14%) and cardiac (11%). It was believed that 32% of events were for other reason not listed. Table 1 provides the breakdown of other underlying diagnoses in RRT events.
| Pulmonary | 32% |
| Hypoxia/Respiratory Distress (32%) | |
| Neurological | 14% |
| Change of mental status (7%) | |
| Syncope (7%) | |
| Cardiac | 11% |
| Hypotension (8%) | |
| Arrhythmia (2%) | |
| Hypertension (1%) | |
| Hematologic | 2% |
| Bleeding (2%) | |
| Endocrine | 1% |
| Hypoglycemia (1%) | |
| Other reason not listed | 32% |
| No reason given | 9% |
| Location | Reason for RRT call | Disposition | |
|---|---|---|---|
| Outpatient clinical | Outpatient orthopedics | Dysrhythmia | ED |
| Outpatient medicine clinic | Hypoxia/respiratory Distress | Stabilized | |
| Outpatient urology | Vomiting | ED | |
| Outpatient Parkinson | Asthma | ED | |
| Outpatient Parkinson | Seizure | ED | |
| Common area/nonclinical | Preadmissions testing | Changed mental status | Unknown |
| Admissions | Changed mental status | Stabilized | |
| Hypoxia/respiratory distress | Stabilized | ||
| Syncope/bradycardia | ED | ||
| Security | Syncope | Improved | |
| Lobby | Hypoxia/respiratory distress | Unknown | |
| Changed mental status | ED | ||
| Hypoxia/respiratory distress | Improved | ||
| Procedures/Off‐unit clinical | Stress test lab | Hypoxia/respiratory distress | Improved |
| Cardiac catheterization lab | Chest pain | ED | |
| Diagnostic imaging | Changed mental status | Improved | |
| Mucus plug in tracheostomy | Improved | ||
| Seizure | ICU | ||
| Syncope | ED | ||
| Hypoxia/respiratory distress | Unknown | ||
| Hypoglycemia | ED | ||
| Dialysis | Bleeding | Stabilized | |
| Gastroenterology procedures | Hypoxia/respiratory distress | ICU | |
| Hypoxia/respiratory distress | Stabilized | ||
| Hypoxia/respiratory distress | ICU | ||
| Interventional radiology | Hypotension/dehydration | Unknown | |
| Hypoxia/respiratory distress | ICU | ||
| Changed mental status | Stabilized | ||
| Hypoxia/Respiratory distress | ICU | ||
| Hypoxia/Respiratory distress | ICU | ||
| Changed mental status | ED | ||
| Hypoxia/Respiratory distress | ICU | ||
| MRI | Hypoxia/Respiratory distress | ED | |
| Hypoxia/respiratory distress | ED | ||
| Hypoxia/respiratory distress | ED | ||
| Changed mental status | ED | ||
| Occupational therapy | Hypotension | ED | |
| Physical therapy | Hypotension | Stabilized | |
| Physical medicine/rehab | Hypoxia/respiratory distress | Unknown | |
| Short procedure unit | Syncope | Stabilized | |
| Hypotension | ICU |
In the judgment of evaluators, the system was utilized appropriately in 98% of the evaluated events. Eighty‐five percent of RRT activations were believed to have prevented further clinical deterioration, though it was also thought that 3% of patients deteriorated despite the efforts of the team. Disposition of the patient following an RRT event was noted 87% of the time, and it was believed that 88% of the patients were stabilized. Of the formally evaluated RRT events, team members were largely satisfied with the response and the functioning of the team, stating for 68% of the events that the team performed without a problem.
Problems Identified and Addressed During Implementation
Though it was encouraging that those surveyed believed the team performed without a problem in 68% of the activations, another way to look at it is that team performance was inadequate in 32% of the cases. Any issues cited on the evaluation sheets, ranging from delays in arrival of team members to missing/delayed arrival of equipment, were seen as opportunities for improvement. For example, very early on in the implementation process, team leaders specifically noted repeatedly encountering a diagnosis of suspected hypoglycemia in patients with a known history of diabetes found with altered mental status. Early clinical assessments by the RRT were severely limited and judged problematic without a simple way to objectively rule out this possibility and/or to attempt immediate treatment, especially because this frequently occurred in non‐inpatient settings. Team members suggested and quickly obtained approval to carry both glucometers and glucose tablets and Glucagon in the pharmacist's fanny pack. In another case, our respiratory therapists arrived promptly to the scene of an RRT call for shortness of breath but were hampered by lack of readily available oxygen tanks. This was promptly remedied, at the recommendation of the committee, by placing additional oxygen tanks near all hospital security stations. Placement of code (crash) carts has also been modified to increase accessibility, especially in nonclinical areas, where delays were perceived to have contributed to poor outcomes. In the future, alphanumeric pagers will be used to allow for more specific and efficient deployment of the team.
Other changes that have been made include the addition to respiratory/pharmacy fanny packs of other key medications such as lorazepam for seizures, equipment such as peripheral catheters for intravenous access, and syringes/needles. It is hoped that in the near future, a state‐of‐the‐art point‐of‐care blood‐testing device, I‐stat, capable of quickly analyzing a blood sample for basic stat lab tests will be added to the pack to expedite triage.16 Perhaps most important, the committee reached a consensus that to improve and encourage real‐time evaluations, it might be best to have the RRT evaluation forms and other paperwork at the point of care to increase yield. The pharmacist now carries blank forms in the fanny pack for convenience. Early on in our RRT implementation process, all these items were noted to be lacking at various times and were requested by team leaders, nurses, and pharmacists in order to be better prepared for various clinical scenarios. In addition, ongoing analysis of the most common RRT diagnoses in the database guided our final decisions in order to keep the size of the fanny pack down to a minimum while providing crucial equipment.
DISCUSSION
We have found the RRT to be an effective but challenging‐to‐implement QI intervention to increase patient safety at our academic institution. The Australian MERIT investigators recently suggested that despite growing evidence of the benefits of MET/RRT systems, long‐term success may depend most on effective implementation strategies.12 We experienced firsthand these challenges in the first year of our new RRT system.
Large system changes in a hospital are especially fraught with danger because of the unique aspects of health care delivery systems. As Reid commented in an editorial about the emerging use of the MET system in the United Kingdom, Despite potential advantages to patients, ensuring appropriate utilization was difficult because of cultural barriers. Traditional hierarchical behaviors that dictate how doctors and nurses react and work got in the way of people calling these life saving teams.17
Our weekly multidisciplinary RRT debriefings were the most crucial component of our implementation strategy. Many latent systems issues were uncovered, as well as more subtle problems such as lack of coordination of care, communication errors, gaps in patient handoffs or sign‐out. Previous studies by the Pittsburgh MERIT team have validated such retrospective categorization of errors uncovered by MET responses.10
However, neither that group nor the Australian MERIT study investigators specifically addressed the importance of the feedback process in RRT implementation. A strength of our system is that modifications to the RRT are made prospectively and in real time based on feedback from active RRT members during debriefing. In fact, the success of our RRT underscores the importance of open communication among hospitalists, house staff, nurses, pharmacists, and ancillary staff in multidisciplinary patient safety and QI endeavors. Everything from the responsibilities of team members to equipment evolved over the 12‐month period in order to improve the function and effectiveness of the team and was almost entirely based on feedback from the RRT doctors and nurses on the front lines. Suggestions from the evaluation forms were given serious consideration at every RRT evaluation committee debriefing. By optimizing the efficient operation of the RRT, we hope to continue to improve outcomes.
We believe a key to the success of our debriefing process was the constant attendance of our patient safety officer/chief medical officer and director of patient safety operations, who both encouraged active participation. Early on in the process, comments were made principally by physician and critical care nurse RRT members, and the dynamic was a bit one‐sided. However, we quickly saw a noticeable and sustained increase in participation by pharmacists and respiratory therapists, and by year's end, they had offered some of the most valuable practical suggestions, which resulted in a more efficient response. As the year went on and real changes were made quickly, all groups were much more vocal and willing to bounce ideas around the room, and the team dynamic and spirit of the group effort improved substantially.
Previous studies have focused on the impact of METs/RRTs on the rate of inpatient cardiac arrests. However, we found that nearly as many RRT events occurred off the inpatient units, for instance, when admitted patients were transported to other areas such as radiology, procedural suites, physical therapy, or dialysis and when scheduled outpatients arrived for their appointments. In addition, a large number of RRT calls came from outpatient departments and common areas of the hospital such as lobbies, hallways, and waiting rooms, mostly involving outpatients and visitors, but not infrequently hospital employees were involved as well. This unexpected and, to our knowledge, previously unreported finding is mirrored in the distribution of RRT activations throughout the course of the day. Most events occurred during the traditional day shift of 7 am‐7 pm, and were heavily clustered between 8 am and 4 pm. In most American hospitals, these are the hours during which outpatients and visitors make up a significant proportion of the hospital population and during which most elective procedures on inpatients occur. Prior to the introduction of our RRT, no specific system was in place for emergent triage, assessment, and expedited treatment of off‐unit patients, outpatients, and visitors. Most often, the code team was mobilized, sometimes taking them to remote locations and making them unavailable for true inpatient cardiopulmonary arrests. Our RRT seems to have the potential to fill a much‐needed gap in patient safety, offering off‐unit patients, outpatients, and visitors a safety net while in our hospital. No prior descriptions of RRT or MET implementation have touched on this area. It would be interesting to see if other hospitals with RRTs have had a similar experience in order to determine whether having an RRT dedicated specifically to the outpatient and common areas of the hospital might provide even more targeted efforts and efficient response times. Thus, the benefits of our RRT seemed to extend beyond a simple reduction in the number of in‐hospital cardiopulmonary arrests and into an unanticipated patient safety black hole.
Implementation of the RRT specifically in academic medical centers has been limited to date. In our opinion, the academic environment is an ideal area for RRTs (because the most critically ill patients often are cared for on teaching services by junior house officers), but it is also a challenging arena in which to make change (because of the complex hierarchy of teaching hospitals). We chose to have an attending physician lead our RRT efforts for the most part. However, residents always participated, and not infrequently led, as key team members. As a commentator on the Australian RRT system pointed out, it is important that junior medical staff [feel empowered] to call for immediate assistance when they are concerned about their patient, but may not have the experience, knowledge, confidence or skills necessary to manage them appropriately.18 We believe that the RRT serves as a valuable educational forum for resident education. Academic centers that develop RRTs must work to integrate the teams into an educational context while simultaneously providing patients with the most experienced and knowledgeable clinical team to address their needs at a time when appropriate clinical decision making is critical. Therefore, the residents who participate in our RRT are formally evaluated by the hospitalists using a standard program evaluation form that encompasses the Accreditation Council for Graduate Medical Education (ACGME) core competencies.19
Through the first year of our RRT system and beyond, activation of the code team and RRT shifted as more RRT activations were recorded and fewer codes were called. Concerted educational efforts and reinforcement of the criteria for calling the RRT had a definite sustained impact of helping staff to become comfortable with using the system. At our institution, it has been difficult to definitively conclude whether RRT calls prevented codes or merely substituted for them at times, especially because 13% of all RRT activations were subsequently converted to code team calls. The Australian MERIT study investigators, despite an excellent study design of a large multicenter trial, also were unable to demonstrate a true decrease in the cardiac arrest rate.12 Much more significant to us, especially in the first year of implementation, was learning that the vast majority of physician RRT leaders perceived activation of the team to occur appropriately and to play a role in preventing clinical deterioration of patients. None of the other RRT or MET implementation studies that we reviewed commented specifically on these areas. It will be interesting to continue to follow these trends, as we expect the use of RRTs to become even more defined. Over time, we will no doubt be better able to determine whether RRTs have a true, sustained impact on preventing patient deterioration and inpatient cardiopulmonary arrests while maintaining a high rate of physician satisfaction that the team is being activated for legitimate reasons.
Our descriptive study had some limitations. The number of RRT evaluations received, while adequate for preliminary analysis, may not accurately represent the 307 activations of the system that occurred in the first 12 months. We suspect that this underreporting, especially in the first half of the year, was in large part a result of relying on team leaders to voluntarily return data forms at the conclusion of each RRT event. RRT evaluations in the second half of the year were more actively distributed at the point of care to the team leader directly by the pharmacist and were more diligently followed up on. Forms are now readily available in the team pharmacist's fanny pack, which was done because of quality improvement feedback from physicians at a debriefing meeting. Since those interventions, there has been a dramatic improvement in the capture of event data and the timely submission of forms. We expect and have demanded close to a 100% return of the forms in the second year of our RRT system, which will vastly improve our analysis. We were also surprised that despite the comprehensiveness of our RRT activation criteria, 32% of physicians were unable to find a match with a clinical indication on the list, indicating unanticipated reasons for calling an RRT. We will continually strive to improve the specificity of future data for planning purposes and training initiatives. However, in some way this confirms our belief that RRTs occur for such a wide variety of reasons that they cannot always be limited to the major clinical categories. On a similar note, we regret not adding a specific category under Outcomes on the evaluation form to include the possibility that RRT members might have offered palliative care or changes in code/do not resuscitate (DNR) status to patients or families. Given that our hospital has both a code team and an RRT begs the question of whether mortality rates might be affected if patients who prior to the RRT might have had a full resuscitation effort were made DNR. In the future, this would be an interesting issue to consider in analysis. Carefully categorizing RRT events is critical to continued success. Further work involving formal team skills training for RRT members, including use of the medical school's clinical simulators for mock RRT scenarios, is planned. These sessions are planned to review performance and clinical decision making for the most common scenarios that we have found to be involved in RRT activations. The 307 activations of the RRT in our first year have clearly set us on the path toward defining predictive rules and directed skills training for earlier identification of patient problems. Further outcome analyses of these efforts will be crucial.
CONCLUSIONS
An RRT was successfully introduced into an academic medical center. The team was heavily utilized in the first 12 months after the program was initiated, especially for off‐unit inpatients and those in outpatient/common areas, perhaps filling a gap in hospital patient safety. The keys to the early success of implementation of our RRT were multidisciplinary input and improvements made in real time. The long‐term effects of the RRT on the culture of patient safety in our institution and throughout the United States remain to be seen but are promising.
- ,,,.The medical emergency team.Anaesth Intensive Care.1995;23(2):183–186.
- ,,, et al.Quality of cardiopulmonary resuscitation during in‐hospital cardiac arrest.JAMA.2005;293:363–365.
- ,,.In‐hospital cardiopulmonary resuscitation.Medicine.1995;74:163–175.
- ,,, et al.In‐hospital cardiac arrest: survival depends mainly on the effectiveness of the emergency response.Resuscitation.2004;62:291–297.
- ,,.Factors influencing survival after in‐hospital cardiopulmonary resuscitation.Resuscitation.2005;66:317–321.
- ,,, et al.A prospective before‐and‐after trial of a medical emergency team.Med J Aust.2003;179:283–287.
- ,,,,,.Effects of a medical emergency team on reduction of incidence of and mortality from unexpected cardiac arrests in hospital: preliminary study.Br Med J.2002;324:1–5.
- ,,, et al.Rates of in‐hospital arrests, deaths and intensive care admissions: the effect of a medical emergency team.Med J Aust.2000;173:236–204.
- ,,,,,.Use of medical emergency team responses to reduce hospital cardiopulmonary arrests.Qual Saf Health Care.2004;13:251–254.
- ,,,,,.Use of medical emergency team (MET) responses to detect medical errors.Qual Saf Health Care.2004;13:255–259.
- Institute for Healthcare Improvement. 100K Lives Campaign [IHI website]. Available at: http://www.ihi.org/IHI/Programs/campaign. Accessed November 10,2005.
- ,,, et al.Introduction of the medical emergency team (MET) system: a cluster‐randomised controlled trial.Lancet.2005;365:2091–2097.
- ,,, et al.Improving the utilization of medical crisis teams (condition C) at an urban tertiary care hospital.J Crit Care.2003;18(2):87–94.
- ,.Developing strategies to prevent in‐hospital cardiac arrest: analyzing responses of physicians and nurses in the hours before the event.Crit Care Med.1994;22:244–247.
- ,,,,.Clinical Antecedents to In‐Hospital Cardiopulmonary Arrest.Chest.1990;98:1388–1392.
- Abbot Point of Care: Abbot Laboratories Online. Available at: http://www.istat.com/website/www/products/analyzers.htm. Accessed November 10,2005.
- .Developing and implementing organisational practice that delivers better, safer care.Qual Saf Health Care.2004;13:247.
- ,.The medical emergency team: does it really make a difference?Intern Med J.2003;33:511–514.
- Accreditation Council for Graduate Medical Education (ACGME). Program requirements for residency education in internal medicine. Effective July 2003; revised July 1, 2004. Available at: http://www.acgme.org/acWebsite/downloads/RRC_progReq/140pr703_u704.pdf. Accessed February 17,2006.
