User login
Hospitalist Perspective of Interactions with Medicine Subspecialty Consult Services
Hospitalist physicians care for an increasing proportion of general medicine inpatients and request a significant share of all subspecialty consultations.1 Subspecialty consultation in inpatient care is increasing,2,3 and effective hospitalist–consulting service interactions may affect team communication, patient care, and hospitalist learning. Therefore, enhancing hospitalist–consulting service interactions may have a broad-reaching, positive impact. Researchers in previous studies have explored resident–fellow consult interactions in the inpatient and emergency department settings as well as attending-to-attending consultation in the outpatient setting.4-7 However, to our knowledge, hospitalist–consulting team interactions have not been previously described. In academic medical centers, hospitalists are attending physicians who interact with both fellows (supervised by attending consultants) and directly with subspecialty attendings. Therefore, the exploration of the hospitalist–consultant interaction requires an evaluation of hospitalist–fellow and hospitalist–subspecialty attending interactions. The hospitalist–fellow interaction in particular is unique because it represents an unusual dynamic, in which an attending physician is primarily communicating with a trainee when requesting assistance with patient care.8 In order to explore hospitalist–consultant interactions (herein, the term “consultant” includes both fellow and attending consultants), we conducted a survey study in which we examine hospitalist practices and attitudes regarding consultation, with a specific focus on hospitalist consultation with internal medicine subspecialty consult services. In addition, we compared fellow–hospitalist and attending–hospitalist interactions and explored barriers to and facilitating factors of an effective hospitalist–consultant relationship.
METHODS
Survey Development
The survey instrument was developed by the authors based on findings of prior studies in which researchers examined consultation.2-6,9-16 The survey contained 31 questions (supplementary Appendix A) and evaluated 4 domains of the use of medical subspecialty consultation in direct patient care: (1) current consultation practices, (2) preferences regarding consultants, (3) barriers to and facilitating factors of effective consultation (both with respect to hospitalist learning and patient care), and (4) a comparison between hospitalist–fellow and hospitalist–subspecialty attending interactions. An evaluation of current consultation practices included a focus on communication methods (eg, in person, over the phone, through paging, or notes) because these have been found to be important during consultation.5,6,9,15,16 In order to explore hospitalist preferences regarding consult interactions and investigate perceptions of barriers to and facilitating factors of effective consultation, questions were developed based on previous literature, including our qualitative work examining resident–fellow interactions during consultation.4-6,9,12 We compared hospitalist consultation experiences among attending and fellow consultants because the interaction in which an attending hospitalist physician is primarily communicating with a trainee may differ from a consultation between a hospitalist attending and a subspecialty attending.8 Participants were asked to exclude their experiences when working on teaching services, during which students or housestaff often interact with consultants. The survey was cognitively tested with both hospitalist and non-hospitalist attending physicians not participating in the study and was revised by the authors using an iterative approach.
Study Participants
Hospitalist attending physicians at University of Texas Southwestern (UTSW) Medical Center, Emory University School of Medicine, Massachusetts General Hospital (MGH), and the Medical University of South Carolina (MUSC) were eligible to participate in the study. Consult team structures at each institution were composed of either a subspecialist-attending-only or a fellow-and-subspecialty-attending team. Fellows at all institutions are supervised by a subspecialty attending when performing consultations. Respondents who self-identified as nurse practitioners or physician assistants were excluded from the analysis. Hospitalists employed by the Veterans Affairs hospital system were also excluded. The study was approved by the institutional review boards of UTSW, Emory, MUSC, and MGH.
The survey was anonymous and administered to all hospitalists at participating institutions via a web-based survey tool (Qualtrics, Provo, UT). Participants were eligible to enter a raffle for a $500 gift card, and completion of the survey was not required for entry into the raffle.
Statistics
Results were summarized using the mean with standard deviation for continuous variables and the frequency with percentage for categorical variables after excluding missing values. All analyses were conducted using SAS version 9.4 (SAS Institute, Cary, NC). A 2-sided P value of ≤0.05 was considered statistically significant.
RESULTS
Current Consultation Practices
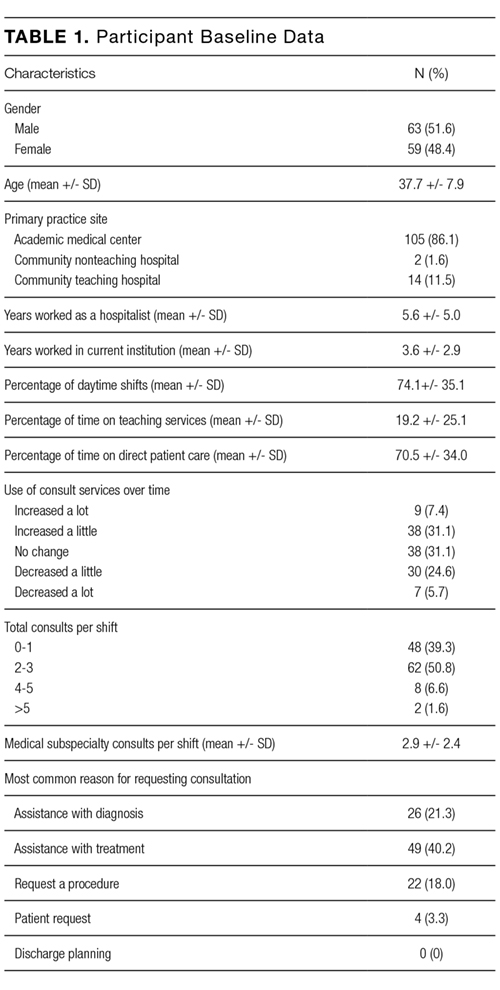
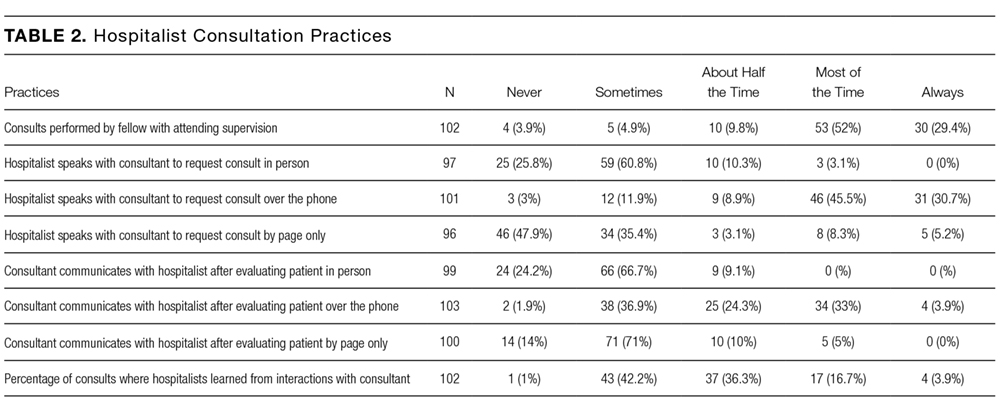
Current consultation practices and descriptions of hospitalist–consultant communication are shown in Table 2. Forty percent of respondents requested 0-1 consults per day, while 51.7% requested 2-3 per day. The most common reasons for requesting a consultation were assistance with treatment (48.5%), assistance with diagnosis (25.7%), and request for a procedure (21.8%). When asked whether the frequency of consultation is changing, slightly more hospitalists felt that their personal use of consultation was increasing as compared to those who felt that it was decreasing (38.5% vs 30.3%, respectively).
Hospitalist Preferences
Eighty-six percent of respondents agreed that consultants should be required to communicate their recommendations either in person or over the phone. Eighty-three percent of hospitalists agreed that they would like to receive more teaching from the consulting services, and 74.0% agreed that consultants should attempt to teach hospitalists during consult interactions regardless of whether the hospitalist initiates the teaching–learning interaction.
Barriers to and Facilitating Factors of Effective Consultation
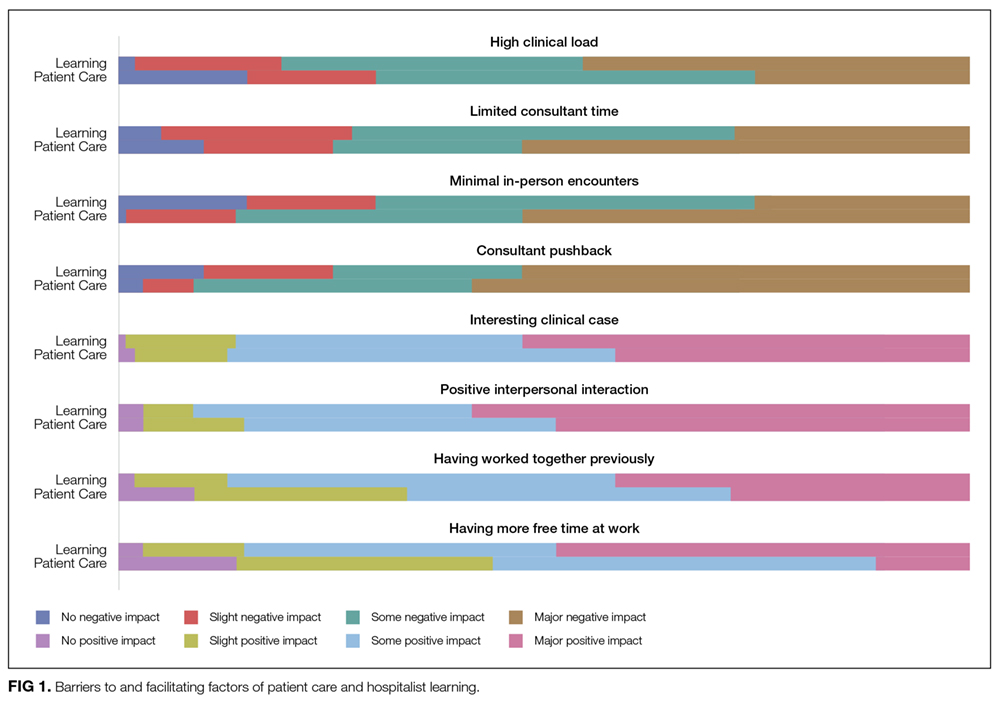
Participants reported that multiple factors affected patient care and their own learning during inpatient consultation (Figure 1). Consultant pushback, high hospitalist clinical workload, a perception that consultants had limited time, and minimal in-person interactions were all seen as factors that negatively affected the consult interaction. These generally affected both learning and patient care. Conversely, working on an interesting clinical case, more hospitalist free time, positive interaction with the consultant, and having previously worked with the consultant positively affected both learning and patient care (Figure 1).
Fellow Versus Attending Interactions
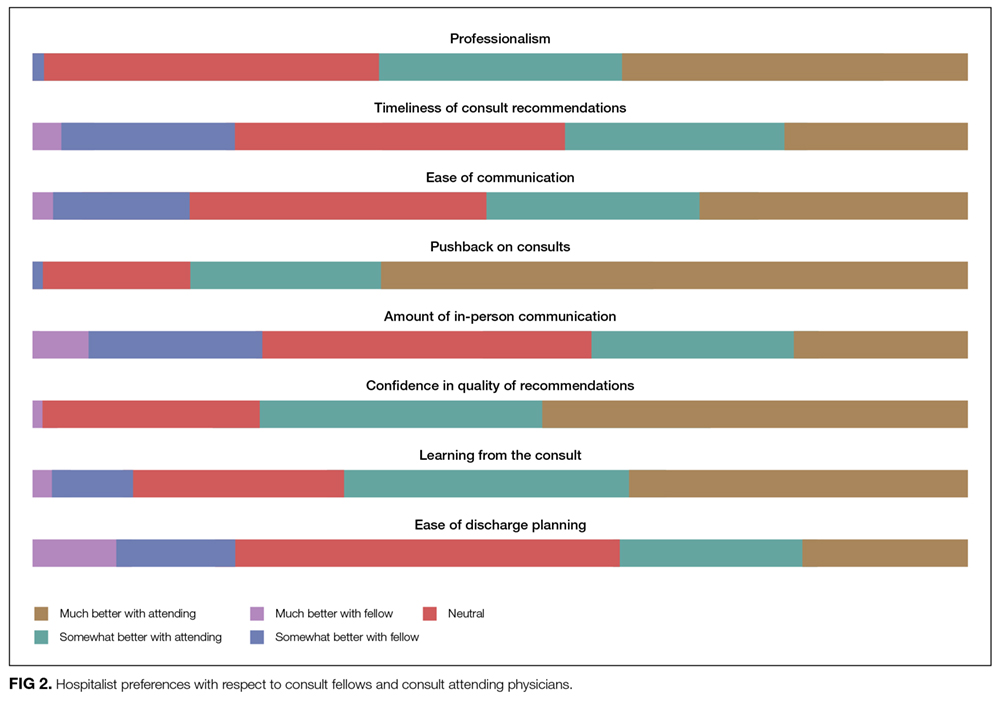
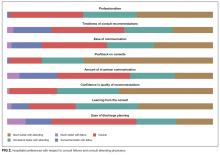
Respondents indicated that interacting directly with the consult attending was superior to hospitalist–fellow interactions in all aspects of care but particularly with respect to pushback, confidence in recommendations, professionalism, and hospitalist learning (Figure 2).
DISCUSSION
To our knowledge, this is the first study to describe hospitalist attending practices, attitudes, and perceptions of internal medicine subspecialty consultation. Our findings, which focus on the interaction between hospitalists and internal medicine subspecialty attendings and fellows, outline the hospitalist perspective on consultant interactions and identify a number of factors that are amenable to intervention. We found that hospitalists perceive the consult interaction to be important for patient care and a valuable opportunity for their own learning. In-person communication was seen as an important component of effective consultation but was reported to occur in a minority of consultations. We demonstrate that hospitalist–subspecialty attending consult interactions are perceived more positively than hospitalist–fellow interactions. Finally, we describe barriers and facilitating factors that may inform future interventions targeting this important interaction.
Effective communication between consultants and the primary team is critical for both patient care and teaching interactions.4-7 Pushback on consultation was reported to be the most significant barrier to hospitalist learning and had a major impact on patient care. Because hospitalists are attending physicians, we hypothesized that they may perceive pushback from fellows less frequently than residents.4 However, in our study, hospitalists reported pushback to be relatively frequent in their daily practice. Moreover, hospitalists reported a strong preference for in-person interactions with consultants, but our study demonstrated that such interactions are relatively infrequent. Researchers in studies of resident–fellow consult interactions have noted similar findings, suggesting that hospitalists and internal medicine residents face similar challenges during consultation.4-6 Hospitalists reported that positive interpersonal interactions and personal familiarity with the consultant positively affected the consult interaction. Most importantly, these effects were perceived to affect both hospitalist learning and patient care, suggesting the importance of interpersonal interactions in consultative medicine.
In an era of increasing clinical workload, the consult interaction represents an important workplace-based learning opportunity.4 Centered on a consult question, the hospitalist–consultant interaction embodies a teachable moment and can be an efficient opportunity to learn because both parties are familiar with the patient. Indeed, survey respondents reported that they frequently learned from consultation, and there was a strong preference for more teaching from consultants in this setting. However, the hospitalist–fellow consult interaction is unique because attending hospitalists are frequently communicating with fellow trainees, which could limit fellows’ confidence in their role as teachers and hospitalists’ perception of their role as learners. Our study identifies a number of barriers and facilitating factors (including communication, pushback, familiarity, and clinical workload) that affect the hospitalist–consultant teaching interaction and may be amenable to intervention.
Hospitalists expressed a consistent preference for interacting with attending subspecialists compared to clinical fellows during consultation. Preference for interaction with attendings was strongest in the areas of pushback, confidence in recommendations, professionalism, and learning from consultation. Some of the factors that relate to consult service structure and fellow experience, such as timeliness of consultation and confidence in recommendations, may not be amenable to intervention. For instance, fellows must first see and then staff the consult with their attending prior to leaving formal recommendations, which makes their communication less timely than that of attending physicians, when they are the primary consultant. However, aspects of the hospitalist–consultant interaction (such as professionalism, ease of communication, and pushback) should not be affected by the difference in experience between fellows and attending physicians. The reasons for such perceptions deserve further exploration; however, differences in incentive structures, workload, and communication skills between fellows and attending consultants may be potential explanations.
Our findings suggest that interventions aimed at enhancing hospitalist–consultant interactions focus on enhancing direct communication and teaching while limiting the perception of pushback. A number of interventions that are primarily focused on instituting a systematic approach to requesting consultation have shown an improvement in resident and medical student consult communication17,18 as well as resident–fellow teaching interactions.9 However, it is not clear whether these interventions would be effective given that hospitalists have more experience communicating with consultants than trainees. Given the unique nature of the hospitalist–consultant interaction, multiple barriers may need to be addressed in order to have a significant impact. Efforts to increase direct communication, such as a mechanism for hospitalists to make and request in-person or direct verbal communication about a particular consultation during the consult request, can help consultants prioritize direct communication with hospitalists for specific patients. Familiarizing fellows with hospitalist workflow and the locations of hospitalist workrooms also may promote in-person communication. Fellowship training can focus on enhancing fellow teaching and communication skills,19-22 particularly as they relate to hospitalists. Fellows in particular may benefit because the hospitalist–fellow teaching interaction may be bidirectional, with hospitalists having expertise in systems practice and quality efforts that can inform fellows’ practice. Furthermore, interacting with hospitalists is an opportunity for fellows to practice professional interactions, which will be critical to their careers. Increasing familiarity between fellows and hospitalists through joint events may also serve to enhance the interaction. Finally, enabling hospitalists to provide feedback to fellows stands to benefit both parties because multisource feedback is an important tool in assessing trainee competence and improving performance.23 However, we should note that because our study focused on hospitalist perceptions, an exploration of subspecialty fellows’ and attendings’ perceptions of the hospitalist–consultant interaction would provide additional, important data for shaping interventions.
Strengths of our study include the inclusion of multiple study sites, which may increase generalizability; however, our study has several limitations. The incomplete response rate reduces both generalizability and statistical power and may have created selection or nonresponder bias. However, low response rates occur commonly when surveying medical professionals, and our results are consistent with many prior hospitalist survey studies.24-26 Further, we conducted our study at a single time point; therefore, we could not evaluate the effect of fellow experience on hospitalist perceptions. However, we conducted our study in the second half of the academic year, when fellows had already gained considerable experience in the consultation setting. We did not capture participants’ institutional affiliations; therefore, a subgroup analysis by institution could not be performed. Additionally, our study reflects hospitalist perception rather than objectively measured communication practices between hospitalists and consultants, and it does not include the perspective of subspecialists. The specific needs of nurse practitioners and physicians’ assistants, who were excluded from this study, should also be evaluated in future research. Lastly, this is a hypothesis-generating study and should be replicated in a national cohort.
CONCLUSION
The hospitalists represented in our sample population perceived the consult interaction to be important for patient care and a valuable opportunity for their own learning. Participants expressed that they would like to increase direct communication with consultants and enhance consultant–hospitalist teaching interactions. Multiple barriers to effective hospitalist–consultant interactions (including communication, pushback, and hospitalist–consultant familiarity) are amenable to intervention.
Disclosure
The authors have no financial disclosures or conflicts of interest.
1. Kravolec PD, Miller JA, Wellikson L, Huddleston JM. The status of hospital medicine groups in the United States. J Hosp Med.2006;1(2):75-80. PubMed
2. Cai Q, Bruno CJ, Hagedorn CH, Desbiens NA. Temporal trends over ten years in formal inpatient gastroenterology consultations at an inner-city hospital. J Clin Gastroenterol. 2003;36(1):34-38. PubMed
3. Ta K, Gardner GC. Evaluation of the activity of an academic rheumatology consult service over 10 years: using data to shape curriculum. J Rheumatol. 2007;34(3):563-566. PubMed
4. Miloslavsky EM, McSparron JI, Richards JB, Puig A, Sullivan AM. Teaching during consultation: factors affecting the resident-fellow teaching interaction. Med Educ. 2015;49(7):717-730. PubMed
5. Chan T, Sabir K, Sanhan S, Sherbino J. Understanding the impact of residents’ interpersonal relationships during emergency department referrals and consultations. J Grad Med Educ. 2013;5(4):576-581. PubMed
6. Chan T, Bakewell F, Orlich D, Sherbino J. Conflict prevention, conflict mitigation, and manifestations of conflict during emergency department consultations. Acad Emerg Med. 2014;21(3):308-313. PubMed
7. Goldman L, Lee T, Rudd P. Ten commandments for effective consultations. Arch Intern Med. 1983;143(9):1753-1755. PubMed
8. Adams T. Barriers to hospitalist fellow interactions. Med Educ. 2016;50(3):370. PubMed
9. Gupta S, Alladina J, Heaton K, Miloslavsky E. A randomized trial of an intervention to improve resident-fellow teaching interaction on the wards. BMC Med Educ. 2016;16(1):276. PubMed
10. Day LW, Cello JP, Madden E, Segal M. Prospective assessment of inpatient gastrointestinal consultation requests in an academic teaching hospital. Am J Gastroenterol. 2010;105(3):484-489. PubMed
11. Kessler C, Kutka BM, Badillo C. Consultation in the emergency department: a qualitative analysis and review. J Emerg Med. 2012;42(6):704-711. PubMed
12. Salerno SM, Hurst FP, Halvorson S, Mercado DL. Principles of effective consultation: an update for the 21st-century consultant. Arch Intern Med. 2007;167(3):271-275. PubMed
13. Muzin LJ. Understanding the process of medical referral: part 1: critique of the literature. Can Fam Physician. 1991;37:2155-2161. PubMed
14. Muzin LJ. Understanding the process of medical referral: part 5: communication. Can Fam Physician. 1992;38:301-307. PubMed
15. Wadhwa A, Lingard L. A qualitative study examining tensions in interdoctor telephone consultations. Med Educ. 2006;40(8):759-767. PubMed
16. Grant IN, Dixon AS. “Thank you for seeing this patient”: studying the quality of communication between physicians. Can Fam Physician. 1987;33:605-611. PubMed
17. Kessler CS, Afshar Y, Sardar G, Yudkowsky R, Ankel F, Schwartz A. A prospective, randomized, controlled study demonstrating a novel, effective model of transfer of care between physicians: the 5 Cs of consultation. Acad Emerg Med. 2012;19(8):968-974. PubMed
18. Podolsky A, Stern DTP. The courteous consult: a CONSULT card and training to improve resident consults. J Grad Med Educ. 2015;7(1):113-117. PubMed
19. Tofil NM, Peterson DT, Harrington KF, et al. A novel iterative-learner simulation model: fellows as teachers. J. Grad. Med. Educ. 2014;6(1):127-132. PubMed
20. Kempainen RR, Hallstrand TS, Culver BH, Tonelli MR. Fellows as teachers: the teacher-assistant experience during pulmonary subspecialty training. Chest. 2005;128(1):401-406. PubMed
21. Backes CH, Reber KM, Trittmann JK, et al. Fellows as teachers: a model to enhance pediatric resident education. Med. Educ. Online. 2011;16:7205. PubMed
22. Miloslavsky EM, Degnan K, McNeill J, McSparron JI. Use of Fellow as Clinical Teacher (FACT) Curriculum for Teaching During Consultation: Effect on Subspecialty Fellow Teaching Skills. J Grad Med Educ. 2017;9(3):345-350 PubMed
23. Donnon T, Al Ansari A, Al Alawi S, Violato C. The reliability, validity, and feasibility of multisource feedback physician assessment: a systematic review. Acad. Med. 2014;89(3):511-516. PubMed
24. Monash B, Najafi N, Mourad M, et al. Standardized attending rounds to improve the patient experience: A pragmatic cluster randomized controlled trial. J Hosp Med. 2017;12(3):143-149. PubMed
25. Allen-Dicker J, Auerbach A, Herzig SJ. Perceived safety and value of inpatient “very important person” services. J Hosp Med. 2017;12(3):177-179. PubMed
26. Do D, Munchhof AM, Terry C, Emmett T, Kara A. Research and publication trends in hospital medicine. J Hosp Med. 2014;9(3):148-154. PubMed
Hospitalist physicians care for an increasing proportion of general medicine inpatients and request a significant share of all subspecialty consultations.1 Subspecialty consultation in inpatient care is increasing,2,3 and effective hospitalist–consulting service interactions may affect team communication, patient care, and hospitalist learning. Therefore, enhancing hospitalist–consulting service interactions may have a broad-reaching, positive impact. Researchers in previous studies have explored resident–fellow consult interactions in the inpatient and emergency department settings as well as attending-to-attending consultation in the outpatient setting.4-7 However, to our knowledge, hospitalist–consulting team interactions have not been previously described. In academic medical centers, hospitalists are attending physicians who interact with both fellows (supervised by attending consultants) and directly with subspecialty attendings. Therefore, the exploration of the hospitalist–consultant interaction requires an evaluation of hospitalist–fellow and hospitalist–subspecialty attending interactions. The hospitalist–fellow interaction in particular is unique because it represents an unusual dynamic, in which an attending physician is primarily communicating with a trainee when requesting assistance with patient care.8 In order to explore hospitalist–consultant interactions (herein, the term “consultant” includes both fellow and attending consultants), we conducted a survey study in which we examine hospitalist practices and attitudes regarding consultation, with a specific focus on hospitalist consultation with internal medicine subspecialty consult services. In addition, we compared fellow–hospitalist and attending–hospitalist interactions and explored barriers to and facilitating factors of an effective hospitalist–consultant relationship.
METHODS
Survey Development
The survey instrument was developed by the authors based on findings of prior studies in which researchers examined consultation.2-6,9-16 The survey contained 31 questions (supplementary Appendix A) and evaluated 4 domains of the use of medical subspecialty consultation in direct patient care: (1) current consultation practices, (2) preferences regarding consultants, (3) barriers to and facilitating factors of effective consultation (both with respect to hospitalist learning and patient care), and (4) a comparison between hospitalist–fellow and hospitalist–subspecialty attending interactions. An evaluation of current consultation practices included a focus on communication methods (eg, in person, over the phone, through paging, or notes) because these have been found to be important during consultation.5,6,9,15,16 In order to explore hospitalist preferences regarding consult interactions and investigate perceptions of barriers to and facilitating factors of effective consultation, questions were developed based on previous literature, including our qualitative work examining resident–fellow interactions during consultation.4-6,9,12 We compared hospitalist consultation experiences among attending and fellow consultants because the interaction in which an attending hospitalist physician is primarily communicating with a trainee may differ from a consultation between a hospitalist attending and a subspecialty attending.8 Participants were asked to exclude their experiences when working on teaching services, during which students or housestaff often interact with consultants. The survey was cognitively tested with both hospitalist and non-hospitalist attending physicians not participating in the study and was revised by the authors using an iterative approach.
Study Participants
Hospitalist attending physicians at University of Texas Southwestern (UTSW) Medical Center, Emory University School of Medicine, Massachusetts General Hospital (MGH), and the Medical University of South Carolina (MUSC) were eligible to participate in the study. Consult team structures at each institution were composed of either a subspecialist-attending-only or a fellow-and-subspecialty-attending team. Fellows at all institutions are supervised by a subspecialty attending when performing consultations. Respondents who self-identified as nurse practitioners or physician assistants were excluded from the analysis. Hospitalists employed by the Veterans Affairs hospital system were also excluded. The study was approved by the institutional review boards of UTSW, Emory, MUSC, and MGH.
The survey was anonymous and administered to all hospitalists at participating institutions via a web-based survey tool (Qualtrics, Provo, UT). Participants were eligible to enter a raffle for a $500 gift card, and completion of the survey was not required for entry into the raffle.
Statistics
Results were summarized using the mean with standard deviation for continuous variables and the frequency with percentage for categorical variables after excluding missing values. All analyses were conducted using SAS version 9.4 (SAS Institute, Cary, NC). A 2-sided P value of ≤0.05 was considered statistically significant.
RESULTS
Current Consultation Practices
Current consultation practices and descriptions of hospitalist–consultant communication are shown in Table 2. Forty percent of respondents requested 0-1 consults per day, while 51.7% requested 2-3 per day. The most common reasons for requesting a consultation were assistance with treatment (48.5%), assistance with diagnosis (25.7%), and request for a procedure (21.8%). When asked whether the frequency of consultation is changing, slightly more hospitalists felt that their personal use of consultation was increasing as compared to those who felt that it was decreasing (38.5% vs 30.3%, respectively).
Hospitalist Preferences
Eighty-six percent of respondents agreed that consultants should be required to communicate their recommendations either in person or over the phone. Eighty-three percent of hospitalists agreed that they would like to receive more teaching from the consulting services, and 74.0% agreed that consultants should attempt to teach hospitalists during consult interactions regardless of whether the hospitalist initiates the teaching–learning interaction.
Barriers to and Facilitating Factors of Effective Consultation
Participants reported that multiple factors affected patient care and their own learning during inpatient consultation (Figure 1). Consultant pushback, high hospitalist clinical workload, a perception that consultants had limited time, and minimal in-person interactions were all seen as factors that negatively affected the consult interaction. These generally affected both learning and patient care. Conversely, working on an interesting clinical case, more hospitalist free time, positive interaction with the consultant, and having previously worked with the consultant positively affected both learning and patient care (Figure 1).
Fellow Versus Attending Interactions
Respondents indicated that interacting directly with the consult attending was superior to hospitalist–fellow interactions in all aspects of care but particularly with respect to pushback, confidence in recommendations, professionalism, and hospitalist learning (Figure 2).
DISCUSSION
To our knowledge, this is the first study to describe hospitalist attending practices, attitudes, and perceptions of internal medicine subspecialty consultation. Our findings, which focus on the interaction between hospitalists and internal medicine subspecialty attendings and fellows, outline the hospitalist perspective on consultant interactions and identify a number of factors that are amenable to intervention. We found that hospitalists perceive the consult interaction to be important for patient care and a valuable opportunity for their own learning. In-person communication was seen as an important component of effective consultation but was reported to occur in a minority of consultations. We demonstrate that hospitalist–subspecialty attending consult interactions are perceived more positively than hospitalist–fellow interactions. Finally, we describe barriers and facilitating factors that may inform future interventions targeting this important interaction.
Effective communication between consultants and the primary team is critical for both patient care and teaching interactions.4-7 Pushback on consultation was reported to be the most significant barrier to hospitalist learning and had a major impact on patient care. Because hospitalists are attending physicians, we hypothesized that they may perceive pushback from fellows less frequently than residents.4 However, in our study, hospitalists reported pushback to be relatively frequent in their daily practice. Moreover, hospitalists reported a strong preference for in-person interactions with consultants, but our study demonstrated that such interactions are relatively infrequent. Researchers in studies of resident–fellow consult interactions have noted similar findings, suggesting that hospitalists and internal medicine residents face similar challenges during consultation.4-6 Hospitalists reported that positive interpersonal interactions and personal familiarity with the consultant positively affected the consult interaction. Most importantly, these effects were perceived to affect both hospitalist learning and patient care, suggesting the importance of interpersonal interactions in consultative medicine.
In an era of increasing clinical workload, the consult interaction represents an important workplace-based learning opportunity.4 Centered on a consult question, the hospitalist–consultant interaction embodies a teachable moment and can be an efficient opportunity to learn because both parties are familiar with the patient. Indeed, survey respondents reported that they frequently learned from consultation, and there was a strong preference for more teaching from consultants in this setting. However, the hospitalist–fellow consult interaction is unique because attending hospitalists are frequently communicating with fellow trainees, which could limit fellows’ confidence in their role as teachers and hospitalists’ perception of their role as learners. Our study identifies a number of barriers and facilitating factors (including communication, pushback, familiarity, and clinical workload) that affect the hospitalist–consultant teaching interaction and may be amenable to intervention.
Hospitalists expressed a consistent preference for interacting with attending subspecialists compared to clinical fellows during consultation. Preference for interaction with attendings was strongest in the areas of pushback, confidence in recommendations, professionalism, and learning from consultation. Some of the factors that relate to consult service structure and fellow experience, such as timeliness of consultation and confidence in recommendations, may not be amenable to intervention. For instance, fellows must first see and then staff the consult with their attending prior to leaving formal recommendations, which makes their communication less timely than that of attending physicians, when they are the primary consultant. However, aspects of the hospitalist–consultant interaction (such as professionalism, ease of communication, and pushback) should not be affected by the difference in experience between fellows and attending physicians. The reasons for such perceptions deserve further exploration; however, differences in incentive structures, workload, and communication skills between fellows and attending consultants may be potential explanations.
Our findings suggest that interventions aimed at enhancing hospitalist–consultant interactions focus on enhancing direct communication and teaching while limiting the perception of pushback. A number of interventions that are primarily focused on instituting a systematic approach to requesting consultation have shown an improvement in resident and medical student consult communication17,18 as well as resident–fellow teaching interactions.9 However, it is not clear whether these interventions would be effective given that hospitalists have more experience communicating with consultants than trainees. Given the unique nature of the hospitalist–consultant interaction, multiple barriers may need to be addressed in order to have a significant impact. Efforts to increase direct communication, such as a mechanism for hospitalists to make and request in-person or direct verbal communication about a particular consultation during the consult request, can help consultants prioritize direct communication with hospitalists for specific patients. Familiarizing fellows with hospitalist workflow and the locations of hospitalist workrooms also may promote in-person communication. Fellowship training can focus on enhancing fellow teaching and communication skills,19-22 particularly as they relate to hospitalists. Fellows in particular may benefit because the hospitalist–fellow teaching interaction may be bidirectional, with hospitalists having expertise in systems practice and quality efforts that can inform fellows’ practice. Furthermore, interacting with hospitalists is an opportunity for fellows to practice professional interactions, which will be critical to their careers. Increasing familiarity between fellows and hospitalists through joint events may also serve to enhance the interaction. Finally, enabling hospitalists to provide feedback to fellows stands to benefit both parties because multisource feedback is an important tool in assessing trainee competence and improving performance.23 However, we should note that because our study focused on hospitalist perceptions, an exploration of subspecialty fellows’ and attendings’ perceptions of the hospitalist–consultant interaction would provide additional, important data for shaping interventions.
Strengths of our study include the inclusion of multiple study sites, which may increase generalizability; however, our study has several limitations. The incomplete response rate reduces both generalizability and statistical power and may have created selection or nonresponder bias. However, low response rates occur commonly when surveying medical professionals, and our results are consistent with many prior hospitalist survey studies.24-26 Further, we conducted our study at a single time point; therefore, we could not evaluate the effect of fellow experience on hospitalist perceptions. However, we conducted our study in the second half of the academic year, when fellows had already gained considerable experience in the consultation setting. We did not capture participants’ institutional affiliations; therefore, a subgroup analysis by institution could not be performed. Additionally, our study reflects hospitalist perception rather than objectively measured communication practices between hospitalists and consultants, and it does not include the perspective of subspecialists. The specific needs of nurse practitioners and physicians’ assistants, who were excluded from this study, should also be evaluated in future research. Lastly, this is a hypothesis-generating study and should be replicated in a national cohort.
CONCLUSION
The hospitalists represented in our sample population perceived the consult interaction to be important for patient care and a valuable opportunity for their own learning. Participants expressed that they would like to increase direct communication with consultants and enhance consultant–hospitalist teaching interactions. Multiple barriers to effective hospitalist–consultant interactions (including communication, pushback, and hospitalist–consultant familiarity) are amenable to intervention.
Disclosure
The authors have no financial disclosures or conflicts of interest.
1. Kravolec PD, Miller JA, Wellikson L, Huddleston JM. The status of hospital medicine groups in the United States. J Hosp Med.2006;1(2):75-80. PubMed
2. Cai Q, Bruno CJ, Hagedorn CH, Desbiens NA. Temporal trends over ten years in formal inpatient gastroenterology consultations at an inner-city hospital. J Clin Gastroenterol. 2003;36(1):34-38. PubMed
3. Ta K, Gardner GC. Evaluation of the activity of an academic rheumatology consult service over 10 years: using data to shape curriculum. J Rheumatol. 2007;34(3):563-566. PubMed
4. Miloslavsky EM, McSparron JI, Richards JB, Puig A, Sullivan AM. Teaching during consultation: factors affecting the resident-fellow teaching interaction. Med Educ. 2015;49(7):717-730. PubMed
5. Chan T, Sabir K, Sanhan S, Sherbino J. Understanding the impact of residents’ interpersonal relationships during emergency department referrals and consultations. J Grad Med Educ. 2013;5(4):576-581. PubMed
6. Chan T, Bakewell F, Orlich D, Sherbino J. Conflict prevention, conflict mitigation, and manifestations of conflict during emergency department consultations. Acad Emerg Med. 2014;21(3):308-313. PubMed
7. Goldman L, Lee T, Rudd P. Ten commandments for effective consultations. Arch Intern Med. 1983;143(9):1753-1755. PubMed
8. Adams T. Barriers to hospitalist fellow interactions. Med Educ. 2016;50(3):370. PubMed
9. Gupta S, Alladina J, Heaton K, Miloslavsky E. A randomized trial of an intervention to improve resident-fellow teaching interaction on the wards. BMC Med Educ. 2016;16(1):276. PubMed
10. Day LW, Cello JP, Madden E, Segal M. Prospective assessment of inpatient gastrointestinal consultation requests in an academic teaching hospital. Am J Gastroenterol. 2010;105(3):484-489. PubMed
11. Kessler C, Kutka BM, Badillo C. Consultation in the emergency department: a qualitative analysis and review. J Emerg Med. 2012;42(6):704-711. PubMed
12. Salerno SM, Hurst FP, Halvorson S, Mercado DL. Principles of effective consultation: an update for the 21st-century consultant. Arch Intern Med. 2007;167(3):271-275. PubMed
13. Muzin LJ. Understanding the process of medical referral: part 1: critique of the literature. Can Fam Physician. 1991;37:2155-2161. PubMed
14. Muzin LJ. Understanding the process of medical referral: part 5: communication. Can Fam Physician. 1992;38:301-307. PubMed
15. Wadhwa A, Lingard L. A qualitative study examining tensions in interdoctor telephone consultations. Med Educ. 2006;40(8):759-767. PubMed
16. Grant IN, Dixon AS. “Thank you for seeing this patient”: studying the quality of communication between physicians. Can Fam Physician. 1987;33:605-611. PubMed
17. Kessler CS, Afshar Y, Sardar G, Yudkowsky R, Ankel F, Schwartz A. A prospective, randomized, controlled study demonstrating a novel, effective model of transfer of care between physicians: the 5 Cs of consultation. Acad Emerg Med. 2012;19(8):968-974. PubMed
18. Podolsky A, Stern DTP. The courteous consult: a CONSULT card and training to improve resident consults. J Grad Med Educ. 2015;7(1):113-117. PubMed
19. Tofil NM, Peterson DT, Harrington KF, et al. A novel iterative-learner simulation model: fellows as teachers. J. Grad. Med. Educ. 2014;6(1):127-132. PubMed
20. Kempainen RR, Hallstrand TS, Culver BH, Tonelli MR. Fellows as teachers: the teacher-assistant experience during pulmonary subspecialty training. Chest. 2005;128(1):401-406. PubMed
21. Backes CH, Reber KM, Trittmann JK, et al. Fellows as teachers: a model to enhance pediatric resident education. Med. Educ. Online. 2011;16:7205. PubMed
22. Miloslavsky EM, Degnan K, McNeill J, McSparron JI. Use of Fellow as Clinical Teacher (FACT) Curriculum for Teaching During Consultation: Effect on Subspecialty Fellow Teaching Skills. J Grad Med Educ. 2017;9(3):345-350 PubMed
23. Donnon T, Al Ansari A, Al Alawi S, Violato C. The reliability, validity, and feasibility of multisource feedback physician assessment: a systematic review. Acad. Med. 2014;89(3):511-516. PubMed
24. Monash B, Najafi N, Mourad M, et al. Standardized attending rounds to improve the patient experience: A pragmatic cluster randomized controlled trial. J Hosp Med. 2017;12(3):143-149. PubMed
25. Allen-Dicker J, Auerbach A, Herzig SJ. Perceived safety and value of inpatient “very important person” services. J Hosp Med. 2017;12(3):177-179. PubMed
26. Do D, Munchhof AM, Terry C, Emmett T, Kara A. Research and publication trends in hospital medicine. J Hosp Med. 2014;9(3):148-154. PubMed
©2017 Society of Hospital Medicine
Forging ahead
The approach to clinical conundrums by an expert clinician is revealed through the presentation of an actual patient’s case in an approach typical of a morning report. Similarly to patient care, sequential pieces of information are provided to the clinician, who is unfamiliar with the case. The focus is on the thought processes of both the clinical team caring for the patient and the discussant. The bolded text represents the patient’s case. Each paragraph that follows represents the discussant’s thoughts.
A 45-year-old woman presented to the emergency department with 2 days of generalized, progressive weakness. Her ability to walk and perform daily chores was increasingly limited. On the morning of her presentation, she was unable to stand up without falling.
A complaint of weakness must be classified as either functional weakness related to a systemic process or true neurologic weakness from dysfunction of the central nervous system (eg, brain, spinal cord) or peripheral nervous system (eg, anterior horn cell, nerve, neuromuscular junction, or muscle). More information on her clinical course and a detailed neurologic exam will help clarify this key branch point.
She was 2 weeks status-post laparoscopic Roux-en-Y gastric bypass and gastric band removal performed in Europe. Immediately following surgery, she experienced abdominal discomfort and nausea with occasional nonbloody, nonbilious emesis, attributed to expected postoperative anatomical changes. She developed a postoperative pneumonia treated with amoxicillin-clavulanate. She tolerated her flight back to the United States, but her abdominal discomfort persisted and she had minimal oral intake due to her nausea.
Functional weakness may stem from hypovolemia from insufficient oral intake, anemia related to the recent surgery, electrolyte abnormalities, chronic nutritional issues associated with obesity and weight-reduction surgery, and pneumonia. Prolonged air travel, obesity, and recent surgery place her at risk for venous thromboembolism, which may manifest as reduced exercise tolerance. Nausea, vomiting, and abdominal pain persisting for 2 weeks after a Roux-en-Y gastric bypass surgery raises several concerns, including gastric remnant distension (although hiccups are often prominent); stomal stenosis, which typically presents several weeks after surgery; marginal ulceration; or infection at the surgical site or from an anastomotic leak. She may also have a surgery- or medication-related myopathy.
The patient had a history of obesity, hypertension, hyperlipidemia, migraine headaches, and nonalcoholic steatohepatitis. Four years previously, she had undergone gastric banding complicated by band migration and ulceration at the banding site. Her medications were amlodipine, losartan, ranitidine, acetaminophen, and nadroparin for venous thromboembolism prophylaxis during her flight. She denied alcohol, tobacco, or illicit drug use. On further questioning, she reported diaphoresis, mild dyspnea, loose stools, and a sensation of numbness and “heaviness” in her arms. Her abdominal pain was limited to the surgical incision and was controlled with acetaminophen. She denied fevers, cough, chest pain, diplopia, or dysphagia.
Heaviness in both arms could result from an acutely presenting myopathic or neuropathic process, while the coexistence of numbness suggests a sensorimotor polyneuropathy. Obesity and gastric bypass surgery increase her nutritional risk, and thiamine deficiency may present as an acute axonal polyneuropathy (ie, beriberi). Unlike vitamin B12 deficiency, which may take years to develop, thiamine deficiency can present within 4 weeks of gastric bypass surgery. Her dyspnea may be a manifestation of diaphragmatic weakness, although her ostensibly treated pneumonia or as of yet unproven postoperative anemia may be contributing. Chemoprophylaxis mitigates her risk of venous thromboembolism, which is, nonetheless, unlikely to account for the gastrointestinal symptoms and upper extremity weakness. If she is continuing to take amlodipine and losartan but has become volume-depleted, hypotension may be contributing to the generalized weakness.
Physical examination revealed an obese, pale and diaphoretic woman. Her temperature was 36.9°C, heart rate 77 beats per minute, blood pressure 158/90 mm Hg, respiratory rate 28 breaths per minute, and O2 saturation 99% on ambient air. She had no cervical lymphadenopathy and a normal thyroid exam. There were no murmurs on cardiac examination, and jugular venous pressure was estimated at 10 cm of water. Her lung sounds were clear. Her abdomen was soft, nondistended, with localized tenderness and fluctuance around the midline surgical incision with a small amount of purulent drainage. She was alert and oriented to name, date, place, and situation. Cranial nerves II through XII were grossly intact. Strength was 4/5 in bilateral biceps, triceps and distal hand and finger extensors, 3/5 in bilateral deltoids. Strength in hip flexors was 4/5 and it was 5/5 in distal lower extremities. Sensation was intact to pinprick in upper and lower extremities. Biceps reflexes were absent; patellar and ankle reflexes were 1+ and symmetric. The remainder of the physical exam was unremarkable.
The patient has symmetric proximal muscle weakness with upper extremity predominance and preserved strength in her distal lower extremities. A myopathy could explain this pattern of weakness, further substantiated by absent reflexes and reportedly intact sensation. Subacute causes of myopathy include hypokalemia, hyperkalemia, toxic myopathies from medications, or infection-induced rhabdomyolysis. However, she does not report muscle pain, and the loss of reflexes is faster than would be expected with a myopathy. A more thorough sensory examination would inform the assessment of potential neuropathic processes. Guillain-Barré syndrome (GBS) is possible; it most commonly presents as an ascending, distally predominant acute inflammatory demyelinating polyneuropathy (AIDP), although her upper extremity weakness predominates and there are no clear sensory changes. It remains to be determined how her wound infection might relate to her overall presentation.
Her white blood cell count was 12,600/μL (reference range: 3,400-10,000/μL), hemoglobin was 10.2 g/dL, and platelet count was 698,000/μL. Mean corpuscular volume was 86 fL. Serum chemistries were: sodium 138 mEq/L, potassium 3.8 mEq/L, chloride 106 mmol/L, bicarbonate 15 mmol/L, blood urea nitrogen 5 mg/dL, creatinine 0.65 mg/dL, glucose 125 mg/dL, calcium 8.3 mg/dL, magnesium 1.9 mg/dL, phosphorous 2.4 mg/dL, and lactate 1.8 mmol/L (normal: < 2.0 mmol/L). Creatinine kinase (CK), liver function tests, and coagulation panel were normal. Total protein was 6.4 g/dL, and albumin was 2.7 g/dL. Venous blood gas was: pH 7.39 and PCO2 25 mmHg. Urinalysis revealed ketones. Blood and wound cultures were sent for evaluation. A chest x-ray was unremarkable. An electrocardiogram showed normal sinus rhythm. Computed tomography (CT) of the abdomen and pelvis revealed a multiloculated rim-enhancing fluid collection in the anterior abdominal wall (Figure 1).

She does not have any notable electrolyte derangements that would account for her weakness, and the normal creatinine kinase lowers the probability of a myopathy and excludes rhabdomyolysis. Progression of weakness from proximal to distal muscles in a symmetric fashion is consistent with botulism, and she has an intra-abdominal wound infection that could be harboring Clostridium botulinum. Nonetheless, the normal cranial nerve exam and the rarity of botulism occurring with surgical wounds argue against this diagnosis. She should receive intravenous (IV) thiamine for the possibility of beriberi. A lumbar puncture should be performed to assess for albuminocytologic dissociation, which can be seen in patients with GBS.
The patient received high-dose IV thiamine, IV vancomycin, IV piperacillin-tazobactam, and acetaminophen. Over the subsequent 4 hours, her anion gap acidosis worsened. She declined arterial puncture. Repeat venous blood gas was: pH 7.22, PCO2 28 mmHg, and bicarbonate 11 mmol/L. Lactate and glucose were normal. Serum osmolarity was 292 mmol/kg (reference range: 283-301 mmol/kg). She was started on an IV sodium bicarbonate infusion without improvement in her acidemia.
An acute anion gap metabolic acidosis suggests a limited differential diagnosis that includes lactic acidosis, D-lactic acidosis, severe starvation ketoacidosis, acute renal failure, salicylate, or other drug or poison ingestion. Starvation ketoacidosis may be contributing, but a bicarbonate value this low would be unusual. There is no history of alcohol use or other ingestions, and the normal serum osmolality and low osmolal gap (less than 10 mOsm/kg) argue against a poisoning with ethanol, ethylene glycol, or methanol. The initial combined anion gap metabolic acidosis and respiratory alkalosis is consistent with salicylate toxicity, but she does not report aspirin ingestion. Acetaminophen use in the setting of malnutrition or starvation physiology raises the possibility of 5-oxoproline accumulation.
Routine serum lactate does not detect D-lactate, which is produced by colonic bacteria and has been reported in short bowel syndrome and following intestinal bypass surgery. This may occur weeks to months after intestinal procedures, following ingestion of a heavy carbohydrate load, and almost invariably presents with altered mental status and increased anion gap metabolic acidosis, although generalized weakness has been reported.
A surgical consultant drained her wound infection. Fluid Gram stain was negative. D-lactate, salicylate and acetaminophen levels were undetectable. Thiamine pyrophosphate level was 229 nmol/L (reference range: 78-185 nmol/L). Acetaminophen was discontinued and N-acetylcysteine infusion was started for possible 5-oxoprolinemia. Her anion gap acidosis rapidly improved. Twelve hours after admission, she reported sudden onset of blurry vision. Her vital signs were: temperature 37oC, heart rate 110 beats per minute, respiratory rate 40 breaths per minute, blood pressure 168/90, and oxygen saturation 100% on ambient air. Telemetry showed ventricular bigeminy. On examination, she was unable to abduct her right eye; muscle strength was 1/5 in all extremities; biceps, ankle, and patellar reflexes were absent.
Her neurological deficits have progressed over hours to near complete paralysis, asymmetric cranial nerve paresis, and areflexia. Although botulism can cause blurred vision and absent deep tendon reflexes, patients almost always have symmetrical bulbar findings followed by descending paralysis. Should the “numbness” in her arms reported earlier represent undetected sensory deficits, this, too would be inconsistent with botulism.
A diagnosis of GBS ties together several aspects of her presentation and clinical course. Several variants show different patterns of weakness and may involve cranial nerves. Her tachypnea and dyspnea are concerning signs of potential impending respiratory failure. The ventricular bigeminy and mild hypertension could represent autonomic dysfunction that is seen in many cases of GBS.
She was intubated for airway protection. Computed tomography angiography and magnetic resonance imaging of her brain were normal. Cerebral spinal fluid analysis obtained through lumbar puncture showed the following: white blood cell count 3/μL, red blood cell count 11/μL, protein 63 mg/dL (reference range: 15-60mg/dL), and glucose 128 mg/dL (reference range: 40-80mg/dL).
The lumbar puncture is consistent with GBS given the slightly elevated protein and cell count well below 50/μL. Given the severity of her symptoms, treatment with IV immunoglobulin or plasmapheresis should be initiated. Nerve conduction studies (NCS) and electromyography (EMG) are indicated for diagnostic confirmation.
EMG and NCS revealed a severe sensorimotor polyneuropathy with demyelinating features including a conduction block at a noncompressible site, consistent with AIDP. Left sural nerve biopsy confirmed acute demyelinating and mild axonal neuropathy (Figure 2). On hospital day 2, treatment with IV immunoglobulins (IVIG) was initiated; however, she developed anaphylaxis following her second administration and subsequently received plasmapheresis. A tracheostomy was performed for respiratory muscle weakness, and she was discharged to a nursing facility. C. botulinum cultures from the wound eventually returned negative. Following her hospitalization, a serum 5-oxoproline level sent 10 hours after admission returned as elevated, confirming the additional diagnosis of 5-oxoprolinemia. On follow-up, she can sit up and feed herself without assistance, and her gait continues to improve with physical therapy.

DISCUSSION
This patient presented with rapidly progressive weakness that developed in the 2 weeks following bariatric surgery. In the postsurgical setting, patient complaints of weakness are commonly encountered and can pose a diagnostic challenge. Asthenia (ie, general loss of strength or energy) is frequently reported in the immediate postoperative period, and may result from the stress of surgery, pain, deconditioning, or infection. This must be distinguished from true neurologic weakness, which results from dysfunction of the brain, spinal cord, nerve, neuromuscular junction, or muscle. The initial history can help elucidate the inciting events such as preceding surgery, infections or ingestions, and can also categorize the pattern of weakness. The neurologic examination can localize the pathology within the neuraxis. EMG and NCS can distinguish neuropathy from radiculopathy, and categorize the process as axonal, demyelinating, or mixed. In this case, the oculomotor weakness, sensory abnormalities and areflexia signaled a severe sensorimotor polyneuropathy, and EMG/NCS confirmed a demyelinating process consistent with GBS.
Guillain-Barré syndrome is an acute, immune-mediated polyneuropathy. Patients with GBS often present with a preceding respiratory or diarrheal illness; however, the stress of a recent surgery can serve as an inciting event. The syndrome, acute postgastric reduction surgery (APGARS) neuropathy, was introduced in the literature in 2002, describing 3 patients who presented with progressive vomiting, weakness, and hyporeflexia following bariatric surgery.1 The term has been used to describe bariatric surgery patients who developed postoperative quadriparesis, cranial nerve deficits, and respiratory compromise.2 Given the clinical heterogeneity in the literature with relation to APGARS, it is probable that the cases described could result from multiple etiologies. While GBS is purely immune-mediated and can be precipitated by the stress of surgery itself, postbariatric surgery patients are susceptible to many nutritional deficiencies that can lead to similar presentations.3 For example, thiamine (vitamin B1) and cobalamin (vitamin B12) deficiencies cause distinct postbariatric surgery neuropathies.4 Thiamine deficiency may manifest weeks to months after surgery and can rapidly progress, whereas cobalamin deficiency generally develops over 3 to 5 years. Both of these syndromes demonstrate an axonal pattern of nerve injury on EMG/NCS, in contrast to the demyelinating pattern typically seen in GBS. In addition, bariatric surgery patients are at higher risk for copper deficiency, which usually presents as a myeloneuropathy with subacute gait decline and upper motor neuron signs including spasticity.
Although GBS classically presents with symmetric ascending weakness and sensory abnormalities, it may manifest in myriad ways. Factors influencing the presentation include the types of nerve fibers involved (motor, sensory, cranial or autonomic), the predominant mode of injury (axonal vs demyelinating), and the presence or absence of alteration in consciousness.5 The most common form of GBS is AIDP. The classic presentation involves paresthesias in the fingertips and toes followed by lower extremity weakness that ascends over hours to days to involve the arms and potentially the muscles of respiration. A minority of patients with GBS first experience weakness in the upper extremities or facial muscles, and oculomotor involvement is rare.5 Pain is common and often severe.6 Dysautonomia affects most patients with GBS and may manifest as labile blood pressure or arrhythmias.5 Several variant GBS presentation patterns have been described, including acute motor axonal neuropathy, a pure motor form of GBS; ophthalmoplegia, ataxia, and areflexia in Miller Fisher syndrome; and alteration in consciousness, hyperreflexia, ataxia, and ophthalmoparesis in Bickerstaff’s brain stem encephalitis.5
Patients with GBS can progress rapidly to respiratory failure. Serial neurologic exams may signal the diagnosis and inform triage to the appropriate level of care. Measurement of bedside pulmonary function, including mean inspiratory force and functional vital capacity, help to determine if there is weakness of diaphragmatic muscles. Patients with signs or symptoms of diaphragmatic weakness require monitoring in an intensive care unit and potentially early intubation. Treatment with IVIG or plasmapheresis has been found to hasten recovery from GBS, including earlier improvement in muscle strength and a reduced need for mechanical ventilation.7 Treatment selection is based on available resources as both modalities are felt to be equivalent.The majority of patients with GBS make a full recovery over a period of weeks to months, although many have persistent motor weakness. Despite immunotherapy, up to 20% of patients remain severely disabled and approximately 5% die.8 Advanced age, rapid progression of weakness over a period of less than 72 hours, need for mechanical ventilation, and absent compound muscle action potentials on NCS are all associated with prolonged and incomplete recovery.9
This patient developed respiratory failure within 12 hours of hospitalization, prior to being diagnosed with GBS. Even in that short time, the treating clinicians encountered a series of clinical diversions. The initial proximal pattern of muscle weakness suggested a possible myopathic process; the wound infection introduced the possibility of botulism; obesity and recent bariatric surgery triggered concern for thiamine deficiency; and the anion gap acidosis from 5-oxoprolinemia created yet another clinical detour. While the path from presentation to diagnosis is seldom a straight line, when faced with rapidly progressive weakness, it is paramount to forge ahead with an efficient diagnostic evaluation and timely therapeutic intervention.
KEY TEACHING POINTS
- A complaint of general weakness requires distinction between asthenia (ie, general loss of strength or energy) and true neuromuscular weakness from dysfunction of the brain, spinal cord, nerve, neuromuscular junction, and/or muscle.
- Guillain-Barré syndrome may present in a variety of atypical fashions not limited to ascending, distally predominant weakness.
- Acute postgastric reduction surgery neuropathy should be considered in patients presenting with weakness, vomiting, or hyporeflexia after bariatric surgery.
- Acute inflammatory demyelinating polyneuropathy may rapidly progress to respiratory failure, and warrants serial neurologic examinations, monitoring of pulmonary function, and an expedited diagnostic evaluation.
Disclosure
Nothing to report.
1. Akhtar M, Collins MP, Kissel JT. Acute postgastric reduction surgery (APGARS) Neuropathy: A polynutritional, multisystem disorder. Neurology. 2002;58:A68. PubMed
2. Chang CG, Adams-Huet B, Provost DA. Acute post-gastric reduction surgery (APGARS) neuropathy. Obes Surg. 2004;14(2):182-189. PubMed
3. Chang CG, Helling TS, Black WE, Rymer MM. Weakness after gastric bypass. Obes Surg. 2002;12(4):592-597. PubMed
4. Shankar P, Boylan M, Sriram K. Micronutrient deficiencies after bariatric surgery. Nutrition. 2010;26(11-12):1031-1037. PubMed
5. Dimachkie MM, Barohn RJ. Guillain-Barré syndrome and variants. Neurol Clin. 2013;31(2):491-510. PubMed
6. Ruts L, Drenthen J, Jongen JL, et al. Pain in Guillain-Barré syndrome: a long-term follow-up study. Neurology. 2010;75(16):1439-1447. PubMed
7. Hughes RAC, Wijdicks EFM, Barohn R, et al: Quality Standards Subcommittee of the American Academy of Neurology. Practice parameter: immunotherapy for Guillain-Barré syndrome: report of the Quality Standards Subcommittee of the American Academy of Neurology. Neurology. 2003;61:736-740. PubMed
8. Hughes RA, Swan AV, Raphaël JC, Annane D, van Koningsveld R, van Doorn PA. Immunotherapy for Guillain-Barré syndrome: a systematic review. Brain. 2007;130(Pt 9):2245-2257. PubMed
9. Rajabally YA, Uncini A. Outcome and predictors in Guillain-Barré syndrome. J Neurol Neurosurg Psychiatry. 2012;83(7):711-718. PubMed
The approach to clinical conundrums by an expert clinician is revealed through the presentation of an actual patient’s case in an approach typical of a morning report. Similarly to patient care, sequential pieces of information are provided to the clinician, who is unfamiliar with the case. The focus is on the thought processes of both the clinical team caring for the patient and the discussant. The bolded text represents the patient’s case. Each paragraph that follows represents the discussant’s thoughts.
A 45-year-old woman presented to the emergency department with 2 days of generalized, progressive weakness. Her ability to walk and perform daily chores was increasingly limited. On the morning of her presentation, she was unable to stand up without falling.
A complaint of weakness must be classified as either functional weakness related to a systemic process or true neurologic weakness from dysfunction of the central nervous system (eg, brain, spinal cord) or peripheral nervous system (eg, anterior horn cell, nerve, neuromuscular junction, or muscle). More information on her clinical course and a detailed neurologic exam will help clarify this key branch point.
She was 2 weeks status-post laparoscopic Roux-en-Y gastric bypass and gastric band removal performed in Europe. Immediately following surgery, she experienced abdominal discomfort and nausea with occasional nonbloody, nonbilious emesis, attributed to expected postoperative anatomical changes. She developed a postoperative pneumonia treated with amoxicillin-clavulanate. She tolerated her flight back to the United States, but her abdominal discomfort persisted and she had minimal oral intake due to her nausea.
Functional weakness may stem from hypovolemia from insufficient oral intake, anemia related to the recent surgery, electrolyte abnormalities, chronic nutritional issues associated with obesity and weight-reduction surgery, and pneumonia. Prolonged air travel, obesity, and recent surgery place her at risk for venous thromboembolism, which may manifest as reduced exercise tolerance. Nausea, vomiting, and abdominal pain persisting for 2 weeks after a Roux-en-Y gastric bypass surgery raises several concerns, including gastric remnant distension (although hiccups are often prominent); stomal stenosis, which typically presents several weeks after surgery; marginal ulceration; or infection at the surgical site or from an anastomotic leak. She may also have a surgery- or medication-related myopathy.
The patient had a history of obesity, hypertension, hyperlipidemia, migraine headaches, and nonalcoholic steatohepatitis. Four years previously, she had undergone gastric banding complicated by band migration and ulceration at the banding site. Her medications were amlodipine, losartan, ranitidine, acetaminophen, and nadroparin for venous thromboembolism prophylaxis during her flight. She denied alcohol, tobacco, or illicit drug use. On further questioning, she reported diaphoresis, mild dyspnea, loose stools, and a sensation of numbness and “heaviness” in her arms. Her abdominal pain was limited to the surgical incision and was controlled with acetaminophen. She denied fevers, cough, chest pain, diplopia, or dysphagia.
Heaviness in both arms could result from an acutely presenting myopathic or neuropathic process, while the coexistence of numbness suggests a sensorimotor polyneuropathy. Obesity and gastric bypass surgery increase her nutritional risk, and thiamine deficiency may present as an acute axonal polyneuropathy (ie, beriberi). Unlike vitamin B12 deficiency, which may take years to develop, thiamine deficiency can present within 4 weeks of gastric bypass surgery. Her dyspnea may be a manifestation of diaphragmatic weakness, although her ostensibly treated pneumonia or as of yet unproven postoperative anemia may be contributing. Chemoprophylaxis mitigates her risk of venous thromboembolism, which is, nonetheless, unlikely to account for the gastrointestinal symptoms and upper extremity weakness. If she is continuing to take amlodipine and losartan but has become volume-depleted, hypotension may be contributing to the generalized weakness.
Physical examination revealed an obese, pale and diaphoretic woman. Her temperature was 36.9°C, heart rate 77 beats per minute, blood pressure 158/90 mm Hg, respiratory rate 28 breaths per minute, and O2 saturation 99% on ambient air. She had no cervical lymphadenopathy and a normal thyroid exam. There were no murmurs on cardiac examination, and jugular venous pressure was estimated at 10 cm of water. Her lung sounds were clear. Her abdomen was soft, nondistended, with localized tenderness and fluctuance around the midline surgical incision with a small amount of purulent drainage. She was alert and oriented to name, date, place, and situation. Cranial nerves II through XII were grossly intact. Strength was 4/5 in bilateral biceps, triceps and distal hand and finger extensors, 3/5 in bilateral deltoids. Strength in hip flexors was 4/5 and it was 5/5 in distal lower extremities. Sensation was intact to pinprick in upper and lower extremities. Biceps reflexes were absent; patellar and ankle reflexes were 1+ and symmetric. The remainder of the physical exam was unremarkable.
The patient has symmetric proximal muscle weakness with upper extremity predominance and preserved strength in her distal lower extremities. A myopathy could explain this pattern of weakness, further substantiated by absent reflexes and reportedly intact sensation. Subacute causes of myopathy include hypokalemia, hyperkalemia, toxic myopathies from medications, or infection-induced rhabdomyolysis. However, she does not report muscle pain, and the loss of reflexes is faster than would be expected with a myopathy. A more thorough sensory examination would inform the assessment of potential neuropathic processes. Guillain-Barré syndrome (GBS) is possible; it most commonly presents as an ascending, distally predominant acute inflammatory demyelinating polyneuropathy (AIDP), although her upper extremity weakness predominates and there are no clear sensory changes. It remains to be determined how her wound infection might relate to her overall presentation.
Her white blood cell count was 12,600/μL (reference range: 3,400-10,000/μL), hemoglobin was 10.2 g/dL, and platelet count was 698,000/μL. Mean corpuscular volume was 86 fL. Serum chemistries were: sodium 138 mEq/L, potassium 3.8 mEq/L, chloride 106 mmol/L, bicarbonate 15 mmol/L, blood urea nitrogen 5 mg/dL, creatinine 0.65 mg/dL, glucose 125 mg/dL, calcium 8.3 mg/dL, magnesium 1.9 mg/dL, phosphorous 2.4 mg/dL, and lactate 1.8 mmol/L (normal: < 2.0 mmol/L). Creatinine kinase (CK), liver function tests, and coagulation panel were normal. Total protein was 6.4 g/dL, and albumin was 2.7 g/dL. Venous blood gas was: pH 7.39 and PCO2 25 mmHg. Urinalysis revealed ketones. Blood and wound cultures were sent for evaluation. A chest x-ray was unremarkable. An electrocardiogram showed normal sinus rhythm. Computed tomography (CT) of the abdomen and pelvis revealed a multiloculated rim-enhancing fluid collection in the anterior abdominal wall (Figure 1).
She does not have any notable electrolyte derangements that would account for her weakness, and the normal creatinine kinase lowers the probability of a myopathy and excludes rhabdomyolysis. Progression of weakness from proximal to distal muscles in a symmetric fashion is consistent with botulism, and she has an intra-abdominal wound infection that could be harboring Clostridium botulinum. Nonetheless, the normal cranial nerve exam and the rarity of botulism occurring with surgical wounds argue against this diagnosis. She should receive intravenous (IV) thiamine for the possibility of beriberi. A lumbar puncture should be performed to assess for albuminocytologic dissociation, which can be seen in patients with GBS.
The patient received high-dose IV thiamine, IV vancomycin, IV piperacillin-tazobactam, and acetaminophen. Over the subsequent 4 hours, her anion gap acidosis worsened. She declined arterial puncture. Repeat venous blood gas was: pH 7.22, PCO2 28 mmHg, and bicarbonate 11 mmol/L. Lactate and glucose were normal. Serum osmolarity was 292 mmol/kg (reference range: 283-301 mmol/kg). She was started on an IV sodium bicarbonate infusion without improvement in her acidemia.
An acute anion gap metabolic acidosis suggests a limited differential diagnosis that includes lactic acidosis, D-lactic acidosis, severe starvation ketoacidosis, acute renal failure, salicylate, or other drug or poison ingestion. Starvation ketoacidosis may be contributing, but a bicarbonate value this low would be unusual. There is no history of alcohol use or other ingestions, and the normal serum osmolality and low osmolal gap (less than 10 mOsm/kg) argue against a poisoning with ethanol, ethylene glycol, or methanol. The initial combined anion gap metabolic acidosis and respiratory alkalosis is consistent with salicylate toxicity, but she does not report aspirin ingestion. Acetaminophen use in the setting of malnutrition or starvation physiology raises the possibility of 5-oxoproline accumulation.
Routine serum lactate does not detect D-lactate, which is produced by colonic bacteria and has been reported in short bowel syndrome and following intestinal bypass surgery. This may occur weeks to months after intestinal procedures, following ingestion of a heavy carbohydrate load, and almost invariably presents with altered mental status and increased anion gap metabolic acidosis, although generalized weakness has been reported.
A surgical consultant drained her wound infection. Fluid Gram stain was negative. D-lactate, salicylate and acetaminophen levels were undetectable. Thiamine pyrophosphate level was 229 nmol/L (reference range: 78-185 nmol/L). Acetaminophen was discontinued and N-acetylcysteine infusion was started for possible 5-oxoprolinemia. Her anion gap acidosis rapidly improved. Twelve hours after admission, she reported sudden onset of blurry vision. Her vital signs were: temperature 37oC, heart rate 110 beats per minute, respiratory rate 40 breaths per minute, blood pressure 168/90, and oxygen saturation 100% on ambient air. Telemetry showed ventricular bigeminy. On examination, she was unable to abduct her right eye; muscle strength was 1/5 in all extremities; biceps, ankle, and patellar reflexes were absent.
Her neurological deficits have progressed over hours to near complete paralysis, asymmetric cranial nerve paresis, and areflexia. Although botulism can cause blurred vision and absent deep tendon reflexes, patients almost always have symmetrical bulbar findings followed by descending paralysis. Should the “numbness” in her arms reported earlier represent undetected sensory deficits, this, too would be inconsistent with botulism.
A diagnosis of GBS ties together several aspects of her presentation and clinical course. Several variants show different patterns of weakness and may involve cranial nerves. Her tachypnea and dyspnea are concerning signs of potential impending respiratory failure. The ventricular bigeminy and mild hypertension could represent autonomic dysfunction that is seen in many cases of GBS.
She was intubated for airway protection. Computed tomography angiography and magnetic resonance imaging of her brain were normal. Cerebral spinal fluid analysis obtained through lumbar puncture showed the following: white blood cell count 3/μL, red blood cell count 11/μL, protein 63 mg/dL (reference range: 15-60mg/dL), and glucose 128 mg/dL (reference range: 40-80mg/dL).
The lumbar puncture is consistent with GBS given the slightly elevated protein and cell count well below 50/μL. Given the severity of her symptoms, treatment with IV immunoglobulin or plasmapheresis should be initiated. Nerve conduction studies (NCS) and electromyography (EMG) are indicated for diagnostic confirmation.
EMG and NCS revealed a severe sensorimotor polyneuropathy with demyelinating features including a conduction block at a noncompressible site, consistent with AIDP. Left sural nerve biopsy confirmed acute demyelinating and mild axonal neuropathy (Figure 2). On hospital day 2, treatment with IV immunoglobulins (IVIG) was initiated; however, she developed anaphylaxis following her second administration and subsequently received plasmapheresis. A tracheostomy was performed for respiratory muscle weakness, and she was discharged to a nursing facility. C. botulinum cultures from the wound eventually returned negative. Following her hospitalization, a serum 5-oxoproline level sent 10 hours after admission returned as elevated, confirming the additional diagnosis of 5-oxoprolinemia. On follow-up, she can sit up and feed herself without assistance, and her gait continues to improve with physical therapy.
DISCUSSION
This patient presented with rapidly progressive weakness that developed in the 2 weeks following bariatric surgery. In the postsurgical setting, patient complaints of weakness are commonly encountered and can pose a diagnostic challenge. Asthenia (ie, general loss of strength or energy) is frequently reported in the immediate postoperative period, and may result from the stress of surgery, pain, deconditioning, or infection. This must be distinguished from true neurologic weakness, which results from dysfunction of the brain, spinal cord, nerve, neuromuscular junction, or muscle. The initial history can help elucidate the inciting events such as preceding surgery, infections or ingestions, and can also categorize the pattern of weakness. The neurologic examination can localize the pathology within the neuraxis. EMG and NCS can distinguish neuropathy from radiculopathy, and categorize the process as axonal, demyelinating, or mixed. In this case, the oculomotor weakness, sensory abnormalities and areflexia signaled a severe sensorimotor polyneuropathy, and EMG/NCS confirmed a demyelinating process consistent with GBS.
Guillain-Barré syndrome is an acute, immune-mediated polyneuropathy. Patients with GBS often present with a preceding respiratory or diarrheal illness; however, the stress of a recent surgery can serve as an inciting event. The syndrome, acute postgastric reduction surgery (APGARS) neuropathy, was introduced in the literature in 2002, describing 3 patients who presented with progressive vomiting, weakness, and hyporeflexia following bariatric surgery.1 The term has been used to describe bariatric surgery patients who developed postoperative quadriparesis, cranial nerve deficits, and respiratory compromise.2 Given the clinical heterogeneity in the literature with relation to APGARS, it is probable that the cases described could result from multiple etiologies. While GBS is purely immune-mediated and can be precipitated by the stress of surgery itself, postbariatric surgery patients are susceptible to many nutritional deficiencies that can lead to similar presentations.3 For example, thiamine (vitamin B1) and cobalamin (vitamin B12) deficiencies cause distinct postbariatric surgery neuropathies.4 Thiamine deficiency may manifest weeks to months after surgery and can rapidly progress, whereas cobalamin deficiency generally develops over 3 to 5 years. Both of these syndromes demonstrate an axonal pattern of nerve injury on EMG/NCS, in contrast to the demyelinating pattern typically seen in GBS. In addition, bariatric surgery patients are at higher risk for copper deficiency, which usually presents as a myeloneuropathy with subacute gait decline and upper motor neuron signs including spasticity.
Although GBS classically presents with symmetric ascending weakness and sensory abnormalities, it may manifest in myriad ways. Factors influencing the presentation include the types of nerve fibers involved (motor, sensory, cranial or autonomic), the predominant mode of injury (axonal vs demyelinating), and the presence or absence of alteration in consciousness.5 The most common form of GBS is AIDP. The classic presentation involves paresthesias in the fingertips and toes followed by lower extremity weakness that ascends over hours to days to involve the arms and potentially the muscles of respiration. A minority of patients with GBS first experience weakness in the upper extremities or facial muscles, and oculomotor involvement is rare.5 Pain is common and often severe.6 Dysautonomia affects most patients with GBS and may manifest as labile blood pressure or arrhythmias.5 Several variant GBS presentation patterns have been described, including acute motor axonal neuropathy, a pure motor form of GBS; ophthalmoplegia, ataxia, and areflexia in Miller Fisher syndrome; and alteration in consciousness, hyperreflexia, ataxia, and ophthalmoparesis in Bickerstaff’s brain stem encephalitis.5
Patients with GBS can progress rapidly to respiratory failure. Serial neurologic exams may signal the diagnosis and inform triage to the appropriate level of care. Measurement of bedside pulmonary function, including mean inspiratory force and functional vital capacity, help to determine if there is weakness of diaphragmatic muscles. Patients with signs or symptoms of diaphragmatic weakness require monitoring in an intensive care unit and potentially early intubation. Treatment with IVIG or plasmapheresis has been found to hasten recovery from GBS, including earlier improvement in muscle strength and a reduced need for mechanical ventilation.7 Treatment selection is based on available resources as both modalities are felt to be equivalent.The majority of patients with GBS make a full recovery over a period of weeks to months, although many have persistent motor weakness. Despite immunotherapy, up to 20% of patients remain severely disabled and approximately 5% die.8 Advanced age, rapid progression of weakness over a period of less than 72 hours, need for mechanical ventilation, and absent compound muscle action potentials on NCS are all associated with prolonged and incomplete recovery.9
This patient developed respiratory failure within 12 hours of hospitalization, prior to being diagnosed with GBS. Even in that short time, the treating clinicians encountered a series of clinical diversions. The initial proximal pattern of muscle weakness suggested a possible myopathic process; the wound infection introduced the possibility of botulism; obesity and recent bariatric surgery triggered concern for thiamine deficiency; and the anion gap acidosis from 5-oxoprolinemia created yet another clinical detour. While the path from presentation to diagnosis is seldom a straight line, when faced with rapidly progressive weakness, it is paramount to forge ahead with an efficient diagnostic evaluation and timely therapeutic intervention.
KEY TEACHING POINTS
- A complaint of general weakness requires distinction between asthenia (ie, general loss of strength or energy) and true neuromuscular weakness from dysfunction of the brain, spinal cord, nerve, neuromuscular junction, and/or muscle.
- Guillain-Barré syndrome may present in a variety of atypical fashions not limited to ascending, distally predominant weakness.
- Acute postgastric reduction surgery neuropathy should be considered in patients presenting with weakness, vomiting, or hyporeflexia after bariatric surgery.
- Acute inflammatory demyelinating polyneuropathy may rapidly progress to respiratory failure, and warrants serial neurologic examinations, monitoring of pulmonary function, and an expedited diagnostic evaluation.
Disclosure
Nothing to report.
1. Akhtar M, Collins MP, Kissel JT. Acute postgastric reduction surgery (APGARS) Neuropathy: A polynutritional, multisystem disorder. Neurology. 2002;58:A68. PubMed
2. Chang CG, Adams-Huet B, Provost DA. Acute post-gastric reduction surgery (APGARS) neuropathy. Obes Surg. 2004;14(2):182-189. PubMed
3. Chang CG, Helling TS, Black WE, Rymer MM. Weakness after gastric bypass. Obes Surg. 2002;12(4):592-597. PubMed
4. Shankar P, Boylan M, Sriram K. Micronutrient deficiencies after bariatric surgery. Nutrition. 2010;26(11-12):1031-1037. PubMed
5. Dimachkie MM, Barohn RJ. Guillain-Barré syndrome and variants. Neurol Clin. 2013;31(2):491-510. PubMed
6. Ruts L, Drenthen J, Jongen JL, et al. Pain in Guillain-Barré syndrome: a long-term follow-up study. Neurology. 2010;75(16):1439-1447. PubMed
7. Hughes RAC, Wijdicks EFM, Barohn R, et al: Quality Standards Subcommittee of the American Academy of Neurology. Practice parameter: immunotherapy for Guillain-Barré syndrome: report of the Quality Standards Subcommittee of the American Academy of Neurology. Neurology. 2003;61:736-740. PubMed
8. Hughes RA, Swan AV, Raphaël JC, Annane D, van Koningsveld R, van Doorn PA. Immunotherapy for Guillain-Barré syndrome: a systematic review. Brain. 2007;130(Pt 9):2245-2257. PubMed
9. Rajabally YA, Uncini A. Outcome and predictors in Guillain-Barré syndrome. J Neurol Neurosurg Psychiatry. 2012;83(7):711-718. PubMed
© 2017 Society of Hospital Medicine
SCHOLAR Project
The structure and function of academic hospital medicine programs (AHPs) has evolved significantly with the growth of hospital medicine.[1, 2, 3, 4] Many AHPs formed in response to regulatory and financial changes, which drove demand for increased trainee oversight, improved clinical efficiency, and growth in nonteaching services staffed by hospitalists. Differences in local organizational contexts and needs have contributed to great variability in AHP program design and operations. As AHPs have become more established, the need to engage academic hospitalists in scholarship and activities that support professional development and promotion has been recognized. Defining sustainable and successful positions for academic hospitalists is a priority called for by leaders in the field.[5, 6]
In this rapidly evolving context, AHPs have employed a variety of approaches to organizing clinical and academic faculty roles, without guiding evidence or consensus‐based performance benchmarks. A number of AHPs have achieved success along traditional academic metrics of research, scholarship, and education. Currently, it is not known whether specific approaches to AHP organization, structure, or definition of faculty roles are associated with achievement of more traditional markers of academic success.
The Academic Committee of the Society of Hospital Medicine (SHM), and the Academic Hospitalist Task Force of the Society of General Internal Medicine (SGIM) had separately initiated projects to explore characteristics associated with success in AHPs. In 2012, these organizations combined efforts to jointly develop and implement the SCHOLAR (SuCcessful HOspitaLists in Academics and Research) project. The goals were to identify successful AHPs using objective criteria, and to then study those groups in greater detail to generate insights that would be broadly relevant to the field. Efforts to clarify the factors within AHPs linked to success by traditional academic metrics will benefit hospitalists, their leaders, and key stakeholders striving to achieve optimal balance between clinical and academic roles. We describe the initial work of the SCHOLAR project, our definitions of academic success in AHPs, and the characteristics of a cohort of exemplary AHPs who achieved the highest levels on these metrics.
METHODS
Defining Success
The 11 members of the SCHOLAR project held a variety of clinical and academic roles within a geographically diverse group of AHPs. We sought to create a functional definition of success applicable to AHPs. As no gold standard currently exists, we used a consensus process among task force members to arrive at a definition that was quantifiable, feasible, and meaningful. The first step was brainstorming on conference calls held 1 to 2 times monthly over 4 months. Potential defining characteristics that emerged from these discussions related to research, teaching, and administrative activities. When potential characteristics were proposed, we considered how to operationalize each one. Each characteristic was discussed until there was consensus from the entire group. Those around education and administration were the most complex, as many roles are locally driven and defined, and challenging to quantify. For this reason, we focused on promotion as a more global approach to assessing academic hospitalist success in these areas. Although criteria for academic advancement also vary across institutions, we felt that promotion generally reflected having met some threshold of academic success. We also wanted to recognize that scholarship occurs outside the context of funded research. Ultimately, 3 key domains emerged: research grant funding, faculty promotion, and scholarship.
After these 3 domains were identified, the group sought to define quantitative metrics to assess performance. These discussions occurred on subsequent calls over a 4‐month period. Between calls, group members gathered additional information to facilitate assessment of the feasibility of proposed metrics, reporting on progress via email. Again, group consensus was sought for each metric considered. Data on grant funding and successful promotions were available from a previous survey conducted through the SHM in 2011. Leaders from 170 AHPs were contacted, with 50 providing complete responses to the 21‐item questionnaire (see Supporting Information, Appendix 1, in the online version of this article). Results of the survey, heretofore referred to as the Leaders of Academic Hospitalist Programs survey (LAHP‐50), have been described elsewhere.[7] For the purposes of this study, we used the self‐reported data about grant funding and promotions contained in the survey to reflect the current state of the field. Although the survey response rate was approximately 30%, the survey was not anonymous, and many reputationally prominent academic hospitalist programs were represented. For these reasons, the group members felt that the survey results were relevant for the purposes of assessing academic success.
In the LAHP‐50, funding was defined as principal investigator or coinvestigator roles on federally and nonfederally funded research, clinical trials, internal grants, and any other extramurally funded projects. Mean and median funding for the overall sample was calculated. Through a separate question, each program's total faculty full‐time equivalent (FTE) count was reported, allowing us to adjust for group size by assessing both total funding per group and funding/FTE for each responding AHP.
Promotions were defined by the self‐reported number of faculty at each of the following ranks: instructor, assistant professor, associate professor, full professor, and professor above scale/emeritus. In addition, a category of nonacademic track (eg, adjunct faculty, clinical associate) was included to capture hospitalists that did not fit into the traditional promotions categories. We did not distinguish between tenure‐track and nontenure‐track academic ranks. LAHP‐50 survey respondents reported the number of faculty in their group at each academic rank. Given that the majority of academic hospitalists hold a rank of assistant professor or lower,[6, 8, 9] and that the number of full professors was only 3% in the LAHP‐50 cohort, we combined the faculty at the associate and full professor ranks, defining successfully promoted faculty as the percent of hospitalists above the rank of assistant professor.
We created a new metric to assess scholarly output. We had considerable discussion of ways to assess the numbers of peer‐reviewed manuscripts generated by AHPs. However, the group had concerns about the feasibility of identification and attribution of authors to specific AHPs through literature searches. We considered examining only publications in the Journal of Hospital Medicine and the Journal of General Internal Medicine, but felt that this would exclude significant work published by hospitalists in fields of medical education or health services research that would more likely appear in alternate journals. Instead, we quantified scholarship based on the number of abstracts presented at national meetings. We focused on meetings of the SHM and SGIM as the primary professional societies representing hospital medicine. The group felt that even work published outside of the journals of our professional societies would likely be presented at those meetings. We used the following strategy: We reviewed research abstracts accepted for presentation as posters or oral abstracts at the 2010 and 2011 SHM national meetings, and research abstracts with a primary or secondary category of hospital medicine at the 2010 and 2011 SGIM national meetings. By including submissions at both SGIM and SHM meetings, we accounted for the fact that some programs may gravitate more to one society meeting or another. We did not include abstracts in the clinical vignettes or innovations categories. We tallied the number of abstracts by group affiliation of the authors for each of the 4 meetings above and created a cumulative total per group for the 2‐year period. Abstracts with authors from different AHPs were counted once for each individual group. Members of the study group reviewed abstracts from each of the meetings in pairs. Reviewers worked separately and compared tallies of results to ensure consistent tabulations. Internet searches were conducted to identify or confirm author affiliations if it was not apparent in the abstract author list. Abstract tallies were compiled without regard to whether programs had completed the LAHP‐50 survey; thus, we collected data on programs that did not respond to the LAHP‐50 survey.
Identification of the SCHOLAR Cohort
To identify our cohort of top‐performing AHPs, we combined the funding and promotions data from the LAHP‐50 sample with the abstract data. We limited our sample to adult hospital medicine groups to reduce heterogeneity. We created rank lists of programs in each category (grant funding, successful promotions, and scholarship), using data from the LAHP‐50 survey to rank programs on funding and promotions, and data from our abstract counts to rank on scholarship. We limited the top‐performing list in each category to 10 institutions as a cutoff. Because we set a threshold of at least $1 million in total funding, we identified only 9 top performing AHPs with regard to grant funding. We also calculated mean funding/FTE. We chose to rank programs only by funding/FTE rather than total funding per program to better account for group size. For successful promotions, we ranked programs by the percentage of senior faculty. For abstract counts, we included programs whose faculty presented abstracts at a minimum of 2 separate meetings, and ranked programs based on the total number of abstracts per group.
This process resulted in separate lists of top performing programs in each of the 3 domains we associated with academic success, arranged in descending order by grant dollars/FTE, percent of senior faculty, and abstract counts (Table 1). Seventeen different programs were represented across these 3 top 10 lists. One program appeared on all 3 lists, 8 programs appeared on 2 lists, and the remainder appeared on a single list (Table 2). Seven of these programs were identified solely based on abstract presentations, diversifying our top groups beyond only those who completed the LAHP‐50 survey. We considered all of these programs to represent high performance in academic hospital medicine. The group selected this inclusive approach because we recognized that any 1 metric was potentially limited, and we sought to identify diverse pathways to success.
| Funding | Promotions | Scholarship | |
|---|---|---|---|
| Grant $/FTE | Total Grant $ | Senior Faculty, No. (%) | Total Abstract Count |
| |||
| $1,409,090 | $15,500,000 | 3 (60%) | 23 |
| $1,000,000 | $9,000,000 | 3 (60%) | 21 |
| $750,000 | $8,000,000 | 4 (57%) | 20 |
| $478,609 | $6,700,535 | 9 (53%) | 15 |
| $347,826 | $3,000,000 | 8 (44%) | 11 |
| $86,956 | $3,000,000 | 14 (41%) | 11 |
| $66,666 | $2,000,000 | 17 (36%) | 10 |
| $46,153 | $1,500,000 | 9 (33%) | 10 |
| $38,461 | $1,000,000 | 2 (33%) | 9 |
| 4 (31%) | 9 | ||
| Selection Criteria for SCHOLAR Cohort | No. of Programs |
|---|---|
| |
| Abstracts, funding, and promotions | 1 |
| Abstracts plus promotions | 4 |
| Abstracts plus funding | 3 |
| Funding plus promotion | 1 |
| Funding only | 1 |
| Abstract only | 7 |
| Total | 17 |
| Top 10 abstract count | |
| 4 meetings | 2 |
| 3 meetings | 2 |
| 2 meetings | 6 |
The 17 unique adult AHPs appearing on at least 1 of the top 10 lists comprised the SCHOLAR cohort of programs that we studied in greater detail. Data reflecting program demographics were solicited directly from leaders of the AHPs identified in the SCHOLAR cohort, including size and age of program, reporting structure, number of faculty at various academic ranks (for programs that did not complete the LAHP‐50 survey), and number of faculty with fellowship training (defined as any postresidency fellowship program).
Subsequently, we performed comparative analyses between the programs in the SCHOLAR cohort to the general population of AHPs reflected by the LAHP‐50 sample. Because abstract presentations were not recorded in the original LAHP‐50 survey instrument, it was not possible to perform a benchmarking comparison for the scholarship domain.
Data Analysis
To measure the success of the SCHOLAR cohort we compared the grant funding and proportion of successfully promoted faculty at the SCHOLAR programs to those in the overall LAHP‐50 sample. Differences in mean and median grant funding were compared using t tests and Mann‐Whitney rank sum tests. Proportion of promoted faculty were compared using 2 tests. A 2‐tailed of 0.05 was used to test significance of differences.
RESULTS
Demographics
Among the AHPs in the SCHOLAR cohort, the mean program age was 13.2 years (range, 618 years), and the mean program size was 36 faculty (range, 1895; median, 28). On average, 15% of faculty members at SCHOLAR programs were fellowship trained (range, 0%37%). Reporting structure among the SCHOLAR programs was as follows: 53% were an independent division or section of the department of medicine; 29% were a section within general internal medicine, and 18% were an independent clinical group.
Grant Funding
Table 3 compares grant funding in the SCHOLAR programs to programs in the overall LAHP‐50 sample. Mean funding per group and mean funding per FTE were significantly higher in the SCHOLAR group than in the overall sample.
| Funding (Millions) | ||
|---|---|---|
| LAHP‐50 Overall Sample | SCHOLAR | |
| ||
| Median grant funding/AHP | 0.060 | 1.500* |
| Mean grant funding/AHP | 1.147 (015) | 3.984* (015) |
| Median grant funding/FTE | 0.004 | 0.038* |
| Mean grant funding/FTE | 0.095 (01.4) | 0.364* (01.4) |
Thirteen of the SCHOLAR programs were represented in the initial LAHP‐50, but 2 did not report a dollar amount for grants and contracts. Therefore, data for total grant funding were available for only 65% (11 of 17) of the programs in the SCHOLAR cohort. Of note, 28% of AHPs in the overall LAHP‐50 sample reported no external funding sources.
Faculty Promotion
Figure 1 demonstrates the proportion of faculty at various academic ranks. The percent of faculty above the rank of assistant professor in the SCHOLAR programs exceeded those in the overall LAHP‐50 by 5% (17.9% vs 12.8%, P = 0.01). Of note, 6% of the hospitalists at AHPs in the SCHOLAR programs were on nonfaculty tracks.
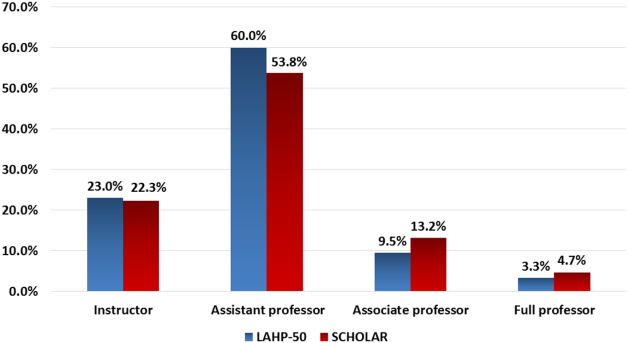
Scholarship
Mean abstract output over the 2‐year period measured was 10.8 (range, 323) in the SCHOLAR cohort. Because we did not collect these data for the LAHP‐50 group, comparative analyses were not possible.
DISCUSSION
Using a definition of academic success that incorporated metrics of grant funding, faculty promotion, and scholarly output, we identified a unique subset of successful AHPsthe SCHOLAR cohort. The programs represented in the SCHOLAR cohort were generally large and relatively mature. Despite this, the cohort consisted of mostly junior faculty, had a paucity of fellowship‐trained hospitalists, and not all reported grant funding.
Prior published work reported complementary findings.[6, 8, 9] A survey of 20 large, well‐established academic hospitalist programs in 2008 found that the majority of hospitalists were junior faculty with a limited publication portfolio. Of the 266 respondents in that study, 86% reported an academic rank at or below assistant professor; funding was not explored.[9] Our similar findings 4 years later add to this work by demonstrating trends over time, and suggest that progress toward creating successful pathways for academic advancement has been slow. In a 2012 survey of the SHM membership, 28% of hospitalists with academic appointments reported no current or future plans to engage in research.[8] These findings suggest that faculty in AHPs may define scholarship through nontraditional pathways, or in some cases choose not to pursue or prioritize scholarship altogether.
Our findings also add to the literature with regard to our assessment of funding, which was variable across the SCHOLAR group. The broad range of funding in the SCHOLAR programs for which we have data (grant dollars $0$15 million per program) suggests that opportunities to improve supported scholarship remain, even among a selected cohort of successful AHPs. The predominance of junior faculty in the SCHOLAR programs may be a reason for this variation. Junior faculty may be engaged in research with funding directed to senior mentors outside their AHP. Alternatively, they may pursue meaningful local hospital quality improvement or educational innovations not supported by external grants, or hold leadership roles in education, quality, or information technology that allow for advancement and promotion without external grant funding. As the scope and impact of these roles increases, senior leaders with alternate sources of support may rely less on research funds; this too may explain some of the differences. Our findings are congruent with results of a study that reviewed original research published by hospitalists, and concluded that the majority of hospitalist research was not externally funded.[8] Our approach for assessing grant funding by adjusting for FTE had the potential to inadvertently favor smaller well‐funded groups over larger ones; however, programs in our sample were similarly represented when ranked by funding/FTE or total grant dollars. As many successful AHPs do concentrate their research funding among a core of focused hospitalist researchers, our definition may not be the ideal metric for some programs.
We chose to define scholarship based on abstract output, rather than peer‐reviewed publications. Although this choice was necessary from a feasibility perspective, it may have excluded programs that prioritize peer‐reviewed publications over abstracts. Although we were unable to incorporate a search strategy to accurately and comprehensively track the publication output attributed specifically to hospitalist researchers and quantify it by program, others have since defined such an approach.[8] However, tracking abstracts theoretically allowed insights into a larger volume of innovative and creative work generated by top AHPs by potentially including work in the earlier stages of development.
We used a consensus‐based definition of success to define our SCHOLAR cohort. There are other ways to measure academic success, which if applied, may have yielded a different sample of programs. For example, over half of the original research articles published in the Journal of Hospital Medicine over a 7‐year span were generated from 5 academic centers.[8] This definition of success may be equally credible, though we note that 4 of these 5 programs were also included in the SCHOLAR cohort. We feel our broader approach was more reflective of the variety of pathways to success available to academic hospitalists. Before our metrics are applied as a benchmarking tool, however, they should ideally be combined with factors not measured in our study to ensure a more comprehensive or balanced reflection of academic success. Factors such as mentorship, level of hospitalist engagement,[10] prevalence of leadership opportunities, operational and fiscal infrastructure, and the impact of local quality, safety, and value efforts should be considered.
Comparison of successfully promoted faculty at AHPs across the country is inherently limited by the wide variation in promotion standards across different institutions; controlling for such differences was not possible with our methodology. For example, it appears that several programs with relatively few senior faculty may have met metrics leading to their inclusion in the SCHOLAR group because of their small program size. Future benchmarking efforts for promotion at AHPs should take scaling into account and consider both total number as well as percentage of senior faculty when evaluating success.
Our methodology has several limitations. Survey data were self‐reported and not independently validated, and as such are subject to recall and reporting biases. Response bias inherently excluded some AHPs that may have met our grant funding or promotions criteria had they participated in the initial LAHP‐50 survey, though we identified and included additional programs through our scholarship metric, increasing the representativeness of the SCHOLAR cohort. Given the dynamic nature of the field, the age of the data we relied upon for analysis limits the generalizability of our specific benchmarks to current practice. However, the development of academic success occurs over the long‐term, and published data on academic hospitalist productivity are consistent with this slower time course.[8] Despite these limitations, our data inform the general topic of gauging performance of AHPs, underscoring the challenges of developing and applying metrics of success, and highlight the variability of performance on selected metrics even among a relatively small group of 17 programs.
In conclusion, we have created a method to quantify academic success that may be useful to academic hospitalists and their group leaders as they set targets for improvement in the field. Even among our SCHOLAR cohort, room for ongoing improvement in development of funded scholarship and a core of senior faculty exists. Further investigation into the unique features of successful groups will offer insight to leaders in academic hospital medicine regarding infrastructure and processes that should be embraced to raise the bar for all AHPs. In addition, efforts to further define and validate nontraditional approaches to scholarship that allow for successful promotion at AHPs would be informative. We view our work less as a singular approach to benchmarking standards for AHPs, and more a call to action to continue efforts to balance scholarly activity and broad professional development of academic hospitalists with increasing clinical demands.
Acknowledgements
The authors thank all of the AHP leaders who participated in the SCHOLAR project. They also thank the Society of Hospital Medicine and Society of General Internal Medicine and the SHM Academic Committee and SGIM Academic Hospitalist Task Force for their support of this work.
Disclosures
The work reported here was supported by the Department of Veterans Affairs, Veterans Health Administration, South Texas Veterans Health Care System. The views expressed in this article are those of the authors and do not necessarily reflect the position or policy of the Department of Veterans Affairs. The authors report no conflicts of interest.
- , , , , . Characteristics of primary care providers who adopted the hospitalist model from 2001 to 2009. J Hosp Med. 2015;10(2):75–82.
- , , , . Growth in the care of older patients by hospitalists in the United States. N Engl J Med. 2009;360(11):1102–1112.
- , , , , . Updating threshold‐based identification of hospitalists in 2012 Medicare pay data. J Hosp Med. 2016;11(1):45–47.
- , , , . Use of hospitalists by Medicare beneficiaries: a national picture. Medicare Medicaid Res Rev. 2014;4(2).
- , , , , , . Challenges and opportunities in Academic Hospital Medicine: report from the Academic Hospital Medicine Summit. J Hosp Med. 2009;4(4):240–246.
- , , , . Survey of US academic hospitalist leaders about mentorship and academic activities in hospitalist groups. J Hosp Med. 2011;6(1):5–9.
- , , , , , . The structure of hospital medicine programs at academic medical centers [abstract]. J Hosp Med. 2012;7(suppl 2):s92.
- , , , , . Research and publication trends in hospital medicine. J Hosp Med. 2014;9(3):148–154.
- , , , , , . Mentorship, productivity, and promotion among academic hospitalists. J Gen Intern Med. 2012;27(1):23–27.
- , , , et al. The key principles and characteristics of an effective hospital medicine group: an assessment guide for hospitals and hospitalists. J Hosp Med. 2014;9(2):123–128.
The structure and function of academic hospital medicine programs (AHPs) has evolved significantly with the growth of hospital medicine.[1, 2, 3, 4] Many AHPs formed in response to regulatory and financial changes, which drove demand for increased trainee oversight, improved clinical efficiency, and growth in nonteaching services staffed by hospitalists. Differences in local organizational contexts and needs have contributed to great variability in AHP program design and operations. As AHPs have become more established, the need to engage academic hospitalists in scholarship and activities that support professional development and promotion has been recognized. Defining sustainable and successful positions for academic hospitalists is a priority called for by leaders in the field.[5, 6]
In this rapidly evolving context, AHPs have employed a variety of approaches to organizing clinical and academic faculty roles, without guiding evidence or consensus‐based performance benchmarks. A number of AHPs have achieved success along traditional academic metrics of research, scholarship, and education. Currently, it is not known whether specific approaches to AHP organization, structure, or definition of faculty roles are associated with achievement of more traditional markers of academic success.
The Academic Committee of the Society of Hospital Medicine (SHM), and the Academic Hospitalist Task Force of the Society of General Internal Medicine (SGIM) had separately initiated projects to explore characteristics associated with success in AHPs. In 2012, these organizations combined efforts to jointly develop and implement the SCHOLAR (SuCcessful HOspitaLists in Academics and Research) project. The goals were to identify successful AHPs using objective criteria, and to then study those groups in greater detail to generate insights that would be broadly relevant to the field. Efforts to clarify the factors within AHPs linked to success by traditional academic metrics will benefit hospitalists, their leaders, and key stakeholders striving to achieve optimal balance between clinical and academic roles. We describe the initial work of the SCHOLAR project, our definitions of academic success in AHPs, and the characteristics of a cohort of exemplary AHPs who achieved the highest levels on these metrics.
METHODS
Defining Success
The 11 members of the SCHOLAR project held a variety of clinical and academic roles within a geographically diverse group of AHPs. We sought to create a functional definition of success applicable to AHPs. As no gold standard currently exists, we used a consensus process among task force members to arrive at a definition that was quantifiable, feasible, and meaningful. The first step was brainstorming on conference calls held 1 to 2 times monthly over 4 months. Potential defining characteristics that emerged from these discussions related to research, teaching, and administrative activities. When potential characteristics were proposed, we considered how to operationalize each one. Each characteristic was discussed until there was consensus from the entire group. Those around education and administration were the most complex, as many roles are locally driven and defined, and challenging to quantify. For this reason, we focused on promotion as a more global approach to assessing academic hospitalist success in these areas. Although criteria for academic advancement also vary across institutions, we felt that promotion generally reflected having met some threshold of academic success. We also wanted to recognize that scholarship occurs outside the context of funded research. Ultimately, 3 key domains emerged: research grant funding, faculty promotion, and scholarship.
After these 3 domains were identified, the group sought to define quantitative metrics to assess performance. These discussions occurred on subsequent calls over a 4‐month period. Between calls, group members gathered additional information to facilitate assessment of the feasibility of proposed metrics, reporting on progress via email. Again, group consensus was sought for each metric considered. Data on grant funding and successful promotions were available from a previous survey conducted through the SHM in 2011. Leaders from 170 AHPs were contacted, with 50 providing complete responses to the 21‐item questionnaire (see Supporting Information, Appendix 1, in the online version of this article). Results of the survey, heretofore referred to as the Leaders of Academic Hospitalist Programs survey (LAHP‐50), have been described elsewhere.[7] For the purposes of this study, we used the self‐reported data about grant funding and promotions contained in the survey to reflect the current state of the field. Although the survey response rate was approximately 30%, the survey was not anonymous, and many reputationally prominent academic hospitalist programs were represented. For these reasons, the group members felt that the survey results were relevant for the purposes of assessing academic success.
In the LAHP‐50, funding was defined as principal investigator or coinvestigator roles on federally and nonfederally funded research, clinical trials, internal grants, and any other extramurally funded projects. Mean and median funding for the overall sample was calculated. Through a separate question, each program's total faculty full‐time equivalent (FTE) count was reported, allowing us to adjust for group size by assessing both total funding per group and funding/FTE for each responding AHP.
Promotions were defined by the self‐reported number of faculty at each of the following ranks: instructor, assistant professor, associate professor, full professor, and professor above scale/emeritus. In addition, a category of nonacademic track (eg, adjunct faculty, clinical associate) was included to capture hospitalists that did not fit into the traditional promotions categories. We did not distinguish between tenure‐track and nontenure‐track academic ranks. LAHP‐50 survey respondents reported the number of faculty in their group at each academic rank. Given that the majority of academic hospitalists hold a rank of assistant professor or lower,[6, 8, 9] and that the number of full professors was only 3% in the LAHP‐50 cohort, we combined the faculty at the associate and full professor ranks, defining successfully promoted faculty as the percent of hospitalists above the rank of assistant professor.
We created a new metric to assess scholarly output. We had considerable discussion of ways to assess the numbers of peer‐reviewed manuscripts generated by AHPs. However, the group had concerns about the feasibility of identification and attribution of authors to specific AHPs through literature searches. We considered examining only publications in the Journal of Hospital Medicine and the Journal of General Internal Medicine, but felt that this would exclude significant work published by hospitalists in fields of medical education or health services research that would more likely appear in alternate journals. Instead, we quantified scholarship based on the number of abstracts presented at national meetings. We focused on meetings of the SHM and SGIM as the primary professional societies representing hospital medicine. The group felt that even work published outside of the journals of our professional societies would likely be presented at those meetings. We used the following strategy: We reviewed research abstracts accepted for presentation as posters or oral abstracts at the 2010 and 2011 SHM national meetings, and research abstracts with a primary or secondary category of hospital medicine at the 2010 and 2011 SGIM national meetings. By including submissions at both SGIM and SHM meetings, we accounted for the fact that some programs may gravitate more to one society meeting or another. We did not include abstracts in the clinical vignettes or innovations categories. We tallied the number of abstracts by group affiliation of the authors for each of the 4 meetings above and created a cumulative total per group for the 2‐year period. Abstracts with authors from different AHPs were counted once for each individual group. Members of the study group reviewed abstracts from each of the meetings in pairs. Reviewers worked separately and compared tallies of results to ensure consistent tabulations. Internet searches were conducted to identify or confirm author affiliations if it was not apparent in the abstract author list. Abstract tallies were compiled without regard to whether programs had completed the LAHP‐50 survey; thus, we collected data on programs that did not respond to the LAHP‐50 survey.
Identification of the SCHOLAR Cohort
To identify our cohort of top‐performing AHPs, we combined the funding and promotions data from the LAHP‐50 sample with the abstract data. We limited our sample to adult hospital medicine groups to reduce heterogeneity. We created rank lists of programs in each category (grant funding, successful promotions, and scholarship), using data from the LAHP‐50 survey to rank programs on funding and promotions, and data from our abstract counts to rank on scholarship. We limited the top‐performing list in each category to 10 institutions as a cutoff. Because we set a threshold of at least $1 million in total funding, we identified only 9 top performing AHPs with regard to grant funding. We also calculated mean funding/FTE. We chose to rank programs only by funding/FTE rather than total funding per program to better account for group size. For successful promotions, we ranked programs by the percentage of senior faculty. For abstract counts, we included programs whose faculty presented abstracts at a minimum of 2 separate meetings, and ranked programs based on the total number of abstracts per group.
This process resulted in separate lists of top performing programs in each of the 3 domains we associated with academic success, arranged in descending order by grant dollars/FTE, percent of senior faculty, and abstract counts (Table 1). Seventeen different programs were represented across these 3 top 10 lists. One program appeared on all 3 lists, 8 programs appeared on 2 lists, and the remainder appeared on a single list (Table 2). Seven of these programs were identified solely based on abstract presentations, diversifying our top groups beyond only those who completed the LAHP‐50 survey. We considered all of these programs to represent high performance in academic hospital medicine. The group selected this inclusive approach because we recognized that any 1 metric was potentially limited, and we sought to identify diverse pathways to success.
| Funding | Promotions | Scholarship | |
|---|---|---|---|
| Grant $/FTE | Total Grant $ | Senior Faculty, No. (%) | Total Abstract Count |
| |||
| $1,409,090 | $15,500,000 | 3 (60%) | 23 |
| $1,000,000 | $9,000,000 | 3 (60%) | 21 |
| $750,000 | $8,000,000 | 4 (57%) | 20 |
| $478,609 | $6,700,535 | 9 (53%) | 15 |
| $347,826 | $3,000,000 | 8 (44%) | 11 |
| $86,956 | $3,000,000 | 14 (41%) | 11 |
| $66,666 | $2,000,000 | 17 (36%) | 10 |
| $46,153 | $1,500,000 | 9 (33%) | 10 |
| $38,461 | $1,000,000 | 2 (33%) | 9 |
| 4 (31%) | 9 | ||
| Selection Criteria for SCHOLAR Cohort | No. of Programs |
|---|---|
| |
| Abstracts, funding, and promotions | 1 |
| Abstracts plus promotions | 4 |
| Abstracts plus funding | 3 |
| Funding plus promotion | 1 |
| Funding only | 1 |
| Abstract only | 7 |
| Total | 17 |
| Top 10 abstract count | |
| 4 meetings | 2 |
| 3 meetings | 2 |
| 2 meetings | 6 |
The 17 unique adult AHPs appearing on at least 1 of the top 10 lists comprised the SCHOLAR cohort of programs that we studied in greater detail. Data reflecting program demographics were solicited directly from leaders of the AHPs identified in the SCHOLAR cohort, including size and age of program, reporting structure, number of faculty at various academic ranks (for programs that did not complete the LAHP‐50 survey), and number of faculty with fellowship training (defined as any postresidency fellowship program).
Subsequently, we performed comparative analyses between the programs in the SCHOLAR cohort to the general population of AHPs reflected by the LAHP‐50 sample. Because abstract presentations were not recorded in the original LAHP‐50 survey instrument, it was not possible to perform a benchmarking comparison for the scholarship domain.
Data Analysis
To measure the success of the SCHOLAR cohort we compared the grant funding and proportion of successfully promoted faculty at the SCHOLAR programs to those in the overall LAHP‐50 sample. Differences in mean and median grant funding were compared using t tests and Mann‐Whitney rank sum tests. Proportion of promoted faculty were compared using 2 tests. A 2‐tailed of 0.05 was used to test significance of differences.
RESULTS
Demographics
Among the AHPs in the SCHOLAR cohort, the mean program age was 13.2 years (range, 618 years), and the mean program size was 36 faculty (range, 1895; median, 28). On average, 15% of faculty members at SCHOLAR programs were fellowship trained (range, 0%37%). Reporting structure among the SCHOLAR programs was as follows: 53% were an independent division or section of the department of medicine; 29% were a section within general internal medicine, and 18% were an independent clinical group.
Grant Funding
Table 3 compares grant funding in the SCHOLAR programs to programs in the overall LAHP‐50 sample. Mean funding per group and mean funding per FTE were significantly higher in the SCHOLAR group than in the overall sample.
| Funding (Millions) | ||
|---|---|---|
| LAHP‐50 Overall Sample | SCHOLAR | |
| ||
| Median grant funding/AHP | 0.060 | 1.500* |
| Mean grant funding/AHP | 1.147 (015) | 3.984* (015) |
| Median grant funding/FTE | 0.004 | 0.038* |
| Mean grant funding/FTE | 0.095 (01.4) | 0.364* (01.4) |
Thirteen of the SCHOLAR programs were represented in the initial LAHP‐50, but 2 did not report a dollar amount for grants and contracts. Therefore, data for total grant funding were available for only 65% (11 of 17) of the programs in the SCHOLAR cohort. Of note, 28% of AHPs in the overall LAHP‐50 sample reported no external funding sources.
Faculty Promotion
Figure 1 demonstrates the proportion of faculty at various academic ranks. The percent of faculty above the rank of assistant professor in the SCHOLAR programs exceeded those in the overall LAHP‐50 by 5% (17.9% vs 12.8%, P = 0.01). Of note, 6% of the hospitalists at AHPs in the SCHOLAR programs were on nonfaculty tracks.
Scholarship
Mean abstract output over the 2‐year period measured was 10.8 (range, 323) in the SCHOLAR cohort. Because we did not collect these data for the LAHP‐50 group, comparative analyses were not possible.
DISCUSSION
Using a definition of academic success that incorporated metrics of grant funding, faculty promotion, and scholarly output, we identified a unique subset of successful AHPsthe SCHOLAR cohort. The programs represented in the SCHOLAR cohort were generally large and relatively mature. Despite this, the cohort consisted of mostly junior faculty, had a paucity of fellowship‐trained hospitalists, and not all reported grant funding.
Prior published work reported complementary findings.[6, 8, 9] A survey of 20 large, well‐established academic hospitalist programs in 2008 found that the majority of hospitalists were junior faculty with a limited publication portfolio. Of the 266 respondents in that study, 86% reported an academic rank at or below assistant professor; funding was not explored.[9] Our similar findings 4 years later add to this work by demonstrating trends over time, and suggest that progress toward creating successful pathways for academic advancement has been slow. In a 2012 survey of the SHM membership, 28% of hospitalists with academic appointments reported no current or future plans to engage in research.[8] These findings suggest that faculty in AHPs may define scholarship through nontraditional pathways, or in some cases choose not to pursue or prioritize scholarship altogether.
Our findings also add to the literature with regard to our assessment of funding, which was variable across the SCHOLAR group. The broad range of funding in the SCHOLAR programs for which we have data (grant dollars $0$15 million per program) suggests that opportunities to improve supported scholarship remain, even among a selected cohort of successful AHPs. The predominance of junior faculty in the SCHOLAR programs may be a reason for this variation. Junior faculty may be engaged in research with funding directed to senior mentors outside their AHP. Alternatively, they may pursue meaningful local hospital quality improvement or educational innovations not supported by external grants, or hold leadership roles in education, quality, or information technology that allow for advancement and promotion without external grant funding. As the scope and impact of these roles increases, senior leaders with alternate sources of support may rely less on research funds; this too may explain some of the differences. Our findings are congruent with results of a study that reviewed original research published by hospitalists, and concluded that the majority of hospitalist research was not externally funded.[8] Our approach for assessing grant funding by adjusting for FTE had the potential to inadvertently favor smaller well‐funded groups over larger ones; however, programs in our sample were similarly represented when ranked by funding/FTE or total grant dollars. As many successful AHPs do concentrate their research funding among a core of focused hospitalist researchers, our definition may not be the ideal metric for some programs.
We chose to define scholarship based on abstract output, rather than peer‐reviewed publications. Although this choice was necessary from a feasibility perspective, it may have excluded programs that prioritize peer‐reviewed publications over abstracts. Although we were unable to incorporate a search strategy to accurately and comprehensively track the publication output attributed specifically to hospitalist researchers and quantify it by program, others have since defined such an approach.[8] However, tracking abstracts theoretically allowed insights into a larger volume of innovative and creative work generated by top AHPs by potentially including work in the earlier stages of development.
We used a consensus‐based definition of success to define our SCHOLAR cohort. There are other ways to measure academic success, which if applied, may have yielded a different sample of programs. For example, over half of the original research articles published in the Journal of Hospital Medicine over a 7‐year span were generated from 5 academic centers.[8] This definition of success may be equally credible, though we note that 4 of these 5 programs were also included in the SCHOLAR cohort. We feel our broader approach was more reflective of the variety of pathways to success available to academic hospitalists. Before our metrics are applied as a benchmarking tool, however, they should ideally be combined with factors not measured in our study to ensure a more comprehensive or balanced reflection of academic success. Factors such as mentorship, level of hospitalist engagement,[10] prevalence of leadership opportunities, operational and fiscal infrastructure, and the impact of local quality, safety, and value efforts should be considered.
Comparison of successfully promoted faculty at AHPs across the country is inherently limited by the wide variation in promotion standards across different institutions; controlling for such differences was not possible with our methodology. For example, it appears that several programs with relatively few senior faculty may have met metrics leading to their inclusion in the SCHOLAR group because of their small program size. Future benchmarking efforts for promotion at AHPs should take scaling into account and consider both total number as well as percentage of senior faculty when evaluating success.
Our methodology has several limitations. Survey data were self‐reported and not independently validated, and as such are subject to recall and reporting biases. Response bias inherently excluded some AHPs that may have met our grant funding or promotions criteria had they participated in the initial LAHP‐50 survey, though we identified and included additional programs through our scholarship metric, increasing the representativeness of the SCHOLAR cohort. Given the dynamic nature of the field, the age of the data we relied upon for analysis limits the generalizability of our specific benchmarks to current practice. However, the development of academic success occurs over the long‐term, and published data on academic hospitalist productivity are consistent with this slower time course.[8] Despite these limitations, our data inform the general topic of gauging performance of AHPs, underscoring the challenges of developing and applying metrics of success, and highlight the variability of performance on selected metrics even among a relatively small group of 17 programs.
In conclusion, we have created a method to quantify academic success that may be useful to academic hospitalists and their group leaders as they set targets for improvement in the field. Even among our SCHOLAR cohort, room for ongoing improvement in development of funded scholarship and a core of senior faculty exists. Further investigation into the unique features of successful groups will offer insight to leaders in academic hospital medicine regarding infrastructure and processes that should be embraced to raise the bar for all AHPs. In addition, efforts to further define and validate nontraditional approaches to scholarship that allow for successful promotion at AHPs would be informative. We view our work less as a singular approach to benchmarking standards for AHPs, and more a call to action to continue efforts to balance scholarly activity and broad professional development of academic hospitalists with increasing clinical demands.
Acknowledgements
The authors thank all of the AHP leaders who participated in the SCHOLAR project. They also thank the Society of Hospital Medicine and Society of General Internal Medicine and the SHM Academic Committee and SGIM Academic Hospitalist Task Force for their support of this work.
Disclosures
The work reported here was supported by the Department of Veterans Affairs, Veterans Health Administration, South Texas Veterans Health Care System. The views expressed in this article are those of the authors and do not necessarily reflect the position or policy of the Department of Veterans Affairs. The authors report no conflicts of interest.
- , , , , . Characteristics of primary care providers who adopted the hospitalist model from 2001 to 2009. J Hosp Med. 2015;10(2):75–82.
- , , , . Growth in the care of older patients by hospitalists in the United States. N Engl J Med. 2009;360(11):1102–1112.
- , , , , . Updating threshold‐based identification of hospitalists in 2012 Medicare pay data. J Hosp Med. 2016;11(1):45–47.
- , , , . Use of hospitalists by Medicare beneficiaries: a national picture. Medicare Medicaid Res Rev. 2014;4(2).
- , , , , , . Challenges and opportunities in Academic Hospital Medicine: report from the Academic Hospital Medicine Summit. J Hosp Med. 2009;4(4):240–246.
- , , , . Survey of US academic hospitalist leaders about mentorship and academic activities in hospitalist groups. J Hosp Med. 2011;6(1):5–9.
- , , , , , . The structure of hospital medicine programs at academic medical centers [abstract]. J Hosp Med. 2012;7(suppl 2):s92.
- , , , , . Research and publication trends in hospital medicine. J Hosp Med. 2014;9(3):148–154.
- , , , , , . Mentorship, productivity, and promotion among academic hospitalists. J Gen Intern Med. 2012;27(1):23–27.
- , , , et al. The key principles and characteristics of an effective hospital medicine group: an assessment guide for hospitals and hospitalists. J Hosp Med. 2014;9(2):123–128.

Embedding a Discharge Facilitator
Recent studies have shown that a patient's discharge from the hospital is a vulnerable period for patient safety.14 With the reduction in length of stay (LOS) and the increase in patient acuity over the past decade, patients are discharged from acute care settings quicker and sicker, resulting in management of ongoing illness in a less‐monitored environment.5, 6 In addition, in teaching hospitals, residents are supervised by hospital‐based physicians who are rarely the primary care physician (PCP) for the residents' patients, which creates discontinuity of care.
One in 5 medical discharges is complicated by an adverse event believed, in part, to be due to poor communication between caregivers during this transition time.2 Discharge summaries, a key form of that communication, are not always done in a timely fashion and may lack key pieces of information.7, 8 For approximately 68% of patient discharges, the PCP will not have a discharge summary available for the patient's first follow‐up visit.911 In a survey of PCPs whose patients were in the hospital, only 23% reported direct communication with the hospital care team.12 This leaves PCPs unaware of pending test results or recommended follow‐up evaluations.10, 11, 13, 14 All of these factors are believed to contribute to adverse events, emergency department (ED) visits, and readmissions.
A recently published consensus statement on transitions of care by 6 major medical societies emphasizes the need for timely communication and transfer of information.15 These important processes are especially challenging to meet at academic medical centers, where discharge summaries and transition communication are done by residents in a hectic and challenging work environment, with multiple simultaneous and competing demands including outpatient clinic and required conferences.12 Residents have little formal training in how to write an effective discharge summary or how to systematically approach discharge planning. One study found higher error rates in discharge summaries written by residents compared with attending physicians.16 While the Accreditation Council for Graduate Medical Education (ACGME) limits the number of admissions per intern for both patient safety and educational reasons, the number of discharges per day is not limited despite the considerable amount of time required for appropriate discharge planning and communication.
Many interventions have been tried to improve the discharge process and reduce patient adverse events.17 Arranging early follow‐up appointments to reduce emergency department visits and readmissions has shown mixed results.13, 1820 Interventions that focus on specific populations, such as the elderly or patients with congestive heart failure, have been more successful.2123 Some interventions employed additional resources, such as a discharge form, transition coach, or discharge advocate, again with varying impact on results.18, 2427 A recent study by Jack et al. used nurse discharge advocates (DAs) to help with discharge planning and communication at an academic medical center.25 These DAs were independent of the care team, and focused on patient education and follow‐up plans, and reduced hospital reutilization in a selected population.
No studies have assessed the potential benefit of helping residents with the physician components of the discharge process. Prior studies have mainly focused on patient communication and follow‐up appointments, yet safe transitions also involve timely discharge summaries, physician‐to‐physician communication, physician‐to‐nurse communication, and medication reconciliation. Without support and time, these tasks can be very challenging for resident physicians with work‐hour limitations. We undertook a randomized, controlled trial to evaluate the impact on the discharge process of embedding a discharge facilitator in a resident medical team to help with the physician discharge process. We studied the effect for all the patients discharged from the resident team, rather than focusing on a select group or patients with a single diagnosis.
METHODS
Study Setting and Participants
This study was conducted on 2 of the 5 resident general medical teams on the inpatient teaching service at Massachusetts General Hospital (MGH), Boston, Massachusettsa large, 907‐bed, urban hospital. The residents' teams are regionalized and each care for approximately 20 patients on a single floor. Each of the study teams consists of a junior resident, 4 interns, and 1 to 2 attendings who rotate on the floor for 2‐week or 4‐week blocks. Attending rounds, which occur 10 AM to 12 PM weekdays, are for new patient presentations and discussion of plans. Interdisciplinary rounds occur 9:30 AM to 10 AM. Sign‐out rounds occur in the afternoon whenever all work is complete. The junior resident is responsible for all the discharge orders and communication with PCPs, and the discharge summaries for patients going to facilities. The interns are responsible for discharge summaries for patients discharged home; these summaries are not mandatory at the time of discharge. The majority of patients were admitted under the team attending(s). Patients were assigned to the teams by the admitting office, based on bed availability. All patients discharged from both resident medical teams over a 5‐month period were included in this study. Those who were not discharged from the hospital by the study teams (ie, transfers to intensive care units or deaths) were excluded. These exclusions accounted for less than 12% of all team patients. Partners Healthcare System Institutional Review Board approved all study activities.
Intervention
We randomly assigned a discharge facilitator (DF), a master's level nurse practitioner with prior inpatient medicine experience, to 1 of the 5 resident medical teams. She had no prior experience on this specific floor. A similar resident team, on a different floor, served as the control. For the intervention team, the DF attended daily resident work rounds and interdisciplinary discharge rounds. The resident and DF collaborated in identifying patients being discharged in the next 1 to 3 days, and the DF scheduled all follow‐up appointments and tests. The DF performed medication reconciliation, wrote prescriptions and faxed them to pharmacies, and arranged all anticoagulation services. In collaboration with the resident, the DF called PCPs' offices with discharge information and faxed discharge summaries to PCPs' offices outside the Partners Healthcare System. The DF wrote part or all of the computer discharge orders and discharge summaries at the request of the resident and interns. All discharge summaries still needed to be reviewed, edited, and signed by the resident or interns. The DF also noted pending tests and studies at time of discharge, and followed up on these tests for the team. The DF met with all patients to answer any questions about their discharge plan, medications, and appointments; while residents are encouraged to do this, it is not done as consistently. She provided her business card for any questions after their discharge. Follow‐up patient calls to the DF were either answered by her or triaged to the appropriate person. The DF also communicated with the patient's nurse about the discharge plans. For all patients discharged over a weekend, the DF would arrange the follow‐up appointments on Mondays and call the patients at home.
For both teams, residents received letters at the start of their rotation notifying them of the study and asking them to complete discharge summaries within 24 hours. All residents in the program were expected to do an online discharge tutorial and attend a didactic lecture on discharge summaries. The residents on the intervention team received a 5‐minute orientation on how best to work with the DF. Residents were given the autonomy to decide how much to use the DF's services. The scheduling of follow‐up appointments on the control team was the responsibility of the team resident as per usual care. The nursing component of the discharge process, including patient discharge education, was the same on both teams. Nurses on both floors are identically trained on these aspects of care. The nurses on both teams were surveyed about perception of the discharge process prior to the intervention and after the intervention. A research assistant (RA) called patients discharged home on both teams, 1 week after discharge, to ask about satisfaction with the discharge process, to determine if the patients had any questions, and to verify patient knowledge regarding whom they should contact for problems. The RA also noted the end time of attending rounds each day and the start time of resident sign‐out.
Outcome Measures and Follow‐Up
At the time of discharge, the RA collected baseline data on all patients discharged from both teams, including the number of follow‐up appointments scheduled. Patients were tracked through electronic medical records to see if and when they attended their follow‐up appointments, whether they changed the appointment, and whether patients returned to a hospital emergency department or were readmitted to MGH or an affiliated Partners hospital within 30 days. For patients outside the MGHPartners system, the research assistant contacted primary care physician offices to document follow‐up. The remaining patient data was obtained through the MGHPartners computerized information system.
The primary outcomes of the study were length of stay, time of discharge, number of emergency department visits, hospital readmissions, numbers of discharge summaries completed in 24 hours, time from discharge to discharge summary completion, and whether the discharge summary was completed before follow‐up. Secondary outcomes were number of follow‐up PCP appointments made at time of discharge, percentage of follow‐up appointments attended and time from discharge to attending a follow‐up appointment, patient phone survey results, and nursing perception of the discharge process, as well as the percentage of attending rounds that ended on time and the time of resident sign‐out.
Statistical Analyses
Patient characteristics were compared between intervention and control teams using 2‐sample t tests or Wilcoxon rank sum tests for continuous variables, and chi‐square tests for categorical variables. Hours to discharge summary completion and hospital length of stay were summarized using median and interquartiles (IQR), and compared between the 2 teams using Wilcoxon rank sum tests. Categorical outcomes were compared using chi‐square tests. Two‐sided P values 0.05 were considered statistically significant. SAS version 9.2 (SAS Institute Inc, Cary, NC) was used for all statistical analyses.
RESULTS
Study Sample
During the 5‐month intervention (November 12, 2008 to April 14, 2009), a combined total of 999 patients were admitted to the intervention and control general medical teams. We excluded 96 patients who were not discharged but transferred to another service or intensive care units, and 24 patients who died. We also excluded 7 patients who were discharged from both teams the first day of the study, because the DF was not involved with the patients' discharge planning. That left 872 patients discharged to either home, a facility, or having left against medical advice (AMA) included in the study: 440 patients on the intervention team and 432 patients on the control team (Figure 1). Baseline patient demographic and clinical characteristics were similar across both teams with only gender being significantly different (Table 1). The mean age was 63 years (range, 1896) and the mean comorbidity score was 2.3 (range, 012). Of note, about a quarter of patients were discharged to facilities, about half were Medicare recipients, and approximately 80% had a PCP. The DF participated in the discharge process for nearly all of the intervention patients; she reported contributing approximately 50% of the content to the discharge summaries.
| Characteristics | Intervention Team | Control Team |
|---|---|---|
| n = 440 | n = 432 | |
| ||
| Mean age (SD), year | 63 (18) | 63 (18) |
| Women, n (%)* | 181 (41) | 207 (48) |
| Race, n (%) | ||
| White non‐Hispanic | 267 (61) | 243 (56) |
| Black non‐Hispanic | 24 (5) | 33 (8) |
| Hispanic | 21 (5) | 17 (4) |
| Unknown/other | 128 (29) | 139 (32) |
| Health insurance, n (%) | ||
| Medicare | 213 (48) | 226 (52) |
| Medicaid | 85 (19) | 81 (19) |
| Private | 110 (25) | 91 (21) |
| Other | 32 (7) | 34 (8) |
| PCP on admission, n (%) | 370 (84) | 356 (82) |
| Discharge disposition, n (%) | ||
| AMA | 12 (3) | 14 (3) |
| Home | 305 (69) | 315 (73) |
| Facility | 123 (28) | 103 (24) |
| Mean comorbidity index score (SD) | 2.3 (2.4) | 2.3 (2.4) |
| Diagnoses | ||
| Congestive heart failure | 30 (6%) | 27 (5%) |
| COPD/asthma | 34 (7%) | 47 (9%) |
| Cardiovascular disease | 54 (11%) | 50 (8%) |
| Alcohol/substance abuse | 29 (6%) | 34 (7%) |
| Gastrointestinal bleeds/ulcers | 38 (8%) | 41 (8%) |
| Hepatobiliary disease | 30 (6%) | 36 (7%) |
| Renal failure/kidney disease | 33 (7%) | 37 (7%) |
| Pneumonia | 36 (7%) | 22 (4%) |
| Musculoskeletal disease | 26 (5%) | 23 (5%) |
| Neurologic disease | 22 (4%) | 25 (5%) |
| Other | 163 (33%) | 172 (35%) |
Primary Outcomes
Primary outcomes from the 2 medical teams are listed in Table 2. In the intervention group, significantly more discharge summaries were completed within 24 hours compared to the control group (293 [67%] vs 207 [48%]; P < 0.0001). Since nearly all patients discharged to facilities must have a discharge summary at the time of discharge, the overall difference in completion rates came mainly from patients discharged home or having left AMA from the intervention team (177 [56%] vs 112 [34%]; P < 0.0001). For all discharge summaries, the median time to completion on the intervention team was 18.9 hours compared with 73.1 hours on the control team (P < 0.0001). More discharge summaries were completed before the first follow‐up appointment on the intervention team (393 [89%] vs 330 [76%]; P < 0.001). The DF intervention had no effect on 30‐day readmission or emergency department visits. For patients on the DF team, 88 (20%) were readmitted within 30 days of discharge, as compared with 79 (18%) on the control team (P = 0.55). Similarly, 40 (9%) of the intervention team patients, as compared with 39 (9%) of the control team patients, visited the emergency department at least once within 30 days (P = 1.0). There was no difference in length of stay (LOS) between the 2 teams (median 4.0 days for both teams, P = 0.84).
| Intervention Team | Control Team | ||
|---|---|---|---|
| Variables | n = 440 | n = 432 | P Value |
| |||
| Discharge summaries completed 24 hr, n (%) | 293 (67) | 207 (48) | <0.0001 |
| Discharges to facilities | 116 (94) | 95 (92) | 0.60 |
| Discharges to home/AMA | 177 (56) | 112 (34) | <0.0001 |
| Median hours to discharge summary completion for discharges to home/AMA (IQR) | 18.9 (0138) | 73.1 (4.3286) | <0.0001 |
| Discharge summary complete before time of follow‐up appointment. | 393 (89) | 330 (76) | <0.0001 |
| Emergency department visits in 30 days, n (%) | 40 (9) | 39 (9) | 1.0 |
| Readmissions in 30 days, n (%) | 88 (20) | 79 (18) | 0.55 |
| Median length of stay, days (IQR) | 4.0 (37) | 4.0 (28) | 0.84 |
| Discharges to facilities | 6.0 (511) | 8.0 (513) | 0.17 |
| Discharges to home/AMA | 4.0 (26) | 3.0 (26) | 0.61 |
| Discharged by noon, n (%) | 38 (9) | 42 (10) | 0.64 |
Secondary Outcomes
Table 3 shows secondary outcomes from the 2 medical teams. Among the patients discharged from the DF team, 264 (62%) had scheduled follow‐up appointments with PCPs compared to the control team 151 (36%) (P < 0.0001). (Many patients going to rehabilitation hospitals are not given PCP appointments at the time of discharge.) Despite having more scheduled appointments, patients' actual follow‐up with PCPs was similar during the 5‐month study period among both intervention and control group (234 [65%] vs 223 [63%]; P = 0.58). However, there was earlier follow‐up with the primary provider in the first 2 or 4 weeks in the intervention group. At 2 weeks, 129 (36%) patients in the intervention group saw their provider compared to 81 (23%) patients in the control group (P < 0.0002), and at 4 weeks, 159 (44%) of the intervention group was seen compared to 99 (28%) of the control group (P < 0.0001). Of note, among the 415 patients on both teams discharged with scheduled appointments, only 53 (13%) of patients did not show up for the scheduled appointment and this no‐show rate was the same on both teams.
| Variables | Intervention Team | Control Team | P Value |
|---|---|---|---|
| |||
| No. of eligible patients* | 428 | 418 | |
| Patients with follow‐up appointments to primary providers, n (%) | 264 (62) | 151 (36) | <0.0001 |
| No. of eligible patients | 359 | 354 | |
| Attended follow‐up appointment with primary provider during study, n (%) | 234 (65) | 223 (63) | 0.58 |
| Within 2 weeks of discharge | 129 (36) | 81 (23) | 0.0002 |
| Within 4 weeks of discharge | 159 (44) | 99 (28) | <0.0001 |
| No. of days round times were recorded | 100 | 99 | |
| No. of attending rounds ending by 12 PM | 45 (45%) | 31 (31%) | 0.058 |
| Mean start time of sign‐out rounds | 16:38 | 17:24 | 0.0007 |
Attending rounds ended on time (12 PM) 45% of the time in the intervention group compared to 31% in the control group (P = 0.058). Mean start time of resident sign‐out rounds was 1638 hours on the intervention team and 1724 hours on the control team (P = 0.0007).
We obtained patient reported outcome data by telephone within 2 to 4 weeks of discharge. Of the 620 patients discharged to home, 6 died or were readmitted to the hospital before being reached by phone. For the remaining 614 patients, we were able to contact 444 (72%). Of those, 321 (52%) agreed to participate in the phone interview. We surveyed similar proportions of intervention and control group patients (158 [52%] vs 163 [52%]) (Table 4). Both groups reported similar rates of having questions about their hospital stay after discharge (43 [27%] vs 49 [30%]; P = 0.62). The intervention group could better identify whom to call with questions (150 [95%] vs 138 [85%]; P = 0.003). The intervention group reported better understanding of their follow‐up plans (157 [99%] vs 141 [87%]; P = 0.001) and better understanding of their discharge medications (152 [96%] vs 142 [87%]; P = 0.001). More patients in the intervention group were satisfied with the discharge process (153 [97%] vs 124 [76%]; P < 0.0001).
| Intervention Team | Control Team | P Value | |
|---|---|---|---|
| |||
| Patients discharged home* | 304 | 310 | |
| Patients contacted by phone after discharge, n (%) | 213 (70) | 231 (75) | 0.24 |
| Agreed to participate in phone interview, n (%) | 158 (52) | 163 (53) | 0.94 |
| Among those agreed to participate, n (%) | |||
| Did you have questions about your hospital stay? | 43 (27) | 49 (30) | 0.62 |
| Would you know who to call if you had questions after discharge? | 150 (95) | 138 (85) | 0.003 |
| Satisfied with the discharge process? | 153 (97) | 124 (76) | <0.0001 |
| Did you understand your follow‐up plans? | 157 (99) | 141 (87) | <0.0001 |
| Did you understand your medications? | 152 (96) | 142 (87) | 0.001 |
| Did you feel safe going home? | 153 (97) | 151 (92) | 0.07 |
Compared with nurses on the control team, nurses on the intervention team more often reported paperwork being completed in a timely fashion (56% vs 29%; P = 0.041) and being less worried about the discharge plan (44% vs 57%; P = 0.027). The intervention team nurses also reported fewer issues with medications/prescriptions (61% vs 82%) and being included more often in the discharge planning (50% vs 38%). However, neither of these results reached statistical significance (P = 0.81 and 0.50, respectively).
DISCUSSION
Our study embedded a nurse practitioner on a busy resident general medical team to help with all aspects of the discharge process for which physicians are responsible. Previous studies have been limited to patients with specific diagnoses, age, or disposition plans.1825 In this study, we included all general medical patients. Our intervention improved several important quality of care elements: the timeliness of completion of discharge summaries; and increased number of early follow‐up appointments, with more patients seen within 2 and 4 weeks after discharge. Patients reported better understanding of their follow‐up plans and more satisfaction with the discharge process. While not statistically significant, there was a trend towards better communication with nurses. For residents with work‐hour limitations, there was time savings with a trend towards finishing attending rounds on time and statistically significant earlier sign‐out rounds (46 minutes earlier). This intervention had no effect on patient length of stay, readmissions, or emergency department visits in the 30 days after discharge.
Despite improving many aspects of the discharge process and communication that have previously been raised as areas of concern for patient safety, there was no improvement in readmissions rates and ED utilization which are often used as the quality indicators for effective discharge planning. Similar types of interventions on general medical patients have generally also failed to show improvement in readmission rates.1820, 25 Weinberger et al. arranged follow‐up appointments within 1 week for patients discharged from a Veterans Administrative hospital; while patients were seen more often, the intervention actually increased readmission rates.20 Fitzgerald et al. had a case manager contact patients at home and encourage follow‐up, which increased follow‐up visits, but again had no effect on readmission.19 Einstadter et al. had a nurse case manager coordinate outpatient follow‐up on a resident team and also did not effect readmission rates or ED visits.18 Jack et al. in project reengineered discharge (RED) did show a significant reduction in combined hospital utilization measures. However, their study focused on a more limited patient population, and employed both a discharge advocate to arrange follow‐up and improve patient education, and a pharmacist to make postdischarge phone calls.25
So why did readmissions rates and ED visits not change in our study? It would be reasonable to think that having earlier follow‐up appointments, better and timely physician‐to‐physician communication, and a facilitator for patient questions should improve the quality of the discharge process. In a recent study, Jha et al. found there was no association between chart‐based measures of discharge quality and readmissions rates, and only a modest association for patient‐reported measures of discharge quality and readmission rates.28 The authors suggest readmission rates are driven by many factors beyond just improved discharge safety. Perhaps readmission rates are too complex a measure to use to assess discharge process improvement. For fiscal reasons, it is understandable that hospitals, insurance companies, and the Centers for Medicare and Medicaid want to reduce readmission rates and ED utilization. Jencks et al. noted the cost of readmissions in 2004 was 17.4 billion dollars.29 However, sweeping efforts to improve the discharge process for all general medical patients may not yield significant reductions in readmissions, as this study suggests. We may need to focus aggressive intervention on smaller target populations, as prior studies on focused groups suggest.2123
There are no evidence‐based studies to suggest when optimal follow‐up should occur after discharge.26 Several medical society guidelines recommend 2 weeks. More patients on the intervention team were seen within 2 weeks, but readmission rates were not affected. The University Health System Consortium recently reported that the majority of readmissions occurred within 6 days, with the average being about 2 to 3 days.30 In this study, the median days to readmit were 12 for the intervention team and 10 for the control. It is possible that even with our improved 2‐week follow‐up, this was not early enough to reduce readmissions. Follow‐up may need to be within 13 days of discharge for highly vulnerable patients, to significantly change readmission rates. Further studies focusing on this question would be helpful.
Finally, with ACGME limitation of work hours, many residency programs are looking for ways to reduce residents' workload and increase time for education. With a significant trend towards finishing attending rounds on time, it is likely that more residents on the intervention team were able to attend the noon‐time educational conferences. We speculate that this was due to fewer interruptions during rounds because the DF was available for nurses' questions. Sign‐out rounds occurred significantly earlier, possibly because of improved resident efficiency due to the DF's help with the discharge process. While residents may lose some educational experience from not performing all discharge tasks, they gain experience working in interdisciplinary teams, have increased time for education, and reduced work hours. Since the ACGME limits the number of residents per program and increasing the residency size is not an option, a DF should be considered as a possible solution to ACGME work‐hour restrictions.
This study had several limitations. First, the intervention team had 1 specific person embedded, and therefore the results of this study may have limited generalizability. Second, the limited number of residents working with the DF could have biased the intervention, as not all residents worked equally well with the DF. However, this may represent the real‐world experience on any teaching service, given variation in working styles and learning curves of residents over their training. Third, this study was done at 1 university‐affiliated urban Academic Medical Center, making it potentially less generalizable to resident teams in community hospitals. Fourth, we were not able to capture readmissions and ED visits at institutions outside the MGHPartners Healthcare System. However, given that patients were assigned at random to either team, this factor should have impacted both teams equally. Fifth, the study occurred during Massachusetts healthcare reform which requires everyone to have health insurance. This may have affected the rates of ED visits and readmission rates, especially with a shortage of primary care physicians and office visits. Finally, this intervention was not cost‐neutral. Paying for a nurse practitioner to help residents with the work of discharge and providing patients with additional services had many advantages, but this quality improvement project did not pay for itself through shorter LOS, or decreases in ED visits or readmissions.
While readmission rates and ED utilization are important patient outcomes, especially in the current healthcare climate, what determines readmissions and ED visits is likely complex and multifactorial. This study suggests that, in the nationwide effort to reduce readmissions, solely improving the discharge process for all general medical patients may not produce the hoped‐for financial savings. Improving the discharge process, however, is something valuable in its own right. Adding a DF to a resident team does improve some quality markers of the discharge process and decreases work hours for residents.
Acknowledgements
Sara Macchiano, RN for her help with the data gathering of this study.
- ,,,,.Adverse drug events occurring following hospital discharge.J Gen Intern Med.2005;20(4):317–323.
- ,,,,.The incidence and severity of adverse events affecting patients after discharge from the hospital.Ann Intern Med.2003;138(3):161–167.
- ,,,.Medical errors related to discontinuity of care from an inpatient to an outpatient setting.J Gen Intern Med.2003;18(8):646–651.
- ,,,.Posthospital medication discrepancies: Prevalence and contributing factors.Arch Intern Med.2005;165(16):1842–1847.
- ,,, et al.Prospective payment system and impairment at discharge. The ‘quicker‐and‐sicker’ story revisited.JAMA.1990;264(15):1980–1983.
- .The incidence of adverse medical outcomes under prospective payment.Econometrica. 1995;63:29–50.
- ,,.Content of a discharge summary from a medical ward: Views of general practitioners and hospital doctors.J R Coll Physicians Lond.1995;29(4):307–310.
- ,.Quality assessment of a discharge summary system.Can Med Assoc J.1995;152(9):1437–1442.
- ,,.Dissemination of discharge summaries. Not reaching follow‐up physicians.Can Fam Physician.2002;48:737–742.
- ,,,.Effect of discharge summary availability during post‐discharge visits on hospital readmission.J Gen Intern Med.2002;17(3):186–192.
- ,,,,,.Deficits in communication and information transfer between hospital‐based and primary care physicians: Implications for patient safety and continuity of care.JAMA.2007;297(8):831–841.
- ,,, et al.Association of communication between hospital‐based physicians and primary care providers with patient outcomes.J Gen Intern Med.2009;24(3):381–386.
- ,,.Tying up loose ends: Discharging patients with unresolved medical issues.Arch Intern Med.2007;167(12):1305–1311.
- ,,, et al.Patient safety concerns arising from test results that return after hospital discharge.Ann Intern Med.2005;143(2):121–128.
- ,,, et al.Transitions of care consensus policy statement: American College of Physicians, Society of General Internal Medicine, Society of Hospital Medicine, American Geriatrics Society, American College of Emergency Physicians, and Society for Academic Emergency Medicine.J Hosp Med.2009;4(6):364–370.
- ,,,.Prospective audit of discharge summary errors.Br J Surg.1996;83(6):788–790.
- ,.Lost in transition: Challenges and opportunities for improving the quality of transitional care.Ann Intern Med.2004;141(7):533–536.
- ,,.Effect of a nurse case manager on postdischarge follow‐up.J Gen Intern Med.1996;11(11):684–688.
- ,,,,.A case manager intervention to reduce readmissions.Arch Intern Med.1994;154(15):1721–1729.
- ,,.Does increased access to primary care reduce hospital readmissions? Veterans Affairs Cooperative Study Group on Primary Care and Hospital Readmission.N Engl J Med.1996;334(22):1441–1447.
- ,,,,,.Comprehensive discharge planning with postdischarge support for older patients with congestive heart failure: A meta‐analysis.JAMA.2004;291(11):1358–1367.
- ,,,,,.Transitional care of older adults hospitalized with heart failure: A randomized, controlled trial.J Am Geriatr Soc.2004;52(5):675–684.
- ,,,,,.Preparing patients and caregivers to participate in care delivered across settings: The Care Transitions Intervention.J Am Geriatr Soc.2004;52(11):1817–1825.
- ,,,.The care transitions intervention: Results of a randomized controlled trial.Arch Intern Med.2006;166(17):1822–1828.
- ,,, et al.A reengineered hospital discharge program to decrease rehospitalization: A randomized trial.Ann Intern Med.2009;150(3):178–187.
- ,,,.Redefining and redesigning hospital discharge to enhance patient care: A randomized controlled study.J Gen Intern Med.2008;23(8):1228–1233.
- ,,, et al.Effect of a nurse team coordinator on outcomes for hospitalized medicine patients.Am J Med.2005;118(10):1148–1153.
- ,,.Public reporting of discharge planning and rates of readmissions.N Engl J Med.2009;361(27):2637–2645.
- ,,.Rehospitalizations among patients in the Medicare fee‐for‐service program.N Engl J Med.2009;360(14):1418–1428.
- Consortium UHS. Reducing Readmissions SC22009. Available at: https://www.uhc.edu/1244.htm
Recent studies have shown that a patient's discharge from the hospital is a vulnerable period for patient safety.14 With the reduction in length of stay (LOS) and the increase in patient acuity over the past decade, patients are discharged from acute care settings quicker and sicker, resulting in management of ongoing illness in a less‐monitored environment.5, 6 In addition, in teaching hospitals, residents are supervised by hospital‐based physicians who are rarely the primary care physician (PCP) for the residents' patients, which creates discontinuity of care.
One in 5 medical discharges is complicated by an adverse event believed, in part, to be due to poor communication between caregivers during this transition time.2 Discharge summaries, a key form of that communication, are not always done in a timely fashion and may lack key pieces of information.7, 8 For approximately 68% of patient discharges, the PCP will not have a discharge summary available for the patient's first follow‐up visit.911 In a survey of PCPs whose patients were in the hospital, only 23% reported direct communication with the hospital care team.12 This leaves PCPs unaware of pending test results or recommended follow‐up evaluations.10, 11, 13, 14 All of these factors are believed to contribute to adverse events, emergency department (ED) visits, and readmissions.
A recently published consensus statement on transitions of care by 6 major medical societies emphasizes the need for timely communication and transfer of information.15 These important processes are especially challenging to meet at academic medical centers, where discharge summaries and transition communication are done by residents in a hectic and challenging work environment, with multiple simultaneous and competing demands including outpatient clinic and required conferences.12 Residents have little formal training in how to write an effective discharge summary or how to systematically approach discharge planning. One study found higher error rates in discharge summaries written by residents compared with attending physicians.16 While the Accreditation Council for Graduate Medical Education (ACGME) limits the number of admissions per intern for both patient safety and educational reasons, the number of discharges per day is not limited despite the considerable amount of time required for appropriate discharge planning and communication.
Many interventions have been tried to improve the discharge process and reduce patient adverse events.17 Arranging early follow‐up appointments to reduce emergency department visits and readmissions has shown mixed results.13, 1820 Interventions that focus on specific populations, such as the elderly or patients with congestive heart failure, have been more successful.2123 Some interventions employed additional resources, such as a discharge form, transition coach, or discharge advocate, again with varying impact on results.18, 2427 A recent study by Jack et al. used nurse discharge advocates (DAs) to help with discharge planning and communication at an academic medical center.25 These DAs were independent of the care team, and focused on patient education and follow‐up plans, and reduced hospital reutilization in a selected population.
No studies have assessed the potential benefit of helping residents with the physician components of the discharge process. Prior studies have mainly focused on patient communication and follow‐up appointments, yet safe transitions also involve timely discharge summaries, physician‐to‐physician communication, physician‐to‐nurse communication, and medication reconciliation. Without support and time, these tasks can be very challenging for resident physicians with work‐hour limitations. We undertook a randomized, controlled trial to evaluate the impact on the discharge process of embedding a discharge facilitator in a resident medical team to help with the physician discharge process. We studied the effect for all the patients discharged from the resident team, rather than focusing on a select group or patients with a single diagnosis.
METHODS
Study Setting and Participants
This study was conducted on 2 of the 5 resident general medical teams on the inpatient teaching service at Massachusetts General Hospital (MGH), Boston, Massachusettsa large, 907‐bed, urban hospital. The residents' teams are regionalized and each care for approximately 20 patients on a single floor. Each of the study teams consists of a junior resident, 4 interns, and 1 to 2 attendings who rotate on the floor for 2‐week or 4‐week blocks. Attending rounds, which occur 10 AM to 12 PM weekdays, are for new patient presentations and discussion of plans. Interdisciplinary rounds occur 9:30 AM to 10 AM. Sign‐out rounds occur in the afternoon whenever all work is complete. The junior resident is responsible for all the discharge orders and communication with PCPs, and the discharge summaries for patients going to facilities. The interns are responsible for discharge summaries for patients discharged home; these summaries are not mandatory at the time of discharge. The majority of patients were admitted under the team attending(s). Patients were assigned to the teams by the admitting office, based on bed availability. All patients discharged from both resident medical teams over a 5‐month period were included in this study. Those who were not discharged from the hospital by the study teams (ie, transfers to intensive care units or deaths) were excluded. These exclusions accounted for less than 12% of all team patients. Partners Healthcare System Institutional Review Board approved all study activities.
Intervention
We randomly assigned a discharge facilitator (DF), a master's level nurse practitioner with prior inpatient medicine experience, to 1 of the 5 resident medical teams. She had no prior experience on this specific floor. A similar resident team, on a different floor, served as the control. For the intervention team, the DF attended daily resident work rounds and interdisciplinary discharge rounds. The resident and DF collaborated in identifying patients being discharged in the next 1 to 3 days, and the DF scheduled all follow‐up appointments and tests. The DF performed medication reconciliation, wrote prescriptions and faxed them to pharmacies, and arranged all anticoagulation services. In collaboration with the resident, the DF called PCPs' offices with discharge information and faxed discharge summaries to PCPs' offices outside the Partners Healthcare System. The DF wrote part or all of the computer discharge orders and discharge summaries at the request of the resident and interns. All discharge summaries still needed to be reviewed, edited, and signed by the resident or interns. The DF also noted pending tests and studies at time of discharge, and followed up on these tests for the team. The DF met with all patients to answer any questions about their discharge plan, medications, and appointments; while residents are encouraged to do this, it is not done as consistently. She provided her business card for any questions after their discharge. Follow‐up patient calls to the DF were either answered by her or triaged to the appropriate person. The DF also communicated with the patient's nurse about the discharge plans. For all patients discharged over a weekend, the DF would arrange the follow‐up appointments on Mondays and call the patients at home.
For both teams, residents received letters at the start of their rotation notifying them of the study and asking them to complete discharge summaries within 24 hours. All residents in the program were expected to do an online discharge tutorial and attend a didactic lecture on discharge summaries. The residents on the intervention team received a 5‐minute orientation on how best to work with the DF. Residents were given the autonomy to decide how much to use the DF's services. The scheduling of follow‐up appointments on the control team was the responsibility of the team resident as per usual care. The nursing component of the discharge process, including patient discharge education, was the same on both teams. Nurses on both floors are identically trained on these aspects of care. The nurses on both teams were surveyed about perception of the discharge process prior to the intervention and after the intervention. A research assistant (RA) called patients discharged home on both teams, 1 week after discharge, to ask about satisfaction with the discharge process, to determine if the patients had any questions, and to verify patient knowledge regarding whom they should contact for problems. The RA also noted the end time of attending rounds each day and the start time of resident sign‐out.
Outcome Measures and Follow‐Up
At the time of discharge, the RA collected baseline data on all patients discharged from both teams, including the number of follow‐up appointments scheduled. Patients were tracked through electronic medical records to see if and when they attended their follow‐up appointments, whether they changed the appointment, and whether patients returned to a hospital emergency department or were readmitted to MGH or an affiliated Partners hospital within 30 days. For patients outside the MGHPartners system, the research assistant contacted primary care physician offices to document follow‐up. The remaining patient data was obtained through the MGHPartners computerized information system.
The primary outcomes of the study were length of stay, time of discharge, number of emergency department visits, hospital readmissions, numbers of discharge summaries completed in 24 hours, time from discharge to discharge summary completion, and whether the discharge summary was completed before follow‐up. Secondary outcomes were number of follow‐up PCP appointments made at time of discharge, percentage of follow‐up appointments attended and time from discharge to attending a follow‐up appointment, patient phone survey results, and nursing perception of the discharge process, as well as the percentage of attending rounds that ended on time and the time of resident sign‐out.
Statistical Analyses
Patient characteristics were compared between intervention and control teams using 2‐sample t tests or Wilcoxon rank sum tests for continuous variables, and chi‐square tests for categorical variables. Hours to discharge summary completion and hospital length of stay were summarized using median and interquartiles (IQR), and compared between the 2 teams using Wilcoxon rank sum tests. Categorical outcomes were compared using chi‐square tests. Two‐sided P values 0.05 were considered statistically significant. SAS version 9.2 (SAS Institute Inc, Cary, NC) was used for all statistical analyses.
RESULTS
Study Sample
During the 5‐month intervention (November 12, 2008 to April 14, 2009), a combined total of 999 patients were admitted to the intervention and control general medical teams. We excluded 96 patients who were not discharged but transferred to another service or intensive care units, and 24 patients who died. We also excluded 7 patients who were discharged from both teams the first day of the study, because the DF was not involved with the patients' discharge planning. That left 872 patients discharged to either home, a facility, or having left against medical advice (AMA) included in the study: 440 patients on the intervention team and 432 patients on the control team (Figure 1). Baseline patient demographic and clinical characteristics were similar across both teams with only gender being significantly different (Table 1). The mean age was 63 years (range, 1896) and the mean comorbidity score was 2.3 (range, 012). Of note, about a quarter of patients were discharged to facilities, about half were Medicare recipients, and approximately 80% had a PCP. The DF participated in the discharge process for nearly all of the intervention patients; she reported contributing approximately 50% of the content to the discharge summaries.
| Characteristics | Intervention Team | Control Team |
|---|---|---|
| n = 440 | n = 432 | |
| ||
| Mean age (SD), year | 63 (18) | 63 (18) |
| Women, n (%)* | 181 (41) | 207 (48) |
| Race, n (%) | ||
| White non‐Hispanic | 267 (61) | 243 (56) |
| Black non‐Hispanic | 24 (5) | 33 (8) |
| Hispanic | 21 (5) | 17 (4) |
| Unknown/other | 128 (29) | 139 (32) |
| Health insurance, n (%) | ||
| Medicare | 213 (48) | 226 (52) |
| Medicaid | 85 (19) | 81 (19) |
| Private | 110 (25) | 91 (21) |
| Other | 32 (7) | 34 (8) |
| PCP on admission, n (%) | 370 (84) | 356 (82) |
| Discharge disposition, n (%) | ||
| AMA | 12 (3) | 14 (3) |
| Home | 305 (69) | 315 (73) |
| Facility | 123 (28) | 103 (24) |
| Mean comorbidity index score (SD) | 2.3 (2.4) | 2.3 (2.4) |
| Diagnoses | ||
| Congestive heart failure | 30 (6%) | 27 (5%) |
| COPD/asthma | 34 (7%) | 47 (9%) |
| Cardiovascular disease | 54 (11%) | 50 (8%) |
| Alcohol/substance abuse | 29 (6%) | 34 (7%) |
| Gastrointestinal bleeds/ulcers | 38 (8%) | 41 (8%) |
| Hepatobiliary disease | 30 (6%) | 36 (7%) |
| Renal failure/kidney disease | 33 (7%) | 37 (7%) |
| Pneumonia | 36 (7%) | 22 (4%) |
| Musculoskeletal disease | 26 (5%) | 23 (5%) |
| Neurologic disease | 22 (4%) | 25 (5%) |
| Other | 163 (33%) | 172 (35%) |
Primary Outcomes
Primary outcomes from the 2 medical teams are listed in Table 2. In the intervention group, significantly more discharge summaries were completed within 24 hours compared to the control group (293 [67%] vs 207 [48%]; P < 0.0001). Since nearly all patients discharged to facilities must have a discharge summary at the time of discharge, the overall difference in completion rates came mainly from patients discharged home or having left AMA from the intervention team (177 [56%] vs 112 [34%]; P < 0.0001). For all discharge summaries, the median time to completion on the intervention team was 18.9 hours compared with 73.1 hours on the control team (P < 0.0001). More discharge summaries were completed before the first follow‐up appointment on the intervention team (393 [89%] vs 330 [76%]; P < 0.001). The DF intervention had no effect on 30‐day readmission or emergency department visits. For patients on the DF team, 88 (20%) were readmitted within 30 days of discharge, as compared with 79 (18%) on the control team (P = 0.55). Similarly, 40 (9%) of the intervention team patients, as compared with 39 (9%) of the control team patients, visited the emergency department at least once within 30 days (P = 1.0). There was no difference in length of stay (LOS) between the 2 teams (median 4.0 days for both teams, P = 0.84).
| Intervention Team | Control Team | ||
|---|---|---|---|
| Variables | n = 440 | n = 432 | P Value |
| |||
| Discharge summaries completed 24 hr, n (%) | 293 (67) | 207 (48) | <0.0001 |
| Discharges to facilities | 116 (94) | 95 (92) | 0.60 |
| Discharges to home/AMA | 177 (56) | 112 (34) | <0.0001 |
| Median hours to discharge summary completion for discharges to home/AMA (IQR) | 18.9 (0138) | 73.1 (4.3286) | <0.0001 |
| Discharge summary complete before time of follow‐up appointment. | 393 (89) | 330 (76) | <0.0001 |
| Emergency department visits in 30 days, n (%) | 40 (9) | 39 (9) | 1.0 |
| Readmissions in 30 days, n (%) | 88 (20) | 79 (18) | 0.55 |
| Median length of stay, days (IQR) | 4.0 (37) | 4.0 (28) | 0.84 |
| Discharges to facilities | 6.0 (511) | 8.0 (513) | 0.17 |
| Discharges to home/AMA | 4.0 (26) | 3.0 (26) | 0.61 |
| Discharged by noon, n (%) | 38 (9) | 42 (10) | 0.64 |
Secondary Outcomes
Table 3 shows secondary outcomes from the 2 medical teams. Among the patients discharged from the DF team, 264 (62%) had scheduled follow‐up appointments with PCPs compared to the control team 151 (36%) (P < 0.0001). (Many patients going to rehabilitation hospitals are not given PCP appointments at the time of discharge.) Despite having more scheduled appointments, patients' actual follow‐up with PCPs was similar during the 5‐month study period among both intervention and control group (234 [65%] vs 223 [63%]; P = 0.58). However, there was earlier follow‐up with the primary provider in the first 2 or 4 weeks in the intervention group. At 2 weeks, 129 (36%) patients in the intervention group saw their provider compared to 81 (23%) patients in the control group (P < 0.0002), and at 4 weeks, 159 (44%) of the intervention group was seen compared to 99 (28%) of the control group (P < 0.0001). Of note, among the 415 patients on both teams discharged with scheduled appointments, only 53 (13%) of patients did not show up for the scheduled appointment and this no‐show rate was the same on both teams.
| Variables | Intervention Team | Control Team | P Value |
|---|---|---|---|
| |||
| No. of eligible patients* | 428 | 418 | |
| Patients with follow‐up appointments to primary providers, n (%) | 264 (62) | 151 (36) | <0.0001 |
| No. of eligible patients | 359 | 354 | |
| Attended follow‐up appointment with primary provider during study, n (%) | 234 (65) | 223 (63) | 0.58 |
| Within 2 weeks of discharge | 129 (36) | 81 (23) | 0.0002 |
| Within 4 weeks of discharge | 159 (44) | 99 (28) | <0.0001 |
| No. of days round times were recorded | 100 | 99 | |
| No. of attending rounds ending by 12 PM | 45 (45%) | 31 (31%) | 0.058 |
| Mean start time of sign‐out rounds | 16:38 | 17:24 | 0.0007 |
Attending rounds ended on time (12 PM) 45% of the time in the intervention group compared to 31% in the control group (P = 0.058). Mean start time of resident sign‐out rounds was 1638 hours on the intervention team and 1724 hours on the control team (P = 0.0007).
We obtained patient reported outcome data by telephone within 2 to 4 weeks of discharge. Of the 620 patients discharged to home, 6 died or were readmitted to the hospital before being reached by phone. For the remaining 614 patients, we were able to contact 444 (72%). Of those, 321 (52%) agreed to participate in the phone interview. We surveyed similar proportions of intervention and control group patients (158 [52%] vs 163 [52%]) (Table 4). Both groups reported similar rates of having questions about their hospital stay after discharge (43 [27%] vs 49 [30%]; P = 0.62). The intervention group could better identify whom to call with questions (150 [95%] vs 138 [85%]; P = 0.003). The intervention group reported better understanding of their follow‐up plans (157 [99%] vs 141 [87%]; P = 0.001) and better understanding of their discharge medications (152 [96%] vs 142 [87%]; P = 0.001). More patients in the intervention group were satisfied with the discharge process (153 [97%] vs 124 [76%]; P < 0.0001).
| Intervention Team | Control Team | P Value | |
|---|---|---|---|
| |||
| Patients discharged home* | 304 | 310 | |
| Patients contacted by phone after discharge, n (%) | 213 (70) | 231 (75) | 0.24 |
| Agreed to participate in phone interview, n (%) | 158 (52) | 163 (53) | 0.94 |
| Among those agreed to participate, n (%) | |||
| Did you have questions about your hospital stay? | 43 (27) | 49 (30) | 0.62 |
| Would you know who to call if you had questions after discharge? | 150 (95) | 138 (85) | 0.003 |
| Satisfied with the discharge process? | 153 (97) | 124 (76) | <0.0001 |
| Did you understand your follow‐up plans? | 157 (99) | 141 (87) | <0.0001 |
| Did you understand your medications? | 152 (96) | 142 (87) | 0.001 |
| Did you feel safe going home? | 153 (97) | 151 (92) | 0.07 |
Compared with nurses on the control team, nurses on the intervention team more often reported paperwork being completed in a timely fashion (56% vs 29%; P = 0.041) and being less worried about the discharge plan (44% vs 57%; P = 0.027). The intervention team nurses also reported fewer issues with medications/prescriptions (61% vs 82%) and being included more often in the discharge planning (50% vs 38%). However, neither of these results reached statistical significance (P = 0.81 and 0.50, respectively).
DISCUSSION
Our study embedded a nurse practitioner on a busy resident general medical team to help with all aspects of the discharge process for which physicians are responsible. Previous studies have been limited to patients with specific diagnoses, age, or disposition plans.1825 In this study, we included all general medical patients. Our intervention improved several important quality of care elements: the timeliness of completion of discharge summaries; and increased number of early follow‐up appointments, with more patients seen within 2 and 4 weeks after discharge. Patients reported better understanding of their follow‐up plans and more satisfaction with the discharge process. While not statistically significant, there was a trend towards better communication with nurses. For residents with work‐hour limitations, there was time savings with a trend towards finishing attending rounds on time and statistically significant earlier sign‐out rounds (46 minutes earlier). This intervention had no effect on patient length of stay, readmissions, or emergency department visits in the 30 days after discharge.
Despite improving many aspects of the discharge process and communication that have previously been raised as areas of concern for patient safety, there was no improvement in readmissions rates and ED utilization which are often used as the quality indicators for effective discharge planning. Similar types of interventions on general medical patients have generally also failed to show improvement in readmission rates.1820, 25 Weinberger et al. arranged follow‐up appointments within 1 week for patients discharged from a Veterans Administrative hospital; while patients were seen more often, the intervention actually increased readmission rates.20 Fitzgerald et al. had a case manager contact patients at home and encourage follow‐up, which increased follow‐up visits, but again had no effect on readmission.19 Einstadter et al. had a nurse case manager coordinate outpatient follow‐up on a resident team and also did not effect readmission rates or ED visits.18 Jack et al. in project reengineered discharge (RED) did show a significant reduction in combined hospital utilization measures. However, their study focused on a more limited patient population, and employed both a discharge advocate to arrange follow‐up and improve patient education, and a pharmacist to make postdischarge phone calls.25
So why did readmissions rates and ED visits not change in our study? It would be reasonable to think that having earlier follow‐up appointments, better and timely physician‐to‐physician communication, and a facilitator for patient questions should improve the quality of the discharge process. In a recent study, Jha et al. found there was no association between chart‐based measures of discharge quality and readmissions rates, and only a modest association for patient‐reported measures of discharge quality and readmission rates.28 The authors suggest readmission rates are driven by many factors beyond just improved discharge safety. Perhaps readmission rates are too complex a measure to use to assess discharge process improvement. For fiscal reasons, it is understandable that hospitals, insurance companies, and the Centers for Medicare and Medicaid want to reduce readmission rates and ED utilization. Jencks et al. noted the cost of readmissions in 2004 was 17.4 billion dollars.29 However, sweeping efforts to improve the discharge process for all general medical patients may not yield significant reductions in readmissions, as this study suggests. We may need to focus aggressive intervention on smaller target populations, as prior studies on focused groups suggest.2123
There are no evidence‐based studies to suggest when optimal follow‐up should occur after discharge.26 Several medical society guidelines recommend 2 weeks. More patients on the intervention team were seen within 2 weeks, but readmission rates were not affected. The University Health System Consortium recently reported that the majority of readmissions occurred within 6 days, with the average being about 2 to 3 days.30 In this study, the median days to readmit were 12 for the intervention team and 10 for the control. It is possible that even with our improved 2‐week follow‐up, this was not early enough to reduce readmissions. Follow‐up may need to be within 13 days of discharge for highly vulnerable patients, to significantly change readmission rates. Further studies focusing on this question would be helpful.
Finally, with ACGME limitation of work hours, many residency programs are looking for ways to reduce residents' workload and increase time for education. With a significant trend towards finishing attending rounds on time, it is likely that more residents on the intervention team were able to attend the noon‐time educational conferences. We speculate that this was due to fewer interruptions during rounds because the DF was available for nurses' questions. Sign‐out rounds occurred significantly earlier, possibly because of improved resident efficiency due to the DF's help with the discharge process. While residents may lose some educational experience from not performing all discharge tasks, they gain experience working in interdisciplinary teams, have increased time for education, and reduced work hours. Since the ACGME limits the number of residents per program and increasing the residency size is not an option, a DF should be considered as a possible solution to ACGME work‐hour restrictions.
This study had several limitations. First, the intervention team had 1 specific person embedded, and therefore the results of this study may have limited generalizability. Second, the limited number of residents working with the DF could have biased the intervention, as not all residents worked equally well with the DF. However, this may represent the real‐world experience on any teaching service, given variation in working styles and learning curves of residents over their training. Third, this study was done at 1 university‐affiliated urban Academic Medical Center, making it potentially less generalizable to resident teams in community hospitals. Fourth, we were not able to capture readmissions and ED visits at institutions outside the MGHPartners Healthcare System. However, given that patients were assigned at random to either team, this factor should have impacted both teams equally. Fifth, the study occurred during Massachusetts healthcare reform which requires everyone to have health insurance. This may have affected the rates of ED visits and readmission rates, especially with a shortage of primary care physicians and office visits. Finally, this intervention was not cost‐neutral. Paying for a nurse practitioner to help residents with the work of discharge and providing patients with additional services had many advantages, but this quality improvement project did not pay for itself through shorter LOS, or decreases in ED visits or readmissions.
While readmission rates and ED utilization are important patient outcomes, especially in the current healthcare climate, what determines readmissions and ED visits is likely complex and multifactorial. This study suggests that, in the nationwide effort to reduce readmissions, solely improving the discharge process for all general medical patients may not produce the hoped‐for financial savings. Improving the discharge process, however, is something valuable in its own right. Adding a DF to a resident team does improve some quality markers of the discharge process and decreases work hours for residents.
Acknowledgements
Sara Macchiano, RN for her help with the data gathering of this study.
- ,,,,.Adverse drug events occurring following hospital discharge.J Gen Intern Med.2005;20(4):317–323.
- ,,,,.The incidence and severity of adverse events affecting patients after discharge from the hospital.Ann Intern Med.2003;138(3):161–167.
- ,,,.Medical errors related to discontinuity of care from an inpatient to an outpatient setting.J Gen Intern Med.2003;18(8):646–651.
- ,,,.Posthospital medication discrepancies: Prevalence and contributing factors.Arch Intern Med.2005;165(16):1842–1847.
- ,,, et al.Prospective payment system and impairment at discharge. The ‘quicker‐and‐sicker’ story revisited.JAMA.1990;264(15):1980–1983.
- .The incidence of adverse medical outcomes under prospective payment.Econometrica. 1995;63:29–50.
- ,,.Content of a discharge summary from a medical ward: Views of general practitioners and hospital doctors.J R Coll Physicians Lond.1995;29(4):307–310.
- ,.Quality assessment of a discharge summary system.Can Med Assoc J.1995;152(9):1437–1442.
- ,,.Dissemination of discharge summaries. Not reaching follow‐up physicians.Can Fam Physician.2002;48:737–742.
- ,,,.Effect of discharge summary availability during post‐discharge visits on hospital readmission.J Gen Intern Med.2002;17(3):186–192.
- ,,,,,.Deficits in communication and information transfer between hospital‐based and primary care physicians: Implications for patient safety and continuity of care.JAMA.2007;297(8):831–841.
- ,,, et al.Association of communication between hospital‐based physicians and primary care providers with patient outcomes.J Gen Intern Med.2009;24(3):381–386.
- ,,.Tying up loose ends: Discharging patients with unresolved medical issues.Arch Intern Med.2007;167(12):1305–1311.
- ,,, et al.Patient safety concerns arising from test results that return after hospital discharge.Ann Intern Med.2005;143(2):121–128.
- ,,, et al.Transitions of care consensus policy statement: American College of Physicians, Society of General Internal Medicine, Society of Hospital Medicine, American Geriatrics Society, American College of Emergency Physicians, and Society for Academic Emergency Medicine.J Hosp Med.2009;4(6):364–370.
- ,,,.Prospective audit of discharge summary errors.Br J Surg.1996;83(6):788–790.
- ,.Lost in transition: Challenges and opportunities for improving the quality of transitional care.Ann Intern Med.2004;141(7):533–536.
- ,,.Effect of a nurse case manager on postdischarge follow‐up.J Gen Intern Med.1996;11(11):684–688.
- ,,,,.A case manager intervention to reduce readmissions.Arch Intern Med.1994;154(15):1721–1729.
- ,,.Does increased access to primary care reduce hospital readmissions? Veterans Affairs Cooperative Study Group on Primary Care and Hospital Readmission.N Engl J Med.1996;334(22):1441–1447.
- ,,,,,.Comprehensive discharge planning with postdischarge support for older patients with congestive heart failure: A meta‐analysis.JAMA.2004;291(11):1358–1367.
- ,,,,,.Transitional care of older adults hospitalized with heart failure: A randomized, controlled trial.J Am Geriatr Soc.2004;52(5):675–684.
- ,,,,,.Preparing patients and caregivers to participate in care delivered across settings: The Care Transitions Intervention.J Am Geriatr Soc.2004;52(11):1817–1825.
- ,,,.The care transitions intervention: Results of a randomized controlled trial.Arch Intern Med.2006;166(17):1822–1828.
- ,,, et al.A reengineered hospital discharge program to decrease rehospitalization: A randomized trial.Ann Intern Med.2009;150(3):178–187.
- ,,,.Redefining and redesigning hospital discharge to enhance patient care: A randomized controlled study.J Gen Intern Med.2008;23(8):1228–1233.
- ,,, et al.Effect of a nurse team coordinator on outcomes for hospitalized medicine patients.Am J Med.2005;118(10):1148–1153.
- ,,.Public reporting of discharge planning and rates of readmissions.N Engl J Med.2009;361(27):2637–2645.
- ,,.Rehospitalizations among patients in the Medicare fee‐for‐service program.N Engl J Med.2009;360(14):1418–1428.
- Consortium UHS. Reducing Readmissions SC22009. Available at: https://www.uhc.edu/1244.htm
Copyright © 2011 Society of Hospital Medicine
