User login
SCHOLAR Project
The structure and function of academic hospital medicine programs (AHPs) has evolved significantly with the growth of hospital medicine.[1, 2, 3, 4] Many AHPs formed in response to regulatory and financial changes, which drove demand for increased trainee oversight, improved clinical efficiency, and growth in nonteaching services staffed by hospitalists. Differences in local organizational contexts and needs have contributed to great variability in AHP program design and operations. As AHPs have become more established, the need to engage academic hospitalists in scholarship and activities that support professional development and promotion has been recognized. Defining sustainable and successful positions for academic hospitalists is a priority called for by leaders in the field.[5, 6]
In this rapidly evolving context, AHPs have employed a variety of approaches to organizing clinical and academic faculty roles, without guiding evidence or consensus‐based performance benchmarks. A number of AHPs have achieved success along traditional academic metrics of research, scholarship, and education. Currently, it is not known whether specific approaches to AHP organization, structure, or definition of faculty roles are associated with achievement of more traditional markers of academic success.
The Academic Committee of the Society of Hospital Medicine (SHM), and the Academic Hospitalist Task Force of the Society of General Internal Medicine (SGIM) had separately initiated projects to explore characteristics associated with success in AHPs. In 2012, these organizations combined efforts to jointly develop and implement the SCHOLAR (SuCcessful HOspitaLists in Academics and Research) project. The goals were to identify successful AHPs using objective criteria, and to then study those groups in greater detail to generate insights that would be broadly relevant to the field. Efforts to clarify the factors within AHPs linked to success by traditional academic metrics will benefit hospitalists, their leaders, and key stakeholders striving to achieve optimal balance between clinical and academic roles. We describe the initial work of the SCHOLAR project, our definitions of academic success in AHPs, and the characteristics of a cohort of exemplary AHPs who achieved the highest levels on these metrics.
METHODS
Defining Success
The 11 members of the SCHOLAR project held a variety of clinical and academic roles within a geographically diverse group of AHPs. We sought to create a functional definition of success applicable to AHPs. As no gold standard currently exists, we used a consensus process among task force members to arrive at a definition that was quantifiable, feasible, and meaningful. The first step was brainstorming on conference calls held 1 to 2 times monthly over 4 months. Potential defining characteristics that emerged from these discussions related to research, teaching, and administrative activities. When potential characteristics were proposed, we considered how to operationalize each one. Each characteristic was discussed until there was consensus from the entire group. Those around education and administration were the most complex, as many roles are locally driven and defined, and challenging to quantify. For this reason, we focused on promotion as a more global approach to assessing academic hospitalist success in these areas. Although criteria for academic advancement also vary across institutions, we felt that promotion generally reflected having met some threshold of academic success. We also wanted to recognize that scholarship occurs outside the context of funded research. Ultimately, 3 key domains emerged: research grant funding, faculty promotion, and scholarship.
After these 3 domains were identified, the group sought to define quantitative metrics to assess performance. These discussions occurred on subsequent calls over a 4‐month period. Between calls, group members gathered additional information to facilitate assessment of the feasibility of proposed metrics, reporting on progress via email. Again, group consensus was sought for each metric considered. Data on grant funding and successful promotions were available from a previous survey conducted through the SHM in 2011. Leaders from 170 AHPs were contacted, with 50 providing complete responses to the 21‐item questionnaire (see Supporting Information, Appendix 1, in the online version of this article). Results of the survey, heretofore referred to as the Leaders of Academic Hospitalist Programs survey (LAHP‐50), have been described elsewhere.[7] For the purposes of this study, we used the self‐reported data about grant funding and promotions contained in the survey to reflect the current state of the field. Although the survey response rate was approximately 30%, the survey was not anonymous, and many reputationally prominent academic hospitalist programs were represented. For these reasons, the group members felt that the survey results were relevant for the purposes of assessing academic success.
In the LAHP‐50, funding was defined as principal investigator or coinvestigator roles on federally and nonfederally funded research, clinical trials, internal grants, and any other extramurally funded projects. Mean and median funding for the overall sample was calculated. Through a separate question, each program's total faculty full‐time equivalent (FTE) count was reported, allowing us to adjust for group size by assessing both total funding per group and funding/FTE for each responding AHP.
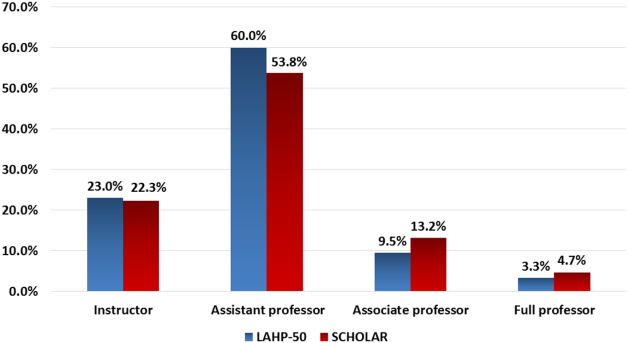
Promotions were defined by the self‐reported number of faculty at each of the following ranks: instructor, assistant professor, associate professor, full professor, and professor above scale/emeritus. In addition, a category of nonacademic track (eg, adjunct faculty, clinical associate) was included to capture hospitalists that did not fit into the traditional promotions categories. We did not distinguish between tenure‐track and nontenure‐track academic ranks. LAHP‐50 survey respondents reported the number of faculty in their group at each academic rank. Given that the majority of academic hospitalists hold a rank of assistant professor or lower,[6, 8, 9] and that the number of full professors was only 3% in the LAHP‐50 cohort, we combined the faculty at the associate and full professor ranks, defining successfully promoted faculty as the percent of hospitalists above the rank of assistant professor.
We created a new metric to assess scholarly output. We had considerable discussion of ways to assess the numbers of peer‐reviewed manuscripts generated by AHPs. However, the group had concerns about the feasibility of identification and attribution of authors to specific AHPs through literature searches. We considered examining only publications in the Journal of Hospital Medicine and the Journal of General Internal Medicine, but felt that this would exclude significant work published by hospitalists in fields of medical education or health services research that would more likely appear in alternate journals. Instead, we quantified scholarship based on the number of abstracts presented at national meetings. We focused on meetings of the SHM and SGIM as the primary professional societies representing hospital medicine. The group felt that even work published outside of the journals of our professional societies would likely be presented at those meetings. We used the following strategy: We reviewed research abstracts accepted for presentation as posters or oral abstracts at the 2010 and 2011 SHM national meetings, and research abstracts with a primary or secondary category of hospital medicine at the 2010 and 2011 SGIM national meetings. By including submissions at both SGIM and SHM meetings, we accounted for the fact that some programs may gravitate more to one society meeting or another. We did not include abstracts in the clinical vignettes or innovations categories. We tallied the number of abstracts by group affiliation of the authors for each of the 4 meetings above and created a cumulative total per group for the 2‐year period. Abstracts with authors from different AHPs were counted once for each individual group. Members of the study group reviewed abstracts from each of the meetings in pairs. Reviewers worked separately and compared tallies of results to ensure consistent tabulations. Internet searches were conducted to identify or confirm author affiliations if it was not apparent in the abstract author list. Abstract tallies were compiled without regard to whether programs had completed the LAHP‐50 survey; thus, we collected data on programs that did not respond to the LAHP‐50 survey.
Identification of the SCHOLAR Cohort
To identify our cohort of top‐performing AHPs, we combined the funding and promotions data from the LAHP‐50 sample with the abstract data. We limited our sample to adult hospital medicine groups to reduce heterogeneity. We created rank lists of programs in each category (grant funding, successful promotions, and scholarship), using data from the LAHP‐50 survey to rank programs on funding and promotions, and data from our abstract counts to rank on scholarship. We limited the top‐performing list in each category to 10 institutions as a cutoff. Because we set a threshold of at least $1 million in total funding, we identified only 9 top performing AHPs with regard to grant funding. We also calculated mean funding/FTE. We chose to rank programs only by funding/FTE rather than total funding per program to better account for group size. For successful promotions, we ranked programs by the percentage of senior faculty. For abstract counts, we included programs whose faculty presented abstracts at a minimum of 2 separate meetings, and ranked programs based on the total number of abstracts per group.
This process resulted in separate lists of top performing programs in each of the 3 domains we associated with academic success, arranged in descending order by grant dollars/FTE, percent of senior faculty, and abstract counts (Table 1). Seventeen different programs were represented across these 3 top 10 lists. One program appeared on all 3 lists, 8 programs appeared on 2 lists, and the remainder appeared on a single list (Table 2). Seven of these programs were identified solely based on abstract presentations, diversifying our top groups beyond only those who completed the LAHP‐50 survey. We considered all of these programs to represent high performance in academic hospital medicine. The group selected this inclusive approach because we recognized that any 1 metric was potentially limited, and we sought to identify diverse pathways to success.
| Funding | Promotions | Scholarship | |
|---|---|---|---|
| Grant $/FTE | Total Grant $ | Senior Faculty, No. (%) | Total Abstract Count |
| |||
| $1,409,090 | $15,500,000 | 3 (60%) | 23 |
| $1,000,000 | $9,000,000 | 3 (60%) | 21 |
| $750,000 | $8,000,000 | 4 (57%) | 20 |
| $478,609 | $6,700,535 | 9 (53%) | 15 |
| $347,826 | $3,000,000 | 8 (44%) | 11 |
| $86,956 | $3,000,000 | 14 (41%) | 11 |
| $66,666 | $2,000,000 | 17 (36%) | 10 |
| $46,153 | $1,500,000 | 9 (33%) | 10 |
| $38,461 | $1,000,000 | 2 (33%) | 9 |
| 4 (31%) | 9 | ||
| Selection Criteria for SCHOLAR Cohort | No. of Programs |
|---|---|
| |
| Abstracts, funding, and promotions | 1 |
| Abstracts plus promotions | 4 |
| Abstracts plus funding | 3 |
| Funding plus promotion | 1 |
| Funding only | 1 |
| Abstract only | 7 |
| Total | 17 |
| Top 10 abstract count | |
| 4 meetings | 2 |
| 3 meetings | 2 |
| 2 meetings | 6 |
The 17 unique adult AHPs appearing on at least 1 of the top 10 lists comprised the SCHOLAR cohort of programs that we studied in greater detail. Data reflecting program demographics were solicited directly from leaders of the AHPs identified in the SCHOLAR cohort, including size and age of program, reporting structure, number of faculty at various academic ranks (for programs that did not complete the LAHP‐50 survey), and number of faculty with fellowship training (defined as any postresidency fellowship program).
Subsequently, we performed comparative analyses between the programs in the SCHOLAR cohort to the general population of AHPs reflected by the LAHP‐50 sample. Because abstract presentations were not recorded in the original LAHP‐50 survey instrument, it was not possible to perform a benchmarking comparison for the scholarship domain.
Data Analysis
To measure the success of the SCHOLAR cohort we compared the grant funding and proportion of successfully promoted faculty at the SCHOLAR programs to those in the overall LAHP‐50 sample. Differences in mean and median grant funding were compared using t tests and Mann‐Whitney rank sum tests. Proportion of promoted faculty were compared using 2 tests. A 2‐tailed of 0.05 was used to test significance of differences.
RESULTS
Demographics
Among the AHPs in the SCHOLAR cohort, the mean program age was 13.2 years (range, 618 years), and the mean program size was 36 faculty (range, 1895; median, 28). On average, 15% of faculty members at SCHOLAR programs were fellowship trained (range, 0%37%). Reporting structure among the SCHOLAR programs was as follows: 53% were an independent division or section of the department of medicine; 29% were a section within general internal medicine, and 18% were an independent clinical group.
Grant Funding
Table 3 compares grant funding in the SCHOLAR programs to programs in the overall LAHP‐50 sample. Mean funding per group and mean funding per FTE were significantly higher in the SCHOLAR group than in the overall sample.
| Funding (Millions) | ||
|---|---|---|
| LAHP‐50 Overall Sample | SCHOLAR | |
| ||
| Median grant funding/AHP | 0.060 | 1.500* |
| Mean grant funding/AHP | 1.147 (015) | 3.984* (015) |
| Median grant funding/FTE | 0.004 | 0.038* |
| Mean grant funding/FTE | 0.095 (01.4) | 0.364* (01.4) |
Thirteen of the SCHOLAR programs were represented in the initial LAHP‐50, but 2 did not report a dollar amount for grants and contracts. Therefore, data for total grant funding were available for only 65% (11 of 17) of the programs in the SCHOLAR cohort. Of note, 28% of AHPs in the overall LAHP‐50 sample reported no external funding sources.
Faculty Promotion
Figure 1 demonstrates the proportion of faculty at various academic ranks. The percent of faculty above the rank of assistant professor in the SCHOLAR programs exceeded those in the overall LAHP‐50 by 5% (17.9% vs 12.8%, P = 0.01). Of note, 6% of the hospitalists at AHPs in the SCHOLAR programs were on nonfaculty tracks.
Scholarship
Mean abstract output over the 2‐year period measured was 10.8 (range, 323) in the SCHOLAR cohort. Because we did not collect these data for the LAHP‐50 group, comparative analyses were not possible.
DISCUSSION
Using a definition of academic success that incorporated metrics of grant funding, faculty promotion, and scholarly output, we identified a unique subset of successful AHPsthe SCHOLAR cohort. The programs represented in the SCHOLAR cohort were generally large and relatively mature. Despite this, the cohort consisted of mostly junior faculty, had a paucity of fellowship‐trained hospitalists, and not all reported grant funding.
Prior published work reported complementary findings.[6, 8, 9] A survey of 20 large, well‐established academic hospitalist programs in 2008 found that the majority of hospitalists were junior faculty with a limited publication portfolio. Of the 266 respondents in that study, 86% reported an academic rank at or below assistant professor; funding was not explored.[9] Our similar findings 4 years later add to this work by demonstrating trends over time, and suggest that progress toward creating successful pathways for academic advancement has been slow. In a 2012 survey of the SHM membership, 28% of hospitalists with academic appointments reported no current or future plans to engage in research.[8] These findings suggest that faculty in AHPs may define scholarship through nontraditional pathways, or in some cases choose not to pursue or prioritize scholarship altogether.
Our findings also add to the literature with regard to our assessment of funding, which was variable across the SCHOLAR group. The broad range of funding in the SCHOLAR programs for which we have data (grant dollars $0$15 million per program) suggests that opportunities to improve supported scholarship remain, even among a selected cohort of successful AHPs. The predominance of junior faculty in the SCHOLAR programs may be a reason for this variation. Junior faculty may be engaged in research with funding directed to senior mentors outside their AHP. Alternatively, they may pursue meaningful local hospital quality improvement or educational innovations not supported by external grants, or hold leadership roles in education, quality, or information technology that allow for advancement and promotion without external grant funding. As the scope and impact of these roles increases, senior leaders with alternate sources of support may rely less on research funds; this too may explain some of the differences. Our findings are congruent with results of a study that reviewed original research published by hospitalists, and concluded that the majority of hospitalist research was not externally funded.[8] Our approach for assessing grant funding by adjusting for FTE had the potential to inadvertently favor smaller well‐funded groups over larger ones; however, programs in our sample were similarly represented when ranked by funding/FTE or total grant dollars. As many successful AHPs do concentrate their research funding among a core of focused hospitalist researchers, our definition may not be the ideal metric for some programs.
We chose to define scholarship based on abstract output, rather than peer‐reviewed publications. Although this choice was necessary from a feasibility perspective, it may have excluded programs that prioritize peer‐reviewed publications over abstracts. Although we were unable to incorporate a search strategy to accurately and comprehensively track the publication output attributed specifically to hospitalist researchers and quantify it by program, others have since defined such an approach.[8] However, tracking abstracts theoretically allowed insights into a larger volume of innovative and creative work generated by top AHPs by potentially including work in the earlier stages of development.
We used a consensus‐based definition of success to define our SCHOLAR cohort. There are other ways to measure academic success, which if applied, may have yielded a different sample of programs. For example, over half of the original research articles published in the Journal of Hospital Medicine over a 7‐year span were generated from 5 academic centers.[8] This definition of success may be equally credible, though we note that 4 of these 5 programs were also included in the SCHOLAR cohort. We feel our broader approach was more reflective of the variety of pathways to success available to academic hospitalists. Before our metrics are applied as a benchmarking tool, however, they should ideally be combined with factors not measured in our study to ensure a more comprehensive or balanced reflection of academic success. Factors such as mentorship, level of hospitalist engagement,[10] prevalence of leadership opportunities, operational and fiscal infrastructure, and the impact of local quality, safety, and value efforts should be considered.
Comparison of successfully promoted faculty at AHPs across the country is inherently limited by the wide variation in promotion standards across different institutions; controlling for such differences was not possible with our methodology. For example, it appears that several programs with relatively few senior faculty may have met metrics leading to their inclusion in the SCHOLAR group because of their small program size. Future benchmarking efforts for promotion at AHPs should take scaling into account and consider both total number as well as percentage of senior faculty when evaluating success.
Our methodology has several limitations. Survey data were self‐reported and not independently validated, and as such are subject to recall and reporting biases. Response bias inherently excluded some AHPs that may have met our grant funding or promotions criteria had they participated in the initial LAHP‐50 survey, though we identified and included additional programs through our scholarship metric, increasing the representativeness of the SCHOLAR cohort. Given the dynamic nature of the field, the age of the data we relied upon for analysis limits the generalizability of our specific benchmarks to current practice. However, the development of academic success occurs over the long‐term, and published data on academic hospitalist productivity are consistent with this slower time course.[8] Despite these limitations, our data inform the general topic of gauging performance of AHPs, underscoring the challenges of developing and applying metrics of success, and highlight the variability of performance on selected metrics even among a relatively small group of 17 programs.
In conclusion, we have created a method to quantify academic success that may be useful to academic hospitalists and their group leaders as they set targets for improvement in the field. Even among our SCHOLAR cohort, room for ongoing improvement in development of funded scholarship and a core of senior faculty exists. Further investigation into the unique features of successful groups will offer insight to leaders in academic hospital medicine regarding infrastructure and processes that should be embraced to raise the bar for all AHPs. In addition, efforts to further define and validate nontraditional approaches to scholarship that allow for successful promotion at AHPs would be informative. We view our work less as a singular approach to benchmarking standards for AHPs, and more a call to action to continue efforts to balance scholarly activity and broad professional development of academic hospitalists with increasing clinical demands.
Acknowledgements
The authors thank all of the AHP leaders who participated in the SCHOLAR project. They also thank the Society of Hospital Medicine and Society of General Internal Medicine and the SHM Academic Committee and SGIM Academic Hospitalist Task Force for their support of this work.
Disclosures
The work reported here was supported by the Department of Veterans Affairs, Veterans Health Administration, South Texas Veterans Health Care System. The views expressed in this article are those of the authors and do not necessarily reflect the position or policy of the Department of Veterans Affairs. The authors report no conflicts of interest.
- , , , , . Characteristics of primary care providers who adopted the hospitalist model from 2001 to 2009. J Hosp Med. 2015;10(2):75–82.
- , , , . Growth in the care of older patients by hospitalists in the United States. N Engl J Med. 2009;360(11):1102–1112.
- , , , , . Updating threshold‐based identification of hospitalists in 2012 Medicare pay data. J Hosp Med. 2016;11(1):45–47.
- , , , . Use of hospitalists by Medicare beneficiaries: a national picture. Medicare Medicaid Res Rev. 2014;4(2).
- , , , , , . Challenges and opportunities in Academic Hospital Medicine: report from the Academic Hospital Medicine Summit. J Hosp Med. 2009;4(4):240–246.
- , , , . Survey of US academic hospitalist leaders about mentorship and academic activities in hospitalist groups. J Hosp Med. 2011;6(1):5–9.
- , , , , , . The structure of hospital medicine programs at academic medical centers [abstract]. J Hosp Med. 2012;7(suppl 2):s92.
- , , , , . Research and publication trends in hospital medicine. J Hosp Med. 2014;9(3):148–154.
- , , , , , . Mentorship, productivity, and promotion among academic hospitalists. J Gen Intern Med. 2012;27(1):23–27.
- , , , et al. The key principles and characteristics of an effective hospital medicine group: an assessment guide for hospitals and hospitalists. J Hosp Med. 2014;9(2):123–128.
The structure and function of academic hospital medicine programs (AHPs) has evolved significantly with the growth of hospital medicine.[1, 2, 3, 4] Many AHPs formed in response to regulatory and financial changes, which drove demand for increased trainee oversight, improved clinical efficiency, and growth in nonteaching services staffed by hospitalists. Differences in local organizational contexts and needs have contributed to great variability in AHP program design and operations. As AHPs have become more established, the need to engage academic hospitalists in scholarship and activities that support professional development and promotion has been recognized. Defining sustainable and successful positions for academic hospitalists is a priority called for by leaders in the field.[5, 6]
In this rapidly evolving context, AHPs have employed a variety of approaches to organizing clinical and academic faculty roles, without guiding evidence or consensus‐based performance benchmarks. A number of AHPs have achieved success along traditional academic metrics of research, scholarship, and education. Currently, it is not known whether specific approaches to AHP organization, structure, or definition of faculty roles are associated with achievement of more traditional markers of academic success.
The Academic Committee of the Society of Hospital Medicine (SHM), and the Academic Hospitalist Task Force of the Society of General Internal Medicine (SGIM) had separately initiated projects to explore characteristics associated with success in AHPs. In 2012, these organizations combined efforts to jointly develop and implement the SCHOLAR (SuCcessful HOspitaLists in Academics and Research) project. The goals were to identify successful AHPs using objective criteria, and to then study those groups in greater detail to generate insights that would be broadly relevant to the field. Efforts to clarify the factors within AHPs linked to success by traditional academic metrics will benefit hospitalists, their leaders, and key stakeholders striving to achieve optimal balance between clinical and academic roles. We describe the initial work of the SCHOLAR project, our definitions of academic success in AHPs, and the characteristics of a cohort of exemplary AHPs who achieved the highest levels on these metrics.
METHODS
Defining Success
The 11 members of the SCHOLAR project held a variety of clinical and academic roles within a geographically diverse group of AHPs. We sought to create a functional definition of success applicable to AHPs. As no gold standard currently exists, we used a consensus process among task force members to arrive at a definition that was quantifiable, feasible, and meaningful. The first step was brainstorming on conference calls held 1 to 2 times monthly over 4 months. Potential defining characteristics that emerged from these discussions related to research, teaching, and administrative activities. When potential characteristics were proposed, we considered how to operationalize each one. Each characteristic was discussed until there was consensus from the entire group. Those around education and administration were the most complex, as many roles are locally driven and defined, and challenging to quantify. For this reason, we focused on promotion as a more global approach to assessing academic hospitalist success in these areas. Although criteria for academic advancement also vary across institutions, we felt that promotion generally reflected having met some threshold of academic success. We also wanted to recognize that scholarship occurs outside the context of funded research. Ultimately, 3 key domains emerged: research grant funding, faculty promotion, and scholarship.
After these 3 domains were identified, the group sought to define quantitative metrics to assess performance. These discussions occurred on subsequent calls over a 4‐month period. Between calls, group members gathered additional information to facilitate assessment of the feasibility of proposed metrics, reporting on progress via email. Again, group consensus was sought for each metric considered. Data on grant funding and successful promotions were available from a previous survey conducted through the SHM in 2011. Leaders from 170 AHPs were contacted, with 50 providing complete responses to the 21‐item questionnaire (see Supporting Information, Appendix 1, in the online version of this article). Results of the survey, heretofore referred to as the Leaders of Academic Hospitalist Programs survey (LAHP‐50), have been described elsewhere.[7] For the purposes of this study, we used the self‐reported data about grant funding and promotions contained in the survey to reflect the current state of the field. Although the survey response rate was approximately 30%, the survey was not anonymous, and many reputationally prominent academic hospitalist programs were represented. For these reasons, the group members felt that the survey results were relevant for the purposes of assessing academic success.
In the LAHP‐50, funding was defined as principal investigator or coinvestigator roles on federally and nonfederally funded research, clinical trials, internal grants, and any other extramurally funded projects. Mean and median funding for the overall sample was calculated. Through a separate question, each program's total faculty full‐time equivalent (FTE) count was reported, allowing us to adjust for group size by assessing both total funding per group and funding/FTE for each responding AHP.
Promotions were defined by the self‐reported number of faculty at each of the following ranks: instructor, assistant professor, associate professor, full professor, and professor above scale/emeritus. In addition, a category of nonacademic track (eg, adjunct faculty, clinical associate) was included to capture hospitalists that did not fit into the traditional promotions categories. We did not distinguish between tenure‐track and nontenure‐track academic ranks. LAHP‐50 survey respondents reported the number of faculty in their group at each academic rank. Given that the majority of academic hospitalists hold a rank of assistant professor or lower,[6, 8, 9] and that the number of full professors was only 3% in the LAHP‐50 cohort, we combined the faculty at the associate and full professor ranks, defining successfully promoted faculty as the percent of hospitalists above the rank of assistant professor.
We created a new metric to assess scholarly output. We had considerable discussion of ways to assess the numbers of peer‐reviewed manuscripts generated by AHPs. However, the group had concerns about the feasibility of identification and attribution of authors to specific AHPs through literature searches. We considered examining only publications in the Journal of Hospital Medicine and the Journal of General Internal Medicine, but felt that this would exclude significant work published by hospitalists in fields of medical education or health services research that would more likely appear in alternate journals. Instead, we quantified scholarship based on the number of abstracts presented at national meetings. We focused on meetings of the SHM and SGIM as the primary professional societies representing hospital medicine. The group felt that even work published outside of the journals of our professional societies would likely be presented at those meetings. We used the following strategy: We reviewed research abstracts accepted for presentation as posters or oral abstracts at the 2010 and 2011 SHM national meetings, and research abstracts with a primary or secondary category of hospital medicine at the 2010 and 2011 SGIM national meetings. By including submissions at both SGIM and SHM meetings, we accounted for the fact that some programs may gravitate more to one society meeting or another. We did not include abstracts in the clinical vignettes or innovations categories. We tallied the number of abstracts by group affiliation of the authors for each of the 4 meetings above and created a cumulative total per group for the 2‐year period. Abstracts with authors from different AHPs were counted once for each individual group. Members of the study group reviewed abstracts from each of the meetings in pairs. Reviewers worked separately and compared tallies of results to ensure consistent tabulations. Internet searches were conducted to identify or confirm author affiliations if it was not apparent in the abstract author list. Abstract tallies were compiled without regard to whether programs had completed the LAHP‐50 survey; thus, we collected data on programs that did not respond to the LAHP‐50 survey.
Identification of the SCHOLAR Cohort
To identify our cohort of top‐performing AHPs, we combined the funding and promotions data from the LAHP‐50 sample with the abstract data. We limited our sample to adult hospital medicine groups to reduce heterogeneity. We created rank lists of programs in each category (grant funding, successful promotions, and scholarship), using data from the LAHP‐50 survey to rank programs on funding and promotions, and data from our abstract counts to rank on scholarship. We limited the top‐performing list in each category to 10 institutions as a cutoff. Because we set a threshold of at least $1 million in total funding, we identified only 9 top performing AHPs with regard to grant funding. We also calculated mean funding/FTE. We chose to rank programs only by funding/FTE rather than total funding per program to better account for group size. For successful promotions, we ranked programs by the percentage of senior faculty. For abstract counts, we included programs whose faculty presented abstracts at a minimum of 2 separate meetings, and ranked programs based on the total number of abstracts per group.
This process resulted in separate lists of top performing programs in each of the 3 domains we associated with academic success, arranged in descending order by grant dollars/FTE, percent of senior faculty, and abstract counts (Table 1). Seventeen different programs were represented across these 3 top 10 lists. One program appeared on all 3 lists, 8 programs appeared on 2 lists, and the remainder appeared on a single list (Table 2). Seven of these programs were identified solely based on abstract presentations, diversifying our top groups beyond only those who completed the LAHP‐50 survey. We considered all of these programs to represent high performance in academic hospital medicine. The group selected this inclusive approach because we recognized that any 1 metric was potentially limited, and we sought to identify diverse pathways to success.
| Funding | Promotions | Scholarship | |
|---|---|---|---|
| Grant $/FTE | Total Grant $ | Senior Faculty, No. (%) | Total Abstract Count |
| |||
| $1,409,090 | $15,500,000 | 3 (60%) | 23 |
| $1,000,000 | $9,000,000 | 3 (60%) | 21 |
| $750,000 | $8,000,000 | 4 (57%) | 20 |
| $478,609 | $6,700,535 | 9 (53%) | 15 |
| $347,826 | $3,000,000 | 8 (44%) | 11 |
| $86,956 | $3,000,000 | 14 (41%) | 11 |
| $66,666 | $2,000,000 | 17 (36%) | 10 |
| $46,153 | $1,500,000 | 9 (33%) | 10 |
| $38,461 | $1,000,000 | 2 (33%) | 9 |
| 4 (31%) | 9 | ||
| Selection Criteria for SCHOLAR Cohort | No. of Programs |
|---|---|
| |
| Abstracts, funding, and promotions | 1 |
| Abstracts plus promotions | 4 |
| Abstracts plus funding | 3 |
| Funding plus promotion | 1 |
| Funding only | 1 |
| Abstract only | 7 |
| Total | 17 |
| Top 10 abstract count | |
| 4 meetings | 2 |
| 3 meetings | 2 |
| 2 meetings | 6 |
The 17 unique adult AHPs appearing on at least 1 of the top 10 lists comprised the SCHOLAR cohort of programs that we studied in greater detail. Data reflecting program demographics were solicited directly from leaders of the AHPs identified in the SCHOLAR cohort, including size and age of program, reporting structure, number of faculty at various academic ranks (for programs that did not complete the LAHP‐50 survey), and number of faculty with fellowship training (defined as any postresidency fellowship program).
Subsequently, we performed comparative analyses between the programs in the SCHOLAR cohort to the general population of AHPs reflected by the LAHP‐50 sample. Because abstract presentations were not recorded in the original LAHP‐50 survey instrument, it was not possible to perform a benchmarking comparison for the scholarship domain.
Data Analysis
To measure the success of the SCHOLAR cohort we compared the grant funding and proportion of successfully promoted faculty at the SCHOLAR programs to those in the overall LAHP‐50 sample. Differences in mean and median grant funding were compared using t tests and Mann‐Whitney rank sum tests. Proportion of promoted faculty were compared using 2 tests. A 2‐tailed of 0.05 was used to test significance of differences.
RESULTS
Demographics
Among the AHPs in the SCHOLAR cohort, the mean program age was 13.2 years (range, 618 years), and the mean program size was 36 faculty (range, 1895; median, 28). On average, 15% of faculty members at SCHOLAR programs were fellowship trained (range, 0%37%). Reporting structure among the SCHOLAR programs was as follows: 53% were an independent division or section of the department of medicine; 29% were a section within general internal medicine, and 18% were an independent clinical group.
Grant Funding
Table 3 compares grant funding in the SCHOLAR programs to programs in the overall LAHP‐50 sample. Mean funding per group and mean funding per FTE were significantly higher in the SCHOLAR group than in the overall sample.
| Funding (Millions) | ||
|---|---|---|
| LAHP‐50 Overall Sample | SCHOLAR | |
| ||
| Median grant funding/AHP | 0.060 | 1.500* |
| Mean grant funding/AHP | 1.147 (015) | 3.984* (015) |
| Median grant funding/FTE | 0.004 | 0.038* |
| Mean grant funding/FTE | 0.095 (01.4) | 0.364* (01.4) |
Thirteen of the SCHOLAR programs were represented in the initial LAHP‐50, but 2 did not report a dollar amount for grants and contracts. Therefore, data for total grant funding were available for only 65% (11 of 17) of the programs in the SCHOLAR cohort. Of note, 28% of AHPs in the overall LAHP‐50 sample reported no external funding sources.
Faculty Promotion
Figure 1 demonstrates the proportion of faculty at various academic ranks. The percent of faculty above the rank of assistant professor in the SCHOLAR programs exceeded those in the overall LAHP‐50 by 5% (17.9% vs 12.8%, P = 0.01). Of note, 6% of the hospitalists at AHPs in the SCHOLAR programs were on nonfaculty tracks.
Scholarship
Mean abstract output over the 2‐year period measured was 10.8 (range, 323) in the SCHOLAR cohort. Because we did not collect these data for the LAHP‐50 group, comparative analyses were not possible.
DISCUSSION
Using a definition of academic success that incorporated metrics of grant funding, faculty promotion, and scholarly output, we identified a unique subset of successful AHPsthe SCHOLAR cohort. The programs represented in the SCHOLAR cohort were generally large and relatively mature. Despite this, the cohort consisted of mostly junior faculty, had a paucity of fellowship‐trained hospitalists, and not all reported grant funding.
Prior published work reported complementary findings.[6, 8, 9] A survey of 20 large, well‐established academic hospitalist programs in 2008 found that the majority of hospitalists were junior faculty with a limited publication portfolio. Of the 266 respondents in that study, 86% reported an academic rank at or below assistant professor; funding was not explored.[9] Our similar findings 4 years later add to this work by demonstrating trends over time, and suggest that progress toward creating successful pathways for academic advancement has been slow. In a 2012 survey of the SHM membership, 28% of hospitalists with academic appointments reported no current or future plans to engage in research.[8] These findings suggest that faculty in AHPs may define scholarship through nontraditional pathways, or in some cases choose not to pursue or prioritize scholarship altogether.
Our findings also add to the literature with regard to our assessment of funding, which was variable across the SCHOLAR group. The broad range of funding in the SCHOLAR programs for which we have data (grant dollars $0$15 million per program) suggests that opportunities to improve supported scholarship remain, even among a selected cohort of successful AHPs. The predominance of junior faculty in the SCHOLAR programs may be a reason for this variation. Junior faculty may be engaged in research with funding directed to senior mentors outside their AHP. Alternatively, they may pursue meaningful local hospital quality improvement or educational innovations not supported by external grants, or hold leadership roles in education, quality, or information technology that allow for advancement and promotion without external grant funding. As the scope and impact of these roles increases, senior leaders with alternate sources of support may rely less on research funds; this too may explain some of the differences. Our findings are congruent with results of a study that reviewed original research published by hospitalists, and concluded that the majority of hospitalist research was not externally funded.[8] Our approach for assessing grant funding by adjusting for FTE had the potential to inadvertently favor smaller well‐funded groups over larger ones; however, programs in our sample were similarly represented when ranked by funding/FTE or total grant dollars. As many successful AHPs do concentrate their research funding among a core of focused hospitalist researchers, our definition may not be the ideal metric for some programs.
We chose to define scholarship based on abstract output, rather than peer‐reviewed publications. Although this choice was necessary from a feasibility perspective, it may have excluded programs that prioritize peer‐reviewed publications over abstracts. Although we were unable to incorporate a search strategy to accurately and comprehensively track the publication output attributed specifically to hospitalist researchers and quantify it by program, others have since defined such an approach.[8] However, tracking abstracts theoretically allowed insights into a larger volume of innovative and creative work generated by top AHPs by potentially including work in the earlier stages of development.
We used a consensus‐based definition of success to define our SCHOLAR cohort. There are other ways to measure academic success, which if applied, may have yielded a different sample of programs. For example, over half of the original research articles published in the Journal of Hospital Medicine over a 7‐year span were generated from 5 academic centers.[8] This definition of success may be equally credible, though we note that 4 of these 5 programs were also included in the SCHOLAR cohort. We feel our broader approach was more reflective of the variety of pathways to success available to academic hospitalists. Before our metrics are applied as a benchmarking tool, however, they should ideally be combined with factors not measured in our study to ensure a more comprehensive or balanced reflection of academic success. Factors such as mentorship, level of hospitalist engagement,[10] prevalence of leadership opportunities, operational and fiscal infrastructure, and the impact of local quality, safety, and value efforts should be considered.
Comparison of successfully promoted faculty at AHPs across the country is inherently limited by the wide variation in promotion standards across different institutions; controlling for such differences was not possible with our methodology. For example, it appears that several programs with relatively few senior faculty may have met metrics leading to their inclusion in the SCHOLAR group because of their small program size. Future benchmarking efforts for promotion at AHPs should take scaling into account and consider both total number as well as percentage of senior faculty when evaluating success.
Our methodology has several limitations. Survey data were self‐reported and not independently validated, and as such are subject to recall and reporting biases. Response bias inherently excluded some AHPs that may have met our grant funding or promotions criteria had they participated in the initial LAHP‐50 survey, though we identified and included additional programs through our scholarship metric, increasing the representativeness of the SCHOLAR cohort. Given the dynamic nature of the field, the age of the data we relied upon for analysis limits the generalizability of our specific benchmarks to current practice. However, the development of academic success occurs over the long‐term, and published data on academic hospitalist productivity are consistent with this slower time course.[8] Despite these limitations, our data inform the general topic of gauging performance of AHPs, underscoring the challenges of developing and applying metrics of success, and highlight the variability of performance on selected metrics even among a relatively small group of 17 programs.
In conclusion, we have created a method to quantify academic success that may be useful to academic hospitalists and their group leaders as they set targets for improvement in the field. Even among our SCHOLAR cohort, room for ongoing improvement in development of funded scholarship and a core of senior faculty exists. Further investigation into the unique features of successful groups will offer insight to leaders in academic hospital medicine regarding infrastructure and processes that should be embraced to raise the bar for all AHPs. In addition, efforts to further define and validate nontraditional approaches to scholarship that allow for successful promotion at AHPs would be informative. We view our work less as a singular approach to benchmarking standards for AHPs, and more a call to action to continue efforts to balance scholarly activity and broad professional development of academic hospitalists with increasing clinical demands.
Acknowledgements
The authors thank all of the AHP leaders who participated in the SCHOLAR project. They also thank the Society of Hospital Medicine and Society of General Internal Medicine and the SHM Academic Committee and SGIM Academic Hospitalist Task Force for their support of this work.
Disclosures
The work reported here was supported by the Department of Veterans Affairs, Veterans Health Administration, South Texas Veterans Health Care System. The views expressed in this article are those of the authors and do not necessarily reflect the position or policy of the Department of Veterans Affairs. The authors report no conflicts of interest.
- , , , , . Characteristics of primary care providers who adopted the hospitalist model from 2001 to 2009. J Hosp Med. 2015;10(2):75–82.
- , , , . Growth in the care of older patients by hospitalists in the United States. N Engl J Med. 2009;360(11):1102–1112.
- , , , , . Updating threshold‐based identification of hospitalists in 2012 Medicare pay data. J Hosp Med. 2016;11(1):45–47.
- , , , . Use of hospitalists by Medicare beneficiaries: a national picture. Medicare Medicaid Res Rev. 2014;4(2).
- , , , , , . Challenges and opportunities in Academic Hospital Medicine: report from the Academic Hospital Medicine Summit. J Hosp Med. 2009;4(4):240–246.
- , , , . Survey of US academic hospitalist leaders about mentorship and academic activities in hospitalist groups. J Hosp Med. 2011;6(1):5–9.
- , , , , , . The structure of hospital medicine programs at academic medical centers [abstract]. J Hosp Med. 2012;7(suppl 2):s92.
- , , , , . Research and publication trends in hospital medicine. J Hosp Med. 2014;9(3):148–154.
- , , , , , . Mentorship, productivity, and promotion among academic hospitalists. J Gen Intern Med. 2012;27(1):23–27.
- , , , et al. The key principles and characteristics of an effective hospital medicine group: an assessment guide for hospitals and hospitalists. J Hosp Med. 2014;9(2):123–128.

Sensitivity of Superficial Wound Culture
While a general consensus exists that surface wound cultures have less utility than deeper cultures, surface cultures are nevertheless routinely used to guide empiric antibiotic administration. This is due in part to the ease with which surface cultures are obtained and the delay in obtaining deeper wound and bone cultures. The Infectious Diseases Society of America (IDSA) recommends routine culture of all diabetic infections before initiating empiric antibiotic therapy, despite caveats regarding undebrided wounds.1 Further examination of 2 additional societies, the European Society of Clinical Microbiology and Infectious Diseases and the Australasian Society for Infectious Diseases, reveals that they also do not describe guidelines on the role of surface wound cultures in skin, and skin structure infection (SSSI) management.2, 3
Surface wound cultures are used to aid in diagnosis and appropriate antibiotic treatment of lower extremity foot ulcers.4 Contaminated cultures from other body locations have shown little utility and may be wasteful of resources.5, 6 We hypothesize that given commensal skin flora, coupled with the additional flora that colonizes (chronic) lower extremity wounds, surface wound cultures provide poor diagnostic accuracy for determining the etiology of acute infection. In contrast, many believe that deep tissue cultures obtained at time of debridement or surgical intervention may provide more relevant information to guide antibiotic therapy, thus serving as a gold standard.13, 7, 8 Nevertheless, with the ease of obtaining these superficial cultures and the promptness of the results, surface wound cultures are still used as a surrogate for the information derived from deeper cultures.
Purpose
The frequency at which superficial wound cultures correlate with the data obtained from deeper cultures is needed to interpret the posttest likelihood of infection. However, the sensitivity and specificity of superficial wound culture as a diagnostic test is unclear. The purpose of this study is to conduct a systematic review of the existing literature in order to investigate the relationship between superficial wound cultures and the etiology of SSSI. Accordingly, we aim to describe any role that surface wound cultures may play in the treatment of lower extremity ulcers.
Materials and Methods
Data Sources
We identified eligible articles through an electronic search of the following databases: Medline through PubMed, Excerpta Medica Database (EMBASE), Cumulative Index of Nursing and Allied Health Literature (CINAHL), and Scopus. We also hand searched the reference lists of key review articles identified by the electronic search and the reference lists of all eligible articles (Figure 1).

Study Selection
The search strategy was limited to English articles published between January 1960 and August 2009. A PubMed search identified titles that contained the following keywords combined with OR: surface wound cultures, extremity ulcer, leg ulcer, foot ulcer, superficial ulcer, Ulcer [MeSH], deep tissue, superficial swab, soft tissue infection, Wounds and Injuries [MeSH], wound swab, deep swab, diabetic ulcer, Microbiology [MeSH], Microbiological Techniques [MeSH]. Medical Subject Headings [MeSH] were used as indicated and were exploded to include subheadings and maximize results. This search strategy was adapted to search the other databases.
Data Extraction
Eligible studies were identified in 2 phases. In the first phase, 2 authors (AY and CC) independently reviewed potential titles of citations for eligibility. Citations were returned for adjudication if disagreement occurred. If agreement could not be reached, the article was retained for further review. In the second phase, 2 authors (AY and CC) independently reviewed the abstracts of eligible titles. In situations of disagreement, abstracts were returned for adjudication and if necessary were retained for further review. Once all eligible articles were identified, 2 reviewers (AY and CL) independently abstracted the information within each article using a pre‐defined abstraction tool. A third investigator (CC) reviewed all the abstracted articles for verification.
We initially selected articles that involved lower extremity wounds. Articles were included if they described superficial wound cultures along with an alternative method of culture for comparison. Alternative culture methods were defined as cultures derived from needle aspiration, wound base biopsy, deep tissue biopsy, surgical debridement, or bone biopsy. Further inclusion criteria required that articles have enough microbiology data to calculate sensitivity and specificity values for superficial wound swabs.
For the included articles, 2 reviewers (AY, CC) abstracted information pertaining to microbiology data from superficial wound swabs and alternative comparison cultures as reported in each article in the form of mean number of isolates recovered. Study characteristics and patient demographics were also recorded.
When not reported in the article, calculation of test sensitivity and specificity involved identifying true and false‐positive tests as well as true and false‐negative tests. Articles were excluded if they did not contain sufficient data to calculate true/false‐positive and true/false‐negative tests. For all articles, we used the formulae [(sensitivity) (1‐specificity)] and [(1‐sensitivity) (specificity)] to calculate positive and negative likelihood ratios (LRs), respectively.
Data Synthesis and Statistical Analysis
Test sensitivity, specificity, positive and negative LR from all articles were pooled using a random‐effects meta‐analysis model (DerSimonian and Laird method). This method considers heterogeneity both within and between studies to calculate the range of possible true effects.9 For situations in which significant heterogeneity is anticipated, the random‐effects model is most conservative and appropriate.9, 10
We also compared the mean number of organisms isolated from wound cultures to the mean number of organisms isolated from alternative culture methods using the nonparametric Wilcoxon rank sum test. Inter‐rater reliability was assessed using the kappa statistic. We assessed potential publication bias by visually examining a funnel plot as described by Egger et al.11 We report 95% confidence intervals, medians with interquartile ranges, and p‐values where appropriate. All data analyses were performed using Stata 9.2 (STATA Corporation, College Station, TX, 2007).
Results
Of 9032 unique citations, eight studies met all inclusion criteria (Figure 1). Inter‐rater reliability was substantial (Kappa = 0.78).12 Areas of initial disagreement generally involved whether a study adequately described an appropriate alternative culture method for comparison or whether data available in an article was sufficient for sensitivity and specificity calculation. Consensus was achieved once the full article was retrieved, reviewed and discussed.
The 8 studies evaluated in the review included a total number of 615 patients or samples (Table 1). Diabetic wounds were described in four studies.1316 Two studies described wounds associated with peripheral vascular disease,13, 17 while four involved traumatic wounds.13, 1719 One study did not identify the clinical circumstances concerning the wounds.20
| Study ID | n | Sensitivity | Specificity | Positive LR | Negative LR |
|---|---|---|---|---|---|
| |||||
| Machowiak et al. (1978)17 | 183* | 0.26 | 0.56 | 0.59 | 1.32 |
| Sharp et al. (1979)15 | 58 | 0.53 | 0.62 | 1.38 | 0.77 |
| Wheat et al. (1986)16 | 26 | 0.35 | 0.32 | 0.51 | 2.06 |
| Zuluaga et al. (2006)19 | 100 | 0.20 | 0.67 | 0.60 | 1.20 |
| Zuluaga et al. (2002)18 | 50 | 0.22 | 0.54 | 0.47 | 1.45 |
| Gardner et al. (2007)13 | 83 | 0.90 | 0.57 | 2.09 | 0.18 |
| Slater et al. (2004)14 | 60 | 0.93 | 0.96 | 23.3 | 0.07 |
| Mousa (1997)20 | 55 | 0.89 | 0.96 | 20.6 | 0.12 |
| Pooled values (95% CI) | 0.49 (0.37‐0.61) | 0.62 (0.51‐0.74) | 1.1 (0.71‐1.5) | 0.67 (0.52‐0.82) | |
The studies used several different methods for obtaining superficial cultures. Six studies obtained purulent wound drainage material through the application of sterile swabs.1316, 18, 19 One study obtained purulent drainage material using needle aspiration.18 Two studies obtained culture material from sinus tracts associated with the wounds, one through sinus tract washings17 and another by obtaining sinus tract discharge material.20
The types of comparison cultures used were equally divided between deep tissue biopsies1316 and bone biopsies,1720 each accounting for 50% (4 of 8) of studies.
In assessing the data from the eight studies, the pooled test sensitivity for superficial wound swabs was 49% (95% confidence interval [CI], 37‐61%) (Figure 2). The pooled specificity for superficial wound swabs was 62% (95% CI, 51‐74%), while the pooled positive and negative LRs were 1.1 (95% CI, 0.71‐1.5) and 0.67 (95% CI, 0.52‐0.82), respectively (Figure 2).

The median number of bacterial isolates reported for each culture type, superficial and comparison culture, was collected from each study (Table 2). The median value for number of bacterial isolates identified by superficial culture was 2.7 (interquartile range [IQR] 1.8‐3.2). The median value for number of bacterial isolates identified by comparison culture was 2.2 (IQR 1.7‐2.9). A Wilcoxon rank sum analysis showed that the number of isolates for surface wound cultures was not significantly different than the number of isolates for comparison cultures (P = 0.75) (Table 1).
| Study ID | # of Isolates (Swab) | # of Isolates (Comparison) | Prior Antibiotics? |
|---|---|---|---|
| |||
| Machowiak et al. (1978)17 | * | * | Treated, but details not reported |
| Sharp et al. (1979)15 | 2.3 | 2.2 | Treated, but details not reported |
| Wheat et al. (1986)16 | 3.3 | 3.4 | Not described |
| Zuluaga et al. (2006)19 | 1.3 | 1.6 | Antibiotics stopped 48 hours prior |
| Zuluaga et al. (2002)18 | 1.1 | 1.4 | 52% on antibiotics, stopped 48 hours prior |
| Gardner et al. (2007)13 | 3.0 | 3.1 | 42% on antibiotics |
| Slater et al. (2004)14 | 2.7 | 2.5 | 27% on prior antibiotics |
| Mousa (1997)20 | 3.6 | 1.9 | Treated, but details not reported |
| Median (IQR) | 2.7 (1.8‐3.2) | 2.2 (1.7‐2.9) | |
Discussion
In performing this review, we discovered ambiguity in the literature regarding the utility of surface wound cultures. Some studies obtained findings to suggest the utility of surface wound cultures,8, 14, 17 while other studies in our review16, 18, 19 provided evidence against them. This variability confirmed the need for a meta‐analytic approach as provided by this review.
While we have tried to minimize bias through a well‐established methodology, we acknowledge that certain methodological limitations should be considered in interpreting the results. There may be publication bias in reviews that include only published articles; a funnel plot of sensitivity vs. sample size showed some asymmetry, suggesting bias. Our search strategy was limited to English‐only articles, which may result in publication bias.
Further, this review included a group of studies that were heterogeneous in several regards. Differences exist in culturing methods and laboratory technology, as exemplified by the variety of superficial culture methods used. We were not able to account for these laboratory differences, as methodologies in obtaining and isolating bacteria were not uniformly well described.
Additionally, the studies classified organisms in different ways. Three studies categorized organisms according to Gram's stain characteristics.13, 16, 18 One study described organisms primarily in terms of aerobic or anaerobic respiration.15 Two studies14, 19 discussed pathogens both in terms of respiration (aerobic/anaerobic) and Gram's stain characteristic, while another 2 studies17, 20 did not describe organisms in either terms. These inconsistencies limited our ability to provide sensitivity and specificity information for specific subclasses of organisms.
The clinical conditions in each study surrounding the wounds were also heterogeneous: most significantly in the issue of prior antibiotic administration. All but 1 study16 indicated that the patients had received antibiotics prior to having cultures obtained. The type of antibiotics (narrow‐spectrum or broad‐spectrum), the route of administration, and the cessation of antibiotics in relation to obtaining swabs and cultures all varied widely or were not well described. This degree of ambiguity will necessarily impact both the reliability of data regarding microbial growth as well as the component flora.
The inclusion of higher quality studies is likely to result in a more reliable meta‐analysis.21 We had hoped that antibiotic trials would contain uniform outcomes and thus strengthen our meta‐analysis through the inclusion of randomized‐controlled studies. Unfortunately, the majority of antibiotic trials did not use superficial wound cultures, did not report mean number of isolates, or did not provide microbiological data in sufficient detail to calculate concordance ratesand therefore, did not meet eligibility criteria. Randomized‐controlled trials were a minority among our included articles; the majority of study designs were retrospective cohorts and case‐controlled studies.
Despite these limitations, we were able to conclude that superficial wound culture provides mediocre sensitivity (49%) and specificity (62%). The positive LR of 1.1 is unhelpful in decision making, having a CI that includes 1. Interestingly, the negative LR of 0.67 could be somewhat helpful in medical decision making, modifying the pretest probability and assisting in ruling out a deeper bacterial infection. Although, according to Fagan's nomogram, a negative LR of 0.67 has only a mild effect on pretest odds.22
The bacterial bioburden assessed by the number of isolates obtained by culture method serves as a proxy for reliability of culture results14, 23 by suggesting that fewer organisms isolated from deep tissue or bone samples reflects a less contaminated specimen. Our assessment of the bioburden found that the median number of isolates was slightly higher in surface cultures than deeper cultures, though not to a significant degree (P = 0.75). This indicates that the degree of contamination in superficial cultures was neither significantly worse nor better than deep cultures.
We attempted to define a role for surface wound cultures; however, we found that these did not show any greater utility than deep cultures for identifying the microbiologic etiology of diabetic wound infections. While the negative LR provides some quantitative verification of the common clinical practice that a negative culture argues against infection, the finding is not especially robust.
Although for this meta‐analysis we grouped all organisms in the same way, we recognize that the sensitivity and specificity may differ according to various subclasses of bacteria. Interpretations of culture results also vary (eg, Gram positive vs. negative; aerobic vs. anaerobic); practitioners will not interpret superficial cultures of coagulase‐negative Staphylococcus in the same way as Pseudomonas. However, this study seeks to establish a reasonable starting point for the medical decision‐making process by providing quantitative values in an area with previously conflicting data. We anticipate that as laboratory techniques improve and research into superficial wounds continues, greater sensitivity of superficial wound cultures will result.
Ultimately, physicians use culture data to target therapy in an effort to use the least toxic and most effective antimicrobial agent possible to successfully treat infections. Clinical outcomes were not described in all included articles; in those that did, the endpoints were too dissimilar for meaningful comparison. Limiting our review to studies reporting treatment outcomes would have resulted in too few included studies. Thus, we were unable able to assess whether superficial wound cultures were associated with improved patient‐oriented outcomes in this meta‐analysis.
There is a significant paucity of trials evaluating the accurate concordance of superficial swabs to deep tissue culture. The current data shows poor sensitivity and specificity of superficial culture methods. The presumption that deeper cultures (such as a bone biopsy) should result in a less contaminated sample and more targeted culture results was also not borne out in our review. When presented with a patient with a wound infection, physicians mentally supply a pretest (or a pretreatment) probability as to the microbiologic etiology of the infection. Careful history will, of course, be critical in identifying extenuating circumstance or unusual exposures. From our meta‐analysis, we cannot recommend the routine use of superficial wound cultures to guide initial antibiotic therapy as this may result in poor resource utilization.5 While clinical outcomes from the use of routine superficial cultures are unclear, we suggest greater use of local antibiograms and methicillin‐resistant Staphylococcus aureus (MRSA) prevalence data to determine resistance patterns and guide the selection of empiric therapies.
- ,,, et al.Diagnosis and treatment of diabetic foot infections.Clin Infect Dis.2004;39:885–910.
- AASID,Australasian Society for Infectious Diseases—Standards, Practice Guidelines (Skin and Soft Tissue Infections): Institute for Safe Medication Practices;2006.
- ESCMID,European Society of Clinical Microbiology 2006.
- ,,,.Methicillin‐resistant Staphylococcus aureus in community‐acquired skin infections.Emerg Infect Dis.2005;11:928–930.
- ,,.Contaminant blood cultures and resource utilization. The true consequences of false‐positive results.JAMA.1991;265:365–369.
- ,,,,,.Cost‐effectiveness of blood cultures for adult patients with cellulitis.Clin Infect Dis.1999;29:1483–1488.
- ,,,,,.Managing skin and soft tissue infections: expert panel recommendations on key decision points.J Antimicrob Chemother.2003;52 Suppl 1:i3‐i17.
- ,,, et al.Deep tissue biopsy vs. superficial swab culture monitoring in the microbiological assessment of limb‐threatening diabetic foot infection.Diabet Med.2001;18:822–827.
- ,.Meta‐analysis in clinical trials.Control Clin Trials.1986;7:177–188.
- ,,.Quantitative synthesis in systematic reviews.Ann Intern Med.1997;127:820–826.
- ,,,.Bias in meta‐analysis detected by a simple, graphical test.BMJ.1997;315:629–634.
- .Practical statistics for medical research.London, UK:Chapman 1991:403–409.
- ,,,,,.Diagnostic validity of three swab techniques for identifying chronic wound infection.Wound Repair Regen.2006;14(5):548–57.
- ,,, et al.Swab cultures accurately identify bacterial pathogens in diabetic foot wounds not involving bone.Diabet Med.2004;21:705–709.
- ,,,,.Microbiology of superficial and deep tissues in infected diabetic gangrene.Surg Gynecol Obstet.1979;149:217–219.
- ,,, et al.Diabetic foot infections. Bacteriologic analysis.Arch Intern Med.1986;146:1935–1940.
- ,,.Diagnostic value of sinus‐tract cultures in chronic osteomyelitis.JAMA.1978;239:2772–2775.
- ,,,.Lack of microbiological concordance between bone and non‐bone specimens in chronic osteomyelitis: an observational study.BMC Infect Dis.2002;2:8.
- ,,,,,.Etiologic diagnosis of chronic osteomyelitis: a prospective study.Arch Intern Med.2006;166:95–100.
- .Evaluation of sinus‐track cultures in chronic bone infection.J Bone Joint Surg Br.1997;79:567–569.
- ,,, et al.Meta‐analysis of observational studies in epidemiology: a proposal for reporting.JAMA.2000;283:2008–2012.
- ,Letter: nomogram for Bayes theorem.N Engl J Med.1975;293:257.
- ,,,,,.Quantitative swab culture versus tissue biopsy: a comparison in chronic wounds.Ostomy Wound Manage.2001;47:34–37.
While a general consensus exists that surface wound cultures have less utility than deeper cultures, surface cultures are nevertheless routinely used to guide empiric antibiotic administration. This is due in part to the ease with which surface cultures are obtained and the delay in obtaining deeper wound and bone cultures. The Infectious Diseases Society of America (IDSA) recommends routine culture of all diabetic infections before initiating empiric antibiotic therapy, despite caveats regarding undebrided wounds.1 Further examination of 2 additional societies, the European Society of Clinical Microbiology and Infectious Diseases and the Australasian Society for Infectious Diseases, reveals that they also do not describe guidelines on the role of surface wound cultures in skin, and skin structure infection (SSSI) management.2, 3
Surface wound cultures are used to aid in diagnosis and appropriate antibiotic treatment of lower extremity foot ulcers.4 Contaminated cultures from other body locations have shown little utility and may be wasteful of resources.5, 6 We hypothesize that given commensal skin flora, coupled with the additional flora that colonizes (chronic) lower extremity wounds, surface wound cultures provide poor diagnostic accuracy for determining the etiology of acute infection. In contrast, many believe that deep tissue cultures obtained at time of debridement or surgical intervention may provide more relevant information to guide antibiotic therapy, thus serving as a gold standard.13, 7, 8 Nevertheless, with the ease of obtaining these superficial cultures and the promptness of the results, surface wound cultures are still used as a surrogate for the information derived from deeper cultures.
Purpose
The frequency at which superficial wound cultures correlate with the data obtained from deeper cultures is needed to interpret the posttest likelihood of infection. However, the sensitivity and specificity of superficial wound culture as a diagnostic test is unclear. The purpose of this study is to conduct a systematic review of the existing literature in order to investigate the relationship between superficial wound cultures and the etiology of SSSI. Accordingly, we aim to describe any role that surface wound cultures may play in the treatment of lower extremity ulcers.
Materials and Methods
Data Sources
We identified eligible articles through an electronic search of the following databases: Medline through PubMed, Excerpta Medica Database (EMBASE), Cumulative Index of Nursing and Allied Health Literature (CINAHL), and Scopus. We also hand searched the reference lists of key review articles identified by the electronic search and the reference lists of all eligible articles (Figure 1).
Study Selection
The search strategy was limited to English articles published between January 1960 and August 2009. A PubMed search identified titles that contained the following keywords combined with OR: surface wound cultures, extremity ulcer, leg ulcer, foot ulcer, superficial ulcer, Ulcer [MeSH], deep tissue, superficial swab, soft tissue infection, Wounds and Injuries [MeSH], wound swab, deep swab, diabetic ulcer, Microbiology [MeSH], Microbiological Techniques [MeSH]. Medical Subject Headings [MeSH] were used as indicated and were exploded to include subheadings and maximize results. This search strategy was adapted to search the other databases.
Data Extraction
Eligible studies were identified in 2 phases. In the first phase, 2 authors (AY and CC) independently reviewed potential titles of citations for eligibility. Citations were returned for adjudication if disagreement occurred. If agreement could not be reached, the article was retained for further review. In the second phase, 2 authors (AY and CC) independently reviewed the abstracts of eligible titles. In situations of disagreement, abstracts were returned for adjudication and if necessary were retained for further review. Once all eligible articles were identified, 2 reviewers (AY and CL) independently abstracted the information within each article using a pre‐defined abstraction tool. A third investigator (CC) reviewed all the abstracted articles for verification.
We initially selected articles that involved lower extremity wounds. Articles were included if they described superficial wound cultures along with an alternative method of culture for comparison. Alternative culture methods were defined as cultures derived from needle aspiration, wound base biopsy, deep tissue biopsy, surgical debridement, or bone biopsy. Further inclusion criteria required that articles have enough microbiology data to calculate sensitivity and specificity values for superficial wound swabs.
For the included articles, 2 reviewers (AY, CC) abstracted information pertaining to microbiology data from superficial wound swabs and alternative comparison cultures as reported in each article in the form of mean number of isolates recovered. Study characteristics and patient demographics were also recorded.
When not reported in the article, calculation of test sensitivity and specificity involved identifying true and false‐positive tests as well as true and false‐negative tests. Articles were excluded if they did not contain sufficient data to calculate true/false‐positive and true/false‐negative tests. For all articles, we used the formulae [(sensitivity) (1‐specificity)] and [(1‐sensitivity) (specificity)] to calculate positive and negative likelihood ratios (LRs), respectively.
Data Synthesis and Statistical Analysis
Test sensitivity, specificity, positive and negative LR from all articles were pooled using a random‐effects meta‐analysis model (DerSimonian and Laird method). This method considers heterogeneity both within and between studies to calculate the range of possible true effects.9 For situations in which significant heterogeneity is anticipated, the random‐effects model is most conservative and appropriate.9, 10
We also compared the mean number of organisms isolated from wound cultures to the mean number of organisms isolated from alternative culture methods using the nonparametric Wilcoxon rank sum test. Inter‐rater reliability was assessed using the kappa statistic. We assessed potential publication bias by visually examining a funnel plot as described by Egger et al.11 We report 95% confidence intervals, medians with interquartile ranges, and p‐values where appropriate. All data analyses were performed using Stata 9.2 (STATA Corporation, College Station, TX, 2007).
Results
Of 9032 unique citations, eight studies met all inclusion criteria (Figure 1). Inter‐rater reliability was substantial (Kappa = 0.78).12 Areas of initial disagreement generally involved whether a study adequately described an appropriate alternative culture method for comparison or whether data available in an article was sufficient for sensitivity and specificity calculation. Consensus was achieved once the full article was retrieved, reviewed and discussed.
The 8 studies evaluated in the review included a total number of 615 patients or samples (Table 1). Diabetic wounds were described in four studies.1316 Two studies described wounds associated with peripheral vascular disease,13, 17 while four involved traumatic wounds.13, 1719 One study did not identify the clinical circumstances concerning the wounds.20
| Study ID | n | Sensitivity | Specificity | Positive LR | Negative LR |
|---|---|---|---|---|---|
| |||||
| Machowiak et al. (1978)17 | 183* | 0.26 | 0.56 | 0.59 | 1.32 |
| Sharp et al. (1979)15 | 58 | 0.53 | 0.62 | 1.38 | 0.77 |
| Wheat et al. (1986)16 | 26 | 0.35 | 0.32 | 0.51 | 2.06 |
| Zuluaga et al. (2006)19 | 100 | 0.20 | 0.67 | 0.60 | 1.20 |
| Zuluaga et al. (2002)18 | 50 | 0.22 | 0.54 | 0.47 | 1.45 |
| Gardner et al. (2007)13 | 83 | 0.90 | 0.57 | 2.09 | 0.18 |
| Slater et al. (2004)14 | 60 | 0.93 | 0.96 | 23.3 | 0.07 |
| Mousa (1997)20 | 55 | 0.89 | 0.96 | 20.6 | 0.12 |
| Pooled values (95% CI) | 0.49 (0.37‐0.61) | 0.62 (0.51‐0.74) | 1.1 (0.71‐1.5) | 0.67 (0.52‐0.82) | |
The studies used several different methods for obtaining superficial cultures. Six studies obtained purulent wound drainage material through the application of sterile swabs.1316, 18, 19 One study obtained purulent drainage material using needle aspiration.18 Two studies obtained culture material from sinus tracts associated with the wounds, one through sinus tract washings17 and another by obtaining sinus tract discharge material.20
The types of comparison cultures used were equally divided between deep tissue biopsies1316 and bone biopsies,1720 each accounting for 50% (4 of 8) of studies.
In assessing the data from the eight studies, the pooled test sensitivity for superficial wound swabs was 49% (95% confidence interval [CI], 37‐61%) (Figure 2). The pooled specificity for superficial wound swabs was 62% (95% CI, 51‐74%), while the pooled positive and negative LRs were 1.1 (95% CI, 0.71‐1.5) and 0.67 (95% CI, 0.52‐0.82), respectively (Figure 2).
The median number of bacterial isolates reported for each culture type, superficial and comparison culture, was collected from each study (Table 2). The median value for number of bacterial isolates identified by superficial culture was 2.7 (interquartile range [IQR] 1.8‐3.2). The median value for number of bacterial isolates identified by comparison culture was 2.2 (IQR 1.7‐2.9). A Wilcoxon rank sum analysis showed that the number of isolates for surface wound cultures was not significantly different than the number of isolates for comparison cultures (P = 0.75) (Table 1).
| Study ID | # of Isolates (Swab) | # of Isolates (Comparison) | Prior Antibiotics? |
|---|---|---|---|
| |||
| Machowiak et al. (1978)17 | * | * | Treated, but details not reported |
| Sharp et al. (1979)15 | 2.3 | 2.2 | Treated, but details not reported |
| Wheat et al. (1986)16 | 3.3 | 3.4 | Not described |
| Zuluaga et al. (2006)19 | 1.3 | 1.6 | Antibiotics stopped 48 hours prior |
| Zuluaga et al. (2002)18 | 1.1 | 1.4 | 52% on antibiotics, stopped 48 hours prior |
| Gardner et al. (2007)13 | 3.0 | 3.1 | 42% on antibiotics |
| Slater et al. (2004)14 | 2.7 | 2.5 | 27% on prior antibiotics |
| Mousa (1997)20 | 3.6 | 1.9 | Treated, but details not reported |
| Median (IQR) | 2.7 (1.8‐3.2) | 2.2 (1.7‐2.9) | |
Discussion
In performing this review, we discovered ambiguity in the literature regarding the utility of surface wound cultures. Some studies obtained findings to suggest the utility of surface wound cultures,8, 14, 17 while other studies in our review16, 18, 19 provided evidence against them. This variability confirmed the need for a meta‐analytic approach as provided by this review.
While we have tried to minimize bias through a well‐established methodology, we acknowledge that certain methodological limitations should be considered in interpreting the results. There may be publication bias in reviews that include only published articles; a funnel plot of sensitivity vs. sample size showed some asymmetry, suggesting bias. Our search strategy was limited to English‐only articles, which may result in publication bias.
Further, this review included a group of studies that were heterogeneous in several regards. Differences exist in culturing methods and laboratory technology, as exemplified by the variety of superficial culture methods used. We were not able to account for these laboratory differences, as methodologies in obtaining and isolating bacteria were not uniformly well described.
Additionally, the studies classified organisms in different ways. Three studies categorized organisms according to Gram's stain characteristics.13, 16, 18 One study described organisms primarily in terms of aerobic or anaerobic respiration.15 Two studies14, 19 discussed pathogens both in terms of respiration (aerobic/anaerobic) and Gram's stain characteristic, while another 2 studies17, 20 did not describe organisms in either terms. These inconsistencies limited our ability to provide sensitivity and specificity information for specific subclasses of organisms.
The clinical conditions in each study surrounding the wounds were also heterogeneous: most significantly in the issue of prior antibiotic administration. All but 1 study16 indicated that the patients had received antibiotics prior to having cultures obtained. The type of antibiotics (narrow‐spectrum or broad‐spectrum), the route of administration, and the cessation of antibiotics in relation to obtaining swabs and cultures all varied widely or were not well described. This degree of ambiguity will necessarily impact both the reliability of data regarding microbial growth as well as the component flora.
The inclusion of higher quality studies is likely to result in a more reliable meta‐analysis.21 We had hoped that antibiotic trials would contain uniform outcomes and thus strengthen our meta‐analysis through the inclusion of randomized‐controlled studies. Unfortunately, the majority of antibiotic trials did not use superficial wound cultures, did not report mean number of isolates, or did not provide microbiological data in sufficient detail to calculate concordance ratesand therefore, did not meet eligibility criteria. Randomized‐controlled trials were a minority among our included articles; the majority of study designs were retrospective cohorts and case‐controlled studies.
Despite these limitations, we were able to conclude that superficial wound culture provides mediocre sensitivity (49%) and specificity (62%). The positive LR of 1.1 is unhelpful in decision making, having a CI that includes 1. Interestingly, the negative LR of 0.67 could be somewhat helpful in medical decision making, modifying the pretest probability and assisting in ruling out a deeper bacterial infection. Although, according to Fagan's nomogram, a negative LR of 0.67 has only a mild effect on pretest odds.22
The bacterial bioburden assessed by the number of isolates obtained by culture method serves as a proxy for reliability of culture results14, 23 by suggesting that fewer organisms isolated from deep tissue or bone samples reflects a less contaminated specimen. Our assessment of the bioburden found that the median number of isolates was slightly higher in surface cultures than deeper cultures, though not to a significant degree (P = 0.75). This indicates that the degree of contamination in superficial cultures was neither significantly worse nor better than deep cultures.
We attempted to define a role for surface wound cultures; however, we found that these did not show any greater utility than deep cultures for identifying the microbiologic etiology of diabetic wound infections. While the negative LR provides some quantitative verification of the common clinical practice that a negative culture argues against infection, the finding is not especially robust.
Although for this meta‐analysis we grouped all organisms in the same way, we recognize that the sensitivity and specificity may differ according to various subclasses of bacteria. Interpretations of culture results also vary (eg, Gram positive vs. negative; aerobic vs. anaerobic); practitioners will not interpret superficial cultures of coagulase‐negative Staphylococcus in the same way as Pseudomonas. However, this study seeks to establish a reasonable starting point for the medical decision‐making process by providing quantitative values in an area with previously conflicting data. We anticipate that as laboratory techniques improve and research into superficial wounds continues, greater sensitivity of superficial wound cultures will result.
Ultimately, physicians use culture data to target therapy in an effort to use the least toxic and most effective antimicrobial agent possible to successfully treat infections. Clinical outcomes were not described in all included articles; in those that did, the endpoints were too dissimilar for meaningful comparison. Limiting our review to studies reporting treatment outcomes would have resulted in too few included studies. Thus, we were unable able to assess whether superficial wound cultures were associated with improved patient‐oriented outcomes in this meta‐analysis.
There is a significant paucity of trials evaluating the accurate concordance of superficial swabs to deep tissue culture. The current data shows poor sensitivity and specificity of superficial culture methods. The presumption that deeper cultures (such as a bone biopsy) should result in a less contaminated sample and more targeted culture results was also not borne out in our review. When presented with a patient with a wound infection, physicians mentally supply a pretest (or a pretreatment) probability as to the microbiologic etiology of the infection. Careful history will, of course, be critical in identifying extenuating circumstance or unusual exposures. From our meta‐analysis, we cannot recommend the routine use of superficial wound cultures to guide initial antibiotic therapy as this may result in poor resource utilization.5 While clinical outcomes from the use of routine superficial cultures are unclear, we suggest greater use of local antibiograms and methicillin‐resistant Staphylococcus aureus (MRSA) prevalence data to determine resistance patterns and guide the selection of empiric therapies.
- ,,, et al.Diagnosis and treatment of diabetic foot infections.Clin Infect Dis.2004;39:885–910.
- AASID,Australasian Society for Infectious Diseases—Standards, Practice Guidelines (Skin and Soft Tissue Infections): Institute for Safe Medication Practices;2006.
- ESCMID,European Society of Clinical Microbiology 2006.
- ,,,.Methicillin‐resistant Staphylococcus aureus in community‐acquired skin infections.Emerg Infect Dis.2005;11:928–930.
- ,,.Contaminant blood cultures and resource utilization. The true consequences of false‐positive results.JAMA.1991;265:365–369.
- ,,,,,.Cost‐effectiveness of blood cultures for adult patients with cellulitis.Clin Infect Dis.1999;29:1483–1488.
- ,,,,,.Managing skin and soft tissue infections: expert panel recommendations on key decision points.J Antimicrob Chemother.2003;52 Suppl 1:i3‐i17.
- ,,, et al.Deep tissue biopsy vs. superficial swab culture monitoring in the microbiological assessment of limb‐threatening diabetic foot infection.Diabet Med.2001;18:822–827.
- ,.Meta‐analysis in clinical trials.Control Clin Trials.1986;7:177–188.
- ,,.Quantitative synthesis in systematic reviews.Ann Intern Med.1997;127:820–826.
- ,,,.Bias in meta‐analysis detected by a simple, graphical test.BMJ.1997;315:629–634.
- .Practical statistics for medical research.London, UK:Chapman 1991:403–409.
- ,,,,,.Diagnostic validity of three swab techniques for identifying chronic wound infection.Wound Repair Regen.2006;14(5):548–57.
- ,,, et al.Swab cultures accurately identify bacterial pathogens in diabetic foot wounds not involving bone.Diabet Med.2004;21:705–709.
- ,,,,.Microbiology of superficial and deep tissues in infected diabetic gangrene.Surg Gynecol Obstet.1979;149:217–219.
- ,,, et al.Diabetic foot infections. Bacteriologic analysis.Arch Intern Med.1986;146:1935–1940.
- ,,.Diagnostic value of sinus‐tract cultures in chronic osteomyelitis.JAMA.1978;239:2772–2775.
- ,,,.Lack of microbiological concordance between bone and non‐bone specimens in chronic osteomyelitis: an observational study.BMC Infect Dis.2002;2:8.
- ,,,,,.Etiologic diagnosis of chronic osteomyelitis: a prospective study.Arch Intern Med.2006;166:95–100.
- .Evaluation of sinus‐track cultures in chronic bone infection.J Bone Joint Surg Br.1997;79:567–569.
- ,,, et al.Meta‐analysis of observational studies in epidemiology: a proposal for reporting.JAMA.2000;283:2008–2012.
- ,Letter: nomogram for Bayes theorem.N Engl J Med.1975;293:257.
- ,,,,,.Quantitative swab culture versus tissue biopsy: a comparison in chronic wounds.Ostomy Wound Manage.2001;47:34–37.
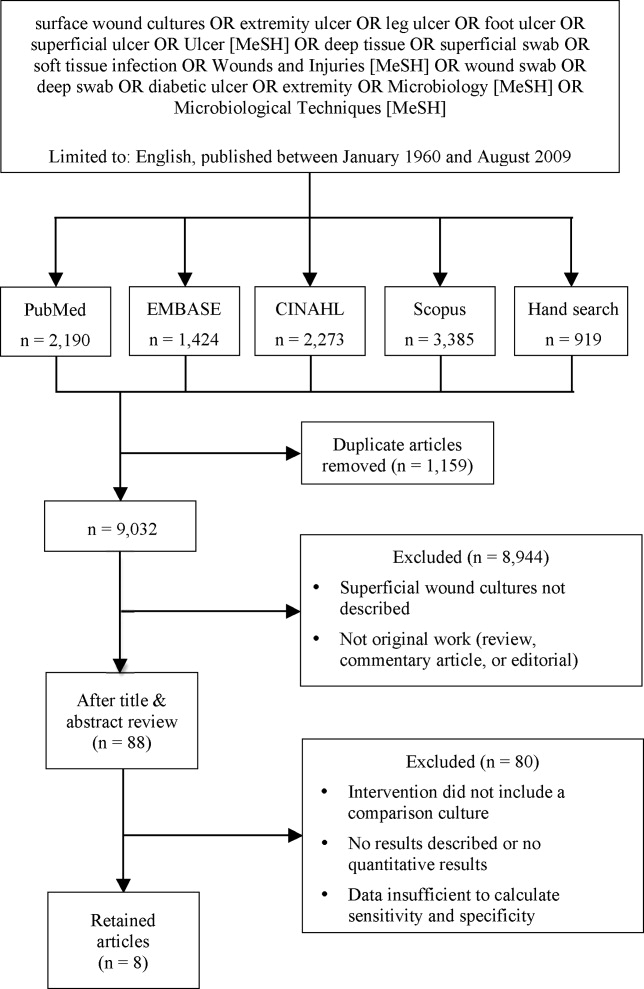
Continuing Medical Education Program in
If you wish to receive credit for this activity, which begins on the next page, please refer to the website:
Accreditation and Designation Statement
Blackwell Futura Media Services designates this educational activity for a 1 AMA PRA Category 1 Credit. Physicians should only claim credit commensurate with the extent of their participation in the activity.
Blackwell Futura Media Services is accredited by the Accreditation Council for Continuing Medical Education to provide continuing medical education for physicians.
Educational Objectives
Continuous participation in the Journal of Hospital Medicine CME program will enable learners to be better able to:
-
Interpret clinical guidelines and their applications for higher quality and more efficient care for all hospitalized patients.
-
Describe the standard of care for common illnesses and conditions treated in the hospital; such as pneumonia, COPD exacerbation, acute coronary syndrome, HF exacerbation, glycemic control, venous thromboembolic disease, stroke, etc.
-
Discuss evidence‐based recommendations involving transitions of care, including the hospital discharge process.
-
Gain insights into the roles of hospitalists as medical educators, researchers, medical ethicists, palliative care providers, and hospital‐based geriatricians.
-
Incorporate best practices for hospitalist administration, including quality improvement, patient safety, practice management, leadership, and demonstrating hospitalist value.
-
Identify evidence‐based best practices and trends for both adult and pediatric hospital medicine.
Instructions on Receiving Credit
For information on applicability and acceptance of continuing medical education credit for this activity, please consult your professional licensing board.
This activity is designed to be completed within the time designated on the title page; physicians should claim only those credits that reflect the time actually spent in the activity. To successfully earn credit, participants must complete the activity during the valid credit period that is noted on the title page.
Follow these steps to earn credit:
-
Log on to
www.blackwellpublishing.com/cme . -
Read the target audience, learning objectives, and author disclosures.
-
Read the article in print or online format.
-
Reflect on the article.
-
Access the CME Exam, and choose the best answer to each question.
-
Complete the required evaluation component of the activity.
Lower Extremity Ulcers
A 62‐year‐old man with hypertension, diabetes mellitus, and coronary artery disease (CAD), on peritoneal dialysis, presented with a nonhealing left lower extremity ulcer (Figure 1). Treatment with empiric antibiotics showed no improvement and cultures remained persistently negative. A surgical specimen revealed pathological changes consistent with calciphylaxis (Figures 2 and 3).

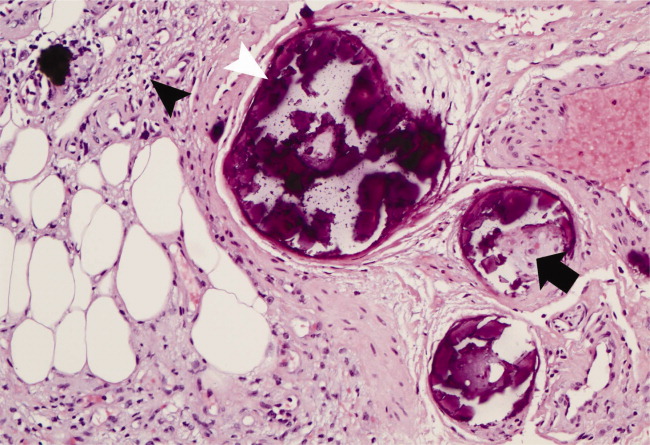
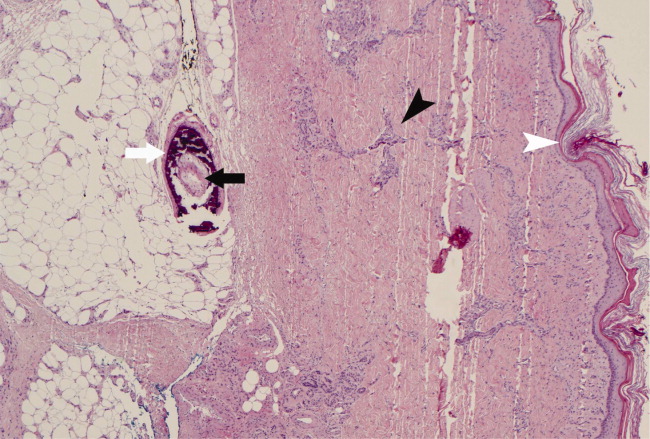
With a mortality between 30% and 80% and a 5‐year survival of 40%,1‐3 calciphylaxis, or calcific uremic arteriolopathy, is devastating. Dialysis and a calcium‐phosphate product above 60 mg2/dL2 increased the index of suspicion (our patient = 70).4 As visual findings may resemble vasculitis or atherosclerotic vascular lesions, biopsy remains the mainstay of diagnosis. Findings include intimal fibrosis, medial calcification, panniculitis, and fat necrosis.5
Management involves aggressive phosphate binding, preventing superinfection, and surgical debridement.6 The evidence for newer therapies (sodium thiosulfate, cinacalcet) appears promising,7‐10 while the benefit of parathyroidectomy is equivocal.11 Despite therapy, our patient developed new lesions (right lower extremity, penis) and opted for hospice services.
- ,,,.Cecil Essentials of Medicine.6th ed.New York:W.B. Saunders;2003.
- .Calciphylaxis: pathogenesis and therapy.J Cutan Med Surg.1998;2(4):245‐248.
- ,.Calciphylaxis: diagnosis and treatment.Adv Skin Wound Care.2001;14(6):309‐312.
- ,,.Calciphylaxis.Postgrad Med J.2001;77(911):557‐561.
- Silverberg SG, DeLellis RA, Frable WJ, LiVolsi VA, Wick MR, eds.Silverberg's Principles and Practice of Surgical Pathology and Cytopathology. Vol.1‐2.4th ed.Philadelphia:Elsevier Churchill Livingstone;2006.
- ,,,.Calciphylaxis: medical and surgical management of chronic extensive wounds in a renal dialysis population.Plast Reconstr Surg.2004;113(1):304‐312.
- ,,, et al.Cinacalcet for secondary hyperparathyroidism in patients receiving hemodialysis.N Engl J Med.2004;350(15):1516‐1525.
- ,,.Rapid resolution of calciphylaxis with intravenous sodium thiosulfate and continuous venovenous haemofiltration using low calcium replacement fluid: case report.Nephrol Dial Transplant.2005;20(6):1260‐1262.
- ,,,.Successful treatment of calciphylaxis with intravenous sodium thiosulfate.Am J Kidney Dis.2004;43(6):1104‐1108.
- ,.Intraperitoneal sodium thiosulfate for the treatment of calciphylaxis.Ren Fail.2006;28(4):361‐363.
- ,,,,.Therapy for calciphylaxis: an outcome analysis.Surgery.2003;134(6):941‐944; discussion 944‐945.
A 62‐year‐old man with hypertension, diabetes mellitus, and coronary artery disease (CAD), on peritoneal dialysis, presented with a nonhealing left lower extremity ulcer (Figure 1). Treatment with empiric antibiotics showed no improvement and cultures remained persistently negative. A surgical specimen revealed pathological changes consistent with calciphylaxis (Figures 2 and 3).
With a mortality between 30% and 80% and a 5‐year survival of 40%,1‐3 calciphylaxis, or calcific uremic arteriolopathy, is devastating. Dialysis and a calcium‐phosphate product above 60 mg2/dL2 increased the index of suspicion (our patient = 70).4 As visual findings may resemble vasculitis or atherosclerotic vascular lesions, biopsy remains the mainstay of diagnosis. Findings include intimal fibrosis, medial calcification, panniculitis, and fat necrosis.5
Management involves aggressive phosphate binding, preventing superinfection, and surgical debridement.6 The evidence for newer therapies (sodium thiosulfate, cinacalcet) appears promising,7‐10 while the benefit of parathyroidectomy is equivocal.11 Despite therapy, our patient developed new lesions (right lower extremity, penis) and opted for hospice services.
- ,,,.Cecil Essentials of Medicine.6th ed.New York:W.B. Saunders;2003.
- .Calciphylaxis: pathogenesis and therapy.J Cutan Med Surg.1998;2(4):245‐248.
- ,.Calciphylaxis: diagnosis and treatment.Adv Skin Wound Care.2001;14(6):309‐312.
- ,,.Calciphylaxis.Postgrad Med J.2001;77(911):557‐561.
- Silverberg SG, DeLellis RA, Frable WJ, LiVolsi VA, Wick MR, eds.Silverberg's Principles and Practice of Surgical Pathology and Cytopathology. Vol.1‐2.4th ed.Philadelphia:Elsevier Churchill Livingstone;2006.
- ,,,.Calciphylaxis: medical and surgical management of chronic extensive wounds in a renal dialysis population.Plast Reconstr Surg.2004;113(1):304‐312.
- ,,, et al.Cinacalcet for secondary hyperparathyroidism in patients receiving hemodialysis.N Engl J Med.2004;350(15):1516‐1525.
- ,,.Rapid resolution of calciphylaxis with intravenous sodium thiosulfate and continuous venovenous haemofiltration using low calcium replacement fluid: case report.Nephrol Dial Transplant.2005;20(6):1260‐1262.
- ,,,.Successful treatment of calciphylaxis with intravenous sodium thiosulfate.Am J Kidney Dis.2004;43(6):1104‐1108.
- ,.Intraperitoneal sodium thiosulfate for the treatment of calciphylaxis.Ren Fail.2006;28(4):361‐363.
- ,,,,.Therapy for calciphylaxis: an outcome analysis.Surgery.2003;134(6):941‐944; discussion 944‐945.
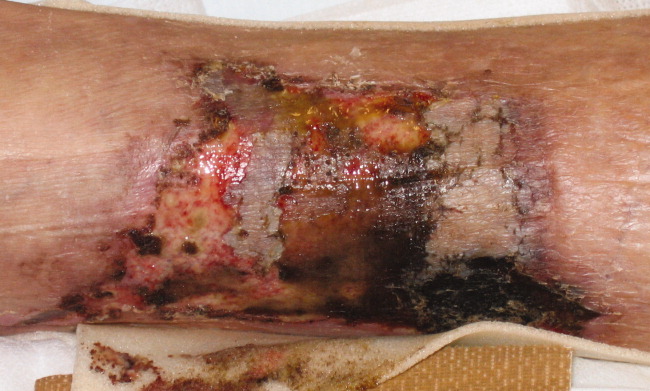
Letter to the Editor
Prado et al.'s1 insightful analysis on a rapid response system failure draws attention to afferent limb system failures of medical emergency teams (METs). The article also serves to highlight several key quality improvement (QI) educational points. The authors demonstrate a thorough grasp of the literature concerning METs. The case description reveals a detailed investigation that is thorough enough to create a timeline of events. I applaud the literature review and construction of a timeline, as these represent the first several steps of a root‐cause analysisbut they are somewhat insufficient. More work can be done here.
Extending their line of inquiry may uncover specific system factors involved in the afferent limb failure. To further the analysis, careful interviews of all involved personnel (including patients, family members, and nurses) may help identify the factors that compromise afferent limbs of METs and thereby make necessary improvements, as in the innovative Josie King Safety Program at Johns Hopkins Hospital (Baltimore, MD). Prado et al.1 are extremely fortunate in that their institution has a monitoring system in place to track MET activations. A more ambitious, though potentially more fruitful project, would be to, examine previous afferent limb failures in an effort to identify systems factors that are more generalizable to other institutions.
The difficulties in obtaining data are 2‐fold: first in gathering the data, and second in extending the data beyond one's own institution. The very nature of QI data, eg, data that are locally obtained and relevant to a particular institution, hinders its generalizability. However, afferent limb failures are real and perhaps ubiquitous.2, 3 The challenge then, is to develop strategies that can improve the functioning of METs (both afferent and efferent limbs) regardless of the institution.
As afferent limbs of METs have been identified as a priority for future attention for the greatest benefit,2, 4 the process of analyzing root‐causes of systems failures seems to be analogous to identifying risk factors for a novel disease. Once identified, the appropriate risk‐factor modifications can be undertaken. Only by careful examination of the data can true, relevant factors be identified. For this reason, I feel that Prado et al.'s1 excellent work should be expanded upon and replicated in other institutions.
Should these types of QI projects become more amenable to extrapolation to other institutions, a predominant reporting format may be needed. The Standards for Quality Improvement Reporting Excellence (SQUIRE) guideline
- ,,,.Rapid response: a quality improvement conundrum.J Hosp Med.2009;4(4):255–257.
- ,,,,.Effects of rapid response systems on clinical outcomes: systematic review and meta‐analysis.J Hosp Med.2007;2(6):422–432.
- ,,, et al.Outreach and early warning systems (EWS) for the prevention of intensive care admission and death of critically ill adult patients on general hospital wards.Cochrane Database Syst Rev2007(3):CD005529.
- ,,, et al.Introduction of the medical emergency team (MET) system: a cluster‐randomised controlled trial.Lancet.2005;365(9477):2091–2097.
- ,.Clinicians in quality improvement: a new career pathway in academic medicine.JAMA.2009;301(7):766–768.
- SGIM. Quality Portfolio Introduction. Available at: http://www.sgim.org/index.cfm?pageId=846. Accessed September2009.
Prado et al.'s1 insightful analysis on a rapid response system failure draws attention to afferent limb system failures of medical emergency teams (METs). The article also serves to highlight several key quality improvement (QI) educational points. The authors demonstrate a thorough grasp of the literature concerning METs. The case description reveals a detailed investigation that is thorough enough to create a timeline of events. I applaud the literature review and construction of a timeline, as these represent the first several steps of a root‐cause analysisbut they are somewhat insufficient. More work can be done here.
Extending their line of inquiry may uncover specific system factors involved in the afferent limb failure. To further the analysis, careful interviews of all involved personnel (including patients, family members, and nurses) may help identify the factors that compromise afferent limbs of METs and thereby make necessary improvements, as in the innovative Josie King Safety Program at Johns Hopkins Hospital (Baltimore, MD). Prado et al.1 are extremely fortunate in that their institution has a monitoring system in place to track MET activations. A more ambitious, though potentially more fruitful project, would be to, examine previous afferent limb failures in an effort to identify systems factors that are more generalizable to other institutions.
The difficulties in obtaining data are 2‐fold: first in gathering the data, and second in extending the data beyond one's own institution. The very nature of QI data, eg, data that are locally obtained and relevant to a particular institution, hinders its generalizability. However, afferent limb failures are real and perhaps ubiquitous.2, 3 The challenge then, is to develop strategies that can improve the functioning of METs (both afferent and efferent limbs) regardless of the institution.
As afferent limbs of METs have been identified as a priority for future attention for the greatest benefit,2, 4 the process of analyzing root‐causes of systems failures seems to be analogous to identifying risk factors for a novel disease. Once identified, the appropriate risk‐factor modifications can be undertaken. Only by careful examination of the data can true, relevant factors be identified. For this reason, I feel that Prado et al.'s1 excellent work should be expanded upon and replicated in other institutions.
Should these types of QI projects become more amenable to extrapolation to other institutions, a predominant reporting format may be needed. The Standards for Quality Improvement Reporting Excellence (SQUIRE) guideline
- ,,,.Rapid response: a quality improvement conundrum.J Hosp Med.2009;4(4):255–257.
- ,,,,.Effects of rapid response systems on clinical outcomes: systematic review and meta‐analysis.J Hosp Med.2007;2(6):422–432.
- ,,, et al.Outreach and early warning systems (EWS) for the prevention of intensive care admission and death of critically ill adult patients on general hospital wards.Cochrane Database Syst Rev2007(3):CD005529.
- ,,, et al.Introduction of the medical emergency team (MET) system: a cluster‐randomised controlled trial.Lancet.2005;365(9477):2091–2097.
- ,.Clinicians in quality improvement: a new career pathway in academic medicine.JAMA.2009;301(7):766–768.
- SGIM. Quality Portfolio Introduction. Available at: http://www.sgim.org/index.cfm?pageId=846. Accessed September2009.