User login
Transitions of Care with Incidental Pulmonary Nodules
With advancement in imaging techniques, incidental pulmonary nodules (IPNs) are routinely found on imaging studies. Depending on the size, an IPN has diagnostic uncertainty. Is it a benign finding? Will it progress to cancer? These questions have the potential to create anxiety for our patients. Between 2012 and 2014, 19,739 patients were discharged from hospitals in the United States with a diagnosis of a solitary pulmonary nodule.1 Roughly 7,500 were discharged after an inpatient stay; the remainder from the emergency room. Aggregate costs for these visits totaled $49 million. The exact number of nodules receiving follow-up is unknown.
The Fleischner guidelines, updated in 2017, outline management for IPNs.2 Depending on nodule size and patient risk factors, repeat imaging is either not indicated or one to two follow-up scans could be recommended. In this issue of the Journal of Hospital Medicine®, two reports assess provider awareness of the Fleischner guidelines and examine the proportion of patients receiving follow-up.
Umscheid et al. surveyed hospitalists to understand their approach IPN management. Of 174 respondents, 42% were unfamiliar with the Fleischner guidelines.3 The authors proposed methods for improving provider awareness, including better communication between hospitalists and primary care providers, better documentation, and in the case of their institution, the development of an IPN consult team. The IPN consult team is composed of a nurse practitioner and pulmonologist. They inform primary care providers of patient findings and need for follow-up. If no follow-up is made, the team will see the patients in an IPN ambulatory clinic to ensure follow-up imaging is obtained.
Kwan et al. found that fewer than 50% of patients with high-risk new pulmonary nodules received follow-up.4 Although a single-site study, the study is consistent with prior work on tests pending at discharge, which essentially show that there are poor follow-up rates.5,6 Follow-up was more likely when the IPN was mentioned in the discharge summary. This conclusion builds on previous work showing that IPNs are more likely to be included in a discharge summary if the nodule is noted in the report heading, the radiologist recommends further imaging, and the patient is discharged from a medicine service as opposed to a surgical service.7 IPN follow-up is less likely if results are mentioned in the findings section alone.5
IPN follow-up is a piece of a larger issue of how best to ensure appropriate follow-up of any tests pending after discharge. A systematic review of discharge interventions found improvement in follow-up when discharge summaries are combined with e-mail alerts.6 A study of the effects of integrated electronic health records (EHR) web modules with discharge specific instructions showed an increase in follow-up from 18% to 27%.8 Studies also consider provider-to-patient communication. One intervention uses the patient portal to remind patients to pick up their medications,9 finding a decrease in nonadherence from 65.5% to 22.2%. Engaging patients by way of patient portals and reminders are an effective way to hold both the physician and the patient accountable for follow-up. Mobile technologies studied in the emergency department show patient preferences toward texting to receive medication and appointment reminders.10 Given wide-spread adoption of mobile technologies,11 notification systems could leverage applications or texting modalities to keep patients informed of discharge appointments and follow-up imaging studies. Similar interventions could be designed for IPNs using the Fleischner guidelines, generating alerts when patients have not received follow-up imaging.
The number of IPNs identified in the hospital will likely remain in the tens of thousands. From the hospitalist perspective, the findings presented in this month’s Journal of Hospital Medicine suggest that patients be educated about their findings and recommended follow-up, that follow-up be arranged before discharge, and that findings are clearly documented for patients and primary care providers to review. More study into how to implement these enhancements is needed to guide how we focus educational, systems, and technological interventions. Further study is also needed to help understand the complexities of communication channels between hospitalists and primary care physicians. As hospitalist workflow is more integrated with the EHR and mobile technology, future interventions can facilitate follow-up, keeping all providers and, most importantly, the patient aware of the next steps in care.
Acknowledgments
Author support is provided by the South Texas Veterans Health Care System. The views expressed are those of the authors and do not reflect the position or policy of the Department of Veterans Affairs.
Disclosures
The authors report no financial conflicts of interest.
1. HCUPNet: A tool for identifying, tracking and analyzing national hospital statistics (2018). Retrieved from https://hcupnet.ahrq.gov/#setup on 10/25/2019
2. MacMahon H, Naidich DP, Goo JM, et al. Guidelines for management of incidental pulmonary nodules detected on CT Images: from the Fleischner Society 2017. Radiology. 2017;284(1):228-243. doi: 10.1148/radiol.2017161659. PubMed
3. Umscheid CA, Wilen J, Garin M, et al. National Survey of Hospitalists’ experiences with incidental pulmonary nodules. J Hosp Med. 2019;14(6):353-356. doi: 10.12788/jhm.3115. PubMed
4. Kwan JL, Yermak D, Markell L, Paul NS, Shojania KG, Cram P. Follow-up of incidental high-risk pulmonary nodules on computed tomography pulmonary angiography at care transitions. J Hosp Med. 2019;14(6):349-352. doi: 10.12788/jhm.3128. PubMed
5. Blagev DP, Lloyd JF, Conner K, et al. Follow-up of incidental pulmonary nodules and the radiology report. J Am Coll Radiol. 2014;11(4):378-383. doi: 10.1016/j.jacr.2013.08.003. PubMed
7. Darragh PJ, Bodley T, Orchanian-cheff A, Shojania KG, Kwan JL, Cram P. A systematic review of interventions to follow-up test results pending at discharge. J Gen Intern Med. 2018;33(5):750-758. doi: 10.1007/s11606-017-4290-9. PubMed
8. Bates R, Plooster C, Croghan I, Schroeder D, Mccoy C. Incidental pulmonary nodules reported on CT abdominal imaging: frequency and factors affecting inclusion in the hospital discharge summary. J Hosp Med. 2017;12(6):454-457. doi: 10.12788/jhm.2757. PubMed
9. Lacson R, Desai S, Landman A, Proctor R, Sumption S, Khorasani R. Impact of a health information technology intervention on the follow-up management of pulmonary nodules. J Digit Imaging. 2018;31(1):19-25. doi: 10.1007/s10278-017-9989-y. PubMed
10. Kerner DE, Knezevich EL. Use of communication tool within electronic medical record to improve primary nonadherence. J Am Pharm Assoc (2003). 2017;57(3S):S270-S273.e2. doi: 10.1016/j.japh.2017.03.009. PubMed
11. Ray M, Dayan PS, Pahalyants V, Chernick LS. Mobile health technology to communicate discharge and follow-up information to adolescents from the emergency department. Pediatr Emerg Care. 2016;32(12):900-905. doi: 10.1097/PEC.0000000000000970. PubMed
12. Gallagher R, Roach K, Sadler L, et al. Mobile technology use across age groups in patients eligible for cardiac rehabilitation: survey study. JMIR mHealth uhealth. 2017;5(10):e161. doi: 10.2196/mhealth.8352. PubMed
With advancement in imaging techniques, incidental pulmonary nodules (IPNs) are routinely found on imaging studies. Depending on the size, an IPN has diagnostic uncertainty. Is it a benign finding? Will it progress to cancer? These questions have the potential to create anxiety for our patients. Between 2012 and 2014, 19,739 patients were discharged from hospitals in the United States with a diagnosis of a solitary pulmonary nodule.1 Roughly 7,500 were discharged after an inpatient stay; the remainder from the emergency room. Aggregate costs for these visits totaled $49 million. The exact number of nodules receiving follow-up is unknown.
The Fleischner guidelines, updated in 2017, outline management for IPNs.2 Depending on nodule size and patient risk factors, repeat imaging is either not indicated or one to two follow-up scans could be recommended. In this issue of the Journal of Hospital Medicine®, two reports assess provider awareness of the Fleischner guidelines and examine the proportion of patients receiving follow-up.
Umscheid et al. surveyed hospitalists to understand their approach IPN management. Of 174 respondents, 42% were unfamiliar with the Fleischner guidelines.3 The authors proposed methods for improving provider awareness, including better communication between hospitalists and primary care providers, better documentation, and in the case of their institution, the development of an IPN consult team. The IPN consult team is composed of a nurse practitioner and pulmonologist. They inform primary care providers of patient findings and need for follow-up. If no follow-up is made, the team will see the patients in an IPN ambulatory clinic to ensure follow-up imaging is obtained.
Kwan et al. found that fewer than 50% of patients with high-risk new pulmonary nodules received follow-up.4 Although a single-site study, the study is consistent with prior work on tests pending at discharge, which essentially show that there are poor follow-up rates.5,6 Follow-up was more likely when the IPN was mentioned in the discharge summary. This conclusion builds on previous work showing that IPNs are more likely to be included in a discharge summary if the nodule is noted in the report heading, the radiologist recommends further imaging, and the patient is discharged from a medicine service as opposed to a surgical service.7 IPN follow-up is less likely if results are mentioned in the findings section alone.5
IPN follow-up is a piece of a larger issue of how best to ensure appropriate follow-up of any tests pending after discharge. A systematic review of discharge interventions found improvement in follow-up when discharge summaries are combined with e-mail alerts.6 A study of the effects of integrated electronic health records (EHR) web modules with discharge specific instructions showed an increase in follow-up from 18% to 27%.8 Studies also consider provider-to-patient communication. One intervention uses the patient portal to remind patients to pick up their medications,9 finding a decrease in nonadherence from 65.5% to 22.2%. Engaging patients by way of patient portals and reminders are an effective way to hold both the physician and the patient accountable for follow-up. Mobile technologies studied in the emergency department show patient preferences toward texting to receive medication and appointment reminders.10 Given wide-spread adoption of mobile technologies,11 notification systems could leverage applications or texting modalities to keep patients informed of discharge appointments and follow-up imaging studies. Similar interventions could be designed for IPNs using the Fleischner guidelines, generating alerts when patients have not received follow-up imaging.
The number of IPNs identified in the hospital will likely remain in the tens of thousands. From the hospitalist perspective, the findings presented in this month’s Journal of Hospital Medicine suggest that patients be educated about their findings and recommended follow-up, that follow-up be arranged before discharge, and that findings are clearly documented for patients and primary care providers to review. More study into how to implement these enhancements is needed to guide how we focus educational, systems, and technological interventions. Further study is also needed to help understand the complexities of communication channels between hospitalists and primary care physicians. As hospitalist workflow is more integrated with the EHR and mobile technology, future interventions can facilitate follow-up, keeping all providers and, most importantly, the patient aware of the next steps in care.
Acknowledgments
Author support is provided by the South Texas Veterans Health Care System. The views expressed are those of the authors and do not reflect the position or policy of the Department of Veterans Affairs.
Disclosures
The authors report no financial conflicts of interest.
1. HCUPNet: A tool for identifying, tracking and analyzing national hospital statistics (2018). Retrieved from https://hcupnet.ahrq.gov/#setup on 10/25/2019
2. MacMahon H, Naidich DP, Goo JM, et al. Guidelines for management of incidental pulmonary nodules detected on CT Images: from the Fleischner Society 2017. Radiology. 2017;284(1):228-243. doi: 10.1148/radiol.2017161659. PubMed
3. Umscheid CA, Wilen J, Garin M, et al. National Survey of Hospitalists’ experiences with incidental pulmonary nodules. J Hosp Med. 2019;14(6):353-356. doi: 10.12788/jhm.3115. PubMed
4. Kwan JL, Yermak D, Markell L, Paul NS, Shojania KG, Cram P. Follow-up of incidental high-risk pulmonary nodules on computed tomography pulmonary angiography at care transitions. J Hosp Med. 2019;14(6):349-352. doi: 10.12788/jhm.3128. PubMed
5. Blagev DP, Lloyd JF, Conner K, et al. Follow-up of incidental pulmonary nodules and the radiology report. J Am Coll Radiol. 2014;11(4):378-383. doi: 10.1016/j.jacr.2013.08.003. PubMed
7. Darragh PJ, Bodley T, Orchanian-cheff A, Shojania KG, Kwan JL, Cram P. A systematic review of interventions to follow-up test results pending at discharge. J Gen Intern Med. 2018;33(5):750-758. doi: 10.1007/s11606-017-4290-9. PubMed
8. Bates R, Plooster C, Croghan I, Schroeder D, Mccoy C. Incidental pulmonary nodules reported on CT abdominal imaging: frequency and factors affecting inclusion in the hospital discharge summary. J Hosp Med. 2017;12(6):454-457. doi: 10.12788/jhm.2757. PubMed
9. Lacson R, Desai S, Landman A, Proctor R, Sumption S, Khorasani R. Impact of a health information technology intervention on the follow-up management of pulmonary nodules. J Digit Imaging. 2018;31(1):19-25. doi: 10.1007/s10278-017-9989-y. PubMed
10. Kerner DE, Knezevich EL. Use of communication tool within electronic medical record to improve primary nonadherence. J Am Pharm Assoc (2003). 2017;57(3S):S270-S273.e2. doi: 10.1016/j.japh.2017.03.009. PubMed
11. Ray M, Dayan PS, Pahalyants V, Chernick LS. Mobile health technology to communicate discharge and follow-up information to adolescents from the emergency department. Pediatr Emerg Care. 2016;32(12):900-905. doi: 10.1097/PEC.0000000000000970. PubMed
12. Gallagher R, Roach K, Sadler L, et al. Mobile technology use across age groups in patients eligible for cardiac rehabilitation: survey study. JMIR mHealth uhealth. 2017;5(10):e161. doi: 10.2196/mhealth.8352. PubMed
© 2019 Society of Hospital Medicine
Who Consults Us and Why? An Evaluation of Medicine Consult/Comanagement Services at Academic Medical Centers
The role of internists in consultation has considerably expanded over the past half century. Consulting general internists increasingly work across disciplines to coordinate complex care.1,2 Some internists assume a “comanagement” role with surgical specialties. This role requires sharing responsibility and accountability and involvement in admission/discharge processes.3-6 Internal medicine (IM) residents are required to serve as consultants.7 Yet, aside from observations collected 30 to 40 years ago, limited information is available for guiding educators in developing consultative curricula.2,8-10 We sought to assess current consultative practices across a sample of IM training programs. Specifically, we examined which services consult IM and their reasons for consultation (RFCs).
METHODS
We collected data on consultation requests at 11 US academic medical centers (AMCs). We applied a selective sampling approach that leveraged existing relationships and interest in consultative medicine to identify institutions across a variety of geographic locations. We collected data regarding the consult service structure at each site, including data on the presence or absence of comanagement services and consult requests received.
Data Collection Tool
Investigators at the University of Texas Health San Antonio (UTHSA) drafted the data collection tool. Iterative feedback on the data collection tool was obtained from the research consortium (final tool, Supplemental Figure). Data collected included service requesting consultation, RFC, time request was made (day/night), who first saw the patient (eg, resident, attending), whether requesting and consulting providers verbally communicated, and whether patients were transferred to medicine. Respondents also estimated how often RFCs were encountered during their general medicine services.
To streamline data collection, we used click boxes and drop-down lists that included diagnoses and symptoms. The use of these predetermined RFCs was based on prior studies and discussion with the research consortium on common RFCs in clinical practice. A write-in field was also included. Respondents could select multiple RFCs in the case of multiple questions. Respondents also provided data regarding clinical issues that were incidentally identified during their initial patient assessments. Incidentally identified issues are hereafter called “additional RFCs” for differentiation from stated RFCs. Prior to data collection, the tool was piloted at UTHSA.
Data Collection, Categorization, and Analysis
Participants submitted data using Survey Monkey (Palo Alto, California). Emails with the survey link were sent daily. Specific participants for each data collection period were chosen by each site. Days with no data entry were confirmed by the study coordinator. Each institution collected data for four 2-week periods from July 2014 to July 2015 for a total of 8 weeks. We did not track follow-up encounters. Repeat consultations for different reasons were considered new consults.
All survey responses and free-text RFC entries were independently reviewed and categorized by 2 authors (E.W. and M.S.). New categories were created if needed. If reviewers disagreed, a third reviewer (C.M.) reviewed the RFC. The research consortium reviewed the final list of categories and entries.
We calculated descriptive statistics using SAS version 9.3 (SAS Institute, Inc., Cary, North Carolina). Each analysis used complete responses for each survey component. We separately analyzed services with and without comanagement components. The study was approved by UTHSA’s Institutional Review Board.
RESULTS
A total of 11 AMCs that represent 9 academic affiliations participated in this study (Table 1). Of the 11 AMCs, 7 were public nonprofit, 3 were private nonprofit, and 1 was a Veterans Health Administration facility. Out of the 11 AMCs, 9 sites included residents on the consult service, and the rotation was required at 6 of the sites. Most sites with residents had a formal curriculum that ranged from curated articles to online modules. Out of the 11 services, 4 were consult and comanagement services. All 4 co-managed orthopedic patients, and 1 also included other patients.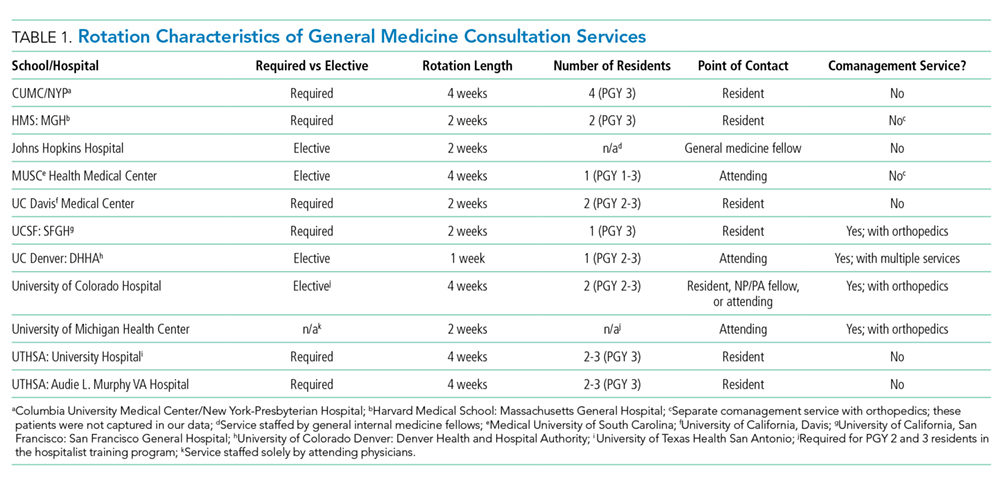
Data for 1,264 patient encounters with 2,778 RFCs were collected. A total of 1,218 of the surveys (96.4%) were fully completed, and only 5 surveys were missing data for multiple questions. A total of 7 sites adhered to the planned protocol. Among the sites, 1 site had 1 incomplete collection period, 1 site missed 1 collection period, and 1 site missed 2 collection periods.
Most consultations (87.1%) were requested during the day. Many patients (55.9%) were initially seen by residents, and 32.4% of the patients were initially seen by an attending. Respondents reported communicating verbally with the requesting team in 93.9% of instances. Among the patients, 7.8% were transferred to medicine following initial consultation. This percentage was higher (10.2%) in services without comanagement.
The average number of new consults per day per site was 2.24. The range for individual sites was 1.36-3.48. The maximum number of new consults in 1 day was 10. All sites had at least 1 day without new consults. The mean number of RFCs per encounter was 2.20 (median 2, range 1-13). In 226 of 360 encounters in which comanagement was an RFC, the respondent enumerated the other specific RFCs addressed. In these encounters, the mean number of RFCs (in addition to comanagement) was 3.02.
Most requests (82.2%) originated from surgical services. Among all surgical services, orthopedic surgery requested the highest number of consultations (67.5% for services with a comanagement component; 28.5% for services without) and 81.2% of the 360 comanagement encounters. Refer to Supplemental Table 1 for detailed information on the services that requested consultation.
The most common RFC was comanagement (13.0% across the entire study; 23.3% for services with a comanagement component; Table 2). For services without comanagement, preoperative evaluation was the most common RFC (16.4%). Other frequent RFCs across the entire study included blood pressure management (8.9%), glycemic management (7.2%), and renal failure (3.9%). Additional (unstated) RFCs were addressed in 944 patients (34.0%), and blood pressure management was the most common additional RFC.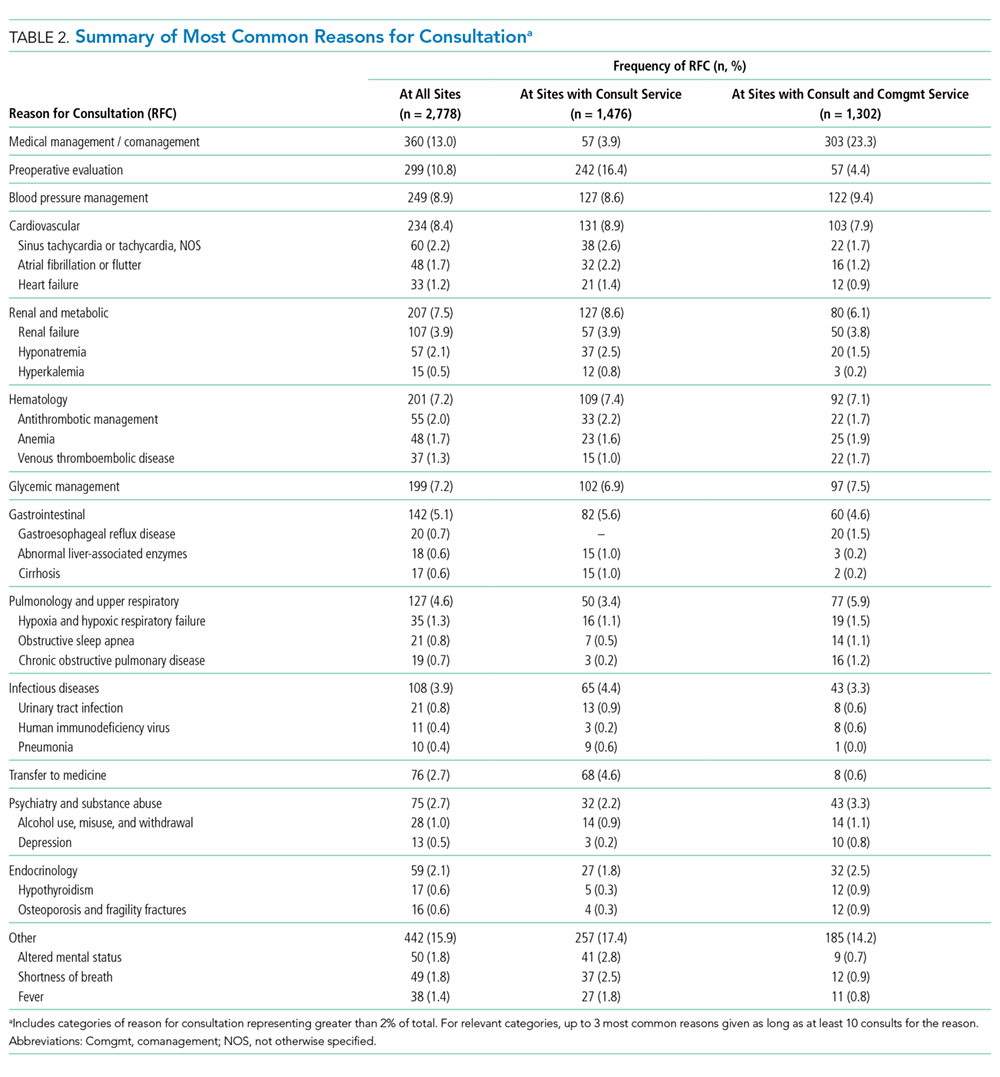
Respondents indicated that 54.9% of RFCs were clinical topics that are “often” or “always” encountered in IM inpatient services. In 11.8% of encounters, the RFC was “rarely” or “never” encountered; the most common RFCs in such encounters were comanagement (53.4%), preoperative evaluation (17.4%), and transfer to medicine (5.4%).
DISCUSSION
Our study provides insights into the consultative landscape of AMCs and identified who consults IMs and their RFCs. Thus, our study has implications for resident consultative education. The consult services included in our study presented varied structures, including those that require medicine consultation as a resident rotation and those with comanagement agreements. Consistent with the results of prior studies, surgical services requested the majority of consults, with orthopedic surgery generating the highest number of requests. Consultation requests from neurosurgery were higher than previously reported.2,8,9
Our study reveals that comanagement and preoperative evaluation are the most common RFCs and are the least commonly encountered RFCs in IM inpatient services. The broad nature of these RFCs speaks to an increasing need for comprehensive consultative care. Consultants addressed a wide range of clinical issues, including rare entities that defy easy categorization (eg, Moyamoya disease). This broad landscape presents challenges in focusing curricular content areas outside of comanagement and preoperative evaluation but does provide evidence “to expect the unexpected” in IM consultation, as has been previously noted.8
In over a third of encounters, consultants addressed an issue that was not stated in the initial RFC. Consultants also addressed more than 2 RFCs per encounter. These observations suggest that medicine consult services may be essentially comanaging some patients even when a comanagement care model is not formally in place. These findings provide rationale for the continued expansion of comanagement services.11
Our study provides further evidence that, in modern consultative practice, “determining your customer” is more important than “determining the question.”12-14 We work in an era in which comanagement services are increasingly prevalent but are not ubiquitous and in which IM consultants routinely address multiple issues. Prior studies indicated that most surgeons do not believe that consults should be limited to specific questions and instead prefer comanagement.13 Understanding the expectations of the requesting physician is therefore important and highlights the importance of verbal communication at the time of initial consultation. Ongoing interprofessional communication is a vital skill that residents should acquire.
Our study has several limitations. Although our sites represented a varied sample, we focused on AMCs. Therefore, our study may not reflect consultative experiences in nonacademic hospitals or sites without dedicated consult services. Trade-offs exist in our data collection approach, which provided predetermined RFCs. We selected our methodology to facilitate data entry and to aid RFC categorization. Nevertheless, it may have lessened the clinical nuance of submitted data. The provision of predetermined RFCs may have influenced issue selection by the respondents. However, in 473 encounters (37.4%), the survey respondents provided free-text entries for the stated RFC, and 944 additional RFCs were written in as responses. These results demonstrated that respondents did not limit themselves to the predetermined list. We did not perform chart reviews to validate data. Finally, our data were a cross-section of initial consultations. We lack information on subsequent diagnoses or additional clinical issues that developed later.
In conclusion, we found varied consultative experiences across AMCs. However, preoperative evaluation and perioperative comanagement – particularly of orthopedic and neurosurgical patients – were common and should be included in curricula. Faculty should recognize the unique nature of IM consultation to prepare residents. Specifically, faculty should prepare residents to expect to identify and address unstated medical issues and to provide comprehensive assessments regardless of whether the consultative structure has a comanagement component. Given the unique nature of consultative IM work and the possibility of discordant expectations between consulting and requesting physicians, perhaps the most valuable skill to impart to residents is effective and regular communication.
Medicine Consult/Comanagement Consortium Members
The Medicine Consult/Comanagement Consortium consists of: Mary Anderson Wallace, MD, Brian Wolfe, MD (University of Colorado), Meridale Baggett, MD, Douglas Wright, MD, PhD (Harvard University), Joyeeta G. Dastidar MD, Maureen Kelly, MD (Columbia University), Leonard S. Feldman, MD (Johns Hopkins University), Cecily J. Gallup, MD, MPH (University of California, San Francisco), Paul J. Grant, MD (University of Michigan), Craig R. Keenan, MD (University of California, Davis), Fletcher Penney, MD (Medical University of South Carolina).
Acknowledgments
The authors thank the clinicians at each site who were involved in data collection for this study, including Barbara Statland, MD. The authors also thank Timothy Niessen, MD for data and physician coordination and Musarrat Nahid, MSc. for statistical analysis.
Disclosures
Paul J. Grant receives royalties from the medical textbook Perioperative Medicine: Medical Consultation and Comanagement, Wiley Publishing 2012. Craig R. Keenan receives medicolegal consultation fees from Weiss-Salinas Law Group and American Psychiatric Association Publishers for book royalties. All other authors declare that they do not have any conflicts of interest.
Funding Information
The research reported here was supported by the Department of Veterans Affairs, Veterans Health Administration. Investigator salary support is provided through the South Texas Veterans Health Care System. The views expressed in this article are those of the authors and do not necessarily reflect the position or policy of the Department of Veterans Affairs or our institutions.
1. Hollenberg CH, Langley GR. The Canadian general internist: education and future role. CMAJ. 1978;118(4):397-400. PubMed
2. Charlson ME, Cohen RP, Sears CL. General medicine consultation: lessons from a clinical service. Am J Med. 1983;75(1):121-128. https://doi.org/10.1016/0002-9343(83)91175-0. PubMed
3. Society of Hospital Medicine. The evolution of co-management in hospital medicine. http://www.hospitalmedicine.org/Web/Practice_Management/CoManagement.aspx. Accessed March 8, 2018.
4. Auerbach AD, Wachter RM, Cheng HQ, et al. Comanagement of surgical patients between neurosurgeons and hospitalists. Arch Intern Med. 2010;170(22):2004-2010. 10.1001/archinternmed.2010.432. PubMed
5. Sharma G, Kuo YF, Freeman J, Zhang DD, Goodwin JS. Comanagement of hospitalized surgical patients by medicine physicians in the United States. Arch Intern Med. 2010;170(4):363-368. 10.1001/archinternmed.2009.553. PubMed
6. Thompson RE, Pfeifer K, Grant PJ, et al. Hospital medicine and perioperative care: a framework for high-quality, high-value collaborative care. J Hosp Med. 2017;12(4):277-282. 10.12788/jhm.2717. PubMed
7. Accreditation Council for Graduate Medical Education. Common Program Requirements. https://www.acgme.org/Portals/0/PFAssets/ProgramRequirements/140_internal_medicine_2017-07-01.pdf. Accessed March 8, 2018.
8. Moore RA, Kammerer WS, McGlynn TJ, Trautlein JJ, Burnside JW. Consultations in internal medicine: a training program resource. J Med Educ. 1977;52(4):323-327. PubMed
9. Robie PW. The service and educational contributions of a general medicine consultation service. J Gen Intern Med. 1986;1(4):225-227. https://doi.org/10.1007/BF02596187. PubMed
10. Devor M, Renvall M, Ramsdell J. Practice patterns and the adequacy of residency training in consultation medicine. J Gen Intern Med. 1993;8(10):554-560. 10.1007/BF02599639. PubMed
11. Siegal EM. Just because you can, doesn’t mean that you should: a call for the rational application of hospitalist comanagement. J Hosp Med. 2008;3(5):398-402. 10.1002/jhm.361. PubMed
12. Goldman L, Lee T, Rudd P. Ten commandments for effective consultations. Arch Intern Med. 1983;143(9):1753-1755. 10.1001/archinte.1983.00350090131022. PubMed
13. Salerno SM. Principles of effective consultation: an update for the 21st-century consultant. Arch Intern Med. 2007;167:271-275. 10.1001/archinte.167.3.271. PubMed
14. Merli GJ, Weitz HH. Medical management of the surgical patient E-Book. Elsevier Health Sciences; 2008. PubMed
The role of internists in consultation has considerably expanded over the past half century. Consulting general internists increasingly work across disciplines to coordinate complex care.1,2 Some internists assume a “comanagement” role with surgical specialties. This role requires sharing responsibility and accountability and involvement in admission/discharge processes.3-6 Internal medicine (IM) residents are required to serve as consultants.7 Yet, aside from observations collected 30 to 40 years ago, limited information is available for guiding educators in developing consultative curricula.2,8-10 We sought to assess current consultative practices across a sample of IM training programs. Specifically, we examined which services consult IM and their reasons for consultation (RFCs).
METHODS
We collected data on consultation requests at 11 US academic medical centers (AMCs). We applied a selective sampling approach that leveraged existing relationships and interest in consultative medicine to identify institutions across a variety of geographic locations. We collected data regarding the consult service structure at each site, including data on the presence or absence of comanagement services and consult requests received.
Data Collection Tool
Investigators at the University of Texas Health San Antonio (UTHSA) drafted the data collection tool. Iterative feedback on the data collection tool was obtained from the research consortium (final tool, Supplemental Figure). Data collected included service requesting consultation, RFC, time request was made (day/night), who first saw the patient (eg, resident, attending), whether requesting and consulting providers verbally communicated, and whether patients were transferred to medicine. Respondents also estimated how often RFCs were encountered during their general medicine services.
To streamline data collection, we used click boxes and drop-down lists that included diagnoses and symptoms. The use of these predetermined RFCs was based on prior studies and discussion with the research consortium on common RFCs in clinical practice. A write-in field was also included. Respondents could select multiple RFCs in the case of multiple questions. Respondents also provided data regarding clinical issues that were incidentally identified during their initial patient assessments. Incidentally identified issues are hereafter called “additional RFCs” for differentiation from stated RFCs. Prior to data collection, the tool was piloted at UTHSA.
Data Collection, Categorization, and Analysis
Participants submitted data using Survey Monkey (Palo Alto, California). Emails with the survey link were sent daily. Specific participants for each data collection period were chosen by each site. Days with no data entry were confirmed by the study coordinator. Each institution collected data for four 2-week periods from July 2014 to July 2015 for a total of 8 weeks. We did not track follow-up encounters. Repeat consultations for different reasons were considered new consults.
All survey responses and free-text RFC entries were independently reviewed and categorized by 2 authors (E.W. and M.S.). New categories were created if needed. If reviewers disagreed, a third reviewer (C.M.) reviewed the RFC. The research consortium reviewed the final list of categories and entries.
We calculated descriptive statistics using SAS version 9.3 (SAS Institute, Inc., Cary, North Carolina). Each analysis used complete responses for each survey component. We separately analyzed services with and without comanagement components. The study was approved by UTHSA’s Institutional Review Board.
RESULTS
A total of 11 AMCs that represent 9 academic affiliations participated in this study (Table 1). Of the 11 AMCs, 7 were public nonprofit, 3 were private nonprofit, and 1 was a Veterans Health Administration facility. Out of the 11 AMCs, 9 sites included residents on the consult service, and the rotation was required at 6 of the sites. Most sites with residents had a formal curriculum that ranged from curated articles to online modules. Out of the 11 services, 4 were consult and comanagement services. All 4 co-managed orthopedic patients, and 1 also included other patients.
Data for 1,264 patient encounters with 2,778 RFCs were collected. A total of 1,218 of the surveys (96.4%) were fully completed, and only 5 surveys were missing data for multiple questions. A total of 7 sites adhered to the planned protocol. Among the sites, 1 site had 1 incomplete collection period, 1 site missed 1 collection period, and 1 site missed 2 collection periods.
Most consultations (87.1%) were requested during the day. Many patients (55.9%) were initially seen by residents, and 32.4% of the patients were initially seen by an attending. Respondents reported communicating verbally with the requesting team in 93.9% of instances. Among the patients, 7.8% were transferred to medicine following initial consultation. This percentage was higher (10.2%) in services without comanagement.
The average number of new consults per day per site was 2.24. The range for individual sites was 1.36-3.48. The maximum number of new consults in 1 day was 10. All sites had at least 1 day without new consults. The mean number of RFCs per encounter was 2.20 (median 2, range 1-13). In 226 of 360 encounters in which comanagement was an RFC, the respondent enumerated the other specific RFCs addressed. In these encounters, the mean number of RFCs (in addition to comanagement) was 3.02.
Most requests (82.2%) originated from surgical services. Among all surgical services, orthopedic surgery requested the highest number of consultations (67.5% for services with a comanagement component; 28.5% for services without) and 81.2% of the 360 comanagement encounters. Refer to Supplemental Table 1 for detailed information on the services that requested consultation.
The most common RFC was comanagement (13.0% across the entire study; 23.3% for services with a comanagement component; Table 2). For services without comanagement, preoperative evaluation was the most common RFC (16.4%). Other frequent RFCs across the entire study included blood pressure management (8.9%), glycemic management (7.2%), and renal failure (3.9%). Additional (unstated) RFCs were addressed in 944 patients (34.0%), and blood pressure management was the most common additional RFC.
Respondents indicated that 54.9% of RFCs were clinical topics that are “often” or “always” encountered in IM inpatient services. In 11.8% of encounters, the RFC was “rarely” or “never” encountered; the most common RFCs in such encounters were comanagement (53.4%), preoperative evaluation (17.4%), and transfer to medicine (5.4%).
DISCUSSION
Our study provides insights into the consultative landscape of AMCs and identified who consults IMs and their RFCs. Thus, our study has implications for resident consultative education. The consult services included in our study presented varied structures, including those that require medicine consultation as a resident rotation and those with comanagement agreements. Consistent with the results of prior studies, surgical services requested the majority of consults, with orthopedic surgery generating the highest number of requests. Consultation requests from neurosurgery were higher than previously reported.2,8,9
Our study reveals that comanagement and preoperative evaluation are the most common RFCs and are the least commonly encountered RFCs in IM inpatient services. The broad nature of these RFCs speaks to an increasing need for comprehensive consultative care. Consultants addressed a wide range of clinical issues, including rare entities that defy easy categorization (eg, Moyamoya disease). This broad landscape presents challenges in focusing curricular content areas outside of comanagement and preoperative evaluation but does provide evidence “to expect the unexpected” in IM consultation, as has been previously noted.8
In over a third of encounters, consultants addressed an issue that was not stated in the initial RFC. Consultants also addressed more than 2 RFCs per encounter. These observations suggest that medicine consult services may be essentially comanaging some patients even when a comanagement care model is not formally in place. These findings provide rationale for the continued expansion of comanagement services.11
Our study provides further evidence that, in modern consultative practice, “determining your customer” is more important than “determining the question.”12-14 We work in an era in which comanagement services are increasingly prevalent but are not ubiquitous and in which IM consultants routinely address multiple issues. Prior studies indicated that most surgeons do not believe that consults should be limited to specific questions and instead prefer comanagement.13 Understanding the expectations of the requesting physician is therefore important and highlights the importance of verbal communication at the time of initial consultation. Ongoing interprofessional communication is a vital skill that residents should acquire.
Our study has several limitations. Although our sites represented a varied sample, we focused on AMCs. Therefore, our study may not reflect consultative experiences in nonacademic hospitals or sites without dedicated consult services. Trade-offs exist in our data collection approach, which provided predetermined RFCs. We selected our methodology to facilitate data entry and to aid RFC categorization. Nevertheless, it may have lessened the clinical nuance of submitted data. The provision of predetermined RFCs may have influenced issue selection by the respondents. However, in 473 encounters (37.4%), the survey respondents provided free-text entries for the stated RFC, and 944 additional RFCs were written in as responses. These results demonstrated that respondents did not limit themselves to the predetermined list. We did not perform chart reviews to validate data. Finally, our data were a cross-section of initial consultations. We lack information on subsequent diagnoses or additional clinical issues that developed later.
In conclusion, we found varied consultative experiences across AMCs. However, preoperative evaluation and perioperative comanagement – particularly of orthopedic and neurosurgical patients – were common and should be included in curricula. Faculty should recognize the unique nature of IM consultation to prepare residents. Specifically, faculty should prepare residents to expect to identify and address unstated medical issues and to provide comprehensive assessments regardless of whether the consultative structure has a comanagement component. Given the unique nature of consultative IM work and the possibility of discordant expectations between consulting and requesting physicians, perhaps the most valuable skill to impart to residents is effective and regular communication.
Medicine Consult/Comanagement Consortium Members
The Medicine Consult/Comanagement Consortium consists of: Mary Anderson Wallace, MD, Brian Wolfe, MD (University of Colorado), Meridale Baggett, MD, Douglas Wright, MD, PhD (Harvard University), Joyeeta G. Dastidar MD, Maureen Kelly, MD (Columbia University), Leonard S. Feldman, MD (Johns Hopkins University), Cecily J. Gallup, MD, MPH (University of California, San Francisco), Paul J. Grant, MD (University of Michigan), Craig R. Keenan, MD (University of California, Davis), Fletcher Penney, MD (Medical University of South Carolina).
Acknowledgments
The authors thank the clinicians at each site who were involved in data collection for this study, including Barbara Statland, MD. The authors also thank Timothy Niessen, MD for data and physician coordination and Musarrat Nahid, MSc. for statistical analysis.
Disclosures
Paul J. Grant receives royalties from the medical textbook Perioperative Medicine: Medical Consultation and Comanagement, Wiley Publishing 2012. Craig R. Keenan receives medicolegal consultation fees from Weiss-Salinas Law Group and American Psychiatric Association Publishers for book royalties. All other authors declare that they do not have any conflicts of interest.
Funding Information
The research reported here was supported by the Department of Veterans Affairs, Veterans Health Administration. Investigator salary support is provided through the South Texas Veterans Health Care System. The views expressed in this article are those of the authors and do not necessarily reflect the position or policy of the Department of Veterans Affairs or our institutions.
1. Hollenberg CH, Langley GR. The Canadian general internist: education and future role. CMAJ. 1978;118(4):397-400. PubMed
2. Charlson ME, Cohen RP, Sears CL. General medicine consultation: lessons from a clinical service. Am J Med. 1983;75(1):121-128. https://doi.org/10.1016/0002-9343(83)91175-0. PubMed
3. Society of Hospital Medicine. The evolution of co-management in hospital medicine. http://www.hospitalmedicine.org/Web/Practice_Management/CoManagement.aspx. Accessed March 8, 2018.
4. Auerbach AD, Wachter RM, Cheng HQ, et al. Comanagement of surgical patients between neurosurgeons and hospitalists. Arch Intern Med. 2010;170(22):2004-2010. 10.1001/archinternmed.2010.432. PubMed
5. Sharma G, Kuo YF, Freeman J, Zhang DD, Goodwin JS. Comanagement of hospitalized surgical patients by medicine physicians in the United States. Arch Intern Med. 2010;170(4):363-368. 10.1001/archinternmed.2009.553. PubMed
6. Thompson RE, Pfeifer K, Grant PJ, et al. Hospital medicine and perioperative care: a framework for high-quality, high-value collaborative care. J Hosp Med. 2017;12(4):277-282. 10.12788/jhm.2717. PubMed
7. Accreditation Council for Graduate Medical Education. Common Program Requirements. https://www.acgme.org/Portals/0/PFAssets/ProgramRequirements/140_internal_medicine_2017-07-01.pdf. Accessed March 8, 2018.
8. Moore RA, Kammerer WS, McGlynn TJ, Trautlein JJ, Burnside JW. Consultations in internal medicine: a training program resource. J Med Educ. 1977;52(4):323-327. PubMed
9. Robie PW. The service and educational contributions of a general medicine consultation service. J Gen Intern Med. 1986;1(4):225-227. https://doi.org/10.1007/BF02596187. PubMed
10. Devor M, Renvall M, Ramsdell J. Practice patterns and the adequacy of residency training in consultation medicine. J Gen Intern Med. 1993;8(10):554-560. 10.1007/BF02599639. PubMed
11. Siegal EM. Just because you can, doesn’t mean that you should: a call for the rational application of hospitalist comanagement. J Hosp Med. 2008;3(5):398-402. 10.1002/jhm.361. PubMed
12. Goldman L, Lee T, Rudd P. Ten commandments for effective consultations. Arch Intern Med. 1983;143(9):1753-1755. 10.1001/archinte.1983.00350090131022. PubMed
13. Salerno SM. Principles of effective consultation: an update for the 21st-century consultant. Arch Intern Med. 2007;167:271-275. 10.1001/archinte.167.3.271. PubMed
14. Merli GJ, Weitz HH. Medical management of the surgical patient E-Book. Elsevier Health Sciences; 2008. PubMed
© 2018 Society of Hospital Medicine
SCHOLAR Project
The structure and function of academic hospital medicine programs (AHPs) has evolved significantly with the growth of hospital medicine.[1, 2, 3, 4] Many AHPs formed in response to regulatory and financial changes, which drove demand for increased trainee oversight, improved clinical efficiency, and growth in nonteaching services staffed by hospitalists. Differences in local organizational contexts and needs have contributed to great variability in AHP program design and operations. As AHPs have become more established, the need to engage academic hospitalists in scholarship and activities that support professional development and promotion has been recognized. Defining sustainable and successful positions for academic hospitalists is a priority called for by leaders in the field.[5, 6]
In this rapidly evolving context, AHPs have employed a variety of approaches to organizing clinical and academic faculty roles, without guiding evidence or consensus‐based performance benchmarks. A number of AHPs have achieved success along traditional academic metrics of research, scholarship, and education. Currently, it is not known whether specific approaches to AHP organization, structure, or definition of faculty roles are associated with achievement of more traditional markers of academic success.
The Academic Committee of the Society of Hospital Medicine (SHM), and the Academic Hospitalist Task Force of the Society of General Internal Medicine (SGIM) had separately initiated projects to explore characteristics associated with success in AHPs. In 2012, these organizations combined efforts to jointly develop and implement the SCHOLAR (SuCcessful HOspitaLists in Academics and Research) project. The goals were to identify successful AHPs using objective criteria, and to then study those groups in greater detail to generate insights that would be broadly relevant to the field. Efforts to clarify the factors within AHPs linked to success by traditional academic metrics will benefit hospitalists, their leaders, and key stakeholders striving to achieve optimal balance between clinical and academic roles. We describe the initial work of the SCHOLAR project, our definitions of academic success in AHPs, and the characteristics of a cohort of exemplary AHPs who achieved the highest levels on these metrics.
METHODS
Defining Success
The 11 members of the SCHOLAR project held a variety of clinical and academic roles within a geographically diverse group of AHPs. We sought to create a functional definition of success applicable to AHPs. As no gold standard currently exists, we used a consensus process among task force members to arrive at a definition that was quantifiable, feasible, and meaningful. The first step was brainstorming on conference calls held 1 to 2 times monthly over 4 months. Potential defining characteristics that emerged from these discussions related to research, teaching, and administrative activities. When potential characteristics were proposed, we considered how to operationalize each one. Each characteristic was discussed until there was consensus from the entire group. Those around education and administration were the most complex, as many roles are locally driven and defined, and challenging to quantify. For this reason, we focused on promotion as a more global approach to assessing academic hospitalist success in these areas. Although criteria for academic advancement also vary across institutions, we felt that promotion generally reflected having met some threshold of academic success. We also wanted to recognize that scholarship occurs outside the context of funded research. Ultimately, 3 key domains emerged: research grant funding, faculty promotion, and scholarship.
After these 3 domains were identified, the group sought to define quantitative metrics to assess performance. These discussions occurred on subsequent calls over a 4‐month period. Between calls, group members gathered additional information to facilitate assessment of the feasibility of proposed metrics, reporting on progress via email. Again, group consensus was sought for each metric considered. Data on grant funding and successful promotions were available from a previous survey conducted through the SHM in 2011. Leaders from 170 AHPs were contacted, with 50 providing complete responses to the 21‐item questionnaire (see Supporting Information, Appendix 1, in the online version of this article). Results of the survey, heretofore referred to as the Leaders of Academic Hospitalist Programs survey (LAHP‐50), have been described elsewhere.[7] For the purposes of this study, we used the self‐reported data about grant funding and promotions contained in the survey to reflect the current state of the field. Although the survey response rate was approximately 30%, the survey was not anonymous, and many reputationally prominent academic hospitalist programs were represented. For these reasons, the group members felt that the survey results were relevant for the purposes of assessing academic success.
In the LAHP‐50, funding was defined as principal investigator or coinvestigator roles on federally and nonfederally funded research, clinical trials, internal grants, and any other extramurally funded projects. Mean and median funding for the overall sample was calculated. Through a separate question, each program's total faculty full‐time equivalent (FTE) count was reported, allowing us to adjust for group size by assessing both total funding per group and funding/FTE for each responding AHP.
Promotions were defined by the self‐reported number of faculty at each of the following ranks: instructor, assistant professor, associate professor, full professor, and professor above scale/emeritus. In addition, a category of nonacademic track (eg, adjunct faculty, clinical associate) was included to capture hospitalists that did not fit into the traditional promotions categories. We did not distinguish between tenure‐track and nontenure‐track academic ranks. LAHP‐50 survey respondents reported the number of faculty in their group at each academic rank. Given that the majority of academic hospitalists hold a rank of assistant professor or lower,[6, 8, 9] and that the number of full professors was only 3% in the LAHP‐50 cohort, we combined the faculty at the associate and full professor ranks, defining successfully promoted faculty as the percent of hospitalists above the rank of assistant professor.
We created a new metric to assess scholarly output. We had considerable discussion of ways to assess the numbers of peer‐reviewed manuscripts generated by AHPs. However, the group had concerns about the feasibility of identification and attribution of authors to specific AHPs through literature searches. We considered examining only publications in the Journal of Hospital Medicine and the Journal of General Internal Medicine, but felt that this would exclude significant work published by hospitalists in fields of medical education or health services research that would more likely appear in alternate journals. Instead, we quantified scholarship based on the number of abstracts presented at national meetings. We focused on meetings of the SHM and SGIM as the primary professional societies representing hospital medicine. The group felt that even work published outside of the journals of our professional societies would likely be presented at those meetings. We used the following strategy: We reviewed research abstracts accepted for presentation as posters or oral abstracts at the 2010 and 2011 SHM national meetings, and research abstracts with a primary or secondary category of hospital medicine at the 2010 and 2011 SGIM national meetings. By including submissions at both SGIM and SHM meetings, we accounted for the fact that some programs may gravitate more to one society meeting or another. We did not include abstracts in the clinical vignettes or innovations categories. We tallied the number of abstracts by group affiliation of the authors for each of the 4 meetings above and created a cumulative total per group for the 2‐year period. Abstracts with authors from different AHPs were counted once for each individual group. Members of the study group reviewed abstracts from each of the meetings in pairs. Reviewers worked separately and compared tallies of results to ensure consistent tabulations. Internet searches were conducted to identify or confirm author affiliations if it was not apparent in the abstract author list. Abstract tallies were compiled without regard to whether programs had completed the LAHP‐50 survey; thus, we collected data on programs that did not respond to the LAHP‐50 survey.
Identification of the SCHOLAR Cohort
To identify our cohort of top‐performing AHPs, we combined the funding and promotions data from the LAHP‐50 sample with the abstract data. We limited our sample to adult hospital medicine groups to reduce heterogeneity. We created rank lists of programs in each category (grant funding, successful promotions, and scholarship), using data from the LAHP‐50 survey to rank programs on funding and promotions, and data from our abstract counts to rank on scholarship. We limited the top‐performing list in each category to 10 institutions as a cutoff. Because we set a threshold of at least $1 million in total funding, we identified only 9 top performing AHPs with regard to grant funding. We also calculated mean funding/FTE. We chose to rank programs only by funding/FTE rather than total funding per program to better account for group size. For successful promotions, we ranked programs by the percentage of senior faculty. For abstract counts, we included programs whose faculty presented abstracts at a minimum of 2 separate meetings, and ranked programs based on the total number of abstracts per group.
This process resulted in separate lists of top performing programs in each of the 3 domains we associated with academic success, arranged in descending order by grant dollars/FTE, percent of senior faculty, and abstract counts (Table 1). Seventeen different programs were represented across these 3 top 10 lists. One program appeared on all 3 lists, 8 programs appeared on 2 lists, and the remainder appeared on a single list (Table 2). Seven of these programs were identified solely based on abstract presentations, diversifying our top groups beyond only those who completed the LAHP‐50 survey. We considered all of these programs to represent high performance in academic hospital medicine. The group selected this inclusive approach because we recognized that any 1 metric was potentially limited, and we sought to identify diverse pathways to success.
| Funding | Promotions | Scholarship | |
|---|---|---|---|
| Grant $/FTE | Total Grant $ | Senior Faculty, No. (%) | Total Abstract Count |
| |||
| $1,409,090 | $15,500,000 | 3 (60%) | 23 |
| $1,000,000 | $9,000,000 | 3 (60%) | 21 |
| $750,000 | $8,000,000 | 4 (57%) | 20 |
| $478,609 | $6,700,535 | 9 (53%) | 15 |
| $347,826 | $3,000,000 | 8 (44%) | 11 |
| $86,956 | $3,000,000 | 14 (41%) | 11 |
| $66,666 | $2,000,000 | 17 (36%) | 10 |
| $46,153 | $1,500,000 | 9 (33%) | 10 |
| $38,461 | $1,000,000 | 2 (33%) | 9 |
| 4 (31%) | 9 | ||
| Selection Criteria for SCHOLAR Cohort | No. of Programs |
|---|---|
| |
| Abstracts, funding, and promotions | 1 |
| Abstracts plus promotions | 4 |
| Abstracts plus funding | 3 |
| Funding plus promotion | 1 |
| Funding only | 1 |
| Abstract only | 7 |
| Total | 17 |
| Top 10 abstract count | |
| 4 meetings | 2 |
| 3 meetings | 2 |
| 2 meetings | 6 |
The 17 unique adult AHPs appearing on at least 1 of the top 10 lists comprised the SCHOLAR cohort of programs that we studied in greater detail. Data reflecting program demographics were solicited directly from leaders of the AHPs identified in the SCHOLAR cohort, including size and age of program, reporting structure, number of faculty at various academic ranks (for programs that did not complete the LAHP‐50 survey), and number of faculty with fellowship training (defined as any postresidency fellowship program).
Subsequently, we performed comparative analyses between the programs in the SCHOLAR cohort to the general population of AHPs reflected by the LAHP‐50 sample. Because abstract presentations were not recorded in the original LAHP‐50 survey instrument, it was not possible to perform a benchmarking comparison for the scholarship domain.
Data Analysis
To measure the success of the SCHOLAR cohort we compared the grant funding and proportion of successfully promoted faculty at the SCHOLAR programs to those in the overall LAHP‐50 sample. Differences in mean and median grant funding were compared using t tests and Mann‐Whitney rank sum tests. Proportion of promoted faculty were compared using 2 tests. A 2‐tailed of 0.05 was used to test significance of differences.
RESULTS
Demographics
Among the AHPs in the SCHOLAR cohort, the mean program age was 13.2 years (range, 618 years), and the mean program size was 36 faculty (range, 1895; median, 28). On average, 15% of faculty members at SCHOLAR programs were fellowship trained (range, 0%37%). Reporting structure among the SCHOLAR programs was as follows: 53% were an independent division or section of the department of medicine; 29% were a section within general internal medicine, and 18% were an independent clinical group.
Grant Funding
Table 3 compares grant funding in the SCHOLAR programs to programs in the overall LAHP‐50 sample. Mean funding per group and mean funding per FTE were significantly higher in the SCHOLAR group than in the overall sample.
| Funding (Millions) | ||
|---|---|---|
| LAHP‐50 Overall Sample | SCHOLAR | |
| ||
| Median grant funding/AHP | 0.060 | 1.500* |
| Mean grant funding/AHP | 1.147 (015) | 3.984* (015) |
| Median grant funding/FTE | 0.004 | 0.038* |
| Mean grant funding/FTE | 0.095 (01.4) | 0.364* (01.4) |
Thirteen of the SCHOLAR programs were represented in the initial LAHP‐50, but 2 did not report a dollar amount for grants and contracts. Therefore, data for total grant funding were available for only 65% (11 of 17) of the programs in the SCHOLAR cohort. Of note, 28% of AHPs in the overall LAHP‐50 sample reported no external funding sources.
Faculty Promotion
Figure 1 demonstrates the proportion of faculty at various academic ranks. The percent of faculty above the rank of assistant professor in the SCHOLAR programs exceeded those in the overall LAHP‐50 by 5% (17.9% vs 12.8%, P = 0.01). Of note, 6% of the hospitalists at AHPs in the SCHOLAR programs were on nonfaculty tracks.
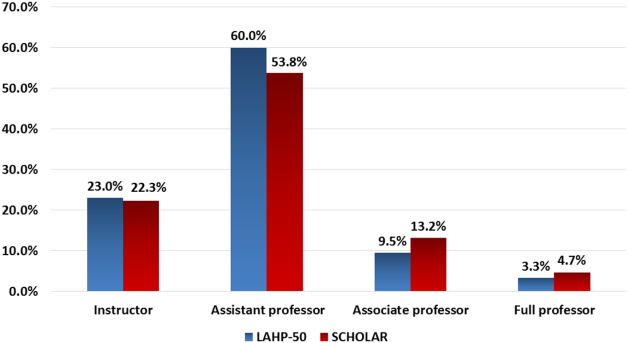
Scholarship
Mean abstract output over the 2‐year period measured was 10.8 (range, 323) in the SCHOLAR cohort. Because we did not collect these data for the LAHP‐50 group, comparative analyses were not possible.
DISCUSSION
Using a definition of academic success that incorporated metrics of grant funding, faculty promotion, and scholarly output, we identified a unique subset of successful AHPsthe SCHOLAR cohort. The programs represented in the SCHOLAR cohort were generally large and relatively mature. Despite this, the cohort consisted of mostly junior faculty, had a paucity of fellowship‐trained hospitalists, and not all reported grant funding.
Prior published work reported complementary findings.[6, 8, 9] A survey of 20 large, well‐established academic hospitalist programs in 2008 found that the majority of hospitalists were junior faculty with a limited publication portfolio. Of the 266 respondents in that study, 86% reported an academic rank at or below assistant professor; funding was not explored.[9] Our similar findings 4 years later add to this work by demonstrating trends over time, and suggest that progress toward creating successful pathways for academic advancement has been slow. In a 2012 survey of the SHM membership, 28% of hospitalists with academic appointments reported no current or future plans to engage in research.[8] These findings suggest that faculty in AHPs may define scholarship through nontraditional pathways, or in some cases choose not to pursue or prioritize scholarship altogether.
Our findings also add to the literature with regard to our assessment of funding, which was variable across the SCHOLAR group. The broad range of funding in the SCHOLAR programs for which we have data (grant dollars $0$15 million per program) suggests that opportunities to improve supported scholarship remain, even among a selected cohort of successful AHPs. The predominance of junior faculty in the SCHOLAR programs may be a reason for this variation. Junior faculty may be engaged in research with funding directed to senior mentors outside their AHP. Alternatively, they may pursue meaningful local hospital quality improvement or educational innovations not supported by external grants, or hold leadership roles in education, quality, or information technology that allow for advancement and promotion without external grant funding. As the scope and impact of these roles increases, senior leaders with alternate sources of support may rely less on research funds; this too may explain some of the differences. Our findings are congruent with results of a study that reviewed original research published by hospitalists, and concluded that the majority of hospitalist research was not externally funded.[8] Our approach for assessing grant funding by adjusting for FTE had the potential to inadvertently favor smaller well‐funded groups over larger ones; however, programs in our sample were similarly represented when ranked by funding/FTE or total grant dollars. As many successful AHPs do concentrate their research funding among a core of focused hospitalist researchers, our definition may not be the ideal metric for some programs.
We chose to define scholarship based on abstract output, rather than peer‐reviewed publications. Although this choice was necessary from a feasibility perspective, it may have excluded programs that prioritize peer‐reviewed publications over abstracts. Although we were unable to incorporate a search strategy to accurately and comprehensively track the publication output attributed specifically to hospitalist researchers and quantify it by program, others have since defined such an approach.[8] However, tracking abstracts theoretically allowed insights into a larger volume of innovative and creative work generated by top AHPs by potentially including work in the earlier stages of development.
We used a consensus‐based definition of success to define our SCHOLAR cohort. There are other ways to measure academic success, which if applied, may have yielded a different sample of programs. For example, over half of the original research articles published in the Journal of Hospital Medicine over a 7‐year span were generated from 5 academic centers.[8] This definition of success may be equally credible, though we note that 4 of these 5 programs were also included in the SCHOLAR cohort. We feel our broader approach was more reflective of the variety of pathways to success available to academic hospitalists. Before our metrics are applied as a benchmarking tool, however, they should ideally be combined with factors not measured in our study to ensure a more comprehensive or balanced reflection of academic success. Factors such as mentorship, level of hospitalist engagement,[10] prevalence of leadership opportunities, operational and fiscal infrastructure, and the impact of local quality, safety, and value efforts should be considered.
Comparison of successfully promoted faculty at AHPs across the country is inherently limited by the wide variation in promotion standards across different institutions; controlling for such differences was not possible with our methodology. For example, it appears that several programs with relatively few senior faculty may have met metrics leading to their inclusion in the SCHOLAR group because of their small program size. Future benchmarking efforts for promotion at AHPs should take scaling into account and consider both total number as well as percentage of senior faculty when evaluating success.
Our methodology has several limitations. Survey data were self‐reported and not independently validated, and as such are subject to recall and reporting biases. Response bias inherently excluded some AHPs that may have met our grant funding or promotions criteria had they participated in the initial LAHP‐50 survey, though we identified and included additional programs through our scholarship metric, increasing the representativeness of the SCHOLAR cohort. Given the dynamic nature of the field, the age of the data we relied upon for analysis limits the generalizability of our specific benchmarks to current practice. However, the development of academic success occurs over the long‐term, and published data on academic hospitalist productivity are consistent with this slower time course.[8] Despite these limitations, our data inform the general topic of gauging performance of AHPs, underscoring the challenges of developing and applying metrics of success, and highlight the variability of performance on selected metrics even among a relatively small group of 17 programs.
In conclusion, we have created a method to quantify academic success that may be useful to academic hospitalists and their group leaders as they set targets for improvement in the field. Even among our SCHOLAR cohort, room for ongoing improvement in development of funded scholarship and a core of senior faculty exists. Further investigation into the unique features of successful groups will offer insight to leaders in academic hospital medicine regarding infrastructure and processes that should be embraced to raise the bar for all AHPs. In addition, efforts to further define and validate nontraditional approaches to scholarship that allow for successful promotion at AHPs would be informative. We view our work less as a singular approach to benchmarking standards for AHPs, and more a call to action to continue efforts to balance scholarly activity and broad professional development of academic hospitalists with increasing clinical demands.
Acknowledgements
The authors thank all of the AHP leaders who participated in the SCHOLAR project. They also thank the Society of Hospital Medicine and Society of General Internal Medicine and the SHM Academic Committee and SGIM Academic Hospitalist Task Force for their support of this work.
Disclosures
The work reported here was supported by the Department of Veterans Affairs, Veterans Health Administration, South Texas Veterans Health Care System. The views expressed in this article are those of the authors and do not necessarily reflect the position or policy of the Department of Veterans Affairs. The authors report no conflicts of interest.
- , , , , . Characteristics of primary care providers who adopted the hospitalist model from 2001 to 2009. J Hosp Med. 2015;10(2):75–82.
- , , , . Growth in the care of older patients by hospitalists in the United States. N Engl J Med. 2009;360(11):1102–1112.
- , , , , . Updating threshold‐based identification of hospitalists in 2012 Medicare pay data. J Hosp Med. 2016;11(1):45–47.
- , , , . Use of hospitalists by Medicare beneficiaries: a national picture. Medicare Medicaid Res Rev. 2014;4(2).
- , , , , , . Challenges and opportunities in Academic Hospital Medicine: report from the Academic Hospital Medicine Summit. J Hosp Med. 2009;4(4):240–246.
- , , , . Survey of US academic hospitalist leaders about mentorship and academic activities in hospitalist groups. J Hosp Med. 2011;6(1):5–9.
- , , , , , . The structure of hospital medicine programs at academic medical centers [abstract]. J Hosp Med. 2012;7(suppl 2):s92.
- , , , , . Research and publication trends in hospital medicine. J Hosp Med. 2014;9(3):148–154.
- , , , , , . Mentorship, productivity, and promotion among academic hospitalists. J Gen Intern Med. 2012;27(1):23–27.
- , , , et al. The key principles and characteristics of an effective hospital medicine group: an assessment guide for hospitals and hospitalists. J Hosp Med. 2014;9(2):123–128.
The structure and function of academic hospital medicine programs (AHPs) has evolved significantly with the growth of hospital medicine.[1, 2, 3, 4] Many AHPs formed in response to regulatory and financial changes, which drove demand for increased trainee oversight, improved clinical efficiency, and growth in nonteaching services staffed by hospitalists. Differences in local organizational contexts and needs have contributed to great variability in AHP program design and operations. As AHPs have become more established, the need to engage academic hospitalists in scholarship and activities that support professional development and promotion has been recognized. Defining sustainable and successful positions for academic hospitalists is a priority called for by leaders in the field.[5, 6]
In this rapidly evolving context, AHPs have employed a variety of approaches to organizing clinical and academic faculty roles, without guiding evidence or consensus‐based performance benchmarks. A number of AHPs have achieved success along traditional academic metrics of research, scholarship, and education. Currently, it is not known whether specific approaches to AHP organization, structure, or definition of faculty roles are associated with achievement of more traditional markers of academic success.
The Academic Committee of the Society of Hospital Medicine (SHM), and the Academic Hospitalist Task Force of the Society of General Internal Medicine (SGIM) had separately initiated projects to explore characteristics associated with success in AHPs. In 2012, these organizations combined efforts to jointly develop and implement the SCHOLAR (SuCcessful HOspitaLists in Academics and Research) project. The goals were to identify successful AHPs using objective criteria, and to then study those groups in greater detail to generate insights that would be broadly relevant to the field. Efforts to clarify the factors within AHPs linked to success by traditional academic metrics will benefit hospitalists, their leaders, and key stakeholders striving to achieve optimal balance between clinical and academic roles. We describe the initial work of the SCHOLAR project, our definitions of academic success in AHPs, and the characteristics of a cohort of exemplary AHPs who achieved the highest levels on these metrics.
METHODS
Defining Success
The 11 members of the SCHOLAR project held a variety of clinical and academic roles within a geographically diverse group of AHPs. We sought to create a functional definition of success applicable to AHPs. As no gold standard currently exists, we used a consensus process among task force members to arrive at a definition that was quantifiable, feasible, and meaningful. The first step was brainstorming on conference calls held 1 to 2 times monthly over 4 months. Potential defining characteristics that emerged from these discussions related to research, teaching, and administrative activities. When potential characteristics were proposed, we considered how to operationalize each one. Each characteristic was discussed until there was consensus from the entire group. Those around education and administration were the most complex, as many roles are locally driven and defined, and challenging to quantify. For this reason, we focused on promotion as a more global approach to assessing academic hospitalist success in these areas. Although criteria for academic advancement also vary across institutions, we felt that promotion generally reflected having met some threshold of academic success. We also wanted to recognize that scholarship occurs outside the context of funded research. Ultimately, 3 key domains emerged: research grant funding, faculty promotion, and scholarship.
After these 3 domains were identified, the group sought to define quantitative metrics to assess performance. These discussions occurred on subsequent calls over a 4‐month period. Between calls, group members gathered additional information to facilitate assessment of the feasibility of proposed metrics, reporting on progress via email. Again, group consensus was sought for each metric considered. Data on grant funding and successful promotions were available from a previous survey conducted through the SHM in 2011. Leaders from 170 AHPs were contacted, with 50 providing complete responses to the 21‐item questionnaire (see Supporting Information, Appendix 1, in the online version of this article). Results of the survey, heretofore referred to as the Leaders of Academic Hospitalist Programs survey (LAHP‐50), have been described elsewhere.[7] For the purposes of this study, we used the self‐reported data about grant funding and promotions contained in the survey to reflect the current state of the field. Although the survey response rate was approximately 30%, the survey was not anonymous, and many reputationally prominent academic hospitalist programs were represented. For these reasons, the group members felt that the survey results were relevant for the purposes of assessing academic success.
In the LAHP‐50, funding was defined as principal investigator or coinvestigator roles on federally and nonfederally funded research, clinical trials, internal grants, and any other extramurally funded projects. Mean and median funding for the overall sample was calculated. Through a separate question, each program's total faculty full‐time equivalent (FTE) count was reported, allowing us to adjust for group size by assessing both total funding per group and funding/FTE for each responding AHP.
Promotions were defined by the self‐reported number of faculty at each of the following ranks: instructor, assistant professor, associate professor, full professor, and professor above scale/emeritus. In addition, a category of nonacademic track (eg, adjunct faculty, clinical associate) was included to capture hospitalists that did not fit into the traditional promotions categories. We did not distinguish between tenure‐track and nontenure‐track academic ranks. LAHP‐50 survey respondents reported the number of faculty in their group at each academic rank. Given that the majority of academic hospitalists hold a rank of assistant professor or lower,[6, 8, 9] and that the number of full professors was only 3% in the LAHP‐50 cohort, we combined the faculty at the associate and full professor ranks, defining successfully promoted faculty as the percent of hospitalists above the rank of assistant professor.
We created a new metric to assess scholarly output. We had considerable discussion of ways to assess the numbers of peer‐reviewed manuscripts generated by AHPs. However, the group had concerns about the feasibility of identification and attribution of authors to specific AHPs through literature searches. We considered examining only publications in the Journal of Hospital Medicine and the Journal of General Internal Medicine, but felt that this would exclude significant work published by hospitalists in fields of medical education or health services research that would more likely appear in alternate journals. Instead, we quantified scholarship based on the number of abstracts presented at national meetings. We focused on meetings of the SHM and SGIM as the primary professional societies representing hospital medicine. The group felt that even work published outside of the journals of our professional societies would likely be presented at those meetings. We used the following strategy: We reviewed research abstracts accepted for presentation as posters or oral abstracts at the 2010 and 2011 SHM national meetings, and research abstracts with a primary or secondary category of hospital medicine at the 2010 and 2011 SGIM national meetings. By including submissions at both SGIM and SHM meetings, we accounted for the fact that some programs may gravitate more to one society meeting or another. We did not include abstracts in the clinical vignettes or innovations categories. We tallied the number of abstracts by group affiliation of the authors for each of the 4 meetings above and created a cumulative total per group for the 2‐year period. Abstracts with authors from different AHPs were counted once for each individual group. Members of the study group reviewed abstracts from each of the meetings in pairs. Reviewers worked separately and compared tallies of results to ensure consistent tabulations. Internet searches were conducted to identify or confirm author affiliations if it was not apparent in the abstract author list. Abstract tallies were compiled without regard to whether programs had completed the LAHP‐50 survey; thus, we collected data on programs that did not respond to the LAHP‐50 survey.
Identification of the SCHOLAR Cohort
To identify our cohort of top‐performing AHPs, we combined the funding and promotions data from the LAHP‐50 sample with the abstract data. We limited our sample to adult hospital medicine groups to reduce heterogeneity. We created rank lists of programs in each category (grant funding, successful promotions, and scholarship), using data from the LAHP‐50 survey to rank programs on funding and promotions, and data from our abstract counts to rank on scholarship. We limited the top‐performing list in each category to 10 institutions as a cutoff. Because we set a threshold of at least $1 million in total funding, we identified only 9 top performing AHPs with regard to grant funding. We also calculated mean funding/FTE. We chose to rank programs only by funding/FTE rather than total funding per program to better account for group size. For successful promotions, we ranked programs by the percentage of senior faculty. For abstract counts, we included programs whose faculty presented abstracts at a minimum of 2 separate meetings, and ranked programs based on the total number of abstracts per group.
This process resulted in separate lists of top performing programs in each of the 3 domains we associated with academic success, arranged in descending order by grant dollars/FTE, percent of senior faculty, and abstract counts (Table 1). Seventeen different programs were represented across these 3 top 10 lists. One program appeared on all 3 lists, 8 programs appeared on 2 lists, and the remainder appeared on a single list (Table 2). Seven of these programs were identified solely based on abstract presentations, diversifying our top groups beyond only those who completed the LAHP‐50 survey. We considered all of these programs to represent high performance in academic hospital medicine. The group selected this inclusive approach because we recognized that any 1 metric was potentially limited, and we sought to identify diverse pathways to success.
| Funding | Promotions | Scholarship | |
|---|---|---|---|
| Grant $/FTE | Total Grant $ | Senior Faculty, No. (%) | Total Abstract Count |
| |||
| $1,409,090 | $15,500,000 | 3 (60%) | 23 |
| $1,000,000 | $9,000,000 | 3 (60%) | 21 |
| $750,000 | $8,000,000 | 4 (57%) | 20 |
| $478,609 | $6,700,535 | 9 (53%) | 15 |
| $347,826 | $3,000,000 | 8 (44%) | 11 |
| $86,956 | $3,000,000 | 14 (41%) | 11 |
| $66,666 | $2,000,000 | 17 (36%) | 10 |
| $46,153 | $1,500,000 | 9 (33%) | 10 |
| $38,461 | $1,000,000 | 2 (33%) | 9 |
| 4 (31%) | 9 | ||
| Selection Criteria for SCHOLAR Cohort | No. of Programs |
|---|---|
| |
| Abstracts, funding, and promotions | 1 |
| Abstracts plus promotions | 4 |
| Abstracts plus funding | 3 |
| Funding plus promotion | 1 |
| Funding only | 1 |
| Abstract only | 7 |
| Total | 17 |
| Top 10 abstract count | |
| 4 meetings | 2 |
| 3 meetings | 2 |
| 2 meetings | 6 |
The 17 unique adult AHPs appearing on at least 1 of the top 10 lists comprised the SCHOLAR cohort of programs that we studied in greater detail. Data reflecting program demographics were solicited directly from leaders of the AHPs identified in the SCHOLAR cohort, including size and age of program, reporting structure, number of faculty at various academic ranks (for programs that did not complete the LAHP‐50 survey), and number of faculty with fellowship training (defined as any postresidency fellowship program).
Subsequently, we performed comparative analyses between the programs in the SCHOLAR cohort to the general population of AHPs reflected by the LAHP‐50 sample. Because abstract presentations were not recorded in the original LAHP‐50 survey instrument, it was not possible to perform a benchmarking comparison for the scholarship domain.
Data Analysis
To measure the success of the SCHOLAR cohort we compared the grant funding and proportion of successfully promoted faculty at the SCHOLAR programs to those in the overall LAHP‐50 sample. Differences in mean and median grant funding were compared using t tests and Mann‐Whitney rank sum tests. Proportion of promoted faculty were compared using 2 tests. A 2‐tailed of 0.05 was used to test significance of differences.
RESULTS
Demographics
Among the AHPs in the SCHOLAR cohort, the mean program age was 13.2 years (range, 618 years), and the mean program size was 36 faculty (range, 1895; median, 28). On average, 15% of faculty members at SCHOLAR programs were fellowship trained (range, 0%37%). Reporting structure among the SCHOLAR programs was as follows: 53% were an independent division or section of the department of medicine; 29% were a section within general internal medicine, and 18% were an independent clinical group.
Grant Funding
Table 3 compares grant funding in the SCHOLAR programs to programs in the overall LAHP‐50 sample. Mean funding per group and mean funding per FTE were significantly higher in the SCHOLAR group than in the overall sample.
| Funding (Millions) | ||
|---|---|---|
| LAHP‐50 Overall Sample | SCHOLAR | |
| ||
| Median grant funding/AHP | 0.060 | 1.500* |
| Mean grant funding/AHP | 1.147 (015) | 3.984* (015) |
| Median grant funding/FTE | 0.004 | 0.038* |
| Mean grant funding/FTE | 0.095 (01.4) | 0.364* (01.4) |
Thirteen of the SCHOLAR programs were represented in the initial LAHP‐50, but 2 did not report a dollar amount for grants and contracts. Therefore, data for total grant funding were available for only 65% (11 of 17) of the programs in the SCHOLAR cohort. Of note, 28% of AHPs in the overall LAHP‐50 sample reported no external funding sources.
Faculty Promotion
Figure 1 demonstrates the proportion of faculty at various academic ranks. The percent of faculty above the rank of assistant professor in the SCHOLAR programs exceeded those in the overall LAHP‐50 by 5% (17.9% vs 12.8%, P = 0.01). Of note, 6% of the hospitalists at AHPs in the SCHOLAR programs were on nonfaculty tracks.
Scholarship
Mean abstract output over the 2‐year period measured was 10.8 (range, 323) in the SCHOLAR cohort. Because we did not collect these data for the LAHP‐50 group, comparative analyses were not possible.
DISCUSSION
Using a definition of academic success that incorporated metrics of grant funding, faculty promotion, and scholarly output, we identified a unique subset of successful AHPsthe SCHOLAR cohort. The programs represented in the SCHOLAR cohort were generally large and relatively mature. Despite this, the cohort consisted of mostly junior faculty, had a paucity of fellowship‐trained hospitalists, and not all reported grant funding.
Prior published work reported complementary findings.[6, 8, 9] A survey of 20 large, well‐established academic hospitalist programs in 2008 found that the majority of hospitalists were junior faculty with a limited publication portfolio. Of the 266 respondents in that study, 86% reported an academic rank at or below assistant professor; funding was not explored.[9] Our similar findings 4 years later add to this work by demonstrating trends over time, and suggest that progress toward creating successful pathways for academic advancement has been slow. In a 2012 survey of the SHM membership, 28% of hospitalists with academic appointments reported no current or future plans to engage in research.[8] These findings suggest that faculty in AHPs may define scholarship through nontraditional pathways, or in some cases choose not to pursue or prioritize scholarship altogether.
Our findings also add to the literature with regard to our assessment of funding, which was variable across the SCHOLAR group. The broad range of funding in the SCHOLAR programs for which we have data (grant dollars $0$15 million per program) suggests that opportunities to improve supported scholarship remain, even among a selected cohort of successful AHPs. The predominance of junior faculty in the SCHOLAR programs may be a reason for this variation. Junior faculty may be engaged in research with funding directed to senior mentors outside their AHP. Alternatively, they may pursue meaningful local hospital quality improvement or educational innovations not supported by external grants, or hold leadership roles in education, quality, or information technology that allow for advancement and promotion without external grant funding. As the scope and impact of these roles increases, senior leaders with alternate sources of support may rely less on research funds; this too may explain some of the differences. Our findings are congruent with results of a study that reviewed original research published by hospitalists, and concluded that the majority of hospitalist research was not externally funded.[8] Our approach for assessing grant funding by adjusting for FTE had the potential to inadvertently favor smaller well‐funded groups over larger ones; however, programs in our sample were similarly represented when ranked by funding/FTE or total grant dollars. As many successful AHPs do concentrate their research funding among a core of focused hospitalist researchers, our definition may not be the ideal metric for some programs.
We chose to define scholarship based on abstract output, rather than peer‐reviewed publications. Although this choice was necessary from a feasibility perspective, it may have excluded programs that prioritize peer‐reviewed publications over abstracts. Although we were unable to incorporate a search strategy to accurately and comprehensively track the publication output attributed specifically to hospitalist researchers and quantify it by program, others have since defined such an approach.[8] However, tracking abstracts theoretically allowed insights into a larger volume of innovative and creative work generated by top AHPs by potentially including work in the earlier stages of development.
We used a consensus‐based definition of success to define our SCHOLAR cohort. There are other ways to measure academic success, which if applied, may have yielded a different sample of programs. For example, over half of the original research articles published in the Journal of Hospital Medicine over a 7‐year span were generated from 5 academic centers.[8] This definition of success may be equally credible, though we note that 4 of these 5 programs were also included in the SCHOLAR cohort. We feel our broader approach was more reflective of the variety of pathways to success available to academic hospitalists. Before our metrics are applied as a benchmarking tool, however, they should ideally be combined with factors not measured in our study to ensure a more comprehensive or balanced reflection of academic success. Factors such as mentorship, level of hospitalist engagement,[10] prevalence of leadership opportunities, operational and fiscal infrastructure, and the impact of local quality, safety, and value efforts should be considered.
Comparison of successfully promoted faculty at AHPs across the country is inherently limited by the wide variation in promotion standards across different institutions; controlling for such differences was not possible with our methodology. For example, it appears that several programs with relatively few senior faculty may have met metrics leading to their inclusion in the SCHOLAR group because of their small program size. Future benchmarking efforts for promotion at AHPs should take scaling into account and consider both total number as well as percentage of senior faculty when evaluating success.
Our methodology has several limitations. Survey data were self‐reported and not independently validated, and as such are subject to recall and reporting biases. Response bias inherently excluded some AHPs that may have met our grant funding or promotions criteria had they participated in the initial LAHP‐50 survey, though we identified and included additional programs through our scholarship metric, increasing the representativeness of the SCHOLAR cohort. Given the dynamic nature of the field, the age of the data we relied upon for analysis limits the generalizability of our specific benchmarks to current practice. However, the development of academic success occurs over the long‐term, and published data on academic hospitalist productivity are consistent with this slower time course.[8] Despite these limitations, our data inform the general topic of gauging performance of AHPs, underscoring the challenges of developing and applying metrics of success, and highlight the variability of performance on selected metrics even among a relatively small group of 17 programs.
In conclusion, we have created a method to quantify academic success that may be useful to academic hospitalists and their group leaders as they set targets for improvement in the field. Even among our SCHOLAR cohort, room for ongoing improvement in development of funded scholarship and a core of senior faculty exists. Further investigation into the unique features of successful groups will offer insight to leaders in academic hospital medicine regarding infrastructure and processes that should be embraced to raise the bar for all AHPs. In addition, efforts to further define and validate nontraditional approaches to scholarship that allow for successful promotion at AHPs would be informative. We view our work less as a singular approach to benchmarking standards for AHPs, and more a call to action to continue efforts to balance scholarly activity and broad professional development of academic hospitalists with increasing clinical demands.
Acknowledgements
The authors thank all of the AHP leaders who participated in the SCHOLAR project. They also thank the Society of Hospital Medicine and Society of General Internal Medicine and the SHM Academic Committee and SGIM Academic Hospitalist Task Force for their support of this work.
Disclosures
The work reported here was supported by the Department of Veterans Affairs, Veterans Health Administration, South Texas Veterans Health Care System. The views expressed in this article are those of the authors and do not necessarily reflect the position or policy of the Department of Veterans Affairs. The authors report no conflicts of interest.
- , , , , . Characteristics of primary care providers who adopted the hospitalist model from 2001 to 2009. J Hosp Med. 2015;10(2):75–82.
- , , , . Growth in the care of older patients by hospitalists in the United States. N Engl J Med. 2009;360(11):1102–1112.
- , , , , . Updating threshold‐based identification of hospitalists in 2012 Medicare pay data. J Hosp Med. 2016;11(1):45–47.
- , , , . Use of hospitalists by Medicare beneficiaries: a national picture. Medicare Medicaid Res Rev. 2014;4(2).
- , , , , , . Challenges and opportunities in Academic Hospital Medicine: report from the Academic Hospital Medicine Summit. J Hosp Med. 2009;4(4):240–246.
- , , , . Survey of US academic hospitalist leaders about mentorship and academic activities in hospitalist groups. J Hosp Med. 2011;6(1):5–9.
- , , , , , . The structure of hospital medicine programs at academic medical centers [abstract]. J Hosp Med. 2012;7(suppl 2):s92.
- , , , , . Research and publication trends in hospital medicine. J Hosp Med. 2014;9(3):148–154.
- , , , , , . Mentorship, productivity, and promotion among academic hospitalists. J Gen Intern Med. 2012;27(1):23–27.
- , , , et al. The key principles and characteristics of an effective hospital medicine group: an assessment guide for hospitals and hospitalists. J Hosp Med. 2014;9(2):123–128.

Research Agenda for Older Patient Care
Older adults with high levels of medical complexity occupy an increasing fraction of beds in acute‐care hospitals in the United States.[1, 2] By 2007, patients age 65 years and older accounted for nearly half of adult inpatient days of care.[1] These patients are commonly cared for by hospitalists who number more than 40,000.[3] Although hospitalists are most often trained in internal medicine, they have typically received limited formal geriatrics training. Increasingly, access to experts in geriatric medicine is limited.[4] Further, hospitalists and others who practice in acute care are limited by the lack of research to address the needs of the older adult population, specifically in the diagnosis and management of conditions encountered during acute illness.
To better support hospitalists in providing acute inpatient geriatric care, the Society of Hospital Medicine (SHM) partnered with the Association of Specialty Professors to develop a research agenda to bridge this gap. Using methodology from the James Lind Alliance (JLA) and the Patient Centered Outcomes Research Institute (PCORI), the SHM joined with older adult advocacy groups, professional societies of providers, and funders to create a geriatric‐focused acute‐care research agenda, highlighting 10 key research questions.[5, 6, 7] The goal of this approach was to produce and promote high integrity, evidence‐based information that comes from research guided by patients, caregivers, and the broader healthcare community.[8] In this article, we describe the methodology and results of this agenda‐setting process, referred to as the Acute Care of Older Patients (ACOP) Priority Setting Partnership.
METHODS
Overview
This project focused on topic generation, the first step in the PCORI framework for identification and prioritization of research areas.[5] We employed a specific and defined methodology to elicit and prioritize potential research topics incorporating input from representatives of older patients, family caregivers, and healthcare providers.[6]
To elicit this input, we chose a collaborative and consultative approach to stakeholder engagement, drawing heavily from the published work of the JLA, an initiative promoting patient‐clinician partnerships in health research developed in the United Kingdom.[6] We previously described the approach elsewhere.[7]
The ACOP process for determining the research agenda consisted of 4 steps: (1) convene, (2) consult, (3) collate, and (4) prioritize.[6] Through these steps, detailed below, we were able to obtain input from a broad group of stakeholders and engage the stakeholders in a process of reducing and refining our research questions.
Convene
The steering committee (the article's authors) convened a stakeholder partnership group that included stakeholders representing patients and caregivers, advocacy organizations for the elderly, organizations that address diseases and conditions common among hospitalized older patients, provider professional societies (eg, hospitalists, subspecialists, and nurses and social workers), payers, and funders. Patient, caregiver, and advocacy organizations were identified based on their engagement in aging and health policy advocacy by SHM staff and 1 author who had completed a Health and Aging Policy Fellowship (H.L.W.).
The steering committee issued e‐mail invitations to stakeholder organizations, making initial inquiries through professional staff and relevant committee chairs. Second inquiries were made via e‐mail to each organization's volunteer leadership. We developed a webinar that outlined the overall research agenda setting process and distributed the webinar to all stakeholders. The stakeholder organizations were asked to commit to (1) surveying their memberships and (2) participating actively in prioritization by e‐mail and at a 1‐day meeting in Washington DC.
Consult
Each stakeholder organization conducted a survey of its membership via an Internet‐based survey in the summer of 2013 (see Supporting Information, Appendix A, in the online version of this article). Stakeholder organizations were asked to provide up to 75 survey responses each. Though a standard survey was used, the steering committee was not prescriptive in the methodology of survey distribution to accommodate the structure and communication methods of the individual stakeholder organizations. Survey respondents were asked to identify up to 5 unanswered questions relevant to the acute care of older persons and also provide demographic information.
Collate
In the collating process, we clarified and categorized the unanswered questions submitted in the individual surveys. Each question was initially reviewed by a member of the steering committee, using explicit criteria (see Supporting Information, Appendix B, in the online version of this article). Questions that did not meet all 4 criteria were removed. For questions that met all criteria, we clarified language, combined similar questions, and categorized each question. Categories were created in a grounded process, in which individual reviewers assigned categories based on the content of the questions. Each question could be assigned to up to 2 categories. Each question was then reviewed by a second member of the steering committee using the same 4 criteria. As part of this review, similar questions were consolidated, and when possible, questions were rewritten in a standard format.[6]
Finally, the steering committee reviewed previously published research agendas looking for additional relevant unanswered questions, specifically the New Frontiers Research Agenda created by the American Geriatrics Society in conjunction with participating subspecialty societies,[9] the Cochrane Library, and other systematic reviews identified in the literature via PubMed search.[10, 11, 12, 13, 14, 15]
Prioritize
The resulting list of unanswered questions was prioritized in 2 phases. First, the list was e‐mailed to all stakeholder organizations. The organizations were asked to vote on their top 10 priorities from this list using an online ballot, assigning 10 points to their highest priority down to 1 point for their lowest priority. In so doing, they were asked to consider explicit criteria (see Supporting Information, Appendix B, in the online version of this article). Each organization had only 1 ballot and could arrive at their top 10 list in any manner they wished. The balloting from this phase was used to develop a list of unanswered questions for the second round of in‐person prioritization. Each priority's scores were totaled across all voting organizations. The 29 priorities with the highest point totals were brought to the final prioritization round because of a natural cut point at priority number 29, rather than number 30.
For the final prioritization round, the steering committee facilitated an in‐person meeting in Washington, DC in October 2013 using nominal group technique (NGT) methodologies to arrive at consensus.[16] During this process stakeholders were asked to consider additional criteria (see Supporting Information, Appendix B, in the online version of this article).
RESULTS
Table 1 lists the organizations who engaged in 1 or more parts of the topic generation process. Eighteen stakeholder organizations agreed to participate in the convening process. Ten organizations did not respond to our solicitation and 1 declined to participate.
| Organization (N=18) | Consultation % of Survey Responses (N=580) | Prioritization Round 1 | Prioritization Round 2 |
|---|---|---|---|
| Alzheimer's Association | 7.0% | Yes | Yes |
| American Academy of Neurology | 3.4% | Yes | Yes |
| American Association of Retired Persons | 0.8% | No | No |
| American College of Cardiology | 11.4% | Yes | Yes |
| American College of Emergency Physicians | 1.3% | No | No |
| American College of Surgeons | 1.0% | Yes | Yes |
| American Geriatrics Society | 7.6% | Yes | Yes |
| American Hospital Association | 1.7% | Yes | No |
| Centers for Medicare & Medicaid Services | 0.8% | Yes | Yes |
| Gerontological Society of America | 18.9% | Yes | Yes |
| National Alliance for Caregiving | 1.0% | Yes | Yes |
| National Association of Social Workers | 5.9% | Yes | Yes |
| National Coalition for Healthcare | 0.6% | No | No |
| National Institute on Aging | 2.1% | Yes | Yes |
| National Partnership for Women and Families | 0.0% | Yes | Yes |
| Nursing Improving Care for Healthsystem Elders | 28.6% | Yes | No |
| Society of Critical Care Medicine | 12.0% | Yes | Yes |
| Society of Hospital Medicine | 4.6% | Yes | Yes |
Seventeen stakeholder organizations obtained survey responses from a total of 580 individuals (range, 3150 per organization), who were asked to identify important unanswered questions in the acute care of older persons. Survey respondents were typically female (77%), white (85%), aged 45 to 65 years (65%), and identified themselves as health professionals (90%). Twenty‐six percent of respondents also identified as patients or family caregivers. Their surveys included 1299 individual questions.
Figure 1 summarizes our collation and prioritization process and reports the numbers of questions resulting at each stage. Nine hundred nineteen questions were removed during the first review conducted by steering committee members, and 31 question categories were identified. An additional 305 questions were removed in the second review, with 75 questions remaining. As the final step of the collating process, literature review identified 39 relevant questions not already suggested or moved forward through our consultation and collation process. These questions were added to the list of unanswered questions.
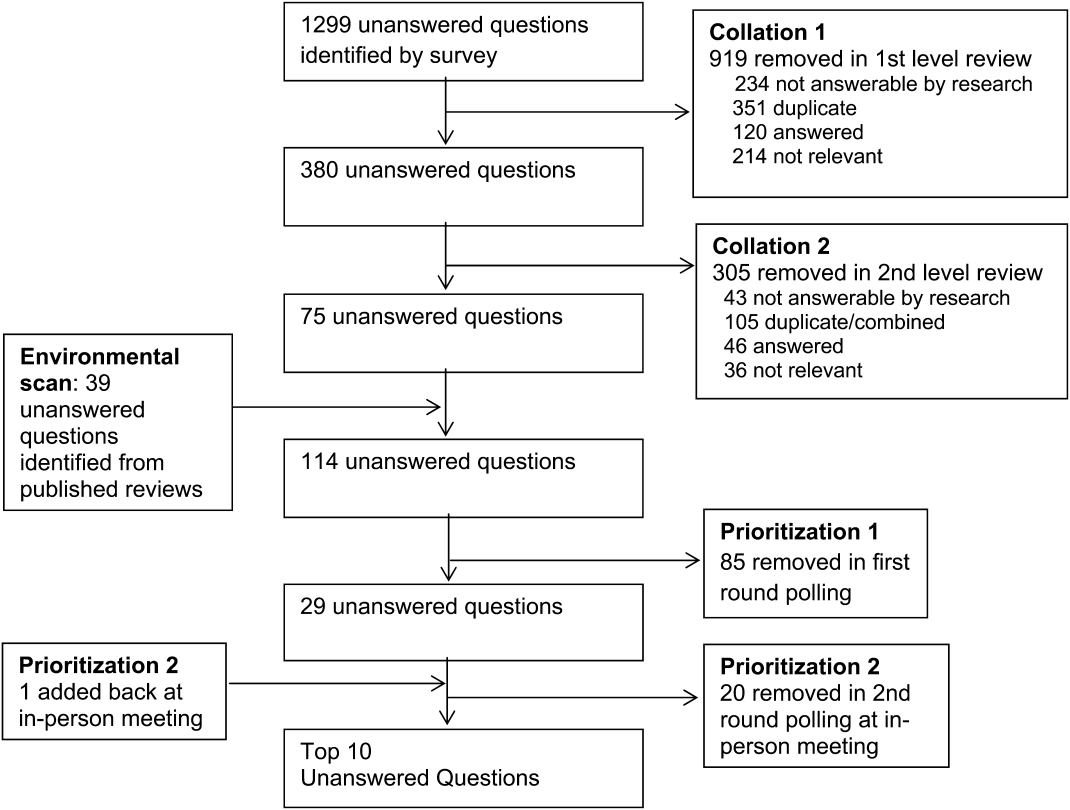
In the first round of prioritization, this list of 114 questions was emailed to each stakeholder organization (Table 1). After the stakeholder voting process was completed, 29 unanswered questions remained (see Supporting Information, Appendix C, in the online version of this article). These questions were refined and prioritized in the in‐person meeting to create the final list of 10 questions. The stakeholders present in the meeting represented 13 organizations (Table 1). Using the NGT with several rounds of small group breakouts and large group deliberation, 9 of the top 10 questions were selected from the list of 29. One additional highly relevant question that had been removed earlier in the collation process regarding workforce was added back by the stakeholder group.
This prioritized research agenda appears in Table 2 and below, organized alphabetically by topic.
- Advanced care planning: What approaches for determining and communicating goals of care across and within healthcare settings are most effective in promoting goal‐concordant care for hospitalized older patients?
- Care transitions: What is the comparative effectiveness of transitional care models on patient‐centered outcomes for hospitalized older adults?
- Delirium: What practices are most effective for consistent recognition, prevention, and treatment of delirium subtypes among hospitalized older adults?
- Dementia: Does universal assessment of hospitalized older adults for cognitive impairment (eg, at presentation and/or discharge) lead to more appropriate application of geriatric care principles and improve patient‐centered outcomes?
- Depression: Does identifying depressive symptoms during a hospital stay and initiating a therapeutic plan prior to discharge improve patient‐centered and/or disease‐specific outcomes?
- Medications: What systems interventions improve medication management for older adults (ie, appropriateness of medication choices and dosing, compliance, cost) in the hospital and postacute care?
- Models of care: For which populations of hospitalized older adults does systematic implementation of geriatric care principles/processes improve patient‐centered outcomes?
- Physical function: What is the comparative effectiveness of interventions that promote in‐hospital mobility, improve and preserve physical function, and reduce falls among older hospitalized patients?
- Surgery: What perioperative strategies can be used to optimize care processes and improve outcomes in older surgical patients?
- Training: What is the most effective approach to training hospital‐based providers in geriatric and palliative care competencies?
| Topic | Scope of Problem | What Is known | Unanswered Question | Proposed Dimensions |
|---|---|---|---|---|
| ||||
| Advanced‐care planning | Older persons who lack decision‐making capacity often do not have surrogates or clear goals of care documented.[19] Advanced‐care directives are associated with an increase in patient autonomy and empowerment, and although 15% to 25% of adults completed the documentation in 2004,[20] a recent study found completion rates have increased to 72%.[21] | Nursing home residents with advanced directives are less likely to be hospitalized.[22, 23] Advanced directive tools, such as POLST, work to translate patient preferences to medical order.[24] standardized patient transfer tools may help to improve transitions between nursing homes and hospitals.[25] However, advanced care planning fails to integrate into courses of care if providers are unwilling or unskilled in using advanced care documentation.[26] | What approaches for determining and communicating goals of care across and within healthcare settings are most effective in promoting goal‐concordant care for hospitalized older patients? | Potential interventions: |
| Decision aids | ||||
| Standard interdisciplinary advanced care planning approach | ||||
| Patient advocates | ||||
| Potential outcomes might include: | ||||
| Completion of advanced directives and healthcare power of attorney | ||||
| Patient‐centered outcomesa | ||||
| Care transitions | Hospital readmission from home and skilled nursing facilities occurs within 30 days in up to a quarter of patients.[27, 28] The discharge of complex older hospitalized patients is fraught with challenges. The quality of the hospital discharge process can influence outcomes for vulnerable older patients.[29, 30, 31, 32] Studies measuring the quality of hospital discharge frequently find deficits in documentation of assessment of geriatric syndromes,[33] poor patient/caregiver understanding,[34, 35] and poor communication and follow‐up with postacute providers.[35, 36, 37, 38] | As many as 10 separate domains may influence the success of a discharge.[39] There is limited evidence, regarding quality‐of‐care transitions for hospitalized older patients. The Coordinated‐Transitional Care Program found that follow‐up with telecommunication decreased readmission rates and improved transitional care for a high‐risk condition veteran population.[40] There is modest evidence for single interventions,[41] whereas the most effective hospital‐to‐community care interventions address multiple processes in nongeriatric populations.[39, 42, 43] | What is the comparative effectiveness of the transitional care models on patient‐centered outcomes for hospitalized older adults? | Possible models: |
| Established vs novel care‐transition models | ||||
| Disease‐specific vs general approaches | ||||
| Accountable care models | ||||
| Caregiver and family engagement | ||||
| Community engagement | ||||
| Populations of interest: | ||||
| Patients with dementia | ||||
| Patients with multimorbidity | ||||
| Patients with geriatric syndromes | ||||
| Patients with psychiatric disease | ||||
| Racially and ethnically diverse patients | ||||
| Outcomes: | ||||
| Readmission | ||||
| Other adverse events | ||||
| Cost and healthcare utilization | ||||
| Patient‐centered outcomesa | ||||
| Delirium | Among older inpatients, the prevalence of delirium varies with severity of illness. Among general medical patients, in‐hospital prevalence ranges from 10% to 25 %.[44, 45] In the ICU, prevalence estimates are higher, ranging from 25% to as high as 80%.[46, 47] Delirium independently predicts increased length of stay,[48, 49] long‐term cognitive impairment,[50, 51] functional decline,[51] institutionalization,[52] and short‐ and long‐term mortality.[52, 53, 54] | Multicomponent strategies have been shown to be effective in preventing delirium. A systematic review of 19 such interventions identified the most commonly included such as[55]: early mobilization, nutrition supplements, medication review, pain management, sleep enhancement, vision/hearing protocols, and specialized geriatric care. Studies have included general medical patients, postoperative patients, and patients in the ICU. The majority of these studies found reductions in either delirium incidence (including postoperative), delirium prevalence, or delirium duration. Although medications have not been effective in treating delirium in general medical patients,[48] the choice and dose of sedative agents has been shown to impact delirium in the ICU.[56, 57, 58] | What practices are most effective for consistent recognition, prevention, and treatment of delirium subtypes (hypoactive, hyperactive, and mixed) among hospitalized older adults? | Outcomes to examine: |
| Delirium incidence (including postoperative) | ||||
| Delirium duration | ||||
| Delirium‐/coma‐free days | ||||
| Delirium prevalence at discharge | ||||
| Subsyndromal delirium | ||||
| Potential prevention and treatment modalities: | ||||
| Family education or psychosocial interventions | ||||
| Pharmacologic interventions | ||||
| Environmental modifications | ||||
| Possible areas of focus: | ||||
| Special populations | ||||
| Patients with varying stages of dementia | ||||
| Patients with multimorbidity | ||||
| Patients with geriatric syndromes | ||||
| Observation patients | ||||
| Diverse settings | ||||
| Emergency department | ||||
| Perioperative | ||||
| Skilled nursing/rehab/long‐term acute‐care facilities | ||||
| Dementia | 13% to 63% of older persons in the hospital have dementia.[59] Dementia is often unrecognized among hospitalized patients.[60] The presence of dementia is associated with a more rapid functional decline during admission and delayed hospital discharge.[59] Patients with dementia require more nursing hours, and are more likely to have complications[61] or die in care homes rather than in their preferred site.[59] | Several tools have been validated to screen for dementia in the hospital setting.[62] Studies have assessed approaches to diagnosing delirium in hospitalized patients with dementia.[63] Cognitive and functional stimulation interventions may have a positive impact on reducing behavioral issues.[64, 65] | Does universal assessment of hospitalized older adults for cognitive impairment (eg, at presentation and/or discharge) lead to more appropriate application of geriatric care principles and improve patient centered outcomes? | Potential interventions: |
| Dementia or delirium care | ||||
| Patient/family communication and engagement strategies | ||||
| Maintenance/recovery of independent functional status | ||||
| Potential outcomes: | ||||
| Patient‐centered outcomesa | ||||
| Length of stay, cost, and healthcare utilization (including palliative care) | ||||
| Immediate invasive vs early conservative treatments pursued | ||||
| Depression | Depression is a common geriatric syndrome among acutely ill older patients, occurring in up to 45% of patients.[66, 67] Rates of depression are similar among patients discharged following a critical illness, with somatic, rather than cognitive‐affective complaints being the most prevalent.[68] Depression among inpatients or immediately following hospitalization independently predicts worse functional outcomes,[69] cognitive decline,[70] hospital readmission,[71, 72] and long‐term mortality.[69, 73] Finally, geriatric patients are known to respond differently to medical treatment.[74, 75] | Although highly prevalent, depression is poorly recognized and managed in the inpatient setting. Depression is recognized in only 50% of patients, with previously undiagnosed or untreated depression being at highest risk for being missed.[76] The role of treatment of depression in the inpatient setting is poorly understood, particularly for those with newly recognized depression or depressive symptoms. Some novel collaborative care and telephone outreach programs have led to increases in depression treatment in patients with specific medical and surgical conditions, resulting in early promising mental health and comorbid outcomes.[77, 78] The efficacy of such programs for older patients is unknown. | Does identifying depressive symptoms during a hospital stay and initiating a therapeutic plan prior to discharge improve patient‐centered and/or disease‐specific outcomes? | Possible areas of focus: |
| Comprehensive geriatric and psychosocial assessment; | ||||
| Inpatient vs outpatient initiation of pharmacological therapy | ||||
| Integration of confusion assessment method into therapeutic approaches | ||||
| Linkages with outpatient mental health resources | ||||
| Medications | Medication exposure, particularly potentially inappropriate medications, is common in hospitalized elders.[79] Medication errorsof dosage, type, and discrepancy between what a patient takes at home and what is known to his/her prescribing physicianare common and adversely affects patient safety.[80] Geriatric populations are disproportionately affected, especially those taking more than 5 prescription medications per day.[81] | Numerous strategies including electronic alerts, screening protocols, and potentially inappropriate medication lists (Beers list, STOPP) exist, though the optimal strategies to limit the use of potentially inappropriate medications is not yet known.[82, 83, 84] | What systems interventions improve medication management for older adults (ie, appropriateness of medication choices and dosing, compliance, cost) in hospital and post‐acute care? | Possible areas of focus: |
| Use of healthcare information technology | ||||
| Communication across sites of care | ||||
| Reducing medication‐related adverse events | ||||
| Engagement of family caregivers | ||||
| Patient‐centered strategies to simplify regimens | ||||
| Models of care | Hospitalization marks a time of high risk for older patients. Up to half die during hospitalization or within the year following the hospitalization. There is high risk of nosocomial events, and more than a third experience a decline in health resulting in longer hospitalizations and/or placement in extended‐care facilities.[73, 85, 86] | Comprehensive inpatient care for older adults (acute care for elders units, geriatric evaluation and management units, geriatric consultation services) were studied in 2 meta‐analyses, 5 RCTs, and 1 quasiexperimental study and summarized in a systematic review.[87] The studies reported improved quality of care (1 of 1 article), quality of life (3 of 4), functional autonomy (5 of 6), survival (3 of 6), and equal or lower healthcare utilization (7 of 8). | For which populations of hospitalized older adults does systematic implementation of geriatric care principles/processes improve patient‐centered outcomes? | Potential populations: |
| Patients of the emergency department, critical care, perioperative, and targeted medical/surgical units | ||||
| Examples of care principles: | ||||
| Geriatric assessment, early mobility, medication management, delirium prevention, advanced‐care planning, risk‐factor modification, caregiver engagement | ||||
| Potential outcomes: | ||||
| Patient‐centered outcomesa | ||||
| Cost | ||||
| Physical function | Half of older patients will lose functional capacity during hospitalization.[88] Loss of physical function, particularly of lower extremities, is a risk factor for nursing home placement.[89, 90] Older hospitalized patients spend the majority (up to 80%) of their time lying in bed, even when they are capable of walking independently.[91] | Loss of independences with ADL capabilities is associated with longer hospital stays, higher readmission rates, and higher mortality risk.[92] Excessive time in bed during a hospital stay is also associated with falls.[93] Often, hospital nursing protocols and physician orders increase in‐hospital immobility in patients.[91, 94] However, nursing‐driven mobility protocols can improve functional outcomes of older hospitalized patients.[95, 96] | What is the comparative effectiveness of interventions that promote in‐hospital mobility, improve and preserve physical function, and reduce falls among older hospitalized patients? | Potential interventions: |
| Intensive physical therapy | ||||
| Incidental functional training | ||||
| Restraint reduction | ||||
| Medication management | ||||
| Potential outcomes: | ||||
| Discharge location | ||||
| Delirium, pressure ulcers, and falls | ||||
| Surgery | An increasing number of persons over age 65 years are undergoing surgical procedures.[97] These persons are at increased risk for developing delirium/cogitative dysfunction,[98] loss of functional status,[99] and exacerbations of chronic illness.[97] Additionally, pain management may be harder to address in this population.[100] Current outcomes may not reflect the clinical needs of elder surgical patients.[101] | Tailored drug selection and nursing protocols may prevent delirium.[98] Postoperative cognitive dysfunction may require weeks for resolution. Identifying frail patients preoperatively may lead to more appropriate risk stratification and improved surgical outcomes.[99] Pain management strategies focused on mitigating cognitive impact and other effects may also be beneficial.[100] Development of risk‐adjustment tools specific to older populations, as well as measures of frailty and patient‐centered care, have been proposed.[101] | What perioperative strategies can be used to optimize care processes and improve outcomes in older surgical patients? | Potential strategies: |
| Preoperative risk assessment and optimization for frail or multimorbid older patients | ||||
| Perioperative management protocols for frail or multimorbid older patients | ||||
| Potential outcomes: | ||||
| Postoperative patient centered outcomesa | ||||
| Perioperative cost, healthcare utilization | ||||
| Training | Adults over age 65 years comprise 13.2 % of the US population, but account for >30% of hospital discharges and 50% of hospital days.[86, 102, 103] By 2030, there will only be 1 geriatrician for every 3798 Americans >75 years.[4] Between 1997 and 2006, the odds that a hospitalist would treat a hospitalized Medicare patient rose 29% per year.[3] | Train the trainer programs for physicians include the CHAMP, the AGESP, and the PAGE. Education for nurses include the NICHE. Outcomes include improved self‐confidence, attitudes, teaching skills, and geriatric care environment.[104, 105, 106] | What is the most effective approach to training hospital‐based providers in geriatric and palliative care competencies? | Potential interventions: |
| Mentored implementation | ||||
| Train the trainer | ||||
| Technical support | ||||
Table 2 also contains a capsule summary of the scope of the problem addressed by each research priority, a capsule summary of related work in the content area (what is known) not intended as a systematic review, and proposed dimensions or subquestions suggested by the stakeholders at the final prioritization meeting
DISCUSSION
Older hospitalized patients account for an increasing number and proportion of hospitalized patients,[1, 2] and hospitalists increasingly are responsible for inpatient care for this population.[3] The knowledge required for hospitalists to deliver optimal care and improve outcomes has not kept pace with the rapid growth of either hospitalists or hospitalized elders. Through a rigorous prioritization process, we identified 10 areas that deserve the highest priority in directing future research efforts to improve care for the older hospitalized patient. Assessment, prevention, and treatment of geriatric syndromes in the hospital account for almost half of the priority areas. Additional research is needed to improve advanced care planning, develop new care models, and develop training models for future hospitalists competent in geriatric and palliative care competencies.
A decade ago, the American Geriatric Society and the John A. Hartford Foundation embarked upon a research agenda aimed at improving the care of hospitalized elders cared for by specialists (ie, New Frontiers in Geriatrics Research: An Agenda for Surgical and Related Medical Specialties).[9] This effort differed in many important ways from the current priortization process. First, the New Frontiers agenda focused upon specific diseases, whereas the ACOP agenda addresses geriatric syndromes that cut across multiple diseases. Second, the New Frontiers agenda was made by researchers and based upon published literature, whereas the ACOP agenda involved the input of multiple stakeholders. Finally, the New Frontiers prioritized a research agenda across a number of surgical specialties, emergency medicine, and geriatric rehabilitation. Hospital medicine, however, was still early in its development and was not considered a unique specialty. Since that time, hospital medicine has matured into a unique specialty, with increased numbers of hospitalists,[3] increased research in hospital medicine,[17] and a separate recertification pathway for internal medicine licensure.[18] To date, there has not been a similar effort performed to direct geriatric research efforts for hospital medicine.
For researchers working in the field of hospital medicine, this list of topics has several implications. First, as hospitalists are commonly generalists, hospitalist researchers may be particularly well‐suited to study syndromes that cut across specialties. However, this does raise concerns about funding sources, as most National Institutes of Health institutes are disease‐focused. Funders that are not disease‐focused such as PCORI, National Institute on Aging, National Institute of Nursing Research, and Agency for Healthcare Research and Quality, and private foundations (Hartford, Robert Wood Johnson, and Commonwealth) may be more fruitful sources of funding for this work, but funding may be challenging. Nonetheless, the increased focus on patient‐centered work may increase funders' interest in such work. Second, the topics on this list would suggest that interventions will not be pharmacologic, but will focus on nonpharmacologic, behavioral, and social interventions. Similarly, outcomes of interest must expand beyond utilization metrics such as length of stay and mortality, to include functional status and symptom management, and goal‐concordant care. Therefore, research in geriatric acute care will necessarily be multidisciplinary.
Although these 10 high‐priority areas have been selected, this prioritized list is inherently limited by our methodology. First, our survey question was not focused on a disease state, and this wording may have resulted in the list favoring geriatric syndromes rather than common disease processes. Additionally, the resulting questions encompass large research areas and not specific questions about discrete interventions. Our results may also have been skewed by the types of engaged respondents who participated in the consultation, collating, and prioritization phases. In particular, we had a large response from geriatric medicine nurses, whereas some stakeholder groups provided no survey responses. Thus, these respondents were not representative of all possible stakeholders, nor were the survey respondents necessarily representative of each of their organizations. Nonetheless, the participants self‐identified as representative of diverse viewpoints that included patients, caregivers, and advocacy groups, with the majority of stakeholder organizations remaining engaged through the completion of the process. Thus, the general nature of this agenda helps us focus upon larger areas of importance, leaving researchers the flexibility to choose to narrow the focus on a specific research question that may include potential interventions and unique outcomes. Finally, our methodology may have inadvertently limited the number of patient and family caregiver voices in the process given our approach to large advocacy groups, our desire to be inclusive of healthcare professional organizations, and our survey methodology. Other methodologies may have reached more patients and caregivers, yet many healthcare professionals have served as family caregivers to frail elders requiring hospitalization and may have been in an ideal position to answer the survey.
In conclusion, several forces are shaping the future of acute inpatient care. These include the changing demographics of the hospitalized patient population, a rapid increase in the proportion of multimorbid hospitalized older adults, an inpatient workforce (hospitalists, generalists, and subspecialists) with potentially limited geriatrics training, and gaps in evidence‐based guidance to inform diagnostic and therapeutic decision making for acutely ill older patients. Training programs in hospital medicine should be aware of and could benefit from the resulting list of unanswered questions. Our findings also have implications for training to enrich education in geriatrics. Moreover, there is growing recognition that patients and other stakeholders deserve a greater voice in determining the direction of research. In addition to efforts to improve patient‐centeredness of research, these areas have been uniquely identified by stakeholders as important, and therefore are in line with newer priorities of PCORI. This project followed a road map resulting in a patient‐centered research agenda at the intersection of hospital medicine and geriatric medicine.[7] In creating this agenda, we relied heavily on the framework proposed by PCORI. We propose to pursue a dissemination and evaluation strategy for this research agenda as well as additional prioritization steps. We believe the adoption of this methodology will create a knowledge base that is rigorously derived and most relevant to the care of hospitalized older adults and their families. Its application will ultimately result in improved outcomes for hospitalized older adults.
Acknowledgements
The authors acknowledge Claudia Stahl, Society of Hospital Medicine; Cynthia Drake, University of Colorado; and the ACOP stakeholder organizations.
Disclosures: This work was supported by the Association of Specialty Professors/American Society of Internal Medicine and the John A. Hartford Foundation. Dr. Vasilevskis was supported by the National Institute on Aging of the National Institutes of Health under award number K23AG040157 and the Veterans Affairs Clinical Research Center of Excellence, and the Geriatric Research, Education and Clinical Center (GRECC). Dr. Vasilevskis' institution receives grant funding for an aspect of submitted work. Dr. Meltzer is a PCORI Methodology Committee member. The content is solely the responsibility of the authors and does not necessarily represent the official views of the National Institutes of Health or the Department of Veterans' Affairs. The authors report no conflicts of interest.
- , , , , . National Hospital Discharge Survey: 2007 summary. Natl Health Stat Report. 2010(29):1–20, 24.
- Centers for Medicare 2012. Available at: http://www.cms.gov/Research‐Statistics‐Data‐and‐Systems/Statistics‐Trends‐and‐Reports/Chronic‐Conditions/Downloads/2012Chartbook.pdf. Accessed December 12, 2014.
- , , , . Growth in the care of older patients by hospitalists in the United States. N Engl J Med. 2009;360(11):1102–1112.
- , . A revelation of numbers: will America's eldercare workforce be ready to care for an aging America? Generations. 2010;34(4):11–19.
- Patient‐Centered Outcomes Research Institute Methodology Committee. The PCORI methodology report. Available at: http://www.pcori.org/assets/2013/11/PCORI‐Methodology‐Report.pdf. Published November 2013. Accessed December 19, 2013.
- The James Lind Alliance. JLA method. Available at: http://www.lindalliance.org/JLA_Method.asp. Accessed December 19, 2013.
- , , , , . Road map to a patient‐centered research agenda at the intersection of hospital medicine and geriatric medicine. J Gen Intern Med. 2014;29(6):926–931.
- Patient‐Centered Outcomes Research Institute. About us. Available at: http://www.pcori.org/about‐us. Accessed February 23, 2015.
- , , . New Frontiers of Geriatrics Research: An Agenda for Surgical and Related Medical Specialties. New York, NY: American Geriatrics Society; 2004.
- , , , . Linking the NIH strategic plan to the research agenda for social workers in health and aging. J Gerontol Soc Work. 2010;53(1):77–93.
- , . Assessing the capacity to make everyday decisions: a guide for clinicians and an agenda for future research. Am J Geriatr Psychiatry. 2007;15(2):101–111.
- , , , et al. Practitioners' views on elder mistreatment research priorities: recommendations from a Research‐to‐Practice Consensus conference. J Elder Abuse Negl. 2011;23(2):115–126.
- , . The intersection between geriatrics and palliative care: a call for a new research agenda. J Am Geriatr Soc. 2005;53(9):1593–1598.
- . The cancer aging interface: a research agenda. J Clin Oncol. 2007;25(14):1945–1948.
- , , , . Clinical care of persons with dementia in the emergency department: a review of the literature and agenda for research. J Am Geriatr Soc. 2012;60(9):1742–1748.
- , . A group process model for problem identification and program planning. J Appl Behav Sci. 1971;7(4):466–492.
- , , , , . Research and publication trends in hospital medicine. J Hosp Med. 2014;9(3):148–154.
- . ABFM and ABIM to jointly participate in recognition of focused practice (rfp) in hospital medicine pilot approved by abms. Ann Fam Med. 2010;8(1):87.
- , , , . Medical decision‐making for older adults without family. J Am Geriatr Soc. 2012;60(11):2144–2150.
- , , , , , . Promoting advance directives among elderly primary care patients. J Gen Intern Med. 2004;19(9):944–951.
- , , . Advance directive completion by elderly Americans: a decade of change. J Am Geriatr Soc. 2014;62(4):706–710.
- , . Care transitions by older adults from nursing homes to hospitals: implications for long‐term care practice, geriatrics education, and research. J Am Med Dir Assoc. 2010;11(4):231–238.
- , , , . Decisions to hospitalize nursing home residents dying with advanced dementia. J Am Geriatr Soc. 2005;53(8):1396–1401.
- , , , , , . A comparison of methods to communicate treatment preferences in nursing facilities: traditional practices versus the physician orders for life‐sustaining treatment program. J Am Geriatr Soc. 2010;58(7):1241–1248.
- , , , , . Interventions to improve transitional care between nursing homes and hospitals: a systematic review. J Am Geriatr Soc. 2010;58(4):777–782.
- , , . Opening end‐of‐life discussions: how to introduce Voicing My CHOiCES, an advance care planning guide for adolescents and young adults [published online ahead of print March 13, 2014]. Palliat Support Care. doi: 10.1017/S1478951514000054.
- , , , . The revolving door of rehospitalization from skilled nursing facilities. Health Aff (Millwood). 2010;29(1):57–64.
- , , . Rehospitalizations among patients in the Medicare fee‐for‐service program. N Engl J Med. 2009;360(14):1418–1428.
- , , , et al. Predictors of rehospitalization among elderly patients admitted to a rehabilitation hospital: the role of polypharmacy, functional status, and length of stay. J Am Med Dir Assoc. 2013;14(10):761–767.
- , , , et al. Mobility after hospital discharge as a marker for 30‐day readmission. J Gerontol A Biol Sci Med Sci. 2013;68(7):805–810.
- , , , , . The association between the quality of inpatient care and early readmission: a meta‐analysis of the evidence. Med Care. 1997;35(10):1044–1059.
- , , , , , . Association of impaired functional status at hospital discharge and subsequent rehospitalization. J Hosp Med. May 2014;9(5):277–282.
- , , , , , . A prospective cohort study of geriatric syndromes among older medical patients admitted to acute care hospitals. J Am Geriatr Soc. 2011;59(11):2001–2008.
- , , , et al. Hospital discharge instructions: comprehension and compliance among older adults. J Gen Intern Med. 2014;29(11):1491–1498.
- , , , et al. Problems after discharge and understanding of communication with their primary care physicians among hospitalized seniors: a mixed methods study. J Hosp Med. 2010;5(7):385–391.
- , , , et al. Communication and information deficits in patients discharged to rehabilitation facilities: an evaluation of five acute care hospitals. J Hosp Med. 2009;4(8):E28–E33.
- , , , , , . The consequences of poor communication during transitions from hospital to skilled nursing facility: a qualitative study. J Am Geriatr Soc. 2013;61(7):1095–1102.
- , , , , , . Deficits in communication and information transfer between hospital‐based and primary care physicians: implications for patient safety and continuity of care. JAMA. 2007;297(8):831–841.
- , , , . Moving beyond readmission penalties: creating an ideal process to improve transitional care. J Hosp Med. 2013;8(2):102–109.
- , , , et al. Low‐cost transitional care with nurse managers making mostly phone contact with patients cut rehospitalization at a VA hospital. Health Aff (Millwood). 2012;31(12):2659–2668.
- , , , et al. Transitional care interventions to prevent readmissions for persons with heart failure: a systematic review and meta‐analysis. Ann Intern Med. 2014;160(11):774–784.
- , , , , . Interventions to reduce 30‐day rehospitalization: a systematic review. Ann Intern Med. 2011;155(8):520–528.
- , , , , , . Hospital‐initiated transitional care interventions as a patient safety strategy: a systematic review. Ann Intern Med. 2013;158(5 pt 2):433–440.
- , , , . Epidemiology and risk factors for delirium across hospital settings. Best Pract Res Clin Anaesthesiol. 2012;26(3):277–287.
- , , , , . Does delirium contribute to poor hospital outcomes? A three‐site epidemiologic study. J Gen Intern Med. 1998;13(4):234–242.
- , , , . Incidence, risk factors and consequences of ICU delirium. Intensive Care Med. 2007;33(1):66–73.
- , , , et al. Delirium in mechanically ventilated patients: validity and reliability of the confusion assessment method for the intensive care unit (CAM‐ICU). JAMA. 2001;286(21):2703–2710.
- , , , et al. Impact and recognition of cognitive impairment among hospitalized elders. J Hosp Med. 2010;5(2):69–75.
- , , , et al. The impact of delirium in the intensive care unit on hospital length of stay. Intensive Care Med. 2001;27(12):1892–1900.
- , , . Long‐term cognitive impairment after critical illness. N Engl J Med. 2014;370(2):185–186.
- , , , et al. Delirium in the ICU and subsequent long‐term disability among survivors of mechanical ventilation. Crit Care Med. 2014;42(2):369–377.
- , , , , , . Delirium in elderly patients and the risk of postdischarge mortality, institutionalization, and dementia: a meta‐analysis. JAMA. 2010;304(4):443–451.
- , , , et al. Delirium as a predictor of mortality in mechanically ventilated patients in the intensive care unit. JAMA. 2004;291(14):1753–1762.
- , , , , , . Days of delirium are associated with 1‐year mortality in an older intensive care unit population. Am J Respir Crit Care Med. 2009;180(11):1092–1097.
- , . In‐facility delirium prevention programs as a patient safety strategy: a systematic review. Ann Intern Med. 2013;158(5 pt 2):375–380.
- , , , et al. Dexmedetomidine vs midazolam for sedation of critically ill patients: a randomized trial. JAMA. 2009;301(5):489–499.
- , , , et al. Effect of sedation with dexmedetomidine vs lorazepam on acute brain dysfunction in mechanically ventilated patients: the MENDS randomized controlled trial. JAMA. 2007;298(22):2644–2653.
- , , , , , . Protocolized intensive care unit management of analgesia, sedation, and delirium improves analgesia and subsyndromal delirium rates. Anesth Analg. 2010;111(2):451–463.
- , . A systematic review of the prevalence, associations and outcomes of dementia in older general hospital inpatients. Int Psychogeriatr. 2011;23(3):344–355.
- , , , . Cognitive impairment is undetected in medical inpatients: a study of mortality and recognition amongst healthcare professionals. BMC Geriatr. 2012;12:47.
- , , . How can we keep patients with dementia safe in our acute hospitals? A review of challenges and solutions. J R Soc Med. 2013;106(9):355–361.
- , , . Screening for dementia in general hospital inpatients: a systematic review and meta‐analysis of available instruments. Age Ageing. 2013;42(6):689–695.
- , , , et al. Tools to detect delirium superimposed on dementia: a systematic review. J Am Geriatr Soc. 2012;60(11):2005–2013.
- , , , , , . Functional analysis‐based interventions for challenging behaviour in dementia. Cochrane Database Syst Rev. 2012;2:CD006929.
- , , , . Cognitive stimulation to improve cognitive functioning in people with dementia. Cochrane Database Syst Rev. 2012;2:CD005562.
- , , , et al. The prevalence and correlates of major and minor depression in older medical inpatients. J Am Geriatr Soc. 2005;53(8):1344–1353.
- , , , , , . Major depressive disorder in hospitalized medically ill patients: an examination of young and elderly male veterans. J Am Geriatr Soc. 1991;39(9):881–890.
- , , , et al. Depression, post‐traumatic stress disorder, and functional disability in survivors of critical illness in the BRAIN‐ICU study: a longitudinal cohort study. Lancet Respir Med. 2014;2(5):369–379.
- , , , et al. Depressive symptoms after hospitalization in older adults: function and mortality outcomes. J Am Geriatr Soc. 2012;60(12):2254–2262.
- , , , , . 12‐month cognitive outcomes of major and minor depression in older medical patients. Am J Geriatr Psychiatry. 2008;16(9):742–751.
- , , , et al. Depression is a risk factor for rehospitalization in medical inpatients. Prim Care Companion J Clin Psychiatry. 2007;9(4):256–262.
- , , , , , . Dose‐response relationship between depressive symptoms and hospital readmission. J Hosp Med. 2014;9(6):358–364.
- , , , , , . Depressive symptoms and 3‐year mortality in older hospitalized medical patients. Ann Intern Med. 1999;130(7):563–569.
- , , , et al. Support for the vascular depression hypothesis in late‐life depression: results of a 2‐site, prospective, antidepressant treatment trial. Arch Gen Psychiatry. 2010;67(3):277–285.
- , , , , , . Executive dysfunction and the course of geriatric depression. Biol Psychiatry. 2005;58(3):204–210.
- , , , , . Recognition of depression in older medical inpatients. J Gen Intern Med. 2007;22(5):559–564.
- , , , , , . A collaborative care depression management program for cardiac inpatients: depression characteristics and in‐hospital outcomes. Psychosomatics. 2011;52(1):26–33.
- , , , , , . Impact of a depression care management program for hospitalized cardiac patients. Circ Cardiovasc Qual Outcomes. 2011;4(2):198–205.
- , , , et al. Potentially inappropriate medication use in hospitalized elders. J Hosp Med. 2008;3(2):91–102.
- , , , , , . Prevalence, incidence and nature of prescribing errors in hospital inpatients: a systematic review. Drug Saf. 2009;32(5):379–389.
- , . Minimizing adverse drug events in older patients. Am Fam Physician. 2007;76(12):1837–1844.
- , , , , . STOPP (Screening Tool of Older Person's Prescriptions) and START (Screening Tool to Alert doctors to Right Treatment). Consensus validation. Int J Clin Pharmacol Ther. 2008;46(2):72–83.
- American Geriatrics Society 2012 Beers Criteria Update Expert Panel. American Geriatrics Society updated Beers Criteria for potentially inappropriate medication use in older adults. J Am Geriatr Soc. 2012;60(4):616–631.
- , , , . Preventing potentially inappropriate medication use in hospitalized older patients with a computerized provider order entry warning system. Arch Intern Med. 2010;170(15):1331–1336.
- . Hazards of Hospitalization of the Elderly. Ann Intern Med. 1993;118(3):219–223.
- . Improving health care for older persons. Ann Intern Med. 2003;139(5 part 2):421–424.
- , , , , , . Successful models of comprehensive care for older adults with chronic conditions: evidence for the Institute of Medicine's "retooling for an aging America" report. J Am Geriatr Soc. 2009;57(12):2328–2337.
- , , , et al. Recovery of activities of daily living in older adults after hospitalization for acute medical illness. J Am Geriatr Soc. 2008;56(12):2171–2179.
- , , , . Changes in functional status and the risks of subsequent nursing home placement and death. J Gerontol. 1993;48(3):S94–S101.
- , , . Risk factors for nursing home placement in a population‐based dementia cohort. J Am Geriatr Soc. 2000;48(5):519–525.
- , , , . The underrecognized epidemic of low mobility during hospitalization of older adults. J Am Geriatr Soc. 2009;57(9):1660–1665.
- , , , , . A systematic review of predictors and screening instruments to identify older hospitalized patients at risk for functional decline. J Clin Nurs. 2007;16(1):46–57.
- . Immobility and falls. Clin Geriatr Med. 1998;14(4):699–726.
- , , . Prevalence and outcomes of low mobility in hospitalized older patients. J Am Geriatr Soc. 2004;52(8):1263–1270.
- , , . Impact of a nurse‐driven mobility protocol on functional decline in hospitalized older adults. J Nurs Care Qual. 2009;24(4):325–331.
- , . Impact of early mobilization protocol on the medical‐surgical inpatient population: an integrated review of literature. Clin Nurse Spec. 2012;26(2):87–94.
- , , , . The aging population and its impact on the surgery workforce. Ann Surg. 2003;238(2):170–177.
- . Perioperative care of the elderly patient: an update. Cleve Clin J Med. 2009;76(suppl 4):S16–S21.
- , , . Frailty in the older surgical patient: a review. Age Ageing. 2012;41(2):142–147.
- . The assessment and management of peri‐operative pain in older adults. Anaesthesia. 2014;69(suppl 1):54–60.
- , . National Research Strategies: what outcomes are important in peri‐operative elderly care? Anaesthesia. 2014;69(suppl 1):61–69.
- , . 2002 National Hospital Discharge Survey. Adv Data. 2004;342:1–30.
- , . Hospitalization in the United States, 2002. Rockville, MD: Agency for Healthcare Research and Quality; 2005.
- , , , et al. The Curriculum for the Hospitalized Aging Medical Patient program: a collaborative faculty development program for hospitalists, general internists, and geriatricians. J Hosp Med. 2008;3(5):384–393.
- , . Advancement of geriatrics education. J Hosp Med. 2011;6(6):370.
- , , , , , . Advancing geriatrics education: an efficient faculty development program for academic hospitalists increases geriatric teaching. J Hosp Med. 2010;5(9):541–546.
Older adults with high levels of medical complexity occupy an increasing fraction of beds in acute‐care hospitals in the United States.[1, 2] By 2007, patients age 65 years and older accounted for nearly half of adult inpatient days of care.[1] These patients are commonly cared for by hospitalists who number more than 40,000.[3] Although hospitalists are most often trained in internal medicine, they have typically received limited formal geriatrics training. Increasingly, access to experts in geriatric medicine is limited.[4] Further, hospitalists and others who practice in acute care are limited by the lack of research to address the needs of the older adult population, specifically in the diagnosis and management of conditions encountered during acute illness.
To better support hospitalists in providing acute inpatient geriatric care, the Society of Hospital Medicine (SHM) partnered with the Association of Specialty Professors to develop a research agenda to bridge this gap. Using methodology from the James Lind Alliance (JLA) and the Patient Centered Outcomes Research Institute (PCORI), the SHM joined with older adult advocacy groups, professional societies of providers, and funders to create a geriatric‐focused acute‐care research agenda, highlighting 10 key research questions.[5, 6, 7] The goal of this approach was to produce and promote high integrity, evidence‐based information that comes from research guided by patients, caregivers, and the broader healthcare community.[8] In this article, we describe the methodology and results of this agenda‐setting process, referred to as the Acute Care of Older Patients (ACOP) Priority Setting Partnership.
METHODS
Overview
This project focused on topic generation, the first step in the PCORI framework for identification and prioritization of research areas.[5] We employed a specific and defined methodology to elicit and prioritize potential research topics incorporating input from representatives of older patients, family caregivers, and healthcare providers.[6]
To elicit this input, we chose a collaborative and consultative approach to stakeholder engagement, drawing heavily from the published work of the JLA, an initiative promoting patient‐clinician partnerships in health research developed in the United Kingdom.[6] We previously described the approach elsewhere.[7]
The ACOP process for determining the research agenda consisted of 4 steps: (1) convene, (2) consult, (3) collate, and (4) prioritize.[6] Through these steps, detailed below, we were able to obtain input from a broad group of stakeholders and engage the stakeholders in a process of reducing and refining our research questions.
Convene
The steering committee (the article's authors) convened a stakeholder partnership group that included stakeholders representing patients and caregivers, advocacy organizations for the elderly, organizations that address diseases and conditions common among hospitalized older patients, provider professional societies (eg, hospitalists, subspecialists, and nurses and social workers), payers, and funders. Patient, caregiver, and advocacy organizations were identified based on their engagement in aging and health policy advocacy by SHM staff and 1 author who had completed a Health and Aging Policy Fellowship (H.L.W.).
The steering committee issued e‐mail invitations to stakeholder organizations, making initial inquiries through professional staff and relevant committee chairs. Second inquiries were made via e‐mail to each organization's volunteer leadership. We developed a webinar that outlined the overall research agenda setting process and distributed the webinar to all stakeholders. The stakeholder organizations were asked to commit to (1) surveying their memberships and (2) participating actively in prioritization by e‐mail and at a 1‐day meeting in Washington DC.
Consult
Each stakeholder organization conducted a survey of its membership via an Internet‐based survey in the summer of 2013 (see Supporting Information, Appendix A, in the online version of this article). Stakeholder organizations were asked to provide up to 75 survey responses each. Though a standard survey was used, the steering committee was not prescriptive in the methodology of survey distribution to accommodate the structure and communication methods of the individual stakeholder organizations. Survey respondents were asked to identify up to 5 unanswered questions relevant to the acute care of older persons and also provide demographic information.
Collate
In the collating process, we clarified and categorized the unanswered questions submitted in the individual surveys. Each question was initially reviewed by a member of the steering committee, using explicit criteria (see Supporting Information, Appendix B, in the online version of this article). Questions that did not meet all 4 criteria were removed. For questions that met all criteria, we clarified language, combined similar questions, and categorized each question. Categories were created in a grounded process, in which individual reviewers assigned categories based on the content of the questions. Each question could be assigned to up to 2 categories. Each question was then reviewed by a second member of the steering committee using the same 4 criteria. As part of this review, similar questions were consolidated, and when possible, questions were rewritten in a standard format.[6]
Finally, the steering committee reviewed previously published research agendas looking for additional relevant unanswered questions, specifically the New Frontiers Research Agenda created by the American Geriatrics Society in conjunction with participating subspecialty societies,[9] the Cochrane Library, and other systematic reviews identified in the literature via PubMed search.[10, 11, 12, 13, 14, 15]
Prioritize
The resulting list of unanswered questions was prioritized in 2 phases. First, the list was e‐mailed to all stakeholder organizations. The organizations were asked to vote on their top 10 priorities from this list using an online ballot, assigning 10 points to their highest priority down to 1 point for their lowest priority. In so doing, they were asked to consider explicit criteria (see Supporting Information, Appendix B, in the online version of this article). Each organization had only 1 ballot and could arrive at their top 10 list in any manner they wished. The balloting from this phase was used to develop a list of unanswered questions for the second round of in‐person prioritization. Each priority's scores were totaled across all voting organizations. The 29 priorities with the highest point totals were brought to the final prioritization round because of a natural cut point at priority number 29, rather than number 30.
For the final prioritization round, the steering committee facilitated an in‐person meeting in Washington, DC in October 2013 using nominal group technique (NGT) methodologies to arrive at consensus.[16] During this process stakeholders were asked to consider additional criteria (see Supporting Information, Appendix B, in the online version of this article).
RESULTS
Table 1 lists the organizations who engaged in 1 or more parts of the topic generation process. Eighteen stakeholder organizations agreed to participate in the convening process. Ten organizations did not respond to our solicitation and 1 declined to participate.
| Organization (N=18) | Consultation % of Survey Responses (N=580) | Prioritization Round 1 | Prioritization Round 2 |
|---|---|---|---|
| Alzheimer's Association | 7.0% | Yes | Yes |
| American Academy of Neurology | 3.4% | Yes | Yes |
| American Association of Retired Persons | 0.8% | No | No |
| American College of Cardiology | 11.4% | Yes | Yes |
| American College of Emergency Physicians | 1.3% | No | No |
| American College of Surgeons | 1.0% | Yes | Yes |
| American Geriatrics Society | 7.6% | Yes | Yes |
| American Hospital Association | 1.7% | Yes | No |
| Centers for Medicare & Medicaid Services | 0.8% | Yes | Yes |
| Gerontological Society of America | 18.9% | Yes | Yes |
| National Alliance for Caregiving | 1.0% | Yes | Yes |
| National Association of Social Workers | 5.9% | Yes | Yes |
| National Coalition for Healthcare | 0.6% | No | No |
| National Institute on Aging | 2.1% | Yes | Yes |
| National Partnership for Women and Families | 0.0% | Yes | Yes |
| Nursing Improving Care for Healthsystem Elders | 28.6% | Yes | No |
| Society of Critical Care Medicine | 12.0% | Yes | Yes |
| Society of Hospital Medicine | 4.6% | Yes | Yes |
Seventeen stakeholder organizations obtained survey responses from a total of 580 individuals (range, 3150 per organization), who were asked to identify important unanswered questions in the acute care of older persons. Survey respondents were typically female (77%), white (85%), aged 45 to 65 years (65%), and identified themselves as health professionals (90%). Twenty‐six percent of respondents also identified as patients or family caregivers. Their surveys included 1299 individual questions.
Figure 1 summarizes our collation and prioritization process and reports the numbers of questions resulting at each stage. Nine hundred nineteen questions were removed during the first review conducted by steering committee members, and 31 question categories were identified. An additional 305 questions were removed in the second review, with 75 questions remaining. As the final step of the collating process, literature review identified 39 relevant questions not already suggested or moved forward through our consultation and collation process. These questions were added to the list of unanswered questions.
In the first round of prioritization, this list of 114 questions was emailed to each stakeholder organization (Table 1). After the stakeholder voting process was completed, 29 unanswered questions remained (see Supporting Information, Appendix C, in the online version of this article). These questions were refined and prioritized in the in‐person meeting to create the final list of 10 questions. The stakeholders present in the meeting represented 13 organizations (Table 1). Using the NGT with several rounds of small group breakouts and large group deliberation, 9 of the top 10 questions were selected from the list of 29. One additional highly relevant question that had been removed earlier in the collation process regarding workforce was added back by the stakeholder group.
This prioritized research agenda appears in Table 2 and below, organized alphabetically by topic.
- Advanced care planning: What approaches for determining and communicating goals of care across and within healthcare settings are most effective in promoting goal‐concordant care for hospitalized older patients?
- Care transitions: What is the comparative effectiveness of transitional care models on patient‐centered outcomes for hospitalized older adults?
- Delirium: What practices are most effective for consistent recognition, prevention, and treatment of delirium subtypes among hospitalized older adults?
- Dementia: Does universal assessment of hospitalized older adults for cognitive impairment (eg, at presentation and/or discharge) lead to more appropriate application of geriatric care principles and improve patient‐centered outcomes?
- Depression: Does identifying depressive symptoms during a hospital stay and initiating a therapeutic plan prior to discharge improve patient‐centered and/or disease‐specific outcomes?
- Medications: What systems interventions improve medication management for older adults (ie, appropriateness of medication choices and dosing, compliance, cost) in the hospital and postacute care?
- Models of care: For which populations of hospitalized older adults does systematic implementation of geriatric care principles/processes improve patient‐centered outcomes?
- Physical function: What is the comparative effectiveness of interventions that promote in‐hospital mobility, improve and preserve physical function, and reduce falls among older hospitalized patients?
- Surgery: What perioperative strategies can be used to optimize care processes and improve outcomes in older surgical patients?
- Training: What is the most effective approach to training hospital‐based providers in geriatric and palliative care competencies?
| Topic | Scope of Problem | What Is known | Unanswered Question | Proposed Dimensions |
|---|---|---|---|---|
| ||||
| Advanced‐care planning | Older persons who lack decision‐making capacity often do not have surrogates or clear goals of care documented.[19] Advanced‐care directives are associated with an increase in patient autonomy and empowerment, and although 15% to 25% of adults completed the documentation in 2004,[20] a recent study found completion rates have increased to 72%.[21] | Nursing home residents with advanced directives are less likely to be hospitalized.[22, 23] Advanced directive tools, such as POLST, work to translate patient preferences to medical order.[24] standardized patient transfer tools may help to improve transitions between nursing homes and hospitals.[25] However, advanced care planning fails to integrate into courses of care if providers are unwilling or unskilled in using advanced care documentation.[26] | What approaches for determining and communicating goals of care across and within healthcare settings are most effective in promoting goal‐concordant care for hospitalized older patients? | Potential interventions: |
| Decision aids | ||||
| Standard interdisciplinary advanced care planning approach | ||||
| Patient advocates | ||||
| Potential outcomes might include: | ||||
| Completion of advanced directives and healthcare power of attorney | ||||
| Patient‐centered outcomesa | ||||
| Care transitions | Hospital readmission from home and skilled nursing facilities occurs within 30 days in up to a quarter of patients.[27, 28] The discharge of complex older hospitalized patients is fraught with challenges. The quality of the hospital discharge process can influence outcomes for vulnerable older patients.[29, 30, 31, 32] Studies measuring the quality of hospital discharge frequently find deficits in documentation of assessment of geriatric syndromes,[33] poor patient/caregiver understanding,[34, 35] and poor communication and follow‐up with postacute providers.[35, 36, 37, 38] | As many as 10 separate domains may influence the success of a discharge.[39] There is limited evidence, regarding quality‐of‐care transitions for hospitalized older patients. The Coordinated‐Transitional Care Program found that follow‐up with telecommunication decreased readmission rates and improved transitional care for a high‐risk condition veteran population.[40] There is modest evidence for single interventions,[41] whereas the most effective hospital‐to‐community care interventions address multiple processes in nongeriatric populations.[39, 42, 43] | What is the comparative effectiveness of the transitional care models on patient‐centered outcomes for hospitalized older adults? | Possible models: |
| Established vs novel care‐transition models | ||||
| Disease‐specific vs general approaches | ||||
| Accountable care models | ||||
| Caregiver and family engagement | ||||
| Community engagement | ||||
| Populations of interest: | ||||
| Patients with dementia | ||||
| Patients with multimorbidity | ||||
| Patients with geriatric syndromes | ||||
| Patients with psychiatric disease | ||||
| Racially and ethnically diverse patients | ||||
| Outcomes: | ||||
| Readmission | ||||
| Other adverse events | ||||
| Cost and healthcare utilization | ||||
| Patient‐centered outcomesa | ||||
| Delirium | Among older inpatients, the prevalence of delirium varies with severity of illness. Among general medical patients, in‐hospital prevalence ranges from 10% to 25 %.[44, 45] In the ICU, prevalence estimates are higher, ranging from 25% to as high as 80%.[46, 47] Delirium independently predicts increased length of stay,[48, 49] long‐term cognitive impairment,[50, 51] functional decline,[51] institutionalization,[52] and short‐ and long‐term mortality.[52, 53, 54] | Multicomponent strategies have been shown to be effective in preventing delirium. A systematic review of 19 such interventions identified the most commonly included such as[55]: early mobilization, nutrition supplements, medication review, pain management, sleep enhancement, vision/hearing protocols, and specialized geriatric care. Studies have included general medical patients, postoperative patients, and patients in the ICU. The majority of these studies found reductions in either delirium incidence (including postoperative), delirium prevalence, or delirium duration. Although medications have not been effective in treating delirium in general medical patients,[48] the choice and dose of sedative agents has been shown to impact delirium in the ICU.[56, 57, 58] | What practices are most effective for consistent recognition, prevention, and treatment of delirium subtypes (hypoactive, hyperactive, and mixed) among hospitalized older adults? | Outcomes to examine: |
| Delirium incidence (including postoperative) | ||||
| Delirium duration | ||||
| Delirium‐/coma‐free days | ||||
| Delirium prevalence at discharge | ||||
| Subsyndromal delirium | ||||
| Potential prevention and treatment modalities: | ||||
| Family education or psychosocial interventions | ||||
| Pharmacologic interventions | ||||
| Environmental modifications | ||||
| Possible areas of focus: | ||||
| Special populations | ||||
| Patients with varying stages of dementia | ||||
| Patients with multimorbidity | ||||
| Patients with geriatric syndromes | ||||
| Observation patients | ||||
| Diverse settings | ||||
| Emergency department | ||||
| Perioperative | ||||
| Skilled nursing/rehab/long‐term acute‐care facilities | ||||
| Dementia | 13% to 63% of older persons in the hospital have dementia.[59] Dementia is often unrecognized among hospitalized patients.[60] The presence of dementia is associated with a more rapid functional decline during admission and delayed hospital discharge.[59] Patients with dementia require more nursing hours, and are more likely to have complications[61] or die in care homes rather than in their preferred site.[59] | Several tools have been validated to screen for dementia in the hospital setting.[62] Studies have assessed approaches to diagnosing delirium in hospitalized patients with dementia.[63] Cognitive and functional stimulation interventions may have a positive impact on reducing behavioral issues.[64, 65] | Does universal assessment of hospitalized older adults for cognitive impairment (eg, at presentation and/or discharge) lead to more appropriate application of geriatric care principles and improve patient centered outcomes? | Potential interventions: |
| Dementia or delirium care | ||||
| Patient/family communication and engagement strategies | ||||
| Maintenance/recovery of independent functional status | ||||
| Potential outcomes: | ||||
| Patient‐centered outcomesa | ||||
| Length of stay, cost, and healthcare utilization (including palliative care) | ||||
| Immediate invasive vs early conservative treatments pursued | ||||
| Depression | Depression is a common geriatric syndrome among acutely ill older patients, occurring in up to 45% of patients.[66, 67] Rates of depression are similar among patients discharged following a critical illness, with somatic, rather than cognitive‐affective complaints being the most prevalent.[68] Depression among inpatients or immediately following hospitalization independently predicts worse functional outcomes,[69] cognitive decline,[70] hospital readmission,[71, 72] and long‐term mortality.[69, 73] Finally, geriatric patients are known to respond differently to medical treatment.[74, 75] | Although highly prevalent, depression is poorly recognized and managed in the inpatient setting. Depression is recognized in only 50% of patients, with previously undiagnosed or untreated depression being at highest risk for being missed.[76] The role of treatment of depression in the inpatient setting is poorly understood, particularly for those with newly recognized depression or depressive symptoms. Some novel collaborative care and telephone outreach programs have led to increases in depression treatment in patients with specific medical and surgical conditions, resulting in early promising mental health and comorbid outcomes.[77, 78] The efficacy of such programs for older patients is unknown. | Does identifying depressive symptoms during a hospital stay and initiating a therapeutic plan prior to discharge improve patient‐centered and/or disease‐specific outcomes? | Possible areas of focus: |
| Comprehensive geriatric and psychosocial assessment; | ||||
| Inpatient vs outpatient initiation of pharmacological therapy | ||||
| Integration of confusion assessment method into therapeutic approaches | ||||
| Linkages with outpatient mental health resources | ||||
| Medications | Medication exposure, particularly potentially inappropriate medications, is common in hospitalized elders.[79] Medication errorsof dosage, type, and discrepancy between what a patient takes at home and what is known to his/her prescribing physicianare common and adversely affects patient safety.[80] Geriatric populations are disproportionately affected, especially those taking more than 5 prescription medications per day.[81] | Numerous strategies including electronic alerts, screening protocols, and potentially inappropriate medication lists (Beers list, STOPP) exist, though the optimal strategies to limit the use of potentially inappropriate medications is not yet known.[82, 83, 84] | What systems interventions improve medication management for older adults (ie, appropriateness of medication choices and dosing, compliance, cost) in hospital and post‐acute care? | Possible areas of focus: |
| Use of healthcare information technology | ||||
| Communication across sites of care | ||||
| Reducing medication‐related adverse events | ||||
| Engagement of family caregivers | ||||
| Patient‐centered strategies to simplify regimens | ||||
| Models of care | Hospitalization marks a time of high risk for older patients. Up to half die during hospitalization or within the year following the hospitalization. There is high risk of nosocomial events, and more than a third experience a decline in health resulting in longer hospitalizations and/or placement in extended‐care facilities.[73, 85, 86] | Comprehensive inpatient care for older adults (acute care for elders units, geriatric evaluation and management units, geriatric consultation services) were studied in 2 meta‐analyses, 5 RCTs, and 1 quasiexperimental study and summarized in a systematic review.[87] The studies reported improved quality of care (1 of 1 article), quality of life (3 of 4), functional autonomy (5 of 6), survival (3 of 6), and equal or lower healthcare utilization (7 of 8). | For which populations of hospitalized older adults does systematic implementation of geriatric care principles/processes improve patient‐centered outcomes? | Potential populations: |
| Patients of the emergency department, critical care, perioperative, and targeted medical/surgical units | ||||
| Examples of care principles: | ||||
| Geriatric assessment, early mobility, medication management, delirium prevention, advanced‐care planning, risk‐factor modification, caregiver engagement | ||||
| Potential outcomes: | ||||
| Patient‐centered outcomesa | ||||
| Cost | ||||
| Physical function | Half of older patients will lose functional capacity during hospitalization.[88] Loss of physical function, particularly of lower extremities, is a risk factor for nursing home placement.[89, 90] Older hospitalized patients spend the majority (up to 80%) of their time lying in bed, even when they are capable of walking independently.[91] | Loss of independences with ADL capabilities is associated with longer hospital stays, higher readmission rates, and higher mortality risk.[92] Excessive time in bed during a hospital stay is also associated with falls.[93] Often, hospital nursing protocols and physician orders increase in‐hospital immobility in patients.[91, 94] However, nursing‐driven mobility protocols can improve functional outcomes of older hospitalized patients.[95, 96] | What is the comparative effectiveness of interventions that promote in‐hospital mobility, improve and preserve physical function, and reduce falls among older hospitalized patients? | Potential interventions: |
| Intensive physical therapy | ||||
| Incidental functional training | ||||
| Restraint reduction | ||||
| Medication management | ||||
| Potential outcomes: | ||||
| Discharge location | ||||
| Delirium, pressure ulcers, and falls | ||||
| Surgery | An increasing number of persons over age 65 years are undergoing surgical procedures.[97] These persons are at increased risk for developing delirium/cogitative dysfunction,[98] loss of functional status,[99] and exacerbations of chronic illness.[97] Additionally, pain management may be harder to address in this population.[100] Current outcomes may not reflect the clinical needs of elder surgical patients.[101] | Tailored drug selection and nursing protocols may prevent delirium.[98] Postoperative cognitive dysfunction may require weeks for resolution. Identifying frail patients preoperatively may lead to more appropriate risk stratification and improved surgical outcomes.[99] Pain management strategies focused on mitigating cognitive impact and other effects may also be beneficial.[100] Development of risk‐adjustment tools specific to older populations, as well as measures of frailty and patient‐centered care, have been proposed.[101] | What perioperative strategies can be used to optimize care processes and improve outcomes in older surgical patients? | Potential strategies: |
| Preoperative risk assessment and optimization for frail or multimorbid older patients | ||||
| Perioperative management protocols for frail or multimorbid older patients | ||||
| Potential outcomes: | ||||
| Postoperative patient centered outcomesa | ||||
| Perioperative cost, healthcare utilization | ||||
| Training | Adults over age 65 years comprise 13.2 % of the US population, but account for >30% of hospital discharges and 50% of hospital days.[86, 102, 103] By 2030, there will only be 1 geriatrician for every 3798 Americans >75 years.[4] Between 1997 and 2006, the odds that a hospitalist would treat a hospitalized Medicare patient rose 29% per year.[3] | Train the trainer programs for physicians include the CHAMP, the AGESP, and the PAGE. Education for nurses include the NICHE. Outcomes include improved self‐confidence, attitudes, teaching skills, and geriatric care environment.[104, 105, 106] | What is the most effective approach to training hospital‐based providers in geriatric and palliative care competencies? | Potential interventions: |
| Mentored implementation | ||||
| Train the trainer | ||||
| Technical support | ||||
Table 2 also contains a capsule summary of the scope of the problem addressed by each research priority, a capsule summary of related work in the content area (what is known) not intended as a systematic review, and proposed dimensions or subquestions suggested by the stakeholders at the final prioritization meeting
DISCUSSION
Older hospitalized patients account for an increasing number and proportion of hospitalized patients,[1, 2] and hospitalists increasingly are responsible for inpatient care for this population.[3] The knowledge required for hospitalists to deliver optimal care and improve outcomes has not kept pace with the rapid growth of either hospitalists or hospitalized elders. Through a rigorous prioritization process, we identified 10 areas that deserve the highest priority in directing future research efforts to improve care for the older hospitalized patient. Assessment, prevention, and treatment of geriatric syndromes in the hospital account for almost half of the priority areas. Additional research is needed to improve advanced care planning, develop new care models, and develop training models for future hospitalists competent in geriatric and palliative care competencies.
A decade ago, the American Geriatric Society and the John A. Hartford Foundation embarked upon a research agenda aimed at improving the care of hospitalized elders cared for by specialists (ie, New Frontiers in Geriatrics Research: An Agenda for Surgical and Related Medical Specialties).[9] This effort differed in many important ways from the current priortization process. First, the New Frontiers agenda focused upon specific diseases, whereas the ACOP agenda addresses geriatric syndromes that cut across multiple diseases. Second, the New Frontiers agenda was made by researchers and based upon published literature, whereas the ACOP agenda involved the input of multiple stakeholders. Finally, the New Frontiers prioritized a research agenda across a number of surgical specialties, emergency medicine, and geriatric rehabilitation. Hospital medicine, however, was still early in its development and was not considered a unique specialty. Since that time, hospital medicine has matured into a unique specialty, with increased numbers of hospitalists,[3] increased research in hospital medicine,[17] and a separate recertification pathway for internal medicine licensure.[18] To date, there has not been a similar effort performed to direct geriatric research efforts for hospital medicine.
For researchers working in the field of hospital medicine, this list of topics has several implications. First, as hospitalists are commonly generalists, hospitalist researchers may be particularly well‐suited to study syndromes that cut across specialties. However, this does raise concerns about funding sources, as most National Institutes of Health institutes are disease‐focused. Funders that are not disease‐focused such as PCORI, National Institute on Aging, National Institute of Nursing Research, and Agency for Healthcare Research and Quality, and private foundations (Hartford, Robert Wood Johnson, and Commonwealth) may be more fruitful sources of funding for this work, but funding may be challenging. Nonetheless, the increased focus on patient‐centered work may increase funders' interest in such work. Second, the topics on this list would suggest that interventions will not be pharmacologic, but will focus on nonpharmacologic, behavioral, and social interventions. Similarly, outcomes of interest must expand beyond utilization metrics such as length of stay and mortality, to include functional status and symptom management, and goal‐concordant care. Therefore, research in geriatric acute care will necessarily be multidisciplinary.
Although these 10 high‐priority areas have been selected, this prioritized list is inherently limited by our methodology. First, our survey question was not focused on a disease state, and this wording may have resulted in the list favoring geriatric syndromes rather than common disease processes. Additionally, the resulting questions encompass large research areas and not specific questions about discrete interventions. Our results may also have been skewed by the types of engaged respondents who participated in the consultation, collating, and prioritization phases. In particular, we had a large response from geriatric medicine nurses, whereas some stakeholder groups provided no survey responses. Thus, these respondents were not representative of all possible stakeholders, nor were the survey respondents necessarily representative of each of their organizations. Nonetheless, the participants self‐identified as representative of diverse viewpoints that included patients, caregivers, and advocacy groups, with the majority of stakeholder organizations remaining engaged through the completion of the process. Thus, the general nature of this agenda helps us focus upon larger areas of importance, leaving researchers the flexibility to choose to narrow the focus on a specific research question that may include potential interventions and unique outcomes. Finally, our methodology may have inadvertently limited the number of patient and family caregiver voices in the process given our approach to large advocacy groups, our desire to be inclusive of healthcare professional organizations, and our survey methodology. Other methodologies may have reached more patients and caregivers, yet many healthcare professionals have served as family caregivers to frail elders requiring hospitalization and may have been in an ideal position to answer the survey.
In conclusion, several forces are shaping the future of acute inpatient care. These include the changing demographics of the hospitalized patient population, a rapid increase in the proportion of multimorbid hospitalized older adults, an inpatient workforce (hospitalists, generalists, and subspecialists) with potentially limited geriatrics training, and gaps in evidence‐based guidance to inform diagnostic and therapeutic decision making for acutely ill older patients. Training programs in hospital medicine should be aware of and could benefit from the resulting list of unanswered questions. Our findings also have implications for training to enrich education in geriatrics. Moreover, there is growing recognition that patients and other stakeholders deserve a greater voice in determining the direction of research. In addition to efforts to improve patient‐centeredness of research, these areas have been uniquely identified by stakeholders as important, and therefore are in line with newer priorities of PCORI. This project followed a road map resulting in a patient‐centered research agenda at the intersection of hospital medicine and geriatric medicine.[7] In creating this agenda, we relied heavily on the framework proposed by PCORI. We propose to pursue a dissemination and evaluation strategy for this research agenda as well as additional prioritization steps. We believe the adoption of this methodology will create a knowledge base that is rigorously derived and most relevant to the care of hospitalized older adults and their families. Its application will ultimately result in improved outcomes for hospitalized older adults.
Acknowledgements
The authors acknowledge Claudia Stahl, Society of Hospital Medicine; Cynthia Drake, University of Colorado; and the ACOP stakeholder organizations.
Disclosures: This work was supported by the Association of Specialty Professors/American Society of Internal Medicine and the John A. Hartford Foundation. Dr. Vasilevskis was supported by the National Institute on Aging of the National Institutes of Health under award number K23AG040157 and the Veterans Affairs Clinical Research Center of Excellence, and the Geriatric Research, Education and Clinical Center (GRECC). Dr. Vasilevskis' institution receives grant funding for an aspect of submitted work. Dr. Meltzer is a PCORI Methodology Committee member. The content is solely the responsibility of the authors and does not necessarily represent the official views of the National Institutes of Health or the Department of Veterans' Affairs. The authors report no conflicts of interest.
- , , , , . National Hospital Discharge Survey: 2007 summary. Natl Health Stat Report. 2010(29):1–20, 24.
- Centers for Medicare 2012. Available at: http://www.cms.gov/Research‐Statistics‐Data‐and‐Systems/Statistics‐Trends‐and‐Reports/Chronic‐Conditions/Downloads/2012Chartbook.pdf. Accessed December 12, 2014.
- , , , . Growth in the care of older patients by hospitalists in the United States. N Engl J Med. 2009;360(11):1102–1112.
- , . A revelation of numbers: will America's eldercare workforce be ready to care for an aging America? Generations. 2010;34(4):11–19.
- Patient‐Centered Outcomes Research Institute Methodology Committee. The PCORI methodology report. Available at: http://www.pcori.org/assets/2013/11/PCORI‐Methodology‐Report.pdf. Published November 2013. Accessed December 19, 2013.
- The James Lind Alliance. JLA method. Available at: http://www.lindalliance.org/JLA_Method.asp. Accessed December 19, 2013.
- , , , , . Road map to a patient‐centered research agenda at the intersection of hospital medicine and geriatric medicine. J Gen Intern Med. 2014;29(6):926–931.
- Patient‐Centered Outcomes Research Institute. About us. Available at: http://www.pcori.org/about‐us. Accessed February 23, 2015.
- , , . New Frontiers of Geriatrics Research: An Agenda for Surgical and Related Medical Specialties. New York, NY: American Geriatrics Society; 2004.
- , , , . Linking the NIH strategic plan to the research agenda for social workers in health and aging. J Gerontol Soc Work. 2010;53(1):77–93.
- , . Assessing the capacity to make everyday decisions: a guide for clinicians and an agenda for future research. Am J Geriatr Psychiatry. 2007;15(2):101–111.
- , , , et al. Practitioners' views on elder mistreatment research priorities: recommendations from a Research‐to‐Practice Consensus conference. J Elder Abuse Negl. 2011;23(2):115–126.
- , . The intersection between geriatrics and palliative care: a call for a new research agenda. J Am Geriatr Soc. 2005;53(9):1593–1598.
- . The cancer aging interface: a research agenda. J Clin Oncol. 2007;25(14):1945–1948.
- , , , . Clinical care of persons with dementia in the emergency department: a review of the literature and agenda for research. J Am Geriatr Soc. 2012;60(9):1742–1748.
- , . A group process model for problem identification and program planning. J Appl Behav Sci. 1971;7(4):466–492.
- , , , , . Research and publication trends in hospital medicine. J Hosp Med. 2014;9(3):148–154.
- . ABFM and ABIM to jointly participate in recognition of focused practice (rfp) in hospital medicine pilot approved by abms. Ann Fam Med. 2010;8(1):87.
- , , , . Medical decision‐making for older adults without family. J Am Geriatr Soc. 2012;60(11):2144–2150.
- , , , , , . Promoting advance directives among elderly primary care patients. J Gen Intern Med. 2004;19(9):944–951.
- , , . Advance directive completion by elderly Americans: a decade of change. J Am Geriatr Soc. 2014;62(4):706–710.
- , . Care transitions by older adults from nursing homes to hospitals: implications for long‐term care practice, geriatrics education, and research. J Am Med Dir Assoc. 2010;11(4):231–238.
- , , , . Decisions to hospitalize nursing home residents dying with advanced dementia. J Am Geriatr Soc. 2005;53(8):1396–1401.
- , , , , , . A comparison of methods to communicate treatment preferences in nursing facilities: traditional practices versus the physician orders for life‐sustaining treatment program. J Am Geriatr Soc. 2010;58(7):1241–1248.
- , , , , . Interventions to improve transitional care between nursing homes and hospitals: a systematic review. J Am Geriatr Soc. 2010;58(4):777–782.
- , , . Opening end‐of‐life discussions: how to introduce Voicing My CHOiCES, an advance care planning guide for adolescents and young adults [published online ahead of print March 13, 2014]. Palliat Support Care. doi: 10.1017/S1478951514000054.
- , , , . The revolving door of rehospitalization from skilled nursing facilities. Health Aff (Millwood). 2010;29(1):57–64.
- , , . Rehospitalizations among patients in the Medicare fee‐for‐service program. N Engl J Med. 2009;360(14):1418–1428.
- , , , et al. Predictors of rehospitalization among elderly patients admitted to a rehabilitation hospital: the role of polypharmacy, functional status, and length of stay. J Am Med Dir Assoc. 2013;14(10):761–767.
- , , , et al. Mobility after hospital discharge as a marker for 30‐day readmission. J Gerontol A Biol Sci Med Sci. 2013;68(7):805–810.
- , , , , . The association between the quality of inpatient care and early readmission: a meta‐analysis of the evidence. Med Care. 1997;35(10):1044–1059.
- , , , , , . Association of impaired functional status at hospital discharge and subsequent rehospitalization. J Hosp Med. May 2014;9(5):277–282.
- , , , , , . A prospective cohort study of geriatric syndromes among older medical patients admitted to acute care hospitals. J Am Geriatr Soc. 2011;59(11):2001–2008.
- , , , et al. Hospital discharge instructions: comprehension and compliance among older adults. J Gen Intern Med. 2014;29(11):1491–1498.
- , , , et al. Problems after discharge and understanding of communication with their primary care physicians among hospitalized seniors: a mixed methods study. J Hosp Med. 2010;5(7):385–391.
- , , , et al. Communication and information deficits in patients discharged to rehabilitation facilities: an evaluation of five acute care hospitals. J Hosp Med. 2009;4(8):E28–E33.
- , , , , , . The consequences of poor communication during transitions from hospital to skilled nursing facility: a qualitative study. J Am Geriatr Soc. 2013;61(7):1095–1102.
- , , , , , . Deficits in communication and information transfer between hospital‐based and primary care physicians: implications for patient safety and continuity of care. JAMA. 2007;297(8):831–841.
- , , , . Moving beyond readmission penalties: creating an ideal process to improve transitional care. J Hosp Med. 2013;8(2):102–109.
- , , , et al. Low‐cost transitional care with nurse managers making mostly phone contact with patients cut rehospitalization at a VA hospital. Health Aff (Millwood). 2012;31(12):2659–2668.
- , , , et al. Transitional care interventions to prevent readmissions for persons with heart failure: a systematic review and meta‐analysis. Ann Intern Med. 2014;160(11):774–784.
- , , , , . Interventions to reduce 30‐day rehospitalization: a systematic review. Ann Intern Med. 2011;155(8):520–528.
- , , , , , . Hospital‐initiated transitional care interventions as a patient safety strategy: a systematic review. Ann Intern Med. 2013;158(5 pt 2):433–440.
- , , , . Epidemiology and risk factors for delirium across hospital settings. Best Pract Res Clin Anaesthesiol. 2012;26(3):277–287.
- , , , , . Does delirium contribute to poor hospital outcomes? A three‐site epidemiologic study. J Gen Intern Med. 1998;13(4):234–242.
- , , , . Incidence, risk factors and consequences of ICU delirium. Intensive Care Med. 2007;33(1):66–73.
- , , , et al. Delirium in mechanically ventilated patients: validity and reliability of the confusion assessment method for the intensive care unit (CAM‐ICU). JAMA. 2001;286(21):2703–2710.
- , , , et al. Impact and recognition of cognitive impairment among hospitalized elders. J Hosp Med. 2010;5(2):69–75.
- , , , et al. The impact of delirium in the intensive care unit on hospital length of stay. Intensive Care Med. 2001;27(12):1892–1900.
- , , . Long‐term cognitive impairment after critical illness. N Engl J Med. 2014;370(2):185–186.
- , , , et al. Delirium in the ICU and subsequent long‐term disability among survivors of mechanical ventilation. Crit Care Med. 2014;42(2):369–377.
- , , , , , . Delirium in elderly patients and the risk of postdischarge mortality, institutionalization, and dementia: a meta‐analysis. JAMA. 2010;304(4):443–451.
- , , , et al. Delirium as a predictor of mortality in mechanically ventilated patients in the intensive care unit. JAMA. 2004;291(14):1753–1762.
- , , , , , . Days of delirium are associated with 1‐year mortality in an older intensive care unit population. Am J Respir Crit Care Med. 2009;180(11):1092–1097.
- , . In‐facility delirium prevention programs as a patient safety strategy: a systematic review. Ann Intern Med. 2013;158(5 pt 2):375–380.
- , , , et al. Dexmedetomidine vs midazolam for sedation of critically ill patients: a randomized trial. JAMA. 2009;301(5):489–499.
- , , , et al. Effect of sedation with dexmedetomidine vs lorazepam on acute brain dysfunction in mechanically ventilated patients: the MENDS randomized controlled trial. JAMA. 2007;298(22):2644–2653.
- , , , , , . Protocolized intensive care unit management of analgesia, sedation, and delirium improves analgesia and subsyndromal delirium rates. Anesth Analg. 2010;111(2):451–463.
- , . A systematic review of the prevalence, associations and outcomes of dementia in older general hospital inpatients. Int Psychogeriatr. 2011;23(3):344–355.
- , , , . Cognitive impairment is undetected in medical inpatients: a study of mortality and recognition amongst healthcare professionals. BMC Geriatr. 2012;12:47.
- , , . How can we keep patients with dementia safe in our acute hospitals? A review of challenges and solutions. J R Soc Med. 2013;106(9):355–361.
- , , . Screening for dementia in general hospital inpatients: a systematic review and meta‐analysis of available instruments. Age Ageing. 2013;42(6):689–695.
- , , , et al. Tools to detect delirium superimposed on dementia: a systematic review. J Am Geriatr Soc. 2012;60(11):2005–2013.
- , , , , , . Functional analysis‐based interventions for challenging behaviour in dementia. Cochrane Database Syst Rev. 2012;2:CD006929.
- , , , . Cognitive stimulation to improve cognitive functioning in people with dementia. Cochrane Database Syst Rev. 2012;2:CD005562.
- , , , et al. The prevalence and correlates of major and minor depression in older medical inpatients. J Am Geriatr Soc. 2005;53(8):1344–1353.
- , , , , , . Major depressive disorder in hospitalized medically ill patients: an examination of young and elderly male veterans. J Am Geriatr Soc. 1991;39(9):881–890.
- , , , et al. Depression, post‐traumatic stress disorder, and functional disability in survivors of critical illness in the BRAIN‐ICU study: a longitudinal cohort study. Lancet Respir Med. 2014;2(5):369–379.
- , , , et al. Depressive symptoms after hospitalization in older adults: function and mortality outcomes. J Am Geriatr Soc. 2012;60(12):2254–2262.
- , , , , . 12‐month cognitive outcomes of major and minor depression in older medical patients. Am J Geriatr Psychiatry. 2008;16(9):742–751.
- , , , et al. Depression is a risk factor for rehospitalization in medical inpatients. Prim Care Companion J Clin Psychiatry. 2007;9(4):256–262.
- , , , , , . Dose‐response relationship between depressive symptoms and hospital readmission. J Hosp Med. 2014;9(6):358–364.
- , , , , , . Depressive symptoms and 3‐year mortality in older hospitalized medical patients. Ann Intern Med. 1999;130(7):563–569.
- , , , et al. Support for the vascular depression hypothesis in late‐life depression: results of a 2‐site, prospective, antidepressant treatment trial. Arch Gen Psychiatry. 2010;67(3):277–285.
- , , , , , . Executive dysfunction and the course of geriatric depression. Biol Psychiatry. 2005;58(3):204–210.
- , , , , . Recognition of depression in older medical inpatients. J Gen Intern Med. 2007;22(5):559–564.
- , , , , , . A collaborative care depression management program for cardiac inpatients: depression characteristics and in‐hospital outcomes. Psychosomatics. 2011;52(1):26–33.
- , , , , , . Impact of a depression care management program for hospitalized cardiac patients. Circ Cardiovasc Qual Outcomes. 2011;4(2):198–205.
- , , , et al. Potentially inappropriate medication use in hospitalized elders. J Hosp Med. 2008;3(2):91–102.
- , , , , , . Prevalence, incidence and nature of prescribing errors in hospital inpatients: a systematic review. Drug Saf. 2009;32(5):379–389.
- , . Minimizing adverse drug events in older patients. Am Fam Physician. 2007;76(12):1837–1844.
- , , , , . STOPP (Screening Tool of Older Person's Prescriptions) and START (Screening Tool to Alert doctors to Right Treatment). Consensus validation. Int J Clin Pharmacol Ther. 2008;46(2):72–83.
- American Geriatrics Society 2012 Beers Criteria Update Expert Panel. American Geriatrics Society updated Beers Criteria for potentially inappropriate medication use in older adults. J Am Geriatr Soc. 2012;60(4):616–631.
- , , , . Preventing potentially inappropriate medication use in hospitalized older patients with a computerized provider order entry warning system. Arch Intern Med. 2010;170(15):1331–1336.
- . Hazards of Hospitalization of the Elderly. Ann Intern Med. 1993;118(3):219–223.
- . Improving health care for older persons. Ann Intern Med. 2003;139(5 part 2):421–424.
- , , , , , . Successful models of comprehensive care for older adults with chronic conditions: evidence for the Institute of Medicine's "retooling for an aging America" report. J Am Geriatr Soc. 2009;57(12):2328–2337.
- , , , et al. Recovery of activities of daily living in older adults after hospitalization for acute medical illness. J Am Geriatr Soc. 2008;56(12):2171–2179.
- , , , . Changes in functional status and the risks of subsequent nursing home placement and death. J Gerontol. 1993;48(3):S94–S101.
- , , . Risk factors for nursing home placement in a population‐based dementia cohort. J Am Geriatr Soc. 2000;48(5):519–525.
- , , , . The underrecognized epidemic of low mobility during hospitalization of older adults. J Am Geriatr Soc. 2009;57(9):1660–1665.
- , , , , . A systematic review of predictors and screening instruments to identify older hospitalized patients at risk for functional decline. J Clin Nurs. 2007;16(1):46–57.
- . Immobility and falls. Clin Geriatr Med. 1998;14(4):699–726.
- , , . Prevalence and outcomes of low mobility in hospitalized older patients. J Am Geriatr Soc. 2004;52(8):1263–1270.
- , , . Impact of a nurse‐driven mobility protocol on functional decline in hospitalized older adults. J Nurs Care Qual. 2009;24(4):325–331.
- , . Impact of early mobilization protocol on the medical‐surgical inpatient population: an integrated review of literature. Clin Nurse Spec. 2012;26(2):87–94.
- , , , . The aging population and its impact on the surgery workforce. Ann Surg. 2003;238(2):170–177.
- . Perioperative care of the elderly patient: an update. Cleve Clin J Med. 2009;76(suppl 4):S16–S21.
- , , . Frailty in the older surgical patient: a review. Age Ageing. 2012;41(2):142–147.
- . The assessment and management of peri‐operative pain in older adults. Anaesthesia. 2014;69(suppl 1):54–60.
- , . National Research Strategies: what outcomes are important in peri‐operative elderly care? Anaesthesia. 2014;69(suppl 1):61–69.
- , . 2002 National Hospital Discharge Survey. Adv Data. 2004;342:1–30.
- , . Hospitalization in the United States, 2002. Rockville, MD: Agency for Healthcare Research and Quality; 2005.
- , , , et al. The Curriculum for the Hospitalized Aging Medical Patient program: a collaborative faculty development program for hospitalists, general internists, and geriatricians. J Hosp Med. 2008;3(5):384–393.
- , . Advancement of geriatrics education. J Hosp Med. 2011;6(6):370.
- , , , , , . Advancing geriatrics education: an efficient faculty development program for academic hospitalists increases geriatric teaching. J Hosp Med. 2010;5(9):541–546.

Housestaff Teams and Patient Outcomes
Since the Institute of Medicine Report To Err is Human, increased attention has been paid to improving the care of hospitalized patients.[1] Strategies include utilization of guidelines and pathways, and the application of quality improvement techniques to improve or standardize processes. Despite improvements in focused areas such as prevention of hospital‐acquired infections, evidence suggests that outcomes for hospitalized patients remain suboptimal.[2] Rates of errors and hospital‐related complications such as falls, decubitus ulcers, and infections remain high,[3, 4, 5] and not all patients receive what is known to be appropriate care.[6]
Many attempts to improve inpatient care have used process‐improvement approaches, focusing on impacting individuals' behaviors, or on breaking down processes into component parts. Examples include central line bundles or checklists.[7, 8] These approaches attempt to ensure that providers do things in a standardized way, but are implicitly based on the reductionist assumption that we can break processes down into predictable parts to improve the system. An alternative way to understand clinical systems is based on interdependencies between individuals in the system, or the ways in which parts of the system interact with each other, which may be unpredictable over time.[1, 9] Whereas these interdependencies include care processes, they also encompass the providers who care for patients. Providers working together vary in terms of the kinds of relationships they have with each other. Those relationships are crucial to system function because they are the foundation for the interactions that lead to effective patient care.
The application of several frameworks or approaches for considering healthcare systems in terms of relationships highlights the importance of this way of understanding system function. The include complexity science,[1, 7] relational coordination (which is grounded in complexity science),[10] high reliability,[11] and the Big Five for teamwork.[12]
Research indicates that interactions among healthcare providers can have important influences on outcomes.[13, 14, 15, 16, 17] Additionally, the initial implementation of checklists to prevent central‐line associated infections appeared to change provider relationships in a way that significantly influenced their success.[18] For example, positive primary care clinic member relationships as assessed by the Lanham framework have been associated with better chronic care model implementation, learning, and patient experience of care.[19, 20] This framework, which we apply here, identifies 7 relationship characteristics: (1) trust; (2) diversity; (3) respect; (4) mindfulness, or being open to new ideas from others; (5) heedfulness, or an understanding of how one's roles influence those of others; (6) use of rich in‐person or verbal communication, particularly for potentially ambiguous information open to multiple interpretations; and (7) having a mixture of social and task relatedness among teams, or relatedness outside of only work‐related tasks.[19] Relationships within surgical teams that are characterized by psychological safety and diversity are associated with successful uptake of new techniques and decreased mortality.[13, 14] Relationships are important because the ability of patients and providers to learn and make sense of their patients' illnesses is grounded in relationships.
We sought to better understand and characterize inpatient physician teams' relationships, and assess the association between team relationships as evaluated by Lanham's framework and outcomes for hospitalized patients. Data on relationships among inpatient medical teams are few, despite the fact that these teams provide a great proportion of inpatient care. Additionally, the care of hospitalized medical patients is complex and uncertain, often involving multiple providers, making provider relationships potentially even more important to outcomes than in other settings.
METHODS
Overview
We conducted an observational, convergent mixed‐methods study of inpatient medicine teams.[21, 22, 23] We focused on inpatient physician teams, defining them as the functional work group responsible for medical decision making in academic medical centers. Physician teams in this context have been studied in terms of social hierarchy, authority, and delegation.[24, 25, 26] Focusing on the relationships within these groups could provide insights into strategies to mitigate potential negative effects of hierarchy. We recognize that other providers are closely involved in the care of hospitalized patients, and although we did not have standard interactions between physicians, nurses, case managers, and other providers that we could consistently observe, we did include interactions with these other providers in our observations and assessments of team relationships. Because this work is among the first in inpatient medical teams, we chose to study a small number of teams in great depth, allowing us to make rich assessments of team relationships.
We chose patient outcomes of length of stay (LOS), unnecessary LOS (ULOS), and complication rates, adjusted for patient characteristics and team workload. LOS is an important metric of inpatient care delivery. We feel ULOS is an aspect of LOS that is dependent on the physician team, as it reflects their preparation of the patient for discharge. Finally, we chose complication rates because hospital‐acquired conditions and complications are important contributors to inpatient morbidity, and because recent surgical literature has identified complication rates as a contributor to mortality that could be related to providers' collective ability to recognize complications and act quickly.
This study was approved by the institutional review board at the University of Texas Health Science Center at San Antonio (UTHSCSA), the Research and Development Committee for the South Texas Veterans Health Care System (STVHCS), and the Research Committee at University Health System (UHS). All physicians consented to participate in the study. We obtained a waiver of consent for inclusion of patient data.
Setting and Study Participants
This study was conducted at the 2 UTHSCSA primary teaching affiliates. The Audie L. Murphy Veterans Affairs Hospital is the 220‐bed acute‐care hospital of the STVHCS. University Hospital is the 614‐bed, level‐I trauma, acute‐care facility for UHS, the county system for Bexar County, which includes the San Antonio, Texas major metropolitan area.
The inpatient internal medicine physician team was our unit of study. Inpatient medicine teams consisted of 1 faculty attending physician, 1 postgraduate year (PGY)‐2 or PGY‐3 resident, and 2 PGY‐1 members. In addition, typically 2 to 3 third‐year medical students were part of the team, and a subintern was sometimes present. Doctor of Pharmacy faculty and students were also occasionally part of the team. Social workers and case managers often joined team rounds for portions of the time, and nurses sometimes joined bedside rounds on specific patients. These teams admit all medicine patients with the exception of those with acute coronary syndromes, new onset congestive heart failure, or arrhythmias. Patients are randomly assigned to teams based on time of admission and call schedules.
Between these 2 hospitals, there are 10 inpatient medicine teams caring for patients, with a pool of over 40 potential faculty attendings. Our goal was to observe teams that would be most likely to vary in terms of their relationship characteristics and patient outcomes through observing teams with a range of individual members. We used a purposeful sampling approach to obtain a diverse sample, sampling based on physician attributes and time of year.[16, 17] Three characteristics were most important: attending physician years of experience, attending involvement in educational and administrative leadership, and the presence of struggling resident members, as defined by being on probation or having been discussed in the residency Clinical Competency Committee. We did not set explicit thresholds in terms of attending experience, but instead sought to ensure a range. The attendings we observed were more likely to be involved in education and administrative leadership activities, but were otherwise similar to those we did not observe in terms of years of experience. We included struggling residents to observe individuals with a range of skill sets, and not just high‐performing individuals. We obtained attending information based on our knowledge of the attending faculty pool, and from the internal medicine residency program. We sampled across the year to ensure a diversity of trainee experience, but did not observe teams in either July or August, as these months were early in the academic year. Interns spend approximately 5 months per year on inpatient services, whereas residents spend 2 to 3 months per year. Thus, interns but not residents observed later in the year might have spent significantly more time on an inpatient service. However, in all instances, none of the team members observed had worked together previously.
Data Collection
Data were collected over nine 1‐month periods from September 2008 through June 2011. Teams were observed daily for 2‐ to 4‐week periods during morning rounds, the time when the team discusses each patient and makes clinical decisions. Data collection started on the first day of the month, the first day that all team members worked together, and continued for approximately 27 days, the last day before the resident rotated to a different service. By comprehensively and systematically observing these teams' daily rounds, we obtained rich, in‐depth data with multiple data points, enabling us to assess specific team behaviors and interactions.
During the third and fourth months, we collected data on teams in which the attending changed partway through. We did this to understand the impact of individual attending change on team relationships. Because the team relationships differed with each attending, we analyzed them separately. Thus, we observed 7 teams for approximately 4‐week periods and 4 teams for approximately 2‐week periods.
Observers arrived in the team room prior to rounds to begin observations, staying until after rounds were completed. Detailed free‐text field notes were taken regarding team activities and behaviors, including how the teams made patient care decisions. Field notes included: length of rounds, which team members spoke during each patient discussion, who contributed to management discussions, how information from consultants was incorporated, how communication with others outside of the team occurred, how team members spoke with each other including the types of words used, and team member willingness to perform tasks outside of their usually defined role, among others. Field notes were collected in an open‐ended format to allow for inductive observations. Observers also recorded clinical data daily regarding each patient, including admission and discharge dates, and presenting complaint.
The observation team consisted of the principle investigator (PI) (hospitalist) and 2 research assistants (a graduate‐level medical anthropologist and social psychologist), all of whom were trained by a qualitative research expert to systematically collect data related to topics of interest. Observers were instructed to record what the teams were doing and talking about at all times, noting any behaviors that they felt reflected how team members related to each other and came to decisions about their patients, or that were characteristic of the team. To ensure consistency, the PI and 1 research assistant conducted observations jointly at the start of data collection for each team, checking concordance of observations daily using a percent agreement until general agreement on field note content and patient information reached 90%. Two individuals observed 24 days of data collection, representing 252 patient discussions (13% of observed discussions).
An age‐adjusted Charlson‐Deyo comorbidity score was calculated for each patient admitted to each team, using data from rounds and from each hospital's electronic health records (EHR).[27] We collected data regarding mental health conditions for each patient (substance use, mood disorder, cognitive disorder, or a combination) because these comorbidities could impact LOS or ULOS. Discharge diagnoses were based on the discharge summary in the EHR. We also collected data daily regarding team census and numbers of admissions to and discharges from each team to assess workload.
Three patient outcomes were measured: LOS, ULOS, and complications. LOS was defined as the total number of days the patient was in the hospital. ULOS was defined as the number of days a patient remained in the hospital after the day the team determined the patient was medically ready for discharge (assessed by either discussion on rounds or EHR documentation). ULOS may occur when postdischarge needs have been adequately assessed, or because of delays in care, which may be related to provider communication during the hospitalization. Complications were defined on a per‐patient, per‐day basis in 2 ways: the development of a new problem in the hospital, for example acute kidney injury, a hospital‐acquired infection, or delirium, or by the team noting a clinical deterioration after at least 24 hours of clinical stability, such as the patient requiring transfer to a higher level of care. Complications were determined based on discussions during rounds, with EHR verification if needed.
Analysis Phase I: Assessment of Relationship Characteristics
After the completion of data collection, field notes were reviewed by a research team member not involved in the original study design or primary data collection (senior medical student). We took this approach to guard against biasing the reviewer's view of team behaviors, both in terms of not having conducted observations of the teams and being blinded to patient outcomes.
The reviewer completed a series of 3 readings of all field notes. The first reading provided a summary of the content of the data and the individual teams. Behavioral patterns of each team were used to create an initial team profile. The field notes and profiles were reviewed by the PI and a coauthor not involved in data collection to ensure that the profiles adequately reflected the field notes. No significant changes to the profiles were made based on this review. The profiles were discussed at a meeting with members of the larger research team, including the PI, research assistants, and coinvestigators (with backgrounds in medicine, anthropology, and information and organization management). Behavior characteristics that could be used to distinguish teams were identified in the profiles using a grounded theory approach.
The second review of field notes was conducted to test the applicability of the characteristics identified in the first review. To systematically record the appearance of the behaviors, we created a matrix with a row for each behavior and columns for each team to note whether they exhibited each behavior. If the behavior was exhibited, specific examples were cataloged in the matrix. This matrix was reviewed and refined by the research team. During the final field note review meeting, the research team compared the summary matrix for each team, with the specific behaviors noted during the first reading of the field notes to ensure that all behaviors were recorded.
After cataloging behaviors, the research team assigned each behavior to 1 of the 7 Lanham relationship characteristics. We wanted to assess our observations against a relationship framework to ensure that we were able to systematically assess all aspects of relationships. The Lanham framework was initially developed based on a systematic review of the organizational and educational literatures, making it relevant to the complex environment of an academic medical inpatient team and allowing us to assess relationships at a fine‐grained, richly detailed level. This assignment was done by the author team as a group. Any questions were discussed and different interpretations resolved through consensus. The Lanham framework has 7 characteristics.[19] Based on the presence of behaviors associated with each relationship characteristic, we assigned a point to each team for each relationship characteristic observed. We considered a behavior type to be present if we observed it on at least 3 occasions on separate days. Though we used a threshold of at least 3 occurrences, most teams that did not receive a point for a particular characteristic did not have any instances in which we observed the characteristic. This was particularly true for trust and mindfulness, and least so for social/task relatedness. By summing these points, we calculated a total relationship score for each team, with potential scores ranging from 0 (for teams exhibiting no behaviors reflecting a particular relationship characteristic) to 7.
Analysis Phase II: Factor Analysis
To formally determine which relationship characteristics were most highly related, data were submitted to a principal components factor analysis using oblique rotation. Item separation was determined by visual inspection of the scree plot and eigenvalues over 1.
Analysis Phase III: Assessing the Association between Physician Team Relationship Characteristics and Patient Outcomes
We examined the association between team relationships and patient outcomes using team relationship scores. For the LOS/ULOS analysis, we only included patients whose entire hospitalization occurred under the care of the team we observed. Patients who were on the team at the start of the month, were transferred from another service, or who remained hospitalized after the end of the team's time together were excluded. The longest possible LOS for patients whose entire hospitalization occurred on teams that were observed for half a month was 12 days. To facilitate accurate comparison between teams, we only included patients whose LOS was 12 days.
Complication rates were defined on a per‐patient per‐day basis to normalize for different team volumes and days of observation. For this analysis, we included patients who remained on the team after data collection completion, patients transferred to another team, or patients transferred from another team. However, we only counted complications that occurred at least 24 hours following transfer to minimize the likelihood that the complication was related to the care of other physicians.
Preliminary analysis involved inspection and assessment of the distribution of all variables followed, by a general linear modeling approach to assess the association between patient and workload covariates and outcomes.[28, 29] Because we anticipated that outcome variables would be markedly skewed, we also planned to assess the association between relationship characteristics with outcomes using the Kruskal‐Wallis rank sum test to compare groups with Dunn's test[30] for pairwise comparisons if overall significance occurred.[31] There are no known acceptable methods for covariate adjustments using the Kruskal‐Wallis method. All models were run using SAS software (SAS Institute Inc., Cary, NC).[32]
RESULTS
The research team observed 1941 discussions of 576 individual patients. Observations were conducted over 352 hours and 54 minutes, resulting in 741 pages of notes (see Supporting Table 1 in the online version of this article for data regarding individual team members). Teams observed over half‐months are referred to with a and b designations.
| Relationship Characteristic | Definition | Thirteen Types of Behaviors Observed in Field Notes | Observed Examples |
|---|---|---|---|
| Trust | Willingness to be vulnerable to others | Use of we instead of you or I by the attending | Where are we going with this guy? |
| Attending admitting I don't know | Let's go talk to him, I can't figure this out | ||
| Asking questions to help team members to think through problems | Will the echo change our management? How will it help us? | ||
| Diversity | Including different perspectives and different thinking | Team member participation in conversations about patients that are not theirs | One intern is presenting, another intern asks a question, and the resident joins the discussion |
| Inclusion of perspectives of those outside the team (nursing and family members) | Taking a break to call the nurse, having a family meeting | ||
| Respect | Valuing the opinions of others, honest and tactful interactions | Use of positive reinforcement by the attending | Being encouraging of the medical student's differential, saying excellent |
| How the team talks with patients | Asking if the patient has any concerns, what they can do to make them comfortable | ||
| Heedfulness | Awareness of how each person's roles impact the rest of the team | Team members performing tasks not expected of their role | One intern helping another with changing orders to transfer a patient |
| Summarizing plans and strategizing | Attending recaps the plan for the day, asks what they can do | ||
| Mindfulness | Openness to new ideas/free discussion about what is and is not working | Entire team engaged in discussion | Attending asks the medical student, intern, and resident what they think is going on |
| Social relatedness | Having socially related interactions | Social conversation among team members | Intern talks about their day off |
| Jokes by the attending | Showers and a bowel movement is the key to making people happy | ||
| Appropriate use of rich communication | Use of in‐person communication for sensitive or difficult issues | Using verbal communication with consultants or family | Intern is on the phone with the pharm D because there is a problem with the medication |
Creation of team profiles yielded 13 common behavior characteristics that were inductively identified and that could potentially distinguish teams, including consideration of perspectives outside of the team and team members performing tasks normally outside of their roles. Table 1 provides examples of and summarizes observed behaviors using examples from the field notes, mapping these behavior characteristics onto the Lanham relationship characteristics. The distribution of relationship characteristics and scores for each team are shown in Table 2.
| Relationship Characteristic | Team | ||||||||||
|---|---|---|---|---|---|---|---|---|---|---|---|
| 1 | 2 | 3a | 3b | 4a | 4b | 5 | 6 | 7 | 8 | 9 | |
| Trust | 0 | 0 | 1 | 0 | 0 | 0 | 1 | 0 | 1 | 1 | 1 |
| Diversity | 0 | 1 | 1 | 1 | 0 | 0 | 0 | 0 | 1 | 1 | 1 |
| Respect | 0 | 1 | 1 | 1 | 0 | 1 | 0 | 0 | 1 | 1 | 1 |
| Heedfulness | 0 | 1 | 1 | 0 | 1 | 0 | 1 | 0 | 1 | 1 | 1 |
| Mindfulness | 0 | 0 | 1 | 0 | 0 | 1 | 1 | 0 | 1 | 1 | 1 |
| Social/task relatedness | 0 | 1 | 1 | 0 | 1 | 1 | 1 | 0 | 1 | 1 | 1 |
| Rich/lean communication | 0 | 1 | 1 | 0 | 0 | 0 | 1 | 0 | 1 | 1 | 0 |
| Relationship score (no. of characteristics observed) | 0 | 5 | 7 | 2 | 2 | 3 | 5 | 0 | 7 | 7 | 6 |
Correlation between relationship characteristics ranged from 0.32 to 0.95 (see Supporting Table 2 in the online version of this article). Mindfulness and trust are more highly correlated with each other than with other variables, as are diversity and respect. We performed a principal components factor analysis. Based on scree plot inspection and eigenvalues >1, we kept 3 factors that explained 85% of the total variance (see Supporting Table 3 in the online version of this article).
| No. of Relationship Characteristics | |||
|---|---|---|---|
| 02 | 35 | 67 | |
| |||
| LOS, d, n=293 | |||
| Median | 4 | 5 | 3 |
| IQR | 5 | 4 | 3 |
| Mean | 4.7 (2.72) | 4.7 (2.52) | 4.1 (2.51), P=0.12a |
| ULOS, d, n=293 | |||
| Median | 0 | 0 | 0 |
| IQR | 0 | 0 | 0 |
| Mean | 0.37 (0.99) | 0.33 (0.96) | 0.13 (0.56), P=0.09a |
| Complications (per patient per day), n=398 | |||
| Median | 0 | 0 | 0 |
| IQR | 1 | 1 | 0 |
| Mean | 0.58 (1.06) | 0.45 (0.77) | 0.18 (0.59), P=0.001 compared to teams with 02 or 35 characteristics |
Our analyses of LOS and ULOS included 298 of the 576 patients. Two hundred sixty‐seven patients were excluded because their entire LOS did not occur while under the care of the observed teams. Eleven patients were removed from the analysis because their LOS was >12 days. The analysis of complications included 398 patients. In our preliminary general linear modeling approach, only patient workload was significantly associated with outcomes using a cutoff of P=0.05. Charlson‐Deyo score and mental health comorbidities were not associated with outcomes.
The results of the Kruskal‐Wallis test show the patient average ranking on each of the outcome variables by 3 groups (Table 3). Overall, teams with higher relationship scores had lower rank scores on all outcomes measures. However, the only statistically significant comparisons were for complications. Teams having 6 to 7 characteristics had a significantly lower complication rate ranking than teams with 0 to 2 and 3 to 5 (P=0.001). We did not find consistent differences between individual teams or groups of teams with relationship scores from 0 to 2, 3 to 5, and 6 to 7 with regard to Charlson score, mental health issues, or workload. The only significant differences were between Charlson‐Deyo scores for patients admitted to teams with low relationship scores of 0 to 2 versus high relationship scores of 6 to 7 (6.7 vs 5.1); scores for teams with relationship scores of 3 to 5 were not significantly different from the low or high groups.
Table 4 shows the Kruskal‐Wallace rank test results for each group of relationship characteristics identified in the factor analysis based on whether teams displayed all or none of the characteristics in the factor. There were no differences in these groupings for LOS. Teams that exhibited both mindfulness and trust had lower ranks on ULOS than teams that did not have either. Similarly, teams with heedfulness, social‐task relatedness, and more rich communication demonstrated lower ULOS rankings than teams who did not have all 3 characteristics.
| Mind/Trust | Diversity/Respect | Heed/Relate/Communicate | ||||
|---|---|---|---|---|---|---|
| Patient Outcome | None | Both | None | Both | None | All 3 |
| ||||||
| LOS, d, n=293 | ||||||
| Median | 4 | 4 | 4 | 4 | 4 | 4 |
| IQR | 5 | 3 | 4.5 | 3 | 4 | 4 |
| Mean | 4.7 (2.6) | 4.2 (2.5) | 4.7 (2.6) | 4.3 (2.5) | 4.4 (2.6) | 4.4 (2.6) |
| P value | 0.06a | 0.23a | 0.85a | |||
| ULOS, d, n=293 | ||||||
| Median | 0 | 0 | 0 | 0 | 0 | 0 |
| IQR | 0 | 0 | 0 | 0 | 0 | 0 |
| Mean | 0.39 (1.01) | 0.15 (0.62) | 0.33 (0.92) | 0.18 (0.71) | 0.32 (0.93) | 0.18 (0.69) |
| P value | 0.009 | 0.06 | 0.03 | |||
| Complications (per patient), n=389 | ||||||
| Median | 0 | 0 | 0 | 0 | 0 | 0 |
| IQR | 1 | 0 | 1 | 0 | 1 | 0 |
| Mean | 0.58 (1.01) | 0.19 (0.58) | 0.47 (0.81) | 0.29 (0.82) | 0.26 (0.92) | 0.28 (0.70) |
| P value | <0.0001 | 0.001 | 0.02 | |||
DISCUSSION
Relationships are critical to team function because they are the basis for the social interactions that are central to patient care. These interactions include how providers recognize and make sense of what is happening with patients, and how they learn to care for patients more effectively. Additionally, the high task interdependencies among inpatient providers require effective relationships for optimal care. In our study, inpatient medicine physician teams' relationships varied, and these differences were associated with ULOS and complications. Relationship characteristics are not mutually exclusive, and as our factor analysis demonstrates, are intercorrelated. Trust and mindfulness appear to be particularly important. Trust may foster psychological safety that in turn promotes the willingness of individuals to contribute their thoughts and ideas.[13] In low‐trust teams, providers may fear a negative impact for bringing forward a concern based on limited data. Mindful teams may be more likely to notice nuanced changes, or are more likely to talk when things just do not appear to be going in the right direction with the patient. In the case of acutely ill medical patients, trust and mindfulness may lead to an increased likelihood that clinical changes are recognized and discussed quickly. For example, on a team characterized by trust and mindfulness, the entire team was typically involved in care discussions, and the interns and students frequently asked a lot of questions, even regarding the care of patients they were not directly following. We observed that these questions and discussions often led the team to realize that they needed to make a change in management decisions (eg, discontinuing Bactrim, lowering insulin doses, adjusting antihypertensives, premedicating for intravenous contrast) that they had not caught in the assessment and plan portion of the patient care discussion. In another example, a medical student asked a tentative question after a patient needed to go quickly to the bathroom while they were examining her, leading the team to ask more questions that led to a more rapid evaluation of a potential urinary tract infection. This finding is consistent with the description of failure to rescue among surgical patients, in which mortality has been associated with the failure to recognize complications rapidly and act effectively.[33]
Our findings are limited in several ways. First, these data are from a single academic institution. Although we sought diversity among our teams and collected data across 2 hospitals, there may be local contextual factors that influenced our results. Second, our data demonstrate an association, but not causality. Our findings should be tested in studies that assess causality and potential mechanisms through which relationships influence outcomes. Third, the individuals observing the teams had some knowledge of patient outcomes through hearing patient discussions. However, by involving individuals who did not participate in observations and were blinded to outcomes in assessing team relationships, we addressed this potential bias. Fourth, our observations were largely focused on physician teams, not directly including other providers. Our difficulty in observing regular interactions between physicians and other providers underscores the need to increase contact among those caring for hospitalized patients, such as occurs through multidisciplinary rounds. We did include team communication with other disciplines in our assessment of the relationship characteristics of diversity and rich communication. Finally, our analysis was limited by our sample size. We observed a relatively small number of teams. Although we benefitted from seeing the change in team relationships that occurred with attending changes halfway through some of our data collection months, this did limit the number of patients we could include in our analyses. Though we did not observe obvious differences in relationships between the teams observed across the 2 hospitals, the small number of teams and hospitals precluded our ability to perform multilevel modeling analyses, which would have allowed us to assess or account for the influence of team or organizational factors. However, this small sample size did allow for a richer assessment of team behaviors.
Although preliminary, our findings are an important step in understanding the function of inpatient medical teams not only in terms of processes of care, but also in terms of relationships. Patient care is a social activity, requiring effective communication to develop working diagnoses, recognize changes in patients' clinical courses, and formulate effective treatment plans during and after hospitalization. Future work could follow several directions. One would be to assess the causal mechanisms through which relationships influence patient outcomes. These may include sensemaking, learning, and improved coordination. Positive relationships may facilitate interaction of tacit and explicit information, facilitating the creation of understandings that foster more effective patient care.[34] The dynamic nature of relationships and how patient outcomes in turn feed back into relationships could be an area of exploration. This line of research could build on the idea of teaming.[35] Understanding relationships across multidisciplinary teams or with patients and families would be another direction. Finally, our results could point to potential interventions to improve patient outcomes through improving relationships. Better understanding of the nature of effective relationships among providers should enable us to develop more effective strategies to improve the care of hospitalized patients. In the larger context of payment reforms that require greater coordination and communication among and across providers, a greater understanding of how relationships influence patient outcomes will be important.
Acknowledgements
The authors thank the physicians involved in this study and Ms. Shannon Provost for her involvement in discussions of this work.
Disclosures: The research reported herein was supported by the Department of Veterans Affairs, Veterans Health Administration, Health Services Research and Development Service (CDA 07‐022). Investigator salary support was provided through this funding, and through the South Texas Veterans Health Care System. The views expressed in this article are those of the authors and do not necessarily reflect the position or policy of the Department of Veterans Affairs. Dr. McDaniel receives support from the IC[2] Institute of the University of Texas at Austin. Dr. Luci Leykum had full access to all of the data in the study and takes responsibility for the integrity of the data and the accuracy of the data analysis. The authors report no conflicts of interest.
- . Redesigning health care with insights from the science of complex adaptive systems. In: Crossing the Quality Chasm: A New Heath System for the 21st Century. Washington, DC: National Academy of Sciences; 2000:309–322.
- , , , , , . Temporal trends in rates of patient harm resulting from medical care. N Engl J Med. 2010;323(22):2124–2135.
- , , , et al. Circumstances of patient falls and injuries in 9 hospitals in a mid‐western healthcare system. Infect Control Hosp Epidemiol. 2007;28(5):544–550.
- , . Point prevalence of wounds in a sample of acute hospitals in Canada. Int Wound J. 2009;6(4):287–293.
- , , , , , . Non‐adherence to guidelines: an avoidable cause of failure of empirical antimicrobial therapy in the presence of difficult‐to‐treat bacteria. Intensive Care Med. 2010;36(1):75–82.
- , , , , . Quality of care in U.S. hospitals as reflected by standardized measures, 2002–2004. N Engl J Med. 2005;353(3):255–264.
- Centers for Disease Control and Prevention. National Center for Emerging and Zoonotic Infectious Diseases. Division of Healthcare Quality Promotion. Checklist for prevention of central line associated blood stream infections. Available at: http://www.cdc.gov/HAI/pdfs/bsi/checklist‐for‐CLABSI.pdf. Accessed August 3, 2014.
- Safer Healthcare Partners, LLC. Checklists: a critical patient safety tool. Available at: http://www.saferhealthcare.com/high‐reliability‐topics/checklists. Accessed July 31, 2014.
- . Making Things Work: Solving Complex Problems in a Complex World. Boston, MA: Knowledge Press; 2004:117–160.
- . High Performance Healthcare: Using The Power of Relationships to Achieve Quality, Efficiency, and Resilience. 1st ed. New York, NY: McGraw‐Hill; 2009.
- , . Design of high reliability organizations in health care. Qual Saf Health Care. 2006;15(suppl 1):i4–i9.
- , , , . Does team training work? Principles for health care. Acad Emerg Med. 2008;15(11):1002–1009.
- . Speaking up in the operating room: how team leaders promote learning in interdisciplinary action teams. J Manag Stud. 2003;40(6):1419–1452.
- , , , et al. Association between implementation of a medical team training program and surgical mortality. JAMA. 2010;304(15):1693–1700.
- , , , . Group cognition, membership change, and performance: Investigating the benefits and detriments of collective knowledge. Organ Behav Hum Decis Process. 2007;103(2):159–178.
- , , , , , . Reciprocal learning and chronic care model implementation in primary care: results from a new scale of learning in primary care settings. BMC Health Serv Res. 2011;11:44.
- , , , , . The importance of relational coordination and reciprocal learning for chronic illness care within primary care teams. Health Care Manage Rev. 2012;38(1):20–28.
- , , , , . Explaining Michigan: developing an ex post theory of a quality improvement program. Milbank Q. 2011;89(2):167–205.
- , , , et al. How improving practice relationships among clinicians and nonclinicians can improve quality in primary care. Jt Comm J Qual Patient Saf. 2009;35(9):457–466.
- , , , et al. Relationship quality and patient‐assessed quality of care in VA primary care clinics: development and validation of the work relationships scale. Ann Fam Med. 2013;11(6):543–549.
- , . Designing and Conducting Mixed Methods Research. 2nd ed. Thousand Oaks, CA: Sage; 2011.
- . Qualitative Evaluation Methods. Thousand Oaks, CA: Sage; 2002.
- , , . Qualitative methods in research on health care quality. Qual Saf Health Care. 2002;11:148–152.
- . Managing the negatives of experience in physician teams. Health Care Manage Rev. 2010;35(1):65–76.
- , , , , . Rethinking resident supervision to improve safety: from hierarchical to interprofessional models. J Hosp Med. 2011;6(8):445 b452.
- , , , . Dynamic delegation: shared, hierarchical, and deindividualized leadership in extreme action teams. Adm Sci Q. 2006;51(4):590–621.
- , , . Adapting a clinical comorbidity index for use with ICD‐9‐CM administrative databases. J Clin Epidemiol. 1992;45(6):613–619.
- . Exploratory Data Analysis. Reading, MA: Addison‐Wesley; 1977.
- . Biostatistical Analysis. 4th ed. Upper Saddle River, NJ: Pearson Prentice‐Hall; 2010.
- . Multiple contrasts using rank sums. Technometrics. 1964;6:241–252.
- , . A SAS macro implementation of a multiple comparison post hoc test for a Kruskal–Wallis analysis. Comput Methods Programs Biomed. 2011;102:75–80.
- SAS/STAT Software [computer program]. Version 9.1. Cary, NC: SAS Institute Inc.; 2003.
- , , . Complications, failure to rescue, and mortality with major inpatient surgery in Medicare patients. Ann Surg. 2009;250(6):1029–1034.
- . A dynamic theory of organizational knowledge creation. Org Sci. 1994;5(1):14–37.
- . Teaming: How Organizations Learn, Innovate, and Compete in the Knowledge Economy. 1st ed. Boston, MA: Harvard Business School; 2012.
Since the Institute of Medicine Report To Err is Human, increased attention has been paid to improving the care of hospitalized patients.[1] Strategies include utilization of guidelines and pathways, and the application of quality improvement techniques to improve or standardize processes. Despite improvements in focused areas such as prevention of hospital‐acquired infections, evidence suggests that outcomes for hospitalized patients remain suboptimal.[2] Rates of errors and hospital‐related complications such as falls, decubitus ulcers, and infections remain high,[3, 4, 5] and not all patients receive what is known to be appropriate care.[6]
Many attempts to improve inpatient care have used process‐improvement approaches, focusing on impacting individuals' behaviors, or on breaking down processes into component parts. Examples include central line bundles or checklists.[7, 8] These approaches attempt to ensure that providers do things in a standardized way, but are implicitly based on the reductionist assumption that we can break processes down into predictable parts to improve the system. An alternative way to understand clinical systems is based on interdependencies between individuals in the system, or the ways in which parts of the system interact with each other, which may be unpredictable over time.[1, 9] Whereas these interdependencies include care processes, they also encompass the providers who care for patients. Providers working together vary in terms of the kinds of relationships they have with each other. Those relationships are crucial to system function because they are the foundation for the interactions that lead to effective patient care.
The application of several frameworks or approaches for considering healthcare systems in terms of relationships highlights the importance of this way of understanding system function. The include complexity science,[1, 7] relational coordination (which is grounded in complexity science),[10] high reliability,[11] and the Big Five for teamwork.[12]
Research indicates that interactions among healthcare providers can have important influences on outcomes.[13, 14, 15, 16, 17] Additionally, the initial implementation of checklists to prevent central‐line associated infections appeared to change provider relationships in a way that significantly influenced their success.[18] For example, positive primary care clinic member relationships as assessed by the Lanham framework have been associated with better chronic care model implementation, learning, and patient experience of care.[19, 20] This framework, which we apply here, identifies 7 relationship characteristics: (1) trust; (2) diversity; (3) respect; (4) mindfulness, or being open to new ideas from others; (5) heedfulness, or an understanding of how one's roles influence those of others; (6) use of rich in‐person or verbal communication, particularly for potentially ambiguous information open to multiple interpretations; and (7) having a mixture of social and task relatedness among teams, or relatedness outside of only work‐related tasks.[19] Relationships within surgical teams that are characterized by psychological safety and diversity are associated with successful uptake of new techniques and decreased mortality.[13, 14] Relationships are important because the ability of patients and providers to learn and make sense of their patients' illnesses is grounded in relationships.
We sought to better understand and characterize inpatient physician teams' relationships, and assess the association between team relationships as evaluated by Lanham's framework and outcomes for hospitalized patients. Data on relationships among inpatient medical teams are few, despite the fact that these teams provide a great proportion of inpatient care. Additionally, the care of hospitalized medical patients is complex and uncertain, often involving multiple providers, making provider relationships potentially even more important to outcomes than in other settings.
METHODS
Overview
We conducted an observational, convergent mixed‐methods study of inpatient medicine teams.[21, 22, 23] We focused on inpatient physician teams, defining them as the functional work group responsible for medical decision making in academic medical centers. Physician teams in this context have been studied in terms of social hierarchy, authority, and delegation.[24, 25, 26] Focusing on the relationships within these groups could provide insights into strategies to mitigate potential negative effects of hierarchy. We recognize that other providers are closely involved in the care of hospitalized patients, and although we did not have standard interactions between physicians, nurses, case managers, and other providers that we could consistently observe, we did include interactions with these other providers in our observations and assessments of team relationships. Because this work is among the first in inpatient medical teams, we chose to study a small number of teams in great depth, allowing us to make rich assessments of team relationships.
We chose patient outcomes of length of stay (LOS), unnecessary LOS (ULOS), and complication rates, adjusted for patient characteristics and team workload. LOS is an important metric of inpatient care delivery. We feel ULOS is an aspect of LOS that is dependent on the physician team, as it reflects their preparation of the patient for discharge. Finally, we chose complication rates because hospital‐acquired conditions and complications are important contributors to inpatient morbidity, and because recent surgical literature has identified complication rates as a contributor to mortality that could be related to providers' collective ability to recognize complications and act quickly.
This study was approved by the institutional review board at the University of Texas Health Science Center at San Antonio (UTHSCSA), the Research and Development Committee for the South Texas Veterans Health Care System (STVHCS), and the Research Committee at University Health System (UHS). All physicians consented to participate in the study. We obtained a waiver of consent for inclusion of patient data.
Setting and Study Participants
This study was conducted at the 2 UTHSCSA primary teaching affiliates. The Audie L. Murphy Veterans Affairs Hospital is the 220‐bed acute‐care hospital of the STVHCS. University Hospital is the 614‐bed, level‐I trauma, acute‐care facility for UHS, the county system for Bexar County, which includes the San Antonio, Texas major metropolitan area.
The inpatient internal medicine physician team was our unit of study. Inpatient medicine teams consisted of 1 faculty attending physician, 1 postgraduate year (PGY)‐2 or PGY‐3 resident, and 2 PGY‐1 members. In addition, typically 2 to 3 third‐year medical students were part of the team, and a subintern was sometimes present. Doctor of Pharmacy faculty and students were also occasionally part of the team. Social workers and case managers often joined team rounds for portions of the time, and nurses sometimes joined bedside rounds on specific patients. These teams admit all medicine patients with the exception of those with acute coronary syndromes, new onset congestive heart failure, or arrhythmias. Patients are randomly assigned to teams based on time of admission and call schedules.
Between these 2 hospitals, there are 10 inpatient medicine teams caring for patients, with a pool of over 40 potential faculty attendings. Our goal was to observe teams that would be most likely to vary in terms of their relationship characteristics and patient outcomes through observing teams with a range of individual members. We used a purposeful sampling approach to obtain a diverse sample, sampling based on physician attributes and time of year.[16, 17] Three characteristics were most important: attending physician years of experience, attending involvement in educational and administrative leadership, and the presence of struggling resident members, as defined by being on probation or having been discussed in the residency Clinical Competency Committee. We did not set explicit thresholds in terms of attending experience, but instead sought to ensure a range. The attendings we observed were more likely to be involved in education and administrative leadership activities, but were otherwise similar to those we did not observe in terms of years of experience. We included struggling residents to observe individuals with a range of skill sets, and not just high‐performing individuals. We obtained attending information based on our knowledge of the attending faculty pool, and from the internal medicine residency program. We sampled across the year to ensure a diversity of trainee experience, but did not observe teams in either July or August, as these months were early in the academic year. Interns spend approximately 5 months per year on inpatient services, whereas residents spend 2 to 3 months per year. Thus, interns but not residents observed later in the year might have spent significantly more time on an inpatient service. However, in all instances, none of the team members observed had worked together previously.
Data Collection
Data were collected over nine 1‐month periods from September 2008 through June 2011. Teams were observed daily for 2‐ to 4‐week periods during morning rounds, the time when the team discusses each patient and makes clinical decisions. Data collection started on the first day of the month, the first day that all team members worked together, and continued for approximately 27 days, the last day before the resident rotated to a different service. By comprehensively and systematically observing these teams' daily rounds, we obtained rich, in‐depth data with multiple data points, enabling us to assess specific team behaviors and interactions.
During the third and fourth months, we collected data on teams in which the attending changed partway through. We did this to understand the impact of individual attending change on team relationships. Because the team relationships differed with each attending, we analyzed them separately. Thus, we observed 7 teams for approximately 4‐week periods and 4 teams for approximately 2‐week periods.
Observers arrived in the team room prior to rounds to begin observations, staying until after rounds were completed. Detailed free‐text field notes were taken regarding team activities and behaviors, including how the teams made patient care decisions. Field notes included: length of rounds, which team members spoke during each patient discussion, who contributed to management discussions, how information from consultants was incorporated, how communication with others outside of the team occurred, how team members spoke with each other including the types of words used, and team member willingness to perform tasks outside of their usually defined role, among others. Field notes were collected in an open‐ended format to allow for inductive observations. Observers also recorded clinical data daily regarding each patient, including admission and discharge dates, and presenting complaint.
The observation team consisted of the principle investigator (PI) (hospitalist) and 2 research assistants (a graduate‐level medical anthropologist and social psychologist), all of whom were trained by a qualitative research expert to systematically collect data related to topics of interest. Observers were instructed to record what the teams were doing and talking about at all times, noting any behaviors that they felt reflected how team members related to each other and came to decisions about their patients, or that were characteristic of the team. To ensure consistency, the PI and 1 research assistant conducted observations jointly at the start of data collection for each team, checking concordance of observations daily using a percent agreement until general agreement on field note content and patient information reached 90%. Two individuals observed 24 days of data collection, representing 252 patient discussions (13% of observed discussions).
An age‐adjusted Charlson‐Deyo comorbidity score was calculated for each patient admitted to each team, using data from rounds and from each hospital's electronic health records (EHR).[27] We collected data regarding mental health conditions for each patient (substance use, mood disorder, cognitive disorder, or a combination) because these comorbidities could impact LOS or ULOS. Discharge diagnoses were based on the discharge summary in the EHR. We also collected data daily regarding team census and numbers of admissions to and discharges from each team to assess workload.
Three patient outcomes were measured: LOS, ULOS, and complications. LOS was defined as the total number of days the patient was in the hospital. ULOS was defined as the number of days a patient remained in the hospital after the day the team determined the patient was medically ready for discharge (assessed by either discussion on rounds or EHR documentation). ULOS may occur when postdischarge needs have been adequately assessed, or because of delays in care, which may be related to provider communication during the hospitalization. Complications were defined on a per‐patient, per‐day basis in 2 ways: the development of a new problem in the hospital, for example acute kidney injury, a hospital‐acquired infection, or delirium, or by the team noting a clinical deterioration after at least 24 hours of clinical stability, such as the patient requiring transfer to a higher level of care. Complications were determined based on discussions during rounds, with EHR verification if needed.
Analysis Phase I: Assessment of Relationship Characteristics
After the completion of data collection, field notes were reviewed by a research team member not involved in the original study design or primary data collection (senior medical student). We took this approach to guard against biasing the reviewer's view of team behaviors, both in terms of not having conducted observations of the teams and being blinded to patient outcomes.
The reviewer completed a series of 3 readings of all field notes. The first reading provided a summary of the content of the data and the individual teams. Behavioral patterns of each team were used to create an initial team profile. The field notes and profiles were reviewed by the PI and a coauthor not involved in data collection to ensure that the profiles adequately reflected the field notes. No significant changes to the profiles were made based on this review. The profiles were discussed at a meeting with members of the larger research team, including the PI, research assistants, and coinvestigators (with backgrounds in medicine, anthropology, and information and organization management). Behavior characteristics that could be used to distinguish teams were identified in the profiles using a grounded theory approach.
The second review of field notes was conducted to test the applicability of the characteristics identified in the first review. To systematically record the appearance of the behaviors, we created a matrix with a row for each behavior and columns for each team to note whether they exhibited each behavior. If the behavior was exhibited, specific examples were cataloged in the matrix. This matrix was reviewed and refined by the research team. During the final field note review meeting, the research team compared the summary matrix for each team, with the specific behaviors noted during the first reading of the field notes to ensure that all behaviors were recorded.
After cataloging behaviors, the research team assigned each behavior to 1 of the 7 Lanham relationship characteristics. We wanted to assess our observations against a relationship framework to ensure that we were able to systematically assess all aspects of relationships. The Lanham framework was initially developed based on a systematic review of the organizational and educational literatures, making it relevant to the complex environment of an academic medical inpatient team and allowing us to assess relationships at a fine‐grained, richly detailed level. This assignment was done by the author team as a group. Any questions were discussed and different interpretations resolved through consensus. The Lanham framework has 7 characteristics.[19] Based on the presence of behaviors associated with each relationship characteristic, we assigned a point to each team for each relationship characteristic observed. We considered a behavior type to be present if we observed it on at least 3 occasions on separate days. Though we used a threshold of at least 3 occurrences, most teams that did not receive a point for a particular characteristic did not have any instances in which we observed the characteristic. This was particularly true for trust and mindfulness, and least so for social/task relatedness. By summing these points, we calculated a total relationship score for each team, with potential scores ranging from 0 (for teams exhibiting no behaviors reflecting a particular relationship characteristic) to 7.
Analysis Phase II: Factor Analysis
To formally determine which relationship characteristics were most highly related, data were submitted to a principal components factor analysis using oblique rotation. Item separation was determined by visual inspection of the scree plot and eigenvalues over 1.
Analysis Phase III: Assessing the Association between Physician Team Relationship Characteristics and Patient Outcomes
We examined the association between team relationships and patient outcomes using team relationship scores. For the LOS/ULOS analysis, we only included patients whose entire hospitalization occurred under the care of the team we observed. Patients who were on the team at the start of the month, were transferred from another service, or who remained hospitalized after the end of the team's time together were excluded. The longest possible LOS for patients whose entire hospitalization occurred on teams that were observed for half a month was 12 days. To facilitate accurate comparison between teams, we only included patients whose LOS was 12 days.
Complication rates were defined on a per‐patient per‐day basis to normalize for different team volumes and days of observation. For this analysis, we included patients who remained on the team after data collection completion, patients transferred to another team, or patients transferred from another team. However, we only counted complications that occurred at least 24 hours following transfer to minimize the likelihood that the complication was related to the care of other physicians.
Preliminary analysis involved inspection and assessment of the distribution of all variables followed, by a general linear modeling approach to assess the association between patient and workload covariates and outcomes.[28, 29] Because we anticipated that outcome variables would be markedly skewed, we also planned to assess the association between relationship characteristics with outcomes using the Kruskal‐Wallis rank sum test to compare groups with Dunn's test[30] for pairwise comparisons if overall significance occurred.[31] There are no known acceptable methods for covariate adjustments using the Kruskal‐Wallis method. All models were run using SAS software (SAS Institute Inc., Cary, NC).[32]
RESULTS
The research team observed 1941 discussions of 576 individual patients. Observations were conducted over 352 hours and 54 minutes, resulting in 741 pages of notes (see Supporting Table 1 in the online version of this article for data regarding individual team members). Teams observed over half‐months are referred to with a and b designations.
| Relationship Characteristic | Definition | Thirteen Types of Behaviors Observed in Field Notes | Observed Examples |
|---|---|---|---|
| Trust | Willingness to be vulnerable to others | Use of we instead of you or I by the attending | Where are we going with this guy? |
| Attending admitting I don't know | Let's go talk to him, I can't figure this out | ||
| Asking questions to help team members to think through problems | Will the echo change our management? How will it help us? | ||
| Diversity | Including different perspectives and different thinking | Team member participation in conversations about patients that are not theirs | One intern is presenting, another intern asks a question, and the resident joins the discussion |
| Inclusion of perspectives of those outside the team (nursing and family members) | Taking a break to call the nurse, having a family meeting | ||
| Respect | Valuing the opinions of others, honest and tactful interactions | Use of positive reinforcement by the attending | Being encouraging of the medical student's differential, saying excellent |
| How the team talks with patients | Asking if the patient has any concerns, what they can do to make them comfortable | ||
| Heedfulness | Awareness of how each person's roles impact the rest of the team | Team members performing tasks not expected of their role | One intern helping another with changing orders to transfer a patient |
| Summarizing plans and strategizing | Attending recaps the plan for the day, asks what they can do | ||
| Mindfulness | Openness to new ideas/free discussion about what is and is not working | Entire team engaged in discussion | Attending asks the medical student, intern, and resident what they think is going on |
| Social relatedness | Having socially related interactions | Social conversation among team members | Intern talks about their day off |
| Jokes by the attending | Showers and a bowel movement is the key to making people happy | ||
| Appropriate use of rich communication | Use of in‐person communication for sensitive or difficult issues | Using verbal communication with consultants or family | Intern is on the phone with the pharm D because there is a problem with the medication |
Creation of team profiles yielded 13 common behavior characteristics that were inductively identified and that could potentially distinguish teams, including consideration of perspectives outside of the team and team members performing tasks normally outside of their roles. Table 1 provides examples of and summarizes observed behaviors using examples from the field notes, mapping these behavior characteristics onto the Lanham relationship characteristics. The distribution of relationship characteristics and scores for each team are shown in Table 2.
| Relationship Characteristic | Team | ||||||||||
|---|---|---|---|---|---|---|---|---|---|---|---|
| 1 | 2 | 3a | 3b | 4a | 4b | 5 | 6 | 7 | 8 | 9 | |
| Trust | 0 | 0 | 1 | 0 | 0 | 0 | 1 | 0 | 1 | 1 | 1 |
| Diversity | 0 | 1 | 1 | 1 | 0 | 0 | 0 | 0 | 1 | 1 | 1 |
| Respect | 0 | 1 | 1 | 1 | 0 | 1 | 0 | 0 | 1 | 1 | 1 |
| Heedfulness | 0 | 1 | 1 | 0 | 1 | 0 | 1 | 0 | 1 | 1 | 1 |
| Mindfulness | 0 | 0 | 1 | 0 | 0 | 1 | 1 | 0 | 1 | 1 | 1 |
| Social/task relatedness | 0 | 1 | 1 | 0 | 1 | 1 | 1 | 0 | 1 | 1 | 1 |
| Rich/lean communication | 0 | 1 | 1 | 0 | 0 | 0 | 1 | 0 | 1 | 1 | 0 |
| Relationship score (no. of characteristics observed) | 0 | 5 | 7 | 2 | 2 | 3 | 5 | 0 | 7 | 7 | 6 |
Correlation between relationship characteristics ranged from 0.32 to 0.95 (see Supporting Table 2 in the online version of this article). Mindfulness and trust are more highly correlated with each other than with other variables, as are diversity and respect. We performed a principal components factor analysis. Based on scree plot inspection and eigenvalues >1, we kept 3 factors that explained 85% of the total variance (see Supporting Table 3 in the online version of this article).
| No. of Relationship Characteristics | |||
|---|---|---|---|
| 02 | 35 | 67 | |
| |||
| LOS, d, n=293 | |||
| Median | 4 | 5 | 3 |
| IQR | 5 | 4 | 3 |
| Mean | 4.7 (2.72) | 4.7 (2.52) | 4.1 (2.51), P=0.12a |
| ULOS, d, n=293 | |||
| Median | 0 | 0 | 0 |
| IQR | 0 | 0 | 0 |
| Mean | 0.37 (0.99) | 0.33 (0.96) | 0.13 (0.56), P=0.09a |
| Complications (per patient per day), n=398 | |||
| Median | 0 | 0 | 0 |
| IQR | 1 | 1 | 0 |
| Mean | 0.58 (1.06) | 0.45 (0.77) | 0.18 (0.59), P=0.001 compared to teams with 02 or 35 characteristics |
Our analyses of LOS and ULOS included 298 of the 576 patients. Two hundred sixty‐seven patients were excluded because their entire LOS did not occur while under the care of the observed teams. Eleven patients were removed from the analysis because their LOS was >12 days. The analysis of complications included 398 patients. In our preliminary general linear modeling approach, only patient workload was significantly associated with outcomes using a cutoff of P=0.05. Charlson‐Deyo score and mental health comorbidities were not associated with outcomes.
The results of the Kruskal‐Wallis test show the patient average ranking on each of the outcome variables by 3 groups (Table 3). Overall, teams with higher relationship scores had lower rank scores on all outcomes measures. However, the only statistically significant comparisons were for complications. Teams having 6 to 7 characteristics had a significantly lower complication rate ranking than teams with 0 to 2 and 3 to 5 (P=0.001). We did not find consistent differences between individual teams or groups of teams with relationship scores from 0 to 2, 3 to 5, and 6 to 7 with regard to Charlson score, mental health issues, or workload. The only significant differences were between Charlson‐Deyo scores for patients admitted to teams with low relationship scores of 0 to 2 versus high relationship scores of 6 to 7 (6.7 vs 5.1); scores for teams with relationship scores of 3 to 5 were not significantly different from the low or high groups.
Table 4 shows the Kruskal‐Wallace rank test results for each group of relationship characteristics identified in the factor analysis based on whether teams displayed all or none of the characteristics in the factor. There were no differences in these groupings for LOS. Teams that exhibited both mindfulness and trust had lower ranks on ULOS than teams that did not have either. Similarly, teams with heedfulness, social‐task relatedness, and more rich communication demonstrated lower ULOS rankings than teams who did not have all 3 characteristics.
| Mind/Trust | Diversity/Respect | Heed/Relate/Communicate | ||||
|---|---|---|---|---|---|---|
| Patient Outcome | None | Both | None | Both | None | All 3 |
| ||||||
| LOS, d, n=293 | ||||||
| Median | 4 | 4 | 4 | 4 | 4 | 4 |
| IQR | 5 | 3 | 4.5 | 3 | 4 | 4 |
| Mean | 4.7 (2.6) | 4.2 (2.5) | 4.7 (2.6) | 4.3 (2.5) | 4.4 (2.6) | 4.4 (2.6) |
| P value | 0.06a | 0.23a | 0.85a | |||
| ULOS, d, n=293 | ||||||
| Median | 0 | 0 | 0 | 0 | 0 | 0 |
| IQR | 0 | 0 | 0 | 0 | 0 | 0 |
| Mean | 0.39 (1.01) | 0.15 (0.62) | 0.33 (0.92) | 0.18 (0.71) | 0.32 (0.93) | 0.18 (0.69) |
| P value | 0.009 | 0.06 | 0.03 | |||
| Complications (per patient), n=389 | ||||||
| Median | 0 | 0 | 0 | 0 | 0 | 0 |
| IQR | 1 | 0 | 1 | 0 | 1 | 0 |
| Mean | 0.58 (1.01) | 0.19 (0.58) | 0.47 (0.81) | 0.29 (0.82) | 0.26 (0.92) | 0.28 (0.70) |
| P value | <0.0001 | 0.001 | 0.02 | |||
DISCUSSION
Relationships are critical to team function because they are the basis for the social interactions that are central to patient care. These interactions include how providers recognize and make sense of what is happening with patients, and how they learn to care for patients more effectively. Additionally, the high task interdependencies among inpatient providers require effective relationships for optimal care. In our study, inpatient medicine physician teams' relationships varied, and these differences were associated with ULOS and complications. Relationship characteristics are not mutually exclusive, and as our factor analysis demonstrates, are intercorrelated. Trust and mindfulness appear to be particularly important. Trust may foster psychological safety that in turn promotes the willingness of individuals to contribute their thoughts and ideas.[13] In low‐trust teams, providers may fear a negative impact for bringing forward a concern based on limited data. Mindful teams may be more likely to notice nuanced changes, or are more likely to talk when things just do not appear to be going in the right direction with the patient. In the case of acutely ill medical patients, trust and mindfulness may lead to an increased likelihood that clinical changes are recognized and discussed quickly. For example, on a team characterized by trust and mindfulness, the entire team was typically involved in care discussions, and the interns and students frequently asked a lot of questions, even regarding the care of patients they were not directly following. We observed that these questions and discussions often led the team to realize that they needed to make a change in management decisions (eg, discontinuing Bactrim, lowering insulin doses, adjusting antihypertensives, premedicating for intravenous contrast) that they had not caught in the assessment and plan portion of the patient care discussion. In another example, a medical student asked a tentative question after a patient needed to go quickly to the bathroom while they were examining her, leading the team to ask more questions that led to a more rapid evaluation of a potential urinary tract infection. This finding is consistent with the description of failure to rescue among surgical patients, in which mortality has been associated with the failure to recognize complications rapidly and act effectively.[33]
Our findings are limited in several ways. First, these data are from a single academic institution. Although we sought diversity among our teams and collected data across 2 hospitals, there may be local contextual factors that influenced our results. Second, our data demonstrate an association, but not causality. Our findings should be tested in studies that assess causality and potential mechanisms through which relationships influence outcomes. Third, the individuals observing the teams had some knowledge of patient outcomes through hearing patient discussions. However, by involving individuals who did not participate in observations and were blinded to outcomes in assessing team relationships, we addressed this potential bias. Fourth, our observations were largely focused on physician teams, not directly including other providers. Our difficulty in observing regular interactions between physicians and other providers underscores the need to increase contact among those caring for hospitalized patients, such as occurs through multidisciplinary rounds. We did include team communication with other disciplines in our assessment of the relationship characteristics of diversity and rich communication. Finally, our analysis was limited by our sample size. We observed a relatively small number of teams. Although we benefitted from seeing the change in team relationships that occurred with attending changes halfway through some of our data collection months, this did limit the number of patients we could include in our analyses. Though we did not observe obvious differences in relationships between the teams observed across the 2 hospitals, the small number of teams and hospitals precluded our ability to perform multilevel modeling analyses, which would have allowed us to assess or account for the influence of team or organizational factors. However, this small sample size did allow for a richer assessment of team behaviors.
Although preliminary, our findings are an important step in understanding the function of inpatient medical teams not only in terms of processes of care, but also in terms of relationships. Patient care is a social activity, requiring effective communication to develop working diagnoses, recognize changes in patients' clinical courses, and formulate effective treatment plans during and after hospitalization. Future work could follow several directions. One would be to assess the causal mechanisms through which relationships influence patient outcomes. These may include sensemaking, learning, and improved coordination. Positive relationships may facilitate interaction of tacit and explicit information, facilitating the creation of understandings that foster more effective patient care.[34] The dynamic nature of relationships and how patient outcomes in turn feed back into relationships could be an area of exploration. This line of research could build on the idea of teaming.[35] Understanding relationships across multidisciplinary teams or with patients and families would be another direction. Finally, our results could point to potential interventions to improve patient outcomes through improving relationships. Better understanding of the nature of effective relationships among providers should enable us to develop more effective strategies to improve the care of hospitalized patients. In the larger context of payment reforms that require greater coordination and communication among and across providers, a greater understanding of how relationships influence patient outcomes will be important.
Acknowledgements
The authors thank the physicians involved in this study and Ms. Shannon Provost for her involvement in discussions of this work.
Disclosures: The research reported herein was supported by the Department of Veterans Affairs, Veterans Health Administration, Health Services Research and Development Service (CDA 07‐022). Investigator salary support was provided through this funding, and through the South Texas Veterans Health Care System. The views expressed in this article are those of the authors and do not necessarily reflect the position or policy of the Department of Veterans Affairs. Dr. McDaniel receives support from the IC[2] Institute of the University of Texas at Austin. Dr. Luci Leykum had full access to all of the data in the study and takes responsibility for the integrity of the data and the accuracy of the data analysis. The authors report no conflicts of interest.
- . Redesigning health care with insights from the science of complex adaptive systems. In: Crossing the Quality Chasm: A New Heath System for the 21st Century. Washington, DC: National Academy of Sciences; 2000:309–322.
- , , , , , . Temporal trends in rates of patient harm resulting from medical care. N Engl J Med. 2010;323(22):2124–2135.
- , , , et al. Circumstances of patient falls and injuries in 9 hospitals in a mid‐western healthcare system. Infect Control Hosp Epidemiol. 2007;28(5):544–550.
- , . Point prevalence of wounds in a sample of acute hospitals in Canada. Int Wound J. 2009;6(4):287–293.
- , , , , , . Non‐adherence to guidelines: an avoidable cause of failure of empirical antimicrobial therapy in the presence of difficult‐to‐treat bacteria. Intensive Care Med. 2010;36(1):75–82.
- , , , , . Quality of care in U.S. hospitals as reflected by standardized measures, 2002–2004. N Engl J Med. 2005;353(3):255–264.
- Centers for Disease Control and Prevention. National Center for Emerging and Zoonotic Infectious Diseases. Division of Healthcare Quality Promotion. Checklist for prevention of central line associated blood stream infections. Available at: http://www.cdc.gov/HAI/pdfs/bsi/checklist‐for‐CLABSI.pdf. Accessed August 3, 2014.
- Safer Healthcare Partners, LLC. Checklists: a critical patient safety tool. Available at: http://www.saferhealthcare.com/high‐reliability‐topics/checklists. Accessed July 31, 2014.
- . Making Things Work: Solving Complex Problems in a Complex World. Boston, MA: Knowledge Press; 2004:117–160.
- . High Performance Healthcare: Using The Power of Relationships to Achieve Quality, Efficiency, and Resilience. 1st ed. New York, NY: McGraw‐Hill; 2009.
- , . Design of high reliability organizations in health care. Qual Saf Health Care. 2006;15(suppl 1):i4–i9.
- , , , . Does team training work? Principles for health care. Acad Emerg Med. 2008;15(11):1002–1009.
- . Speaking up in the operating room: how team leaders promote learning in interdisciplinary action teams. J Manag Stud. 2003;40(6):1419–1452.
- , , , et al. Association between implementation of a medical team training program and surgical mortality. JAMA. 2010;304(15):1693–1700.
- , , , . Group cognition, membership change, and performance: Investigating the benefits and detriments of collective knowledge. Organ Behav Hum Decis Process. 2007;103(2):159–178.
- , , , , , . Reciprocal learning and chronic care model implementation in primary care: results from a new scale of learning in primary care settings. BMC Health Serv Res. 2011;11:44.
- , , , , . The importance of relational coordination and reciprocal learning for chronic illness care within primary care teams. Health Care Manage Rev. 2012;38(1):20–28.
- , , , , . Explaining Michigan: developing an ex post theory of a quality improvement program. Milbank Q. 2011;89(2):167–205.
- , , , et al. How improving practice relationships among clinicians and nonclinicians can improve quality in primary care. Jt Comm J Qual Patient Saf. 2009;35(9):457–466.
- , , , et al. Relationship quality and patient‐assessed quality of care in VA primary care clinics: development and validation of the work relationships scale. Ann Fam Med. 2013;11(6):543–549.
- , . Designing and Conducting Mixed Methods Research. 2nd ed. Thousand Oaks, CA: Sage; 2011.
- . Qualitative Evaluation Methods. Thousand Oaks, CA: Sage; 2002.
- , , . Qualitative methods in research on health care quality. Qual Saf Health Care. 2002;11:148–152.
- . Managing the negatives of experience in physician teams. Health Care Manage Rev. 2010;35(1):65–76.
- , , , , . Rethinking resident supervision to improve safety: from hierarchical to interprofessional models. J Hosp Med. 2011;6(8):445 b452.
- , , , . Dynamic delegation: shared, hierarchical, and deindividualized leadership in extreme action teams. Adm Sci Q. 2006;51(4):590–621.
- , , . Adapting a clinical comorbidity index for use with ICD‐9‐CM administrative databases. J Clin Epidemiol. 1992;45(6):613–619.
- . Exploratory Data Analysis. Reading, MA: Addison‐Wesley; 1977.
- . Biostatistical Analysis. 4th ed. Upper Saddle River, NJ: Pearson Prentice‐Hall; 2010.
- . Multiple contrasts using rank sums. Technometrics. 1964;6:241–252.
- , . A SAS macro implementation of a multiple comparison post hoc test for a Kruskal–Wallis analysis. Comput Methods Programs Biomed. 2011;102:75–80.
- SAS/STAT Software [computer program]. Version 9.1. Cary, NC: SAS Institute Inc.; 2003.
- , , . Complications, failure to rescue, and mortality with major inpatient surgery in Medicare patients. Ann Surg. 2009;250(6):1029–1034.
- . A dynamic theory of organizational knowledge creation. Org Sci. 1994;5(1):14–37.
- . Teaming: How Organizations Learn, Innovate, and Compete in the Knowledge Economy. 1st ed. Boston, MA: Harvard Business School; 2012.
© 2014 Society of Hospital Medicine
Successfully Promoted Academic Hospitalists
The growth of academic hospital medicine has been driven by multiple factors including expanding clinical needs, housestaff duty hours' limitations, and an increasing focus on quality and patient safety.1 Hospitalists at academic medical centers frequently assume roles that differ substantially from traditional faculty positions. Academic hospitalists may have predominantly clinical positions, and may be involved in quality improvement and patient safety projects.24 Because of these commitments, many academic hospitalists spend less time on research or educational efforts.1, 5 Many have raised concerns that these unique job descriptions might lead to less time to devote to scholarship and academic pursuits, and consequently greater challenges in the promotions process.2, 5
There are little published data on promotion and tenure in academics, and even less specifically focused on the promotion of hospitalists. Theoretically, promotion should recognize an individual's contribution to his or her institution and field. However, each institution has unique criteria though which faculty achieve promotion. Previous articles addressing specific groups, such as part‐time,6 clinical faculty,79 or clinician‐educators10 may be relevant to hospitalists, as hospitalists may be more likely to fall into these categories. These reports suggest general agreement that promotion committees should consider and weigh clinical and educational work (in addition to scholarly publications) in the promotions process, but assessment methods vary across institutions and the contribution of activities, such as quality improvement, remain unclear. The educator's portfolio has gained momentum as a way to document valued teaching in many institutions,11, 12 but academic hospitalist participation in education may be limited.13
Literature related to the development of Divisions of General Internal Medicine is relevant insofar as similar concerns for promotion were expressed with the growth of their faculty.14, 15 However, its applicability may be limited by differences between roles of hospitalists and more traditional general medicine faculty.
To better understand the factors influencing promotion for academic hospitalists, the Society of General Internal Medicine (SGIM) Academic Hospitalist Task Force (AHTF) undertook a survey of promoted hospitalists who had successfully reached the rank of Associate Professor or higher.
Methods
Development of the Survey
The AHTF is a group of 18 academic hospitalists representing 15 institutions. Draft survey questions were developed by the group and sent to its members for refinement based on group consensus. Three cycles of refinement were performed, and the final survey (Appendix) was converted into an electronic format distributed through SurveyMonkey (SurveyMonkey.com, Portland, OR).
Identification of Survey Recipients
We identified a convenience sample of hospitalists who had been promoted to Associate or Full Professor of Medicine by querying members of the AHTF, the Society of Hospital Medicine (SHM) Academic Committee, and colleagues of academic medical centers with established hospitalist programs. We identified 33 promoted hospitalists.
Each recipient received an email from the AHTF cochairs in January 2009 asking them to complete the survey. If a response was not received in three weeks, a second email was sent. If a response was again not received, an AHTF task‐force member who knew the recipient asked him or her to complete the survey. All responses were received by March 2009.
Data Analysis
We examined responses using descriptive measures. Responses were analyzed across all respondents, as well as between these two subgroups. Statistical analysis with Fisher's exact test was performed using Stata 9.0 (StataCorp, College Station, TX).
Results
Of the 33 hospitalists who received the survey, 26 responded (response rate of 79%). Of these, 25 completed the survey in its entirely and were included in our analysis; 1 did not submit details regarding specific promotion‐related activities. General information regarding the respondents and their programs at the time of their promotion is contained in Table 1.
| |
| No. of institutions represented | 20 |
| Program age | 5.7 years (range 110) |
| Size of hospitalist program at the time of promotion | 10 (range 128) |
| Size of hospitalist program currently | 25 (range 745) |
| Programs that were separate divisions at the time of respondent promotion | 4 (20%) |
| Programs that are now separate divisions | 8 (40%) |
| Programs with 1‐track* promotion system | 2 (10%) |
| Programs with 2‐track promotion system | 8 (40%) |
| Programs with 3‐track promotion system | 9 (45%) |
| Other type of promotion system | 1 (5%) |
| Tenure track* | 8 (32%) |
| Institutions with tenure and promotion criteria that explicitly recognized hospitalist work | 8 (40%) |
The seven nonrespondents were from seven different institutions; however two of these institutions were represented by respondents. One nonrespondent had achieved a rank of Professor (through general medicine); the rest had been promoted to Associate Professor. One nonrespondent is known by the authors to hold a research position.
Ten respondents identified themselves as clinician‐educators (40%), ten as clinician‐administrators (40%), and five as clinician‐researchers (20%). Seventeen (68%) of the promoted hospitalists were not on a tenure track (as defined by them); they were more likely to have administrative or educational roles than a research appointment. Though the majority of self‐identified researchers were among the earliest to have been promoted, there were no statistically significant differences in self‐defined job description between more and less recently promoted hospitalists.
Promoted hospitalists were involved in a diverse range of activities which supported their promotion, including service (eg, institutional committees), education, research, and quality improvement. Nearly all hospitalists surveyed listed teaching and educational activities, and almost all had disseminated scholarly output and some degree of grant funding. Table 2 lists the specific activities in which respondents reported being engaged in each of these domains.
| Activity | Percent of Respondents Engaged in Activity |
|---|---|
| Service | |
| School of Medicine | 56 |
| Department of Medicine | 84 |
| Hospital | 80 |
| Professional societies | 92 |
| Administration | 67 |
| Education | |
| Medical student | 72 |
| Housestaff lectures | 84 |
| Ward/consult attending | 96 |
| Clinic precepting | 40 |
| Course director/curriculum development | 80 |
| Program director (or associate) | 36 |
| Research | |
| Peer‐reviewed publications | 92 |
| Abstract/poster presentations | 80 |
| Invited speaker | 96 |
| Reviewer/editor | 80 |
| Study section | 24 |
| Federal grants | 32 |
| Nonfederal grants (internal and external) | 72 |
| Quality improvement/patient safety | |
| Project member | 36 |
| Project leader | 52 |
| Institutional leadership | 32 |
| Curriculum development | 32 |
A range of individuals assisted the respondents in the promotion process. Twenty‐three (92%) respondents identified the individuals who supported their promotion, and all listed more than one person. Respondents most commonly credited their Section or Division Chief (43%) with facilitating their promotion, followed by Departmental Chairs or Vice/Associate Chairs (22%). Mentors (13%) or peers (8%) were also named. Four respondents (17%) named themselves as the person providing most guidance through the promotions process.
No consistent themes regarding obstacles emerged from free‐text responses to questions about the promotions process. One respondent felt that high clinical expectations made participation in other academic activities a challenge. The only other barriers noted were not being on the radar screen of the Division Chief of GIM, and difficulty identifying external, senior hospitalists to write letters in support of promotion.
When asked about the most important activities supporting their promotion, 24 respondents listed one to two key activities, detailed in Table 3. The most common response was peer‐reviewed publications (33%). Activities related to education and/or teaching were the next most common response (29%), specifically teaching, educational activities, curriculum design, or program director. Research or research funding represented 26% of responses. Valued activities outside of the respondent's institution included national reputation (21%) and service in professional societies (16%). Service or administrative responsibilities were mentioned by 25% of respondents.
| Category of Activity | Frequency of Response* (%) |
|---|---|
| |
| Research | 14 (58) |
| Peer‐reviewed publications | 8 (33) |
| Research | 4 (16) |
| Research funding | 2 (8) |
| Activities outside institution | 8 (33) |
| National reputation | 5 (21) |
| Professional society membership | 3 (13) |
| Education | 7 (29) |
| Teaching | 3 (13) |
| Educational activities | 2 (8) |
| Residency Director | 1 (4) |
| Curriculum development | 1 (4) |
| Service | 6 (25) |
| Service | 3 (13) |
| Administration/leadership of group | 3 (13) |
Discussion
We conducted a unique and comprehensive survey of academic hospitalists who have been promoted since 1995. We identified the most common and important activities contributing to promotion. Contrary to our expectations, survey respondents generally did not report being a hospitalist was a barrier in the promotions process.
Respondents were engaged in a diverse range of activities, including service, education, and research. Interestingly, no one identified him or herself primarily as a clinician. Teaching appeared to be a core component for all surveyed, regardless of academic appointment. Only one felt that her clinical workload as a hospitalist was an obstacle that prevented her from being engaged in other activities important for promotion. With more programs potentially evolving to separate divisions, the issue of being on the radar screen of a General Internal Medicine Division Chief may become less common over time. We hope that as programs mature and the numbers of associate and full professors increase, there will not be difficulty obtaining outside letters.
Although only 23% self‐identified as clinician‐researchers, nearly all had peer‐reviewed publications and other evidence of disseminated scholarly work. Grant funding, both federal and nonfederal, was also common among this group. This finding is consistent with self‐reported activities of a cohort of junior internal medicine faculty followed over three years who were eventually promoted, though the majority of those participants were classified as having either traditional clinician‐educator or clinician‐researcher positions.16
Despite outlining a seemingly clear pathway to promotion for hospitalists, concerns remain. Most importantly, those surveyed seem to have achieved promotion through relatively traditional academic job descriptions. Obtaining or maintaining these types of positions may be difficult as clinical needs at academic centers increase. According to a recent survey of hospitalist faculty,13 over one‐third spend more than 60% of their time on nonteaching clinical services. In that survey, over half of respondents had little or no protected time for scholarly activities. The contrast between this survey's findings and ours raises the question of whether our promoted sample had positions similar to those of most academic hospitalists. Given that the majority of our respondents noted peer‐reviewed publications and grant funding to be among the most important activities for promotion, there may be a dangerous disconnect for junior academic hospitalists who spend the majority of their time in direct patient care. Moreover, the promoted hospitalists in our survey reported relatively less participation in quality improvement/patient safety activities, in contrast to both anecdotal and survey reports that these activities are a major component of many academic hospitalist positions.5, 17 Most academic medical centers do not yet consider achievements in this area in their promotions criteria, potentially creating a barrier for the ranks of clinician quality improvers.1 Thus, significant obstacles to promotion of academic hospitalists may exist.
Leaders in academic hospital medicine are recognizing these potential barriers. A diverse group from major professional societies recently published a summary of the challenges and opportunities for the field of academic hospital medicine.1 Several needs and areas for intervention were identified, including enhanced faculty development and improved documentation of quality improvement activities. The SGIM, the SHM, and the Association of Chiefs and Leaders of General Internal Medicine (ACLGIM) recently cosponsored an intensive four‐day faculty development course for junior faculty to promote skills necessary for academic hospitalist success. Early reports indicate that this was a success.1820
In addition, the AHTF has developed a Quality Portfolio, paralleling the Educator's Portfolio, that can be used as a tool for documenting quality improvement and patient safety activities in a way that can be useful for career development and promotion.4 Lastly, the Society of Hospital Medicine has hosted the inaugural Academic Hospital Medicine Leadership Summit as part of the national meeting to provide mentorship and professional development opportunities for junior faculty. Our hope is that these opportunities, coupled with the growth of mid‐level and senior leaders in hospital medicine, will provide greater infrastructure for the development and promotion of junior faculty.
Our results may have relevance beyond hospitalist groups. With anticipated further limits on housestaff duty hours, more academic physicians may be asked to fill predominantly clinical roles. In addition, a growing emphasis on quality and patient safety may lead to a more general expansion of academicians who focus on these areas.15
Our survey and methodology have limitations. By including only promoted individuals, we did not survey hospitalists with the most difficulties in the promotions processthose who were not promoted. Thus, we are unable to directly compare successful versus unsuccessful strategies. Identifying nonpromoted academic hospitalists to understand the reasons they were not (or have not yet been) promoted could be a next step in this line of inquiry. Additionally, understanding the attitudes of promotions committees regarding hospitalists, and the clinical and quality improvement roles in which they are engaged, could enhance our current results. Finally, we surveyed a convenience sample of a limited numbers of hospitalists and institutions, and were unable to systematically account for variations in promotions criteria across institutions. However, to our knowledge, this is the most comprehensive study of promotions among academic hospitalists to date. Given the common themes that emerged in terms of activities that supported promotion, mentors, and advice, we believe that our sample was sufficient to identify important themes and advance our understanding of this nascent specialty.
In conclusion, our survey of promoted hospital medicine faculty provides valuable information for junior faculty and hospitalist leaders. Success was found through engaging in a diverse set of activities in the traditional areas of education, service, and scholarship, frequently in conjunction with developing recognition outside of their institutions. While all respondents were clinically active, none described themselves as having purely clinical roles. As academic hospitalist roles evolve, academic leaders will need to provide adequate mentorship, create time for scholarly pursuits, and promote documentation and recognition of nontraditional activities that may nonetheless be worthy of promotion.
- ,,,,,.Challenges and opportunities in academic hospital medicine: report from the academic hospital medicine summit.J Gen Intern Med.2009;24(5):636–641.
- ,,.Hospitalist educators: future of inpatient internal medicine training.Mt Sinai J Med.2008;75(5):436–451.
- ,,,.Hospitalists as emerging leaders in patient safety: lessons learned and future directions.J Patient Saf.2009;5(1):3–8.
- Quality Portfolio—Template and Instructions. Available at: http://www.sgim.org/userfiles/file/AHTF%20QP%20WEB%20TEMPLATE%20INS TRUCTIONS.pdf. Accessed on April 24,2010.
- .An innovative approach to support hospitalist physicians toward academic success.J Hosp Med.2008;3:314–318.
- ,,,.Institutional policies of U.S. medical schools regarding tenure, promotion, and benefits for part‐time faculty.Acad Med.2000;75(8):846–849.
- ,,,,,.Revising appointment, promotion, and tenure procedures to incorporate an expanded definition of scholarship: the University of Kentucky College of Medicine experience.Acad Med.2000;75(9)913–924.
- ,,,.Attitudes of clinical faculty about career progress, career success and recognition, and commitment to academic medicine. Results of a survey.Arch Intern Med.2000;160(17):2625–2629.
- ,,, et al.Promotion criteria for clinician‐educators.J Gen Intern Med.2003;18(9):711–716.
- ,,,.Documentation systems for educators seeking academic promotion in U.S. medical schools.Acad Med.2004;79(8):783–790.
- ,,,.Faculty development: academic opportunities for emergency medicine faculty on education career tracks.Acad Emerg Med.2003;10(10):1113–1117.
- ,,,.Burnout and internal medicine resident work hours restrictions.Arch Intern Med.2005;165(22):2595–2600.
- ,.Development of a Division of General Medicine in a Department of Internal Medicine.J Med Ed.1981;56:390–396.
- .The evolution of departments of medicine.N Engl J Med.1980;303(9):489–496.
- ,.Clinicians in quality improvement: a new career pathway in academic medicine.JAMA.2009;301(7):766–768.
- ,,.A time to be promoted. The prospective study of promotion in academia.J Gen Intern Med.2006;21(2):123–129.
- Academic Hospitalist Academy. Available at: http://www.sgim.org/index. cfm?pageId=815. Accessed on April 24,2010.
- .Reflections on the Academic Hospitalist Academy.SGIM Forum.2010;33(1):5.
- .The Academic Hospitalist Academy: Get anchored, equipped, and energized.SGIM Forum.2010;33(1):5–6.
- .Four formative days in the life of an academic hospitalist: the Academic Hospitalist Academy.SGIM Forum.2010;33(1):6.
The growth of academic hospital medicine has been driven by multiple factors including expanding clinical needs, housestaff duty hours' limitations, and an increasing focus on quality and patient safety.1 Hospitalists at academic medical centers frequently assume roles that differ substantially from traditional faculty positions. Academic hospitalists may have predominantly clinical positions, and may be involved in quality improvement and patient safety projects.24 Because of these commitments, many academic hospitalists spend less time on research or educational efforts.1, 5 Many have raised concerns that these unique job descriptions might lead to less time to devote to scholarship and academic pursuits, and consequently greater challenges in the promotions process.2, 5
There are little published data on promotion and tenure in academics, and even less specifically focused on the promotion of hospitalists. Theoretically, promotion should recognize an individual's contribution to his or her institution and field. However, each institution has unique criteria though which faculty achieve promotion. Previous articles addressing specific groups, such as part‐time,6 clinical faculty,79 or clinician‐educators10 may be relevant to hospitalists, as hospitalists may be more likely to fall into these categories. These reports suggest general agreement that promotion committees should consider and weigh clinical and educational work (in addition to scholarly publications) in the promotions process, but assessment methods vary across institutions and the contribution of activities, such as quality improvement, remain unclear. The educator's portfolio has gained momentum as a way to document valued teaching in many institutions,11, 12 but academic hospitalist participation in education may be limited.13
Literature related to the development of Divisions of General Internal Medicine is relevant insofar as similar concerns for promotion were expressed with the growth of their faculty.14, 15 However, its applicability may be limited by differences between roles of hospitalists and more traditional general medicine faculty.
To better understand the factors influencing promotion for academic hospitalists, the Society of General Internal Medicine (SGIM) Academic Hospitalist Task Force (AHTF) undertook a survey of promoted hospitalists who had successfully reached the rank of Associate Professor or higher.
Methods
Development of the Survey
The AHTF is a group of 18 academic hospitalists representing 15 institutions. Draft survey questions were developed by the group and sent to its members for refinement based on group consensus. Three cycles of refinement were performed, and the final survey (Appendix) was converted into an electronic format distributed through SurveyMonkey (SurveyMonkey.com, Portland, OR).
Identification of Survey Recipients
We identified a convenience sample of hospitalists who had been promoted to Associate or Full Professor of Medicine by querying members of the AHTF, the Society of Hospital Medicine (SHM) Academic Committee, and colleagues of academic medical centers with established hospitalist programs. We identified 33 promoted hospitalists.
Each recipient received an email from the AHTF cochairs in January 2009 asking them to complete the survey. If a response was not received in three weeks, a second email was sent. If a response was again not received, an AHTF task‐force member who knew the recipient asked him or her to complete the survey. All responses were received by March 2009.
Data Analysis
We examined responses using descriptive measures. Responses were analyzed across all respondents, as well as between these two subgroups. Statistical analysis with Fisher's exact test was performed using Stata 9.0 (StataCorp, College Station, TX).
Results
Of the 33 hospitalists who received the survey, 26 responded (response rate of 79%). Of these, 25 completed the survey in its entirely and were included in our analysis; 1 did not submit details regarding specific promotion‐related activities. General information regarding the respondents and their programs at the time of their promotion is contained in Table 1.
| |
| No. of institutions represented | 20 |
| Program age | 5.7 years (range 110) |
| Size of hospitalist program at the time of promotion | 10 (range 128) |
| Size of hospitalist program currently | 25 (range 745) |
| Programs that were separate divisions at the time of respondent promotion | 4 (20%) |
| Programs that are now separate divisions | 8 (40%) |
| Programs with 1‐track* promotion system | 2 (10%) |
| Programs with 2‐track promotion system | 8 (40%) |
| Programs with 3‐track promotion system | 9 (45%) |
| Other type of promotion system | 1 (5%) |
| Tenure track* | 8 (32%) |
| Institutions with tenure and promotion criteria that explicitly recognized hospitalist work | 8 (40%) |
The seven nonrespondents were from seven different institutions; however two of these institutions were represented by respondents. One nonrespondent had achieved a rank of Professor (through general medicine); the rest had been promoted to Associate Professor. One nonrespondent is known by the authors to hold a research position.
Ten respondents identified themselves as clinician‐educators (40%), ten as clinician‐administrators (40%), and five as clinician‐researchers (20%). Seventeen (68%) of the promoted hospitalists were not on a tenure track (as defined by them); they were more likely to have administrative or educational roles than a research appointment. Though the majority of self‐identified researchers were among the earliest to have been promoted, there were no statistically significant differences in self‐defined job description between more and less recently promoted hospitalists.
Promoted hospitalists were involved in a diverse range of activities which supported their promotion, including service (eg, institutional committees), education, research, and quality improvement. Nearly all hospitalists surveyed listed teaching and educational activities, and almost all had disseminated scholarly output and some degree of grant funding. Table 2 lists the specific activities in which respondents reported being engaged in each of these domains.
| Activity | Percent of Respondents Engaged in Activity |
|---|---|
| Service | |
| School of Medicine | 56 |
| Department of Medicine | 84 |
| Hospital | 80 |
| Professional societies | 92 |
| Administration | 67 |
| Education | |
| Medical student | 72 |
| Housestaff lectures | 84 |
| Ward/consult attending | 96 |
| Clinic precepting | 40 |
| Course director/curriculum development | 80 |
| Program director (or associate) | 36 |
| Research | |
| Peer‐reviewed publications | 92 |
| Abstract/poster presentations | 80 |
| Invited speaker | 96 |
| Reviewer/editor | 80 |
| Study section | 24 |
| Federal grants | 32 |
| Nonfederal grants (internal and external) | 72 |
| Quality improvement/patient safety | |
| Project member | 36 |
| Project leader | 52 |
| Institutional leadership | 32 |
| Curriculum development | 32 |
A range of individuals assisted the respondents in the promotion process. Twenty‐three (92%) respondents identified the individuals who supported their promotion, and all listed more than one person. Respondents most commonly credited their Section or Division Chief (43%) with facilitating their promotion, followed by Departmental Chairs or Vice/Associate Chairs (22%). Mentors (13%) or peers (8%) were also named. Four respondents (17%) named themselves as the person providing most guidance through the promotions process.
No consistent themes regarding obstacles emerged from free‐text responses to questions about the promotions process. One respondent felt that high clinical expectations made participation in other academic activities a challenge. The only other barriers noted were not being on the radar screen of the Division Chief of GIM, and difficulty identifying external, senior hospitalists to write letters in support of promotion.
When asked about the most important activities supporting their promotion, 24 respondents listed one to two key activities, detailed in Table 3. The most common response was peer‐reviewed publications (33%). Activities related to education and/or teaching were the next most common response (29%), specifically teaching, educational activities, curriculum design, or program director. Research or research funding represented 26% of responses. Valued activities outside of the respondent's institution included national reputation (21%) and service in professional societies (16%). Service or administrative responsibilities were mentioned by 25% of respondents.
| Category of Activity | Frequency of Response* (%) |
|---|---|
| |
| Research | 14 (58) |
| Peer‐reviewed publications | 8 (33) |
| Research | 4 (16) |
| Research funding | 2 (8) |
| Activities outside institution | 8 (33) |
| National reputation | 5 (21) |
| Professional society membership | 3 (13) |
| Education | 7 (29) |
| Teaching | 3 (13) |
| Educational activities | 2 (8) |
| Residency Director | 1 (4) |
| Curriculum development | 1 (4) |
| Service | 6 (25) |
| Service | 3 (13) |
| Administration/leadership of group | 3 (13) |
Discussion
We conducted a unique and comprehensive survey of academic hospitalists who have been promoted since 1995. We identified the most common and important activities contributing to promotion. Contrary to our expectations, survey respondents generally did not report being a hospitalist was a barrier in the promotions process.
Respondents were engaged in a diverse range of activities, including service, education, and research. Interestingly, no one identified him or herself primarily as a clinician. Teaching appeared to be a core component for all surveyed, regardless of academic appointment. Only one felt that her clinical workload as a hospitalist was an obstacle that prevented her from being engaged in other activities important for promotion. With more programs potentially evolving to separate divisions, the issue of being on the radar screen of a General Internal Medicine Division Chief may become less common over time. We hope that as programs mature and the numbers of associate and full professors increase, there will not be difficulty obtaining outside letters.
Although only 23% self‐identified as clinician‐researchers, nearly all had peer‐reviewed publications and other evidence of disseminated scholarly work. Grant funding, both federal and nonfederal, was also common among this group. This finding is consistent with self‐reported activities of a cohort of junior internal medicine faculty followed over three years who were eventually promoted, though the majority of those participants were classified as having either traditional clinician‐educator or clinician‐researcher positions.16
Despite outlining a seemingly clear pathway to promotion for hospitalists, concerns remain. Most importantly, those surveyed seem to have achieved promotion through relatively traditional academic job descriptions. Obtaining or maintaining these types of positions may be difficult as clinical needs at academic centers increase. According to a recent survey of hospitalist faculty,13 over one‐third spend more than 60% of their time on nonteaching clinical services. In that survey, over half of respondents had little or no protected time for scholarly activities. The contrast between this survey's findings and ours raises the question of whether our promoted sample had positions similar to those of most academic hospitalists. Given that the majority of our respondents noted peer‐reviewed publications and grant funding to be among the most important activities for promotion, there may be a dangerous disconnect for junior academic hospitalists who spend the majority of their time in direct patient care. Moreover, the promoted hospitalists in our survey reported relatively less participation in quality improvement/patient safety activities, in contrast to both anecdotal and survey reports that these activities are a major component of many academic hospitalist positions.5, 17 Most academic medical centers do not yet consider achievements in this area in their promotions criteria, potentially creating a barrier for the ranks of clinician quality improvers.1 Thus, significant obstacles to promotion of academic hospitalists may exist.
Leaders in academic hospital medicine are recognizing these potential barriers. A diverse group from major professional societies recently published a summary of the challenges and opportunities for the field of academic hospital medicine.1 Several needs and areas for intervention were identified, including enhanced faculty development and improved documentation of quality improvement activities. The SGIM, the SHM, and the Association of Chiefs and Leaders of General Internal Medicine (ACLGIM) recently cosponsored an intensive four‐day faculty development course for junior faculty to promote skills necessary for academic hospitalist success. Early reports indicate that this was a success.1820
In addition, the AHTF has developed a Quality Portfolio, paralleling the Educator's Portfolio, that can be used as a tool for documenting quality improvement and patient safety activities in a way that can be useful for career development and promotion.4 Lastly, the Society of Hospital Medicine has hosted the inaugural Academic Hospital Medicine Leadership Summit as part of the national meeting to provide mentorship and professional development opportunities for junior faculty. Our hope is that these opportunities, coupled with the growth of mid‐level and senior leaders in hospital medicine, will provide greater infrastructure for the development and promotion of junior faculty.
Our results may have relevance beyond hospitalist groups. With anticipated further limits on housestaff duty hours, more academic physicians may be asked to fill predominantly clinical roles. In addition, a growing emphasis on quality and patient safety may lead to a more general expansion of academicians who focus on these areas.15
Our survey and methodology have limitations. By including only promoted individuals, we did not survey hospitalists with the most difficulties in the promotions processthose who were not promoted. Thus, we are unable to directly compare successful versus unsuccessful strategies. Identifying nonpromoted academic hospitalists to understand the reasons they were not (or have not yet been) promoted could be a next step in this line of inquiry. Additionally, understanding the attitudes of promotions committees regarding hospitalists, and the clinical and quality improvement roles in which they are engaged, could enhance our current results. Finally, we surveyed a convenience sample of a limited numbers of hospitalists and institutions, and were unable to systematically account for variations in promotions criteria across institutions. However, to our knowledge, this is the most comprehensive study of promotions among academic hospitalists to date. Given the common themes that emerged in terms of activities that supported promotion, mentors, and advice, we believe that our sample was sufficient to identify important themes and advance our understanding of this nascent specialty.
In conclusion, our survey of promoted hospital medicine faculty provides valuable information for junior faculty and hospitalist leaders. Success was found through engaging in a diverse set of activities in the traditional areas of education, service, and scholarship, frequently in conjunction with developing recognition outside of their institutions. While all respondents were clinically active, none described themselves as having purely clinical roles. As academic hospitalist roles evolve, academic leaders will need to provide adequate mentorship, create time for scholarly pursuits, and promote documentation and recognition of nontraditional activities that may nonetheless be worthy of promotion.
- ,,,,,.Challenges and opportunities in academic hospital medicine: report from the academic hospital medicine summit.J Gen Intern Med.2009;24(5):636–641.
- ,,.Hospitalist educators: future of inpatient internal medicine training.Mt Sinai J Med.2008;75(5):436–451.
- ,,,.Hospitalists as emerging leaders in patient safety: lessons learned and future directions.J Patient Saf.2009;5(1):3–8.
- Quality Portfolio—Template and Instructions. Available at: http://www.sgim.org/userfiles/file/AHTF%20QP%20WEB%20TEMPLATE%20INS TRUCTIONS.pdf. Accessed on April 24,2010.
- .An innovative approach to support hospitalist physicians toward academic success.J Hosp Med.2008;3:314–318.
- ,,,.Institutional policies of U.S. medical schools regarding tenure, promotion, and benefits for part‐time faculty.Acad Med.2000;75(8):846–849.
- ,,,,,.Revising appointment, promotion, and tenure procedures to incorporate an expanded definition of scholarship: the University of Kentucky College of Medicine experience.Acad Med.2000;75(9)913–924.
- ,,,.Attitudes of clinical faculty about career progress, career success and recognition, and commitment to academic medicine. Results of a survey.Arch Intern Med.2000;160(17):2625–2629.
- ,,, et al.Promotion criteria for clinician‐educators.J Gen Intern Med.2003;18(9):711–716.
- ,,,.Documentation systems for educators seeking academic promotion in U.S. medical schools.Acad Med.2004;79(8):783–790.
- ,,,.Faculty development: academic opportunities for emergency medicine faculty on education career tracks.Acad Emerg Med.2003;10(10):1113–1117.
- ,,,.Burnout and internal medicine resident work hours restrictions.Arch Intern Med.2005;165(22):2595–2600.
- ,.Development of a Division of General Medicine in a Department of Internal Medicine.J Med Ed.1981;56:390–396.
- .The evolution of departments of medicine.N Engl J Med.1980;303(9):489–496.
- ,.Clinicians in quality improvement: a new career pathway in academic medicine.JAMA.2009;301(7):766–768.
- ,,.A time to be promoted. The prospective study of promotion in academia.J Gen Intern Med.2006;21(2):123–129.
- Academic Hospitalist Academy. Available at: http://www.sgim.org/index. cfm?pageId=815. Accessed on April 24,2010.
- .Reflections on the Academic Hospitalist Academy.SGIM Forum.2010;33(1):5.
- .The Academic Hospitalist Academy: Get anchored, equipped, and energized.SGIM Forum.2010;33(1):5–6.
- .Four formative days in the life of an academic hospitalist: the Academic Hospitalist Academy.SGIM Forum.2010;33(1):6.
Copyright © 2011 Society of Hospital Medicine
Hospitalist‐Run Observation Unit
Hospitalists play key roles in many types of clinical services, including teaching, nonteaching, consultative, and comanagement services.14 While the impact of hospitalist programs on LOS for inpatient medicine services has been studied,58 less work has focused on the impact of hospitalists in other types of service delivery, such as in short‐stay or observation units.
While many hospitals now have short‐stay units to care for observation patients, most are adjuncts of the emergency department. A Canadian hospitalist‐run short‐stay unit that targeted patients with an expected LOS of less than 3 days has been described.9 The experience of a single, chest‐painspecific service has also been reported.10
In August 2005, we introduced a hospitalist‐run observation unit, the Clinical Decision Unit (CDU), at University Hospital, the primary teaching affiliate of the University of Texas Health Science Center at San Antonio (San Antonio, TX). The rationale was that observation‐level care in a dedicated short‐stay unit would be more efficient than in an inpatient general medicine service. Through the creation of this unit, we consolidated the care of all medical observation patients, including patients previously evaluated in a cardiology‐run chest pain unit.
In this brief report, we present a description of the unit as well as a preliminary analysis of the impact of the unit on LOS for the most common CDU diagnoses.
Methods
CDU Structure
University Hospital is the Bexar County public hospital. It contains 604 acute care beds, and averages 70,000 emergency visits annually. The CDU is a geographically separate, 10‐bed unit, staffed with dedicated nurses in 8‐hour shifts and 24/7 by hospitalists in 12‐hour shifts. Four to five hospitalists rotate through the CDU monthly. About 30% of shifts are staffed through moonlighting by hospitalist faculty or fellows.
For admissions, through examining hospital LOS data, we targeted diagnoses for which patients might be expected to stay less than 24 hours. Potentially appropriate diagnoses were discussed by the group, and general admission guidelines were created based on consensus. These diagnoses included chest pain, cellulitis, pyelonephritis, syncope, asthma exacerbation, chronic obstructive pulmonary disease exacerbation, hyperglycemia, and hepatic encephalopathy. Table 1 lists these guidelines.
| Diagnosis | Guidelines |
|---|---|
| |
| Chest pain | Patients without EKG changes or positive troponins, but for whom stress test was indicated based on history or risk factors |
| Asthma | Patients with oxygen saturation >90% and demonstrating improvement in with ED nebulizer treatment |
| Syncope | Patients without known structural heart disease based on past medical history or exam findings |
| Cellulitis | Patients without suspicion for abscess or osteomyelitis |
| Pyelonephritis | Patients without change from baseline renal function; kidney transplant recipients excluded |
If a patient's stay exceeded 23 hours, the hospitalist could transfer the patient from the CDU to a general medicine team. Formal transfer guidelines were not created, but if patients were expected to be discharged within 12 hours, they generally remained in the CDU to minimize transitions. The census of the general medicine teams could also be a factor in transfer decisions: if they were at admitting capacity, the patient remained in the CDU.
Patients admitted to the general medicine units were cared for by 5 teaching teams, staffed exclusively by hospitalists.
Assessment of CDU Implementation on LOS
To examine the impact of unit implementation on LOS, we performed a retrospective, preimplementation/postimplementation comparison of the LOS of patients discharged 12 months before and after the unit opening on August 1, 2005. To ensure a comparison of similar patients, we identified the top 5 most common CDU discharge diagnoses, and identified people discharged from general medicine with the same diagnoses. Specifically, we compared the LOS of patients discharged from the general medicine units from August 1, 2004 to July 31, 2005, vs. those with the same diagnoses discharged from either the CDU or general medicine units from August 1, 2005 to July 31, 2006.
The 5 most common CDU discharge diagnoses were identified using hospital administrative discharge data. All International Statistical Classification of Diseases and Related Health Problems, 9th edition (ICD‐9) codes associated with CDU discharges were identified and listed in order of frequency. Related ICD‐9 codes were grouped. For example, angina (413.0) and chest pain (786.50, 786.59) were considered related, and were included as chest pain. These ICD‐9 codes were then used to identify patients discharged with these diagnoses in the pre‐CDU and post‐CDU periods. Patients on general medicine units were identified using admission location and admitting attending. Only patients admitted by a hospitalist to a general medicine floor were included. Patients were analyzed according to their admission location. All patients with relevant ICD‐9 codes were included in the analysis. None were excluded. For each patient identified, all data elements were present.
The acuity of patients admitted in the preimplementation and postimplementation periods was compared using the case‐mix index calculated by 3M Incorporated's All Patient RefinedDiagnosis‐Related Group methodology (3M APR‐DRG; 3M, St. Paul, MN). This adjusts administrative data for severity of illness and mortality risk based on primary diagnoses, comorbidities, age, and procedures. Patients are assigned to mortality classes with corresponding scores of 0 or higher.
Statistical Analysis
Statistical analyses were performed using STATA 8.0. LOS and acuity differences were assessed using 2‐sample t tests with equal variances.
Results
Clinical Experience with the CDU
The 5 most common CDU discharge diagnoses accounted for 724 discharges, and included chest pain, asthma, syncope, cellulitis, and pyelonephritis. The ICD‐9 codes, as well as the numbers of patients discharged from the general medicine units and CDU with each diagnosis are listed in Table 2. The average daily census in the unit was 7.2 patients with a standard deviation of 0.8. Overall, 22% of CDU admissions were changed from observation to admission status.
| Diagnosis | ICD‐9 Codes | Pre‐CDU | Post‐CDU | Post‐CDU Admitted to CDU | Post‐CDU Admitted to Ward Team |
|---|---|---|---|---|---|
| |||||
| Top 5 diagnoses | 2240 | 2148 | 724 | 1424 | |
| Cellulitis | 681.0, 682.0‐682.9 | 1002 | 819 | 48 | 771 |
| Asthma | 493.02, 493.12 | 199 | 176 | 71 | 105 |
| Chest pain | 786.50, 786.59, 413.0 | 837 | 917 | 520 | 397 |
| Pyelonephritis | 590.1, 590.8 | 143 | 163 | 61 | 102 |
| Syncope | 780.2 | 59 | 73 | 24 | 49 |
Impact of CDU Implementation on LOS
The overall LOS for patients with the 5 most common diagnoses decreased from 2.4 to 2.2 days (P = 0.05) between the 12‐month preimplementation and postimplementation periods. A significant decrease was seen for patients with cellulitis (2.4‐1.9 days; P < 0.001) and asthma (2.2‐1.2 days; P < 0.001). Differences in LOS for patients with chest pain, pyelonephritis, and syncope were not statistically significant. These results are summarized in Table 3. The acuity of patients admitted in the pre‐CDU and post‐CDU implementation, shown in Table 4, was not significantly different.
| Diagnosis | Pre‐CDU | Post‐CDU | P Value |
|---|---|---|---|
| |||
| Top 5 diagnoses | 2.4 (3.8) | 2.2 (2.8) | 0.05 |
| Cellulitis | 2.4 (3.2) | 1.9 (2.6) | <0.001 |
| Asthma | 2.2 (1.9) | 1.2 (0.7) | <0.001 |
| Chest pain | 1.5 (1.3) | 1.6 (2.4) | 0.75 |
| Pyelonephritis | 3.3 (4.9) | 2.7 (2.8) | 0.27 |
| Syncope | 2.0 (2.9) | 2.2 (2.0) | 0.68 |
| Diagnosis | All Patients2005 | All Patients2006 |
|---|---|---|
| ||
| Top 5 diagnoses | 0.6987 | 0.7240 |
| Cellulitis | 0.7393 | 0.7630 |
| Asthma | 0.4382 | 0.4622 |
| Chest pain | 0.7428 | 0.7545 |
| Pyelonephritis | 0.7205 | 0.6662 |
| Syncope | 0.6769 | 0.6619 |
Discussion and Conclusions
Implementation of a hospitalist‐run observation unit was associated with an overall decreased LOS for patients with the 5 most common CDU discharge diagnoses of chest pain, cellulitis, asthma, pyelonephritis, and syncope. The lack of statistically significantly differences in patient acuity in the preimplementation and postimplementation periods suggests this result is not due to acuity differences, but rather to unit implementation. We believe this reduction resulted from the greater efficiencies of care that occur from clustering observation patients in a geographically separate unit with dedicated nursing staff and efficient workflow. The reduction of 0.2 days over 2148 patients (total number of postimplementation discharges) led to an additional 429.6 days of capacity without adding additional beds. Thus, what might appear to be a modest LOS reduction has a larger impact when patient volume is considered.
For individual diagnoses, significant differences in LOS were seen for patients with cellulitis and asthma The lack of a difference for chest pain may be related to the fact that these patients were cared for in a chest pain unit prior to CDU creation, which likely fostered similar efficiencies. This finding may suggest that hospitalists are as efficient as cardiologists in assessing patients with chest pain. The lack of a difference in LOS for syncope may have reflected a bottleneck in obtaining echocardiogram tests. Finally, the lack of a difference for pyelonephritis may indicate that it is not a diagnosis for which observation is beneficial.
While our use of administrative data over the year‐long preimplementation and postimplementation periods allows for the inclusion of a large number of discharges, the retrospective study design limits the strength of our results. A prospective study would more definitively reduce the possibility of bias and ensure the validity of our finding of reduced LOS.
The creation of a hospitalist‐run observation unit may represent an alternative to emergency departmentrun units. It allows physicians with greater expertise in inpatient medicine to make admission and discharge decisions, allowing emergency department physicians to concentrate on the care of other patients. This can be particularly critical for high‐volume emergency departments. The CDU also offers an alternative to specialist‐run chest pain units. Because patients either stay for only the observation period or are admitted and typically moved off the unit, there is little need for provider continuity, and the discontinuous shift staffing model works well.
In addition to the geographic localization, several aspects of the CDU model may be critical to the successful implementation of similar hospitalist‐run observation units. Dedicated nursing staff with expertise in caring for high‐turnover patients with a more limited spectrum of diagnoses may be a factor. Another factor may be that the lack of less‐experienced trainees in a nonteaching service leads to more efficient care.
A potential area of further exploration includes understanding the differences between CDU patients who are discharged within 23 hours and those who are later admitted. This understanding may help us better differentiate patients appropriate for CDU admission, allowing the creation of more formal admission criteria.
Acknowledgements
The views expressed in this article are those of the authors and do not necessarily reflect the position or policy of the Department of Veterans Affairs.
- ,.The role of hospitalists in medical education.Am J Med.1999;107(4):305–309.
- ,,,,.Reorganizing an academic medical service: impact on cost, quality, patient satisfaction, and education.JAMA.1998;279:1560–1565.
- ,,, et al.,Hospitalist‐Orthopedic Team Trial Investigators. Medical and surgical comanagement after elective hip and knee arthroplasty: a randomized, controlled trial.Ann Intern Med.2004;141(1):28–38.
- ,,,,,.Implementation of a voluntary hospitalist service at a community teaching hospital: improved efficiency and patient outcomes.Ann Intern Med.2002;137:859–865.
- ,,,,,.Outcomes of care by hospitalists, general internists, and family physicians.N Engl J Med.2007;357(25):2589–2600.
- ,,,,.Hospitalist care and length of stay in patients requiring complex discharge planning and close clinical monitoring.Arch Intern Med.2007;167(17):1869–1874.
- ,,.Comparison of hospital costs and length of stay for community internists, hospitalists, and academicians.J Gen Int Med.2007;22(5):662–667.
- ,,, et al.Effects of physician experience on cost and outcomes on an academic general medicine service: results of a trial of hospitalists.Ann Intern Med.2002;37:866–875.
- ,,,.Program description: a hospitalist‐run, medical short‐stay unit in a teaching hospital.CMAJ.2000;163(11):1477–1480.
- ,,,,.Improving resource utilization in a teaching hospital: development of a nonteaching service for chest pain admissions.Acad Med.2006;81(5):432–435.
Hospitalists play key roles in many types of clinical services, including teaching, nonteaching, consultative, and comanagement services.14 While the impact of hospitalist programs on LOS for inpatient medicine services has been studied,58 less work has focused on the impact of hospitalists in other types of service delivery, such as in short‐stay or observation units.
While many hospitals now have short‐stay units to care for observation patients, most are adjuncts of the emergency department. A Canadian hospitalist‐run short‐stay unit that targeted patients with an expected LOS of less than 3 days has been described.9 The experience of a single, chest‐painspecific service has also been reported.10
In August 2005, we introduced a hospitalist‐run observation unit, the Clinical Decision Unit (CDU), at University Hospital, the primary teaching affiliate of the University of Texas Health Science Center at San Antonio (San Antonio, TX). The rationale was that observation‐level care in a dedicated short‐stay unit would be more efficient than in an inpatient general medicine service. Through the creation of this unit, we consolidated the care of all medical observation patients, including patients previously evaluated in a cardiology‐run chest pain unit.
In this brief report, we present a description of the unit as well as a preliminary analysis of the impact of the unit on LOS for the most common CDU diagnoses.
Methods
CDU Structure
University Hospital is the Bexar County public hospital. It contains 604 acute care beds, and averages 70,000 emergency visits annually. The CDU is a geographically separate, 10‐bed unit, staffed with dedicated nurses in 8‐hour shifts and 24/7 by hospitalists in 12‐hour shifts. Four to five hospitalists rotate through the CDU monthly. About 30% of shifts are staffed through moonlighting by hospitalist faculty or fellows.
For admissions, through examining hospital LOS data, we targeted diagnoses for which patients might be expected to stay less than 24 hours. Potentially appropriate diagnoses were discussed by the group, and general admission guidelines were created based on consensus. These diagnoses included chest pain, cellulitis, pyelonephritis, syncope, asthma exacerbation, chronic obstructive pulmonary disease exacerbation, hyperglycemia, and hepatic encephalopathy. Table 1 lists these guidelines.
| Diagnosis | Guidelines |
|---|---|
| |
| Chest pain | Patients without EKG changes or positive troponins, but for whom stress test was indicated based on history or risk factors |
| Asthma | Patients with oxygen saturation >90% and demonstrating improvement in with ED nebulizer treatment |
| Syncope | Patients without known structural heart disease based on past medical history or exam findings |
| Cellulitis | Patients without suspicion for abscess or osteomyelitis |
| Pyelonephritis | Patients without change from baseline renal function; kidney transplant recipients excluded |
If a patient's stay exceeded 23 hours, the hospitalist could transfer the patient from the CDU to a general medicine team. Formal transfer guidelines were not created, but if patients were expected to be discharged within 12 hours, they generally remained in the CDU to minimize transitions. The census of the general medicine teams could also be a factor in transfer decisions: if they were at admitting capacity, the patient remained in the CDU.
Patients admitted to the general medicine units were cared for by 5 teaching teams, staffed exclusively by hospitalists.
Assessment of CDU Implementation on LOS
To examine the impact of unit implementation on LOS, we performed a retrospective, preimplementation/postimplementation comparison of the LOS of patients discharged 12 months before and after the unit opening on August 1, 2005. To ensure a comparison of similar patients, we identified the top 5 most common CDU discharge diagnoses, and identified people discharged from general medicine with the same diagnoses. Specifically, we compared the LOS of patients discharged from the general medicine units from August 1, 2004 to July 31, 2005, vs. those with the same diagnoses discharged from either the CDU or general medicine units from August 1, 2005 to July 31, 2006.
The 5 most common CDU discharge diagnoses were identified using hospital administrative discharge data. All International Statistical Classification of Diseases and Related Health Problems, 9th edition (ICD‐9) codes associated with CDU discharges were identified and listed in order of frequency. Related ICD‐9 codes were grouped. For example, angina (413.0) and chest pain (786.50, 786.59) were considered related, and were included as chest pain. These ICD‐9 codes were then used to identify patients discharged with these diagnoses in the pre‐CDU and post‐CDU periods. Patients on general medicine units were identified using admission location and admitting attending. Only patients admitted by a hospitalist to a general medicine floor were included. Patients were analyzed according to their admission location. All patients with relevant ICD‐9 codes were included in the analysis. None were excluded. For each patient identified, all data elements were present.
The acuity of patients admitted in the preimplementation and postimplementation periods was compared using the case‐mix index calculated by 3M Incorporated's All Patient RefinedDiagnosis‐Related Group methodology (3M APR‐DRG; 3M, St. Paul, MN). This adjusts administrative data for severity of illness and mortality risk based on primary diagnoses, comorbidities, age, and procedures. Patients are assigned to mortality classes with corresponding scores of 0 or higher.
Statistical Analysis
Statistical analyses were performed using STATA 8.0. LOS and acuity differences were assessed using 2‐sample t tests with equal variances.
Results
Clinical Experience with the CDU
The 5 most common CDU discharge diagnoses accounted for 724 discharges, and included chest pain, asthma, syncope, cellulitis, and pyelonephritis. The ICD‐9 codes, as well as the numbers of patients discharged from the general medicine units and CDU with each diagnosis are listed in Table 2. The average daily census in the unit was 7.2 patients with a standard deviation of 0.8. Overall, 22% of CDU admissions were changed from observation to admission status.
| Diagnosis | ICD‐9 Codes | Pre‐CDU | Post‐CDU | Post‐CDU Admitted to CDU | Post‐CDU Admitted to Ward Team |
|---|---|---|---|---|---|
| |||||
| Top 5 diagnoses | 2240 | 2148 | 724 | 1424 | |
| Cellulitis | 681.0, 682.0‐682.9 | 1002 | 819 | 48 | 771 |
| Asthma | 493.02, 493.12 | 199 | 176 | 71 | 105 |
| Chest pain | 786.50, 786.59, 413.0 | 837 | 917 | 520 | 397 |
| Pyelonephritis | 590.1, 590.8 | 143 | 163 | 61 | 102 |
| Syncope | 780.2 | 59 | 73 | 24 | 49 |
Impact of CDU Implementation on LOS
The overall LOS for patients with the 5 most common diagnoses decreased from 2.4 to 2.2 days (P = 0.05) between the 12‐month preimplementation and postimplementation periods. A significant decrease was seen for patients with cellulitis (2.4‐1.9 days; P < 0.001) and asthma (2.2‐1.2 days; P < 0.001). Differences in LOS for patients with chest pain, pyelonephritis, and syncope were not statistically significant. These results are summarized in Table 3. The acuity of patients admitted in the pre‐CDU and post‐CDU implementation, shown in Table 4, was not significantly different.
| Diagnosis | Pre‐CDU | Post‐CDU | P Value |
|---|---|---|---|
| |||
| Top 5 diagnoses | 2.4 (3.8) | 2.2 (2.8) | 0.05 |
| Cellulitis | 2.4 (3.2) | 1.9 (2.6) | <0.001 |
| Asthma | 2.2 (1.9) | 1.2 (0.7) | <0.001 |
| Chest pain | 1.5 (1.3) | 1.6 (2.4) | 0.75 |
| Pyelonephritis | 3.3 (4.9) | 2.7 (2.8) | 0.27 |
| Syncope | 2.0 (2.9) | 2.2 (2.0) | 0.68 |
| Diagnosis | All Patients2005 | All Patients2006 |
|---|---|---|
| ||
| Top 5 diagnoses | 0.6987 | 0.7240 |
| Cellulitis | 0.7393 | 0.7630 |
| Asthma | 0.4382 | 0.4622 |
| Chest pain | 0.7428 | 0.7545 |
| Pyelonephritis | 0.7205 | 0.6662 |
| Syncope | 0.6769 | 0.6619 |
Discussion and Conclusions
Implementation of a hospitalist‐run observation unit was associated with an overall decreased LOS for patients with the 5 most common CDU discharge diagnoses of chest pain, cellulitis, asthma, pyelonephritis, and syncope. The lack of statistically significantly differences in patient acuity in the preimplementation and postimplementation periods suggests this result is not due to acuity differences, but rather to unit implementation. We believe this reduction resulted from the greater efficiencies of care that occur from clustering observation patients in a geographically separate unit with dedicated nursing staff and efficient workflow. The reduction of 0.2 days over 2148 patients (total number of postimplementation discharges) led to an additional 429.6 days of capacity without adding additional beds. Thus, what might appear to be a modest LOS reduction has a larger impact when patient volume is considered.
For individual diagnoses, significant differences in LOS were seen for patients with cellulitis and asthma The lack of a difference for chest pain may be related to the fact that these patients were cared for in a chest pain unit prior to CDU creation, which likely fostered similar efficiencies. This finding may suggest that hospitalists are as efficient as cardiologists in assessing patients with chest pain. The lack of a difference in LOS for syncope may have reflected a bottleneck in obtaining echocardiogram tests. Finally, the lack of a difference for pyelonephritis may indicate that it is not a diagnosis for which observation is beneficial.
While our use of administrative data over the year‐long preimplementation and postimplementation periods allows for the inclusion of a large number of discharges, the retrospective study design limits the strength of our results. A prospective study would more definitively reduce the possibility of bias and ensure the validity of our finding of reduced LOS.
The creation of a hospitalist‐run observation unit may represent an alternative to emergency departmentrun units. It allows physicians with greater expertise in inpatient medicine to make admission and discharge decisions, allowing emergency department physicians to concentrate on the care of other patients. This can be particularly critical for high‐volume emergency departments. The CDU also offers an alternative to specialist‐run chest pain units. Because patients either stay for only the observation period or are admitted and typically moved off the unit, there is little need for provider continuity, and the discontinuous shift staffing model works well.
In addition to the geographic localization, several aspects of the CDU model may be critical to the successful implementation of similar hospitalist‐run observation units. Dedicated nursing staff with expertise in caring for high‐turnover patients with a more limited spectrum of diagnoses may be a factor. Another factor may be that the lack of less‐experienced trainees in a nonteaching service leads to more efficient care.
A potential area of further exploration includes understanding the differences between CDU patients who are discharged within 23 hours and those who are later admitted. This understanding may help us better differentiate patients appropriate for CDU admission, allowing the creation of more formal admission criteria.
Acknowledgements
The views expressed in this article are those of the authors and do not necessarily reflect the position or policy of the Department of Veterans Affairs.
- ,.The role of hospitalists in medical education.Am J Med.1999;107(4):305–309.
- ,,,,.Reorganizing an academic medical service: impact on cost, quality, patient satisfaction, and education.JAMA.1998;279:1560–1565.
- ,,, et al.,Hospitalist‐Orthopedic Team Trial Investigators. Medical and surgical comanagement after elective hip and knee arthroplasty: a randomized, controlled trial.Ann Intern Med.2004;141(1):28–38.
- ,,,,,.Implementation of a voluntary hospitalist service at a community teaching hospital: improved efficiency and patient outcomes.Ann Intern Med.2002;137:859–865.
- ,,,,,.Outcomes of care by hospitalists, general internists, and family physicians.N Engl J Med.2007;357(25):2589–2600.
- ,,,,.Hospitalist care and length of stay in patients requiring complex discharge planning and close clinical monitoring.Arch Intern Med.2007;167(17):1869–1874.
- ,,.Comparison of hospital costs and length of stay for community internists, hospitalists, and academicians.J Gen Int Med.2007;22(5):662–667.
- ,,, et al.Effects of physician experience on cost and outcomes on an academic general medicine service: results of a trial of hospitalists.Ann Intern Med.2002;37:866–875.
- ,,,.Program description: a hospitalist‐run, medical short‐stay unit in a teaching hospital.CMAJ.2000;163(11):1477–1480.
- ,,,,.Improving resource utilization in a teaching hospital: development of a nonteaching service for chest pain admissions.Acad Med.2006;81(5):432–435.