User login
Early and Significant Reduction in C-Reactive Protein Levels After Corticosteroid Therapy Is Associated With Reduced Mortality in Patients With COVID-19
Confirmed cases of coronavirus disease 2019 (COVID-19) exceed 111 million, and the disease is responsible for approximately 2.4 million deaths worldwide.1 In the United States, 28 million cases of COVID-19 have been reported, and the disease has caused more than 497,000 deaths.2 The clinical presentation of COVID-19 varies widely, with the most severe presentation characterized by acute respiratory distress syndrome and a marked systemic inflammatory response. Corticosteroids have emerged as a potential therapeutic option in a subset of patients. Results from the recently published RECOVERY trial suggest a substantial mortality benefit of dexamethasone in patients who require mechanical ventilation, with a risk reduction of approximately 33%.3 In addition, a recent large retrospective study demonstrated a reduction in the risk of mechanical ventilation or mortality with corticosteroids in a prespecified subset of patients with C-reactive protein (CRP) ≥20 mg/dL, which indicates a high burden of inflammation.4
Some patients with severe COVID-19 experience a positive feedback cascade of proinflammatory cytokines, called the cytokine storm, which can worsen lung injury and, in some cases, progress to vasodilatory shock and multiorgan failure.5 This complication’s cytokine cascade includes interleukin (IL) 6, IL-1β, and CC chemokine ligand 3 (CCL3), which are released by airway macrophages and all of which are heavily implicated in the maladaptive forms of immune response to COVID-19.6,7 The cytokine IL-6 is the primary signal for the production of CRP, and corticosteroids have been shown, both in vitro and in vivo, to reduce the production of IL-6 and other cytokines by airway macrophages.6 Levels of CRP have been shown to correlate with outcomes in COVID-19 and bacterial pneumonias.7,8 Reduction in CRP levels following the institution of therapy, known as CRP response, has been shown to predict outcomes in other inflammatory conditions, such as osteomyelitis, hidradenitis suppurativa, and some cases of bacterial pneumonia.8-10 Similar CRP response in hemophagocytic lymphohistiocytosis, an entity which closely resembles cytokine storm syndrome, has been shown to correlate with disease activity in patients following treatment with an IL-1 antagonist.11 Whether the CRP response as a response to therapeutics in COVID-19 is associated with improved outcomes remains unknown.
Laboratory measurement of CRP levels offers several advantages over the measurement of interleukins. Notably, the half-life of CRP is approximately 19 hours, which is comparable across different age groups and inflammatory conditions because its concentration depends primarily on synthesis in the liver, and a decreased level suggests decreased stimulus for synthesis.8 This makes CRP a useful biomarker to assess response to therapy, in contrast to interleukins, which have short half-lives, are variable in heterogeneous populations, and can be difficult to measure. In addition, CRP measurement is rapid and relatively inexpensive.
We hypothesized that reduction in CRP levels by 50% or more within 72 hours after the initiation of corticosteroids in patients with COVID-19 is associated with reduced inpatient mortality and may be an early indicator of therapeutic response.
METHODS
Study Participants
In this retrospective cohort study, we reviewed all adult patients admitted to Montefiore Medical Center (Bronx, New York) for COVID-19 between March 10, 2020, and May 2, 2020. Patients must have been discharged (alive or deceased) by the administrative censor date (May 2, 2020) to be included. Patients who died within the first 48 hours of admission were excluded to allow sufficient time for corticosteroid treatment to take effect. For inclusion in the corticosteroid group, patients needed to have received at least 2 consecutive days of corticosteroid treatment beginning within the first 48 hours of admission with a total daily dose of 0.5 mg/kg prednisone equivalent or greater. Patients who received treatment-dose corticosteroids later in the hospital course were excluded (Appendix Figure).
Comparison Group and Outcome
We examined trends in CRP levels for patients who received corticosteroids vs trends among patients who did not receive corticosteroids. In addition, among patients who were treated with corticosteroids, we compared the inpatient mortality of those who did have a reduction in CRP level after treatment with inpatient mortality of those who did not have a reduction in CRP level after treatment. First, CRP level trends over time were examined in all patients, and compared between those who received corticosteroid treatment and those who did not. Then, patients who received corticosteroids were categorized based on changes in CRP levels after beginning corticosteroids. The first CRP level obtained during the first 48 hours of admission was used as the initial CRP level. For each patient, the last CRP level within the 72 hours after initiation of treatment was used to calculate the change in CRP level from admission. A patient was considered to be a “CRP responder” if their CRP level decreased by 50% or more within 72 hours after treatment and a “CRP nonresponder” if their CRP level did not drop by at least 50% within 72 hours of treatment. Patients who did not have a CRP level within the initial 48 hours of admission or a subsequent CRP measured in the 72 hours after treatment were considered to have an “undetermined CRP response” and excluded from the mortality analysis.
We observed a rise in CRP starting around day 6 among patients treated with corticosteroids and performed a post hoc analysis to determine if this was due to a selection effect whereby patients staying in the hospital longer had higher CRP levels or represented actual rise. In order to address this, we performed a stratified analysis comparing the trends in CRP levels among patients with a length of stay (LOS) of 7 or more days with trends among those with an LOS less than 7 days.
Statistical Analysis
To characterize differences in patients who received corticosteroids and those who did not, we examined their demographic, clinical characteristics, and admission laboratory values, using chi-square test for categorical variables and Kruskal-Wallis test for continuous variables (Table 1). The change in CRP levels from day 0 (presentation to the hospital) in both groups was plotted in a time-series analysis. For each day in the time series, the 95% CIs for the changes in CRP were computed using the t statistic for the corresponding distribution. The Kruskal-Wallis test was used to assess the significance of differences between groups at 72 hours after initiation of treatment.

After categorizing patients by CRP response, we compared demographic, clinical, and laboratory characteristics of patients who were CRP responsive with those of patients who were not, using the same tests of statistical inference mentioned above. To compare time to inpatient mortality differences between CRP response groups, Kaplan-Meier survival curves were generated and statistical significance determined via log-rank test. Univariable logistic regression was used to estimate the odds ratio of inpatient mortality between comparison groups in an unadjusted analysis. Last, to examine the independent association between CRP response and mortality, we constructed a multivariate model that included variables that were significantly associated with mortality in univariable analysis and considered to be important potential confounders by the authors. Details on variable selection for the model are listed in Appendix Table 1.
Data Collection
Data were directly extracted from our center’s electronic health record system. Data processing and recoding was performed using the Python programming language (version 2.7.17) and data analysis was done using Stata 12 (StataCorp LLC; 2011). This study was approved by the institutional review board of the Albert Einstein College of Medicine.
RESULTS
Corticosteroids vs No Corticosteroids
Between March 10, 2020, and May 2, 2020, a total of 3,382 adult patients were admitted for COVID-19 at Montefiore Medical Center. Of these, 2,707 patients met the study inclusion criteria, and 324 of those received corticosteroid treatment. Their demographic characteristics, comorbidities, and admission lab values are shown in Table 1. Patients who received corticosteroids were older, had higher comorbidity scores, were more likely to have asthma or chronic obstructive pulmonary disease, and were less likely to be full code status, compared with patients who did not receive corticosteroids. Patients who received corticosteroids also had higher initial white blood cell (WBC) and neutrophil counts but lower lymphocyte count. The two groups were comparable in initial creatinine level. Additional patient characteristics and addmission lab values are shown in Appendix Table 2.
Average change in CRP levels by hospital day for those who received corticosteroids and those who did not are shown in Figure 1A. Among patients who received corticosteroid treatment, there was a significant decrease in CRP level at 72 hours of treatment (P < .001). In the post hoc analysis of trends in CRP levels, we found that CRP levels among those treated with corticosteroids started to rise around day 6 after the initial drop. This trend was observed even after removing patients with shorter LOS (<7 days) (Figure 1B). The median durations of corticosteroid therapy were 3 days among patients whose LOS was less than 7 days and 6 days among those whose LOS was 7 days or greater. The rise in CRP level was seen at day 5 and day 7 within each group, respectively. Crude death rate was 41.7% among patients with LOS of less than 7 days and 40.6% in those with LOS of 7 days or greater.

CRP Responders vs Nonresponders
Among the 324 patients who received corticosteroids, 131 (40.4%) were classified as responders, 92 (28.4%) were classified as nonresponders, and 101 (31.2%) were undetermined. Characteristics of CRP responders and CRP nonresponders are shown in Table 2 and Appendix Table 3. CRP responders were more likely to have dementia, higher median admission platelet count, and fibrinogen level compared with CRP nonresponders. Patients whose CRP response was undetermined were excluded from the analysis. Their characteristics are shown in Appendix Table 4.

The observed inpatient mortality rate was 25.2% among CRP responders and 47.8% among CRP nonresponders. This was also demonstrated in the Kaplan-Meier survival curve (Figure 2). The odds of inpatient mortality among CRP responders was strongly and significantly reduced compared with those among nonresponders in an unadjusted analysis (odds ratio [OR], 0.37; 95% CI, 0.21-0.65; P = .001) and after adjustment for demographic and clinical characteristics including age, Charlson Comorbidity Index, initial WBC count, initial CRP level, and initial fibrinogen level (OR, 0.27; 95% CI, 0.14-0.54; P < .001). Details on how variables were operationalized and information on missing data are included in Appendix Table 1.
 responders and nonresponders")
To explore whether this observed effect differed depending on severity of the respiratory illness, we examined the association between CRP response and mortality in subgroups stratified by intubation status. Within our cohort of 223 patients (92 CRP responders and 131 CRP nonresponders), 166 patients were never intubated, 50 patients were intubated in the first 48 hours, and 7 patients were intubated later on during the admission. The odds ratios for death among CRP responders vs nonresponders were 0.50 (P = .07) among patients never intubated and 0.46 (P = .2) among patients intubated within the initial 48 hours of admission.
")
DISCUSSION
In this retrospective study, we found that, on average, patients treated with corticosteroids had a swift and marked reduction in serum CRP. In addition, among patients treated with corticosteroids, those whose CRP was reduced by 50% or more within 72 hours after treatment had a dramatically reduced risk of inpatient mortality compared with the risk among nonresponders. This study contributes to a growing body of evidence that suggests that corticosteroids may be an efficacious treatment to reduce adverse events in patients with COVID-19 who have evidence of high levels of inflammation as measured by CRP level.3,4,12,13
It remains unclear whether CRP is simply a biomarker of disease activity or if it plays a role in mediating inflammation. While CRP is commonly understood to be an acute phase reactant, it has been suggested that, after undergoing proteolysis, it functions as a chemoattractant for monocytes.14 In addition, it is now known that the inflammatory CD14+/CD16+ monocytes that express high levels of IL-6 are key drivers of the cytokine storm in COVID-19.15 Therefore, it may be possible that the high levels of circulating CRP in patients with cytokine storm recruits monocytes to the lungs, which leads to further lung injury.
Other mechanisms of immune dysregulation that may contribute to lung injury and respiratory failure in COVID-19, such as cytokine-induced T-cell suppression, have been proposed.7,16 The related markers, such as levels of T-cells or specific cytokines, may therefore represent different but related underlying immune mechanisms affecting the clinical course of COVID-19 that may respond to different therapeutic modalities such as direct IL-6 blockade or chemokine receptor blockade, among others that are currently under investigation.17,18
Regardless of the underlying mechanism of immune regulation, our study shows that serial measurement of CRP may serve as an early indicator of response to corticosteroids that correlates with decreased mortality. The association between CRP response and reduced risk of mortality was present in both subgroups, those requiring mechanical ventilation and those who did not. The risk reduction was similar in magnitude to the overall effect but was not statistically significant in either group. Interestingly, our time series analysis demonstrated a rise in CRP around day 6 among patients treated with corticosteroids (notably, most patients were treated for 5 to 7 days). Our post hoc analysis suggests that this may represent a “rebound” in inflammation after discontinuation of corticosteroids. However, the clinical significance of this rebound and whether a longer course of steroids would improve outcomes is not known. Because corticosteroid therapy may be associated with adverse effects in some patients,4 it is possible that CRP nonresponders represent a subset of patients in whom corticosteroids are not effective and for whom alternative therapies should be considered. In one study looking at the usefulness of IL-1 inhibition for severe COVID-19 infection, patients who received IL-1 inhibitor therapy had improved mortality and a significant decrease in CRP concentration as compared with the historical group.19 Finally, it is worth noting that, in one large retrospective study, there was harm associated with corticosteroid therapy in patients with low levels of CRP, and in the RECOVERY trial there was a trend toward harm for patients with no oxygen requirement.3,4 Serial measurement of CRP may further identify the subset of patients in whom corticosteroid therapy might be harmful.
This study has several limitations. First, the retrospective nature of this study is inherently prone to selection bias, and despite the large number of clinical variables accounted for, unmeasured confounders may still exist. This study was also conducted at a single clinical center operating under emergency circumstances at a time during which healthcare resources were limited. Overall in-hospital mortality was high but similar to mortality rates reported at other hospitals in the New York City area during the same months.20 The strengths of this study include a large cohort of COVID-19 patients from New York City, an epicenter of COVID-19, who received corticosteroids.
CONCLUSION
We found that therapy with corticosteroids in patients with COVID-19 is associated with a substantial reduction in CRP levels within 72 hours of therapy, and for those patients in whom CRP levels decrease by 50% or more, there is a significantly lower risk of inpatient mortality. Future studies are needed to validate these findings in other cohorts and to determine if markers other than CRP levels may be predictors of a therapeutic response or if CRP nonresponders would benefit from other targeted therapies.
1. WHO coronavirus disease (COVID-19) dashboard. World Health Organization. Updated February 22, 2021. Accessed February 22, 2021. https://covid19.who.int/
2. COVID Data Tracker: United States COVID-19 Cases and Deaths by State. Centers for Disease Control and Prevention. Updated February 22, 2021. Accessed February 22, 2021. https://covid.cdc.gov/covid-data-tracker/#cases_casesper100klast7days
3. Horby P, Lim WS, Emberson JR, et al; RECOVERY Collaborative Group. Dexamethasone in hospitalized patients with Covid-19 - preliminary report. N Engl J Med. Published online July 17, 2020. https://doi.org/10.1056/NEJMoa2021436
4. Keller MJ, Kitsis EA, Arora S, et al. Effect of systemic glucocorticoids on mortality or mechanical ventilation in patients with COVID-19. J Hosp Med. 2020;15(8);489-493. https://doi.org/10.12788/jhm.3497
5. Tay MZ, Poh CM, Rénia L, MacAry PA, Ng LFP. The trinity of COVID-19: immunity, inflammation and intervention. Nat Rev Immunol. 2020;20(6):363-374. https://doi.org/10.1038/s41577-020-0311-8
6. Goleva E, Hauk PJ, Hall CF, et al. Corticosteroid-resistant asthma is associated with classical antimicrobial activation of airway macrophages. J Allergy Clin Immunol. 2008;122(3):550-559.e3. https://doi.org/10.1016/j.jaci.2008.07.007
7. Giamarellos-Bourboulis EJ, Netea MG, Rovina N. Complex immune dysregulation in COVID-19 patients with severe respiratory failure. Cell Host Microbe. 2020;27(6):992-1000.e3. https://doi.org/10.1016/j.chom.2020.04.009
8. Luna CM. C-reactive protein in pneumonia: let me try again. Chest. 2004;125(4):1192-1195. https://doi.org/10.1378/chest.125.4.1192
9. Montaudié H, Seitz-Polski B, Cornille A, Benzaken S, Lacour JP, Passeron T. Interleukin 6 and high-sensitivity C-reactive protein are potential predictive markers of response to infliximab in hidradenitis suppurativa. J Am Acad Dermatol. 2017;76(1):156-158. https://doi.org/10.1016/j.jaad.2016.08.036
10. Menéndez R, Martínez R, Reyes S, et al. Biomarkers improve mortality prediction by prognostic scales in community-acquired pneumonia. Thorax. 2009;64(7):587-591. https://doi.org/10.1136/thx.2008.105312
11. Rajasekaran S, Kruse K, Kovey K, et al. Therapeutic role of anakinra, an interleukin-1 receptor antagonist, in the management of secondary hemophagocytic lymphohistiocytosis/sepsis/multiple organ dysfunction/macrophage activating syndrome in critically ill children. Pediatr Crit Care Med. 2014;15(5):401-408. https://doi.org/10.1097/pcc.0000000000000078
12. Wang Y, Jiang W, He Q, et al. A retrospective cohort study of methylprednisolone therapy in severe patients with COVID-19 pneumonia. Signal Transduct Target Ther. 2020;5(1):57. https://doi.org/10.1038/s41392-020-0158-2
13. Fadel R, Morrison AR, Vahia A, et al. Early short course corticosteroids in hospitalized patients with COVID-19. Clin Infect Dis. Published online May 19, 2020. https://doi.org/10.1093/cid/ciaa601
14. Robey FA, Ohura K, Futaki S, et al. Proteolysis of human c-reactive protein produces peptides with potent immunomodulating activity. J Biol Chem. 1987;262(15):7053-7057.
15. Zhou Y, Fu B, Zheng X, et al. Pathogenic T cells and inflammatory monocytes incite inflammatory storm in severe COVID-19 patients. Natl Sci Rev. Published online March 13, 2020. https://doi.org/10.1093/nsr/nwaa041
16. Zhang X, Tan Y, Ling Y, et al. Viral and host factors related to the clinical outcome of COVID-19. Nature. 2020;583(7816):437-440. https://doi/10.1038/s41586-020-2355-0(2020).
17. Tocilizumab in COVID-19 Pneumonia (TOCIVID-19). ClinicalTrials.gov identifier: NCT04317092. Updated October 22, 2020. Accessed October 22, 2020. https://www.clinicaltrials.gov/ct2/show/NCT04317092
18. Study to Evaluate the Efficacy and Safety of Leronlimab for Patients With Severe or Critical Coronavirus Disease 2019 (COVID-19). ClinicalTrials.gov identifier: NCT04347239. Updated October 19, 2020. Accessed November 16, 2020.https://www.clinicaltrials.gov/ct2/show/NCT04347239
19. Huet T, Beaussier H, Voisin O, et al. Anakinra for severe forms of COVID-19: a cohort study. Lancet Rheumatol. 2020;2(7):e393-e400. https://doi.org/10.1016/s2665-9913(20)30164-8
20. Richardson S, Hirsch JS, Narasimhan M, et al. Presenting characteristics, comorbidities and outcomes among 5700 patients hospitalized with COVID-19 in the New York City area. JAMA. 2020;323(20):2052-2059. https://doi.org/10.1001/jama.2020.6775
Confirmed cases of coronavirus disease 2019 (COVID-19) exceed 111 million, and the disease is responsible for approximately 2.4 million deaths worldwide.1 In the United States, 28 million cases of COVID-19 have been reported, and the disease has caused more than 497,000 deaths.2 The clinical presentation of COVID-19 varies widely, with the most severe presentation characterized by acute respiratory distress syndrome and a marked systemic inflammatory response. Corticosteroids have emerged as a potential therapeutic option in a subset of patients. Results from the recently published RECOVERY trial suggest a substantial mortality benefit of dexamethasone in patients who require mechanical ventilation, with a risk reduction of approximately 33%.3 In addition, a recent large retrospective study demonstrated a reduction in the risk of mechanical ventilation or mortality with corticosteroids in a prespecified subset of patients with C-reactive protein (CRP) ≥20 mg/dL, which indicates a high burden of inflammation.4
Some patients with severe COVID-19 experience a positive feedback cascade of proinflammatory cytokines, called the cytokine storm, which can worsen lung injury and, in some cases, progress to vasodilatory shock and multiorgan failure.5 This complication’s cytokine cascade includes interleukin (IL) 6, IL-1β, and CC chemokine ligand 3 (CCL3), which are released by airway macrophages and all of which are heavily implicated in the maladaptive forms of immune response to COVID-19.6,7 The cytokine IL-6 is the primary signal for the production of CRP, and corticosteroids have been shown, both in vitro and in vivo, to reduce the production of IL-6 and other cytokines by airway macrophages.6 Levels of CRP have been shown to correlate with outcomes in COVID-19 and bacterial pneumonias.7,8 Reduction in CRP levels following the institution of therapy, known as CRP response, has been shown to predict outcomes in other inflammatory conditions, such as osteomyelitis, hidradenitis suppurativa, and some cases of bacterial pneumonia.8-10 Similar CRP response in hemophagocytic lymphohistiocytosis, an entity which closely resembles cytokine storm syndrome, has been shown to correlate with disease activity in patients following treatment with an IL-1 antagonist.11 Whether the CRP response as a response to therapeutics in COVID-19 is associated with improved outcomes remains unknown.
Laboratory measurement of CRP levels offers several advantages over the measurement of interleukins. Notably, the half-life of CRP is approximately 19 hours, which is comparable across different age groups and inflammatory conditions because its concentration depends primarily on synthesis in the liver, and a decreased level suggests decreased stimulus for synthesis.8 This makes CRP a useful biomarker to assess response to therapy, in contrast to interleukins, which have short half-lives, are variable in heterogeneous populations, and can be difficult to measure. In addition, CRP measurement is rapid and relatively inexpensive.
We hypothesized that reduction in CRP levels by 50% or more within 72 hours after the initiation of corticosteroids in patients with COVID-19 is associated with reduced inpatient mortality and may be an early indicator of therapeutic response.
METHODS
Study Participants
In this retrospective cohort study, we reviewed all adult patients admitted to Montefiore Medical Center (Bronx, New York) for COVID-19 between March 10, 2020, and May 2, 2020. Patients must have been discharged (alive or deceased) by the administrative censor date (May 2, 2020) to be included. Patients who died within the first 48 hours of admission were excluded to allow sufficient time for corticosteroid treatment to take effect. For inclusion in the corticosteroid group, patients needed to have received at least 2 consecutive days of corticosteroid treatment beginning within the first 48 hours of admission with a total daily dose of 0.5 mg/kg prednisone equivalent or greater. Patients who received treatment-dose corticosteroids later in the hospital course were excluded (Appendix Figure).
Comparison Group and Outcome
We examined trends in CRP levels for patients who received corticosteroids vs trends among patients who did not receive corticosteroids. In addition, among patients who were treated with corticosteroids, we compared the inpatient mortality of those who did have a reduction in CRP level after treatment with inpatient mortality of those who did not have a reduction in CRP level after treatment. First, CRP level trends over time were examined in all patients, and compared between those who received corticosteroid treatment and those who did not. Then, patients who received corticosteroids were categorized based on changes in CRP levels after beginning corticosteroids. The first CRP level obtained during the first 48 hours of admission was used as the initial CRP level. For each patient, the last CRP level within the 72 hours after initiation of treatment was used to calculate the change in CRP level from admission. A patient was considered to be a “CRP responder” if their CRP level decreased by 50% or more within 72 hours after treatment and a “CRP nonresponder” if their CRP level did not drop by at least 50% within 72 hours of treatment. Patients who did not have a CRP level within the initial 48 hours of admission or a subsequent CRP measured in the 72 hours after treatment were considered to have an “undetermined CRP response” and excluded from the mortality analysis.
We observed a rise in CRP starting around day 6 among patients treated with corticosteroids and performed a post hoc analysis to determine if this was due to a selection effect whereby patients staying in the hospital longer had higher CRP levels or represented actual rise. In order to address this, we performed a stratified analysis comparing the trends in CRP levels among patients with a length of stay (LOS) of 7 or more days with trends among those with an LOS less than 7 days.
Statistical Analysis
To characterize differences in patients who received corticosteroids and those who did not, we examined their demographic, clinical characteristics, and admission laboratory values, using chi-square test for categorical variables and Kruskal-Wallis test for continuous variables (Table 1). The change in CRP levels from day 0 (presentation to the hospital) in both groups was plotted in a time-series analysis. For each day in the time series, the 95% CIs for the changes in CRP were computed using the t statistic for the corresponding distribution. The Kruskal-Wallis test was used to assess the significance of differences between groups at 72 hours after initiation of treatment.
After categorizing patients by CRP response, we compared demographic, clinical, and laboratory characteristics of patients who were CRP responsive with those of patients who were not, using the same tests of statistical inference mentioned above. To compare time to inpatient mortality differences between CRP response groups, Kaplan-Meier survival curves were generated and statistical significance determined via log-rank test. Univariable logistic regression was used to estimate the odds ratio of inpatient mortality between comparison groups in an unadjusted analysis. Last, to examine the independent association between CRP response and mortality, we constructed a multivariate model that included variables that were significantly associated with mortality in univariable analysis and considered to be important potential confounders by the authors. Details on variable selection for the model are listed in Appendix Table 1.
Data Collection
Data were directly extracted from our center’s electronic health record system. Data processing and recoding was performed using the Python programming language (version 2.7.17) and data analysis was done using Stata 12 (StataCorp LLC; 2011). This study was approved by the institutional review board of the Albert Einstein College of Medicine.
RESULTS
Corticosteroids vs No Corticosteroids
Between March 10, 2020, and May 2, 2020, a total of 3,382 adult patients were admitted for COVID-19 at Montefiore Medical Center. Of these, 2,707 patients met the study inclusion criteria, and 324 of those received corticosteroid treatment. Their demographic characteristics, comorbidities, and admission lab values are shown in Table 1. Patients who received corticosteroids were older, had higher comorbidity scores, were more likely to have asthma or chronic obstructive pulmonary disease, and were less likely to be full code status, compared with patients who did not receive corticosteroids. Patients who received corticosteroids also had higher initial white blood cell (WBC) and neutrophil counts but lower lymphocyte count. The two groups were comparable in initial creatinine level. Additional patient characteristics and addmission lab values are shown in Appendix Table 2.
Average change in CRP levels by hospital day for those who received corticosteroids and those who did not are shown in Figure 1A. Among patients who received corticosteroid treatment, there was a significant decrease in CRP level at 72 hours of treatment (P < .001). In the post hoc analysis of trends in CRP levels, we found that CRP levels among those treated with corticosteroids started to rise around day 6 after the initial drop. This trend was observed even after removing patients with shorter LOS (<7 days) (Figure 1B). The median durations of corticosteroid therapy were 3 days among patients whose LOS was less than 7 days and 6 days among those whose LOS was 7 days or greater. The rise in CRP level was seen at day 5 and day 7 within each group, respectively. Crude death rate was 41.7% among patients with LOS of less than 7 days and 40.6% in those with LOS of 7 days or greater.
CRP Responders vs Nonresponders
Among the 324 patients who received corticosteroids, 131 (40.4%) were classified as responders, 92 (28.4%) were classified as nonresponders, and 101 (31.2%) were undetermined. Characteristics of CRP responders and CRP nonresponders are shown in Table 2 and Appendix Table 3. CRP responders were more likely to have dementia, higher median admission platelet count, and fibrinogen level compared with CRP nonresponders. Patients whose CRP response was undetermined were excluded from the analysis. Their characteristics are shown in Appendix Table 4.
The observed inpatient mortality rate was 25.2% among CRP responders and 47.8% among CRP nonresponders. This was also demonstrated in the Kaplan-Meier survival curve (Figure 2). The odds of inpatient mortality among CRP responders was strongly and significantly reduced compared with those among nonresponders in an unadjusted analysis (odds ratio [OR], 0.37; 95% CI, 0.21-0.65; P = .001) and after adjustment for demographic and clinical characteristics including age, Charlson Comorbidity Index, initial WBC count, initial CRP level, and initial fibrinogen level (OR, 0.27; 95% CI, 0.14-0.54; P < .001). Details on how variables were operationalized and information on missing data are included in Appendix Table 1.
To explore whether this observed effect differed depending on severity of the respiratory illness, we examined the association between CRP response and mortality in subgroups stratified by intubation status. Within our cohort of 223 patients (92 CRP responders and 131 CRP nonresponders), 166 patients were never intubated, 50 patients were intubated in the first 48 hours, and 7 patients were intubated later on during the admission. The odds ratios for death among CRP responders vs nonresponders were 0.50 (P = .07) among patients never intubated and 0.46 (P = .2) among patients intubated within the initial 48 hours of admission.
DISCUSSION
In this retrospective study, we found that, on average, patients treated with corticosteroids had a swift and marked reduction in serum CRP. In addition, among patients treated with corticosteroids, those whose CRP was reduced by 50% or more within 72 hours after treatment had a dramatically reduced risk of inpatient mortality compared with the risk among nonresponders. This study contributes to a growing body of evidence that suggests that corticosteroids may be an efficacious treatment to reduce adverse events in patients with COVID-19 who have evidence of high levels of inflammation as measured by CRP level.3,4,12,13
It remains unclear whether CRP is simply a biomarker of disease activity or if it plays a role in mediating inflammation. While CRP is commonly understood to be an acute phase reactant, it has been suggested that, after undergoing proteolysis, it functions as a chemoattractant for monocytes.14 In addition, it is now known that the inflammatory CD14+/CD16+ monocytes that express high levels of IL-6 are key drivers of the cytokine storm in COVID-19.15 Therefore, it may be possible that the high levels of circulating CRP in patients with cytokine storm recruits monocytes to the lungs, which leads to further lung injury.
Other mechanisms of immune dysregulation that may contribute to lung injury and respiratory failure in COVID-19, such as cytokine-induced T-cell suppression, have been proposed.7,16 The related markers, such as levels of T-cells or specific cytokines, may therefore represent different but related underlying immune mechanisms affecting the clinical course of COVID-19 that may respond to different therapeutic modalities such as direct IL-6 blockade or chemokine receptor blockade, among others that are currently under investigation.17,18
Regardless of the underlying mechanism of immune regulation, our study shows that serial measurement of CRP may serve as an early indicator of response to corticosteroids that correlates with decreased mortality. The association between CRP response and reduced risk of mortality was present in both subgroups, those requiring mechanical ventilation and those who did not. The risk reduction was similar in magnitude to the overall effect but was not statistically significant in either group. Interestingly, our time series analysis demonstrated a rise in CRP around day 6 among patients treated with corticosteroids (notably, most patients were treated for 5 to 7 days). Our post hoc analysis suggests that this may represent a “rebound” in inflammation after discontinuation of corticosteroids. However, the clinical significance of this rebound and whether a longer course of steroids would improve outcomes is not known. Because corticosteroid therapy may be associated with adverse effects in some patients,4 it is possible that CRP nonresponders represent a subset of patients in whom corticosteroids are not effective and for whom alternative therapies should be considered. In one study looking at the usefulness of IL-1 inhibition for severe COVID-19 infection, patients who received IL-1 inhibitor therapy had improved mortality and a significant decrease in CRP concentration as compared with the historical group.19 Finally, it is worth noting that, in one large retrospective study, there was harm associated with corticosteroid therapy in patients with low levels of CRP, and in the RECOVERY trial there was a trend toward harm for patients with no oxygen requirement.3,4 Serial measurement of CRP may further identify the subset of patients in whom corticosteroid therapy might be harmful.
This study has several limitations. First, the retrospective nature of this study is inherently prone to selection bias, and despite the large number of clinical variables accounted for, unmeasured confounders may still exist. This study was also conducted at a single clinical center operating under emergency circumstances at a time during which healthcare resources were limited. Overall in-hospital mortality was high but similar to mortality rates reported at other hospitals in the New York City area during the same months.20 The strengths of this study include a large cohort of COVID-19 patients from New York City, an epicenter of COVID-19, who received corticosteroids.
CONCLUSION
We found that therapy with corticosteroids in patients with COVID-19 is associated with a substantial reduction in CRP levels within 72 hours of therapy, and for those patients in whom CRP levels decrease by 50% or more, there is a significantly lower risk of inpatient mortality. Future studies are needed to validate these findings in other cohorts and to determine if markers other than CRP levels may be predictors of a therapeutic response or if CRP nonresponders would benefit from other targeted therapies.
1. WHO coronavirus disease (COVID-19) dashboard. World Health Organization. Updated February 22, 2021. Accessed February 22, 2021. https://covid19.who.int/
2. COVID Data Tracker: United States COVID-19 Cases and Deaths by State. Centers for Disease Control and Prevention. Updated February 22, 2021. Accessed February 22, 2021. https://covid.cdc.gov/covid-data-tracker/#cases_casesper100klast7days
3. Horby P, Lim WS, Emberson JR, et al; RECOVERY Collaborative Group. Dexamethasone in hospitalized patients with Covid-19 - preliminary report. N Engl J Med. Published online July 17, 2020. https://doi.org/10.1056/NEJMoa2021436
4. Keller MJ, Kitsis EA, Arora S, et al. Effect of systemic glucocorticoids on mortality or mechanical ventilation in patients with COVID-19. J Hosp Med. 2020;15(8);489-493. https://doi.org/10.12788/jhm.3497
5. Tay MZ, Poh CM, Rénia L, MacAry PA, Ng LFP. The trinity of COVID-19: immunity, inflammation and intervention. Nat Rev Immunol. 2020;20(6):363-374. https://doi.org/10.1038/s41577-020-0311-8
6. Goleva E, Hauk PJ, Hall CF, et al. Corticosteroid-resistant asthma is associated with classical antimicrobial activation of airway macrophages. J Allergy Clin Immunol. 2008;122(3):550-559.e3. https://doi.org/10.1016/j.jaci.2008.07.007
7. Giamarellos-Bourboulis EJ, Netea MG, Rovina N. Complex immune dysregulation in COVID-19 patients with severe respiratory failure. Cell Host Microbe. 2020;27(6):992-1000.e3. https://doi.org/10.1016/j.chom.2020.04.009
8. Luna CM. C-reactive protein in pneumonia: let me try again. Chest. 2004;125(4):1192-1195. https://doi.org/10.1378/chest.125.4.1192
9. Montaudié H, Seitz-Polski B, Cornille A, Benzaken S, Lacour JP, Passeron T. Interleukin 6 and high-sensitivity C-reactive protein are potential predictive markers of response to infliximab in hidradenitis suppurativa. J Am Acad Dermatol. 2017;76(1):156-158. https://doi.org/10.1016/j.jaad.2016.08.036
10. Menéndez R, Martínez R, Reyes S, et al. Biomarkers improve mortality prediction by prognostic scales in community-acquired pneumonia. Thorax. 2009;64(7):587-591. https://doi.org/10.1136/thx.2008.105312
11. Rajasekaran S, Kruse K, Kovey K, et al. Therapeutic role of anakinra, an interleukin-1 receptor antagonist, in the management of secondary hemophagocytic lymphohistiocytosis/sepsis/multiple organ dysfunction/macrophage activating syndrome in critically ill children. Pediatr Crit Care Med. 2014;15(5):401-408. https://doi.org/10.1097/pcc.0000000000000078
12. Wang Y, Jiang W, He Q, et al. A retrospective cohort study of methylprednisolone therapy in severe patients with COVID-19 pneumonia. Signal Transduct Target Ther. 2020;5(1):57. https://doi.org/10.1038/s41392-020-0158-2
13. Fadel R, Morrison AR, Vahia A, et al. Early short course corticosteroids in hospitalized patients with COVID-19. Clin Infect Dis. Published online May 19, 2020. https://doi.org/10.1093/cid/ciaa601
14. Robey FA, Ohura K, Futaki S, et al. Proteolysis of human c-reactive protein produces peptides with potent immunomodulating activity. J Biol Chem. 1987;262(15):7053-7057.
15. Zhou Y, Fu B, Zheng X, et al. Pathogenic T cells and inflammatory monocytes incite inflammatory storm in severe COVID-19 patients. Natl Sci Rev. Published online March 13, 2020. https://doi.org/10.1093/nsr/nwaa041
16. Zhang X, Tan Y, Ling Y, et al. Viral and host factors related to the clinical outcome of COVID-19. Nature. 2020;583(7816):437-440. https://doi/10.1038/s41586-020-2355-0(2020).
17. Tocilizumab in COVID-19 Pneumonia (TOCIVID-19). ClinicalTrials.gov identifier: NCT04317092. Updated October 22, 2020. Accessed October 22, 2020. https://www.clinicaltrials.gov/ct2/show/NCT04317092
18. Study to Evaluate the Efficacy and Safety of Leronlimab for Patients With Severe or Critical Coronavirus Disease 2019 (COVID-19). ClinicalTrials.gov identifier: NCT04347239. Updated October 19, 2020. Accessed November 16, 2020.https://www.clinicaltrials.gov/ct2/show/NCT04347239
19. Huet T, Beaussier H, Voisin O, et al. Anakinra for severe forms of COVID-19: a cohort study. Lancet Rheumatol. 2020;2(7):e393-e400. https://doi.org/10.1016/s2665-9913(20)30164-8
20. Richardson S, Hirsch JS, Narasimhan M, et al. Presenting characteristics, comorbidities and outcomes among 5700 patients hospitalized with COVID-19 in the New York City area. JAMA. 2020;323(20):2052-2059. https://doi.org/10.1001/jama.2020.6775
© 2021 Society of Hospital Medicine
SCHOLAR Project
The structure and function of academic hospital medicine programs (AHPs) has evolved significantly with the growth of hospital medicine.[1, 2, 3, 4] Many AHPs formed in response to regulatory and financial changes, which drove demand for increased trainee oversight, improved clinical efficiency, and growth in nonteaching services staffed by hospitalists. Differences in local organizational contexts and needs have contributed to great variability in AHP program design and operations. As AHPs have become more established, the need to engage academic hospitalists in scholarship and activities that support professional development and promotion has been recognized. Defining sustainable and successful positions for academic hospitalists is a priority called for by leaders in the field.[5, 6]
In this rapidly evolving context, AHPs have employed a variety of approaches to organizing clinical and academic faculty roles, without guiding evidence or consensus‐based performance benchmarks. A number of AHPs have achieved success along traditional academic metrics of research, scholarship, and education. Currently, it is not known whether specific approaches to AHP organization, structure, or definition of faculty roles are associated with achievement of more traditional markers of academic success.
The Academic Committee of the Society of Hospital Medicine (SHM), and the Academic Hospitalist Task Force of the Society of General Internal Medicine (SGIM) had separately initiated projects to explore characteristics associated with success in AHPs. In 2012, these organizations combined efforts to jointly develop and implement the SCHOLAR (SuCcessful HOspitaLists in Academics and Research) project. The goals were to identify successful AHPs using objective criteria, and to then study those groups in greater detail to generate insights that would be broadly relevant to the field. Efforts to clarify the factors within AHPs linked to success by traditional academic metrics will benefit hospitalists, their leaders, and key stakeholders striving to achieve optimal balance between clinical and academic roles. We describe the initial work of the SCHOLAR project, our definitions of academic success in AHPs, and the characteristics of a cohort of exemplary AHPs who achieved the highest levels on these metrics.
METHODS
Defining Success
The 11 members of the SCHOLAR project held a variety of clinical and academic roles within a geographically diverse group of AHPs. We sought to create a functional definition of success applicable to AHPs. As no gold standard currently exists, we used a consensus process among task force members to arrive at a definition that was quantifiable, feasible, and meaningful. The first step was brainstorming on conference calls held 1 to 2 times monthly over 4 months. Potential defining characteristics that emerged from these discussions related to research, teaching, and administrative activities. When potential characteristics were proposed, we considered how to operationalize each one. Each characteristic was discussed until there was consensus from the entire group. Those around education and administration were the most complex, as many roles are locally driven and defined, and challenging to quantify. For this reason, we focused on promotion as a more global approach to assessing academic hospitalist success in these areas. Although criteria for academic advancement also vary across institutions, we felt that promotion generally reflected having met some threshold of academic success. We also wanted to recognize that scholarship occurs outside the context of funded research. Ultimately, 3 key domains emerged: research grant funding, faculty promotion, and scholarship.
After these 3 domains were identified, the group sought to define quantitative metrics to assess performance. These discussions occurred on subsequent calls over a 4‐month period. Between calls, group members gathered additional information to facilitate assessment of the feasibility of proposed metrics, reporting on progress via email. Again, group consensus was sought for each metric considered. Data on grant funding and successful promotions were available from a previous survey conducted through the SHM in 2011. Leaders from 170 AHPs were contacted, with 50 providing complete responses to the 21‐item questionnaire (see Supporting Information, Appendix 1, in the online version of this article). Results of the survey, heretofore referred to as the Leaders of Academic Hospitalist Programs survey (LAHP‐50), have been described elsewhere.[7] For the purposes of this study, we used the self‐reported data about grant funding and promotions contained in the survey to reflect the current state of the field. Although the survey response rate was approximately 30%, the survey was not anonymous, and many reputationally prominent academic hospitalist programs were represented. For these reasons, the group members felt that the survey results were relevant for the purposes of assessing academic success.
In the LAHP‐50, funding was defined as principal investigator or coinvestigator roles on federally and nonfederally funded research, clinical trials, internal grants, and any other extramurally funded projects. Mean and median funding for the overall sample was calculated. Through a separate question, each program's total faculty full‐time equivalent (FTE) count was reported, allowing us to adjust for group size by assessing both total funding per group and funding/FTE for each responding AHP.
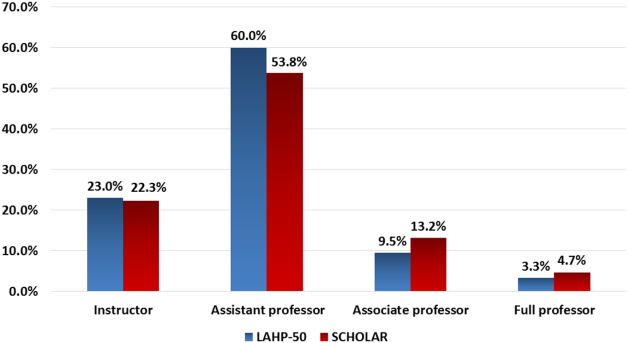
Promotions were defined by the self‐reported number of faculty at each of the following ranks: instructor, assistant professor, associate professor, full professor, and professor above scale/emeritus. In addition, a category of nonacademic track (eg, adjunct faculty, clinical associate) was included to capture hospitalists that did not fit into the traditional promotions categories. We did not distinguish between tenure‐track and nontenure‐track academic ranks. LAHP‐50 survey respondents reported the number of faculty in their group at each academic rank. Given that the majority of academic hospitalists hold a rank of assistant professor or lower,[6, 8, 9] and that the number of full professors was only 3% in the LAHP‐50 cohort, we combined the faculty at the associate and full professor ranks, defining successfully promoted faculty as the percent of hospitalists above the rank of assistant professor.
We created a new metric to assess scholarly output. We had considerable discussion of ways to assess the numbers of peer‐reviewed manuscripts generated by AHPs. However, the group had concerns about the feasibility of identification and attribution of authors to specific AHPs through literature searches. We considered examining only publications in the Journal of Hospital Medicine and the Journal of General Internal Medicine, but felt that this would exclude significant work published by hospitalists in fields of medical education or health services research that would more likely appear in alternate journals. Instead, we quantified scholarship based on the number of abstracts presented at national meetings. We focused on meetings of the SHM and SGIM as the primary professional societies representing hospital medicine. The group felt that even work published outside of the journals of our professional societies would likely be presented at those meetings. We used the following strategy: We reviewed research abstracts accepted for presentation as posters or oral abstracts at the 2010 and 2011 SHM national meetings, and research abstracts with a primary or secondary category of hospital medicine at the 2010 and 2011 SGIM national meetings. By including submissions at both SGIM and SHM meetings, we accounted for the fact that some programs may gravitate more to one society meeting or another. We did not include abstracts in the clinical vignettes or innovations categories. We tallied the number of abstracts by group affiliation of the authors for each of the 4 meetings above and created a cumulative total per group for the 2‐year period. Abstracts with authors from different AHPs were counted once for each individual group. Members of the study group reviewed abstracts from each of the meetings in pairs. Reviewers worked separately and compared tallies of results to ensure consistent tabulations. Internet searches were conducted to identify or confirm author affiliations if it was not apparent in the abstract author list. Abstract tallies were compiled without regard to whether programs had completed the LAHP‐50 survey; thus, we collected data on programs that did not respond to the LAHP‐50 survey.
Identification of the SCHOLAR Cohort
To identify our cohort of top‐performing AHPs, we combined the funding and promotions data from the LAHP‐50 sample with the abstract data. We limited our sample to adult hospital medicine groups to reduce heterogeneity. We created rank lists of programs in each category (grant funding, successful promotions, and scholarship), using data from the LAHP‐50 survey to rank programs on funding and promotions, and data from our abstract counts to rank on scholarship. We limited the top‐performing list in each category to 10 institutions as a cutoff. Because we set a threshold of at least $1 million in total funding, we identified only 9 top performing AHPs with regard to grant funding. We also calculated mean funding/FTE. We chose to rank programs only by funding/FTE rather than total funding per program to better account for group size. For successful promotions, we ranked programs by the percentage of senior faculty. For abstract counts, we included programs whose faculty presented abstracts at a minimum of 2 separate meetings, and ranked programs based on the total number of abstracts per group.
This process resulted in separate lists of top performing programs in each of the 3 domains we associated with academic success, arranged in descending order by grant dollars/FTE, percent of senior faculty, and abstract counts (Table 1). Seventeen different programs were represented across these 3 top 10 lists. One program appeared on all 3 lists, 8 programs appeared on 2 lists, and the remainder appeared on a single list (Table 2). Seven of these programs were identified solely based on abstract presentations, diversifying our top groups beyond only those who completed the LAHP‐50 survey. We considered all of these programs to represent high performance in academic hospital medicine. The group selected this inclusive approach because we recognized that any 1 metric was potentially limited, and we sought to identify diverse pathways to success.
| Funding | Promotions | Scholarship | |
|---|---|---|---|
| Grant $/FTE | Total Grant $ | Senior Faculty, No. (%) | Total Abstract Count |
| |||
| $1,409,090 | $15,500,000 | 3 (60%) | 23 |
| $1,000,000 | $9,000,000 | 3 (60%) | 21 |
| $750,000 | $8,000,000 | 4 (57%) | 20 |
| $478,609 | $6,700,535 | 9 (53%) | 15 |
| $347,826 | $3,000,000 | 8 (44%) | 11 |
| $86,956 | $3,000,000 | 14 (41%) | 11 |
| $66,666 | $2,000,000 | 17 (36%) | 10 |
| $46,153 | $1,500,000 | 9 (33%) | 10 |
| $38,461 | $1,000,000 | 2 (33%) | 9 |
| 4 (31%) | 9 | ||
| Selection Criteria for SCHOLAR Cohort | No. of Programs |
|---|---|
| |
| Abstracts, funding, and promotions | 1 |
| Abstracts plus promotions | 4 |
| Abstracts plus funding | 3 |
| Funding plus promotion | 1 |
| Funding only | 1 |
| Abstract only | 7 |
| Total | 17 |
| Top 10 abstract count | |
| 4 meetings | 2 |
| 3 meetings | 2 |
| 2 meetings | 6 |
The 17 unique adult AHPs appearing on at least 1 of the top 10 lists comprised the SCHOLAR cohort of programs that we studied in greater detail. Data reflecting program demographics were solicited directly from leaders of the AHPs identified in the SCHOLAR cohort, including size and age of program, reporting structure, number of faculty at various academic ranks (for programs that did not complete the LAHP‐50 survey), and number of faculty with fellowship training (defined as any postresidency fellowship program).
Subsequently, we performed comparative analyses between the programs in the SCHOLAR cohort to the general population of AHPs reflected by the LAHP‐50 sample. Because abstract presentations were not recorded in the original LAHP‐50 survey instrument, it was not possible to perform a benchmarking comparison for the scholarship domain.
Data Analysis
To measure the success of the SCHOLAR cohort we compared the grant funding and proportion of successfully promoted faculty at the SCHOLAR programs to those in the overall LAHP‐50 sample. Differences in mean and median grant funding were compared using t tests and Mann‐Whitney rank sum tests. Proportion of promoted faculty were compared using 2 tests. A 2‐tailed of 0.05 was used to test significance of differences.
RESULTS
Demographics
Among the AHPs in the SCHOLAR cohort, the mean program age was 13.2 years (range, 618 years), and the mean program size was 36 faculty (range, 1895; median, 28). On average, 15% of faculty members at SCHOLAR programs were fellowship trained (range, 0%37%). Reporting structure among the SCHOLAR programs was as follows: 53% were an independent division or section of the department of medicine; 29% were a section within general internal medicine, and 18% were an independent clinical group.
Grant Funding
Table 3 compares grant funding in the SCHOLAR programs to programs in the overall LAHP‐50 sample. Mean funding per group and mean funding per FTE were significantly higher in the SCHOLAR group than in the overall sample.
| Funding (Millions) | ||
|---|---|---|
| LAHP‐50 Overall Sample | SCHOLAR | |
| ||
| Median grant funding/AHP | 0.060 | 1.500* |
| Mean grant funding/AHP | 1.147 (015) | 3.984* (015) |
| Median grant funding/FTE | 0.004 | 0.038* |
| Mean grant funding/FTE | 0.095 (01.4) | 0.364* (01.4) |
Thirteen of the SCHOLAR programs were represented in the initial LAHP‐50, but 2 did not report a dollar amount for grants and contracts. Therefore, data for total grant funding were available for only 65% (11 of 17) of the programs in the SCHOLAR cohort. Of note, 28% of AHPs in the overall LAHP‐50 sample reported no external funding sources.
Faculty Promotion
Figure 1 demonstrates the proportion of faculty at various academic ranks. The percent of faculty above the rank of assistant professor in the SCHOLAR programs exceeded those in the overall LAHP‐50 by 5% (17.9% vs 12.8%, P = 0.01). Of note, 6% of the hospitalists at AHPs in the SCHOLAR programs were on nonfaculty tracks.
Scholarship
Mean abstract output over the 2‐year period measured was 10.8 (range, 323) in the SCHOLAR cohort. Because we did not collect these data for the LAHP‐50 group, comparative analyses were not possible.
DISCUSSION
Using a definition of academic success that incorporated metrics of grant funding, faculty promotion, and scholarly output, we identified a unique subset of successful AHPsthe SCHOLAR cohort. The programs represented in the SCHOLAR cohort were generally large and relatively mature. Despite this, the cohort consisted of mostly junior faculty, had a paucity of fellowship‐trained hospitalists, and not all reported grant funding.
Prior published work reported complementary findings.[6, 8, 9] A survey of 20 large, well‐established academic hospitalist programs in 2008 found that the majority of hospitalists were junior faculty with a limited publication portfolio. Of the 266 respondents in that study, 86% reported an academic rank at or below assistant professor; funding was not explored.[9] Our similar findings 4 years later add to this work by demonstrating trends over time, and suggest that progress toward creating successful pathways for academic advancement has been slow. In a 2012 survey of the SHM membership, 28% of hospitalists with academic appointments reported no current or future plans to engage in research.[8] These findings suggest that faculty in AHPs may define scholarship through nontraditional pathways, or in some cases choose not to pursue or prioritize scholarship altogether.
Our findings also add to the literature with regard to our assessment of funding, which was variable across the SCHOLAR group. The broad range of funding in the SCHOLAR programs for which we have data (grant dollars $0$15 million per program) suggests that opportunities to improve supported scholarship remain, even among a selected cohort of successful AHPs. The predominance of junior faculty in the SCHOLAR programs may be a reason for this variation. Junior faculty may be engaged in research with funding directed to senior mentors outside their AHP. Alternatively, they may pursue meaningful local hospital quality improvement or educational innovations not supported by external grants, or hold leadership roles in education, quality, or information technology that allow for advancement and promotion without external grant funding. As the scope and impact of these roles increases, senior leaders with alternate sources of support may rely less on research funds; this too may explain some of the differences. Our findings are congruent with results of a study that reviewed original research published by hospitalists, and concluded that the majority of hospitalist research was not externally funded.[8] Our approach for assessing grant funding by adjusting for FTE had the potential to inadvertently favor smaller well‐funded groups over larger ones; however, programs in our sample were similarly represented when ranked by funding/FTE or total grant dollars. As many successful AHPs do concentrate their research funding among a core of focused hospitalist researchers, our definition may not be the ideal metric for some programs.
We chose to define scholarship based on abstract output, rather than peer‐reviewed publications. Although this choice was necessary from a feasibility perspective, it may have excluded programs that prioritize peer‐reviewed publications over abstracts. Although we were unable to incorporate a search strategy to accurately and comprehensively track the publication output attributed specifically to hospitalist researchers and quantify it by program, others have since defined such an approach.[8] However, tracking abstracts theoretically allowed insights into a larger volume of innovative and creative work generated by top AHPs by potentially including work in the earlier stages of development.
We used a consensus‐based definition of success to define our SCHOLAR cohort. There are other ways to measure academic success, which if applied, may have yielded a different sample of programs. For example, over half of the original research articles published in the Journal of Hospital Medicine over a 7‐year span were generated from 5 academic centers.[8] This definition of success may be equally credible, though we note that 4 of these 5 programs were also included in the SCHOLAR cohort. We feel our broader approach was more reflective of the variety of pathways to success available to academic hospitalists. Before our metrics are applied as a benchmarking tool, however, they should ideally be combined with factors not measured in our study to ensure a more comprehensive or balanced reflection of academic success. Factors such as mentorship, level of hospitalist engagement,[10] prevalence of leadership opportunities, operational and fiscal infrastructure, and the impact of local quality, safety, and value efforts should be considered.
Comparison of successfully promoted faculty at AHPs across the country is inherently limited by the wide variation in promotion standards across different institutions; controlling for such differences was not possible with our methodology. For example, it appears that several programs with relatively few senior faculty may have met metrics leading to their inclusion in the SCHOLAR group because of their small program size. Future benchmarking efforts for promotion at AHPs should take scaling into account and consider both total number as well as percentage of senior faculty when evaluating success.
Our methodology has several limitations. Survey data were self‐reported and not independently validated, and as such are subject to recall and reporting biases. Response bias inherently excluded some AHPs that may have met our grant funding or promotions criteria had they participated in the initial LAHP‐50 survey, though we identified and included additional programs through our scholarship metric, increasing the representativeness of the SCHOLAR cohort. Given the dynamic nature of the field, the age of the data we relied upon for analysis limits the generalizability of our specific benchmarks to current practice. However, the development of academic success occurs over the long‐term, and published data on academic hospitalist productivity are consistent with this slower time course.[8] Despite these limitations, our data inform the general topic of gauging performance of AHPs, underscoring the challenges of developing and applying metrics of success, and highlight the variability of performance on selected metrics even among a relatively small group of 17 programs.
In conclusion, we have created a method to quantify academic success that may be useful to academic hospitalists and their group leaders as they set targets for improvement in the field. Even among our SCHOLAR cohort, room for ongoing improvement in development of funded scholarship and a core of senior faculty exists. Further investigation into the unique features of successful groups will offer insight to leaders in academic hospital medicine regarding infrastructure and processes that should be embraced to raise the bar for all AHPs. In addition, efforts to further define and validate nontraditional approaches to scholarship that allow for successful promotion at AHPs would be informative. We view our work less as a singular approach to benchmarking standards for AHPs, and more a call to action to continue efforts to balance scholarly activity and broad professional development of academic hospitalists with increasing clinical demands.
Acknowledgements
The authors thank all of the AHP leaders who participated in the SCHOLAR project. They also thank the Society of Hospital Medicine and Society of General Internal Medicine and the SHM Academic Committee and SGIM Academic Hospitalist Task Force for their support of this work.
Disclosures
The work reported here was supported by the Department of Veterans Affairs, Veterans Health Administration, South Texas Veterans Health Care System. The views expressed in this article are those of the authors and do not necessarily reflect the position or policy of the Department of Veterans Affairs. The authors report no conflicts of interest.
- , , , , . Characteristics of primary care providers who adopted the hospitalist model from 2001 to 2009. J Hosp Med. 2015;10(2):75–82.
- , , , . Growth in the care of older patients by hospitalists in the United States. N Engl J Med. 2009;360(11):1102–1112.
- , , , , . Updating threshold‐based identification of hospitalists in 2012 Medicare pay data. J Hosp Med. 2016;11(1):45–47.
- , , , . Use of hospitalists by Medicare beneficiaries: a national picture. Medicare Medicaid Res Rev. 2014;4(2).
- , , , , , . Challenges and opportunities in Academic Hospital Medicine: report from the Academic Hospital Medicine Summit. J Hosp Med. 2009;4(4):240–246.
- , , , . Survey of US academic hospitalist leaders about mentorship and academic activities in hospitalist groups. J Hosp Med. 2011;6(1):5–9.
- , , , , , . The structure of hospital medicine programs at academic medical centers [abstract]. J Hosp Med. 2012;7(suppl 2):s92.
- , , , , . Research and publication trends in hospital medicine. J Hosp Med. 2014;9(3):148–154.
- , , , , , . Mentorship, productivity, and promotion among academic hospitalists. J Gen Intern Med. 2012;27(1):23–27.
- , , , et al. The key principles and characteristics of an effective hospital medicine group: an assessment guide for hospitals and hospitalists. J Hosp Med. 2014;9(2):123–128.
The structure and function of academic hospital medicine programs (AHPs) has evolved significantly with the growth of hospital medicine.[1, 2, 3, 4] Many AHPs formed in response to regulatory and financial changes, which drove demand for increased trainee oversight, improved clinical efficiency, and growth in nonteaching services staffed by hospitalists. Differences in local organizational contexts and needs have contributed to great variability in AHP program design and operations. As AHPs have become more established, the need to engage academic hospitalists in scholarship and activities that support professional development and promotion has been recognized. Defining sustainable and successful positions for academic hospitalists is a priority called for by leaders in the field.[5, 6]
In this rapidly evolving context, AHPs have employed a variety of approaches to organizing clinical and academic faculty roles, without guiding evidence or consensus‐based performance benchmarks. A number of AHPs have achieved success along traditional academic metrics of research, scholarship, and education. Currently, it is not known whether specific approaches to AHP organization, structure, or definition of faculty roles are associated with achievement of more traditional markers of academic success.
The Academic Committee of the Society of Hospital Medicine (SHM), and the Academic Hospitalist Task Force of the Society of General Internal Medicine (SGIM) had separately initiated projects to explore characteristics associated with success in AHPs. In 2012, these organizations combined efforts to jointly develop and implement the SCHOLAR (SuCcessful HOspitaLists in Academics and Research) project. The goals were to identify successful AHPs using objective criteria, and to then study those groups in greater detail to generate insights that would be broadly relevant to the field. Efforts to clarify the factors within AHPs linked to success by traditional academic metrics will benefit hospitalists, their leaders, and key stakeholders striving to achieve optimal balance between clinical and academic roles. We describe the initial work of the SCHOLAR project, our definitions of academic success in AHPs, and the characteristics of a cohort of exemplary AHPs who achieved the highest levels on these metrics.
METHODS
Defining Success
The 11 members of the SCHOLAR project held a variety of clinical and academic roles within a geographically diverse group of AHPs. We sought to create a functional definition of success applicable to AHPs. As no gold standard currently exists, we used a consensus process among task force members to arrive at a definition that was quantifiable, feasible, and meaningful. The first step was brainstorming on conference calls held 1 to 2 times monthly over 4 months. Potential defining characteristics that emerged from these discussions related to research, teaching, and administrative activities. When potential characteristics were proposed, we considered how to operationalize each one. Each characteristic was discussed until there was consensus from the entire group. Those around education and administration were the most complex, as many roles are locally driven and defined, and challenging to quantify. For this reason, we focused on promotion as a more global approach to assessing academic hospitalist success in these areas. Although criteria for academic advancement also vary across institutions, we felt that promotion generally reflected having met some threshold of academic success. We also wanted to recognize that scholarship occurs outside the context of funded research. Ultimately, 3 key domains emerged: research grant funding, faculty promotion, and scholarship.
After these 3 domains were identified, the group sought to define quantitative metrics to assess performance. These discussions occurred on subsequent calls over a 4‐month period. Between calls, group members gathered additional information to facilitate assessment of the feasibility of proposed metrics, reporting on progress via email. Again, group consensus was sought for each metric considered. Data on grant funding and successful promotions were available from a previous survey conducted through the SHM in 2011. Leaders from 170 AHPs were contacted, with 50 providing complete responses to the 21‐item questionnaire (see Supporting Information, Appendix 1, in the online version of this article). Results of the survey, heretofore referred to as the Leaders of Academic Hospitalist Programs survey (LAHP‐50), have been described elsewhere.[7] For the purposes of this study, we used the self‐reported data about grant funding and promotions contained in the survey to reflect the current state of the field. Although the survey response rate was approximately 30%, the survey was not anonymous, and many reputationally prominent academic hospitalist programs were represented. For these reasons, the group members felt that the survey results were relevant for the purposes of assessing academic success.
In the LAHP‐50, funding was defined as principal investigator or coinvestigator roles on federally and nonfederally funded research, clinical trials, internal grants, and any other extramurally funded projects. Mean and median funding for the overall sample was calculated. Through a separate question, each program's total faculty full‐time equivalent (FTE) count was reported, allowing us to adjust for group size by assessing both total funding per group and funding/FTE for each responding AHP.
Promotions were defined by the self‐reported number of faculty at each of the following ranks: instructor, assistant professor, associate professor, full professor, and professor above scale/emeritus. In addition, a category of nonacademic track (eg, adjunct faculty, clinical associate) was included to capture hospitalists that did not fit into the traditional promotions categories. We did not distinguish between tenure‐track and nontenure‐track academic ranks. LAHP‐50 survey respondents reported the number of faculty in their group at each academic rank. Given that the majority of academic hospitalists hold a rank of assistant professor or lower,[6, 8, 9] and that the number of full professors was only 3% in the LAHP‐50 cohort, we combined the faculty at the associate and full professor ranks, defining successfully promoted faculty as the percent of hospitalists above the rank of assistant professor.
We created a new metric to assess scholarly output. We had considerable discussion of ways to assess the numbers of peer‐reviewed manuscripts generated by AHPs. However, the group had concerns about the feasibility of identification and attribution of authors to specific AHPs through literature searches. We considered examining only publications in the Journal of Hospital Medicine and the Journal of General Internal Medicine, but felt that this would exclude significant work published by hospitalists in fields of medical education or health services research that would more likely appear in alternate journals. Instead, we quantified scholarship based on the number of abstracts presented at national meetings. We focused on meetings of the SHM and SGIM as the primary professional societies representing hospital medicine. The group felt that even work published outside of the journals of our professional societies would likely be presented at those meetings. We used the following strategy: We reviewed research abstracts accepted for presentation as posters or oral abstracts at the 2010 and 2011 SHM national meetings, and research abstracts with a primary or secondary category of hospital medicine at the 2010 and 2011 SGIM national meetings. By including submissions at both SGIM and SHM meetings, we accounted for the fact that some programs may gravitate more to one society meeting or another. We did not include abstracts in the clinical vignettes or innovations categories. We tallied the number of abstracts by group affiliation of the authors for each of the 4 meetings above and created a cumulative total per group for the 2‐year period. Abstracts with authors from different AHPs were counted once for each individual group. Members of the study group reviewed abstracts from each of the meetings in pairs. Reviewers worked separately and compared tallies of results to ensure consistent tabulations. Internet searches were conducted to identify or confirm author affiliations if it was not apparent in the abstract author list. Abstract tallies were compiled without regard to whether programs had completed the LAHP‐50 survey; thus, we collected data on programs that did not respond to the LAHP‐50 survey.
Identification of the SCHOLAR Cohort
To identify our cohort of top‐performing AHPs, we combined the funding and promotions data from the LAHP‐50 sample with the abstract data. We limited our sample to adult hospital medicine groups to reduce heterogeneity. We created rank lists of programs in each category (grant funding, successful promotions, and scholarship), using data from the LAHP‐50 survey to rank programs on funding and promotions, and data from our abstract counts to rank on scholarship. We limited the top‐performing list in each category to 10 institutions as a cutoff. Because we set a threshold of at least $1 million in total funding, we identified only 9 top performing AHPs with regard to grant funding. We also calculated mean funding/FTE. We chose to rank programs only by funding/FTE rather than total funding per program to better account for group size. For successful promotions, we ranked programs by the percentage of senior faculty. For abstract counts, we included programs whose faculty presented abstracts at a minimum of 2 separate meetings, and ranked programs based on the total number of abstracts per group.
This process resulted in separate lists of top performing programs in each of the 3 domains we associated with academic success, arranged in descending order by grant dollars/FTE, percent of senior faculty, and abstract counts (Table 1). Seventeen different programs were represented across these 3 top 10 lists. One program appeared on all 3 lists, 8 programs appeared on 2 lists, and the remainder appeared on a single list (Table 2). Seven of these programs were identified solely based on abstract presentations, diversifying our top groups beyond only those who completed the LAHP‐50 survey. We considered all of these programs to represent high performance in academic hospital medicine. The group selected this inclusive approach because we recognized that any 1 metric was potentially limited, and we sought to identify diverse pathways to success.
| Funding | Promotions | Scholarship | |
|---|---|---|---|
| Grant $/FTE | Total Grant $ | Senior Faculty, No. (%) | Total Abstract Count |
| |||
| $1,409,090 | $15,500,000 | 3 (60%) | 23 |
| $1,000,000 | $9,000,000 | 3 (60%) | 21 |
| $750,000 | $8,000,000 | 4 (57%) | 20 |
| $478,609 | $6,700,535 | 9 (53%) | 15 |
| $347,826 | $3,000,000 | 8 (44%) | 11 |
| $86,956 | $3,000,000 | 14 (41%) | 11 |
| $66,666 | $2,000,000 | 17 (36%) | 10 |
| $46,153 | $1,500,000 | 9 (33%) | 10 |
| $38,461 | $1,000,000 | 2 (33%) | 9 |
| 4 (31%) | 9 | ||
| Selection Criteria for SCHOLAR Cohort | No. of Programs |
|---|---|
| |
| Abstracts, funding, and promotions | 1 |
| Abstracts plus promotions | 4 |
| Abstracts plus funding | 3 |
| Funding plus promotion | 1 |
| Funding only | 1 |
| Abstract only | 7 |
| Total | 17 |
| Top 10 abstract count | |
| 4 meetings | 2 |
| 3 meetings | 2 |
| 2 meetings | 6 |
The 17 unique adult AHPs appearing on at least 1 of the top 10 lists comprised the SCHOLAR cohort of programs that we studied in greater detail. Data reflecting program demographics were solicited directly from leaders of the AHPs identified in the SCHOLAR cohort, including size and age of program, reporting structure, number of faculty at various academic ranks (for programs that did not complete the LAHP‐50 survey), and number of faculty with fellowship training (defined as any postresidency fellowship program).
Subsequently, we performed comparative analyses between the programs in the SCHOLAR cohort to the general population of AHPs reflected by the LAHP‐50 sample. Because abstract presentations were not recorded in the original LAHP‐50 survey instrument, it was not possible to perform a benchmarking comparison for the scholarship domain.
Data Analysis
To measure the success of the SCHOLAR cohort we compared the grant funding and proportion of successfully promoted faculty at the SCHOLAR programs to those in the overall LAHP‐50 sample. Differences in mean and median grant funding were compared using t tests and Mann‐Whitney rank sum tests. Proportion of promoted faculty were compared using 2 tests. A 2‐tailed of 0.05 was used to test significance of differences.
RESULTS
Demographics
Among the AHPs in the SCHOLAR cohort, the mean program age was 13.2 years (range, 618 years), and the mean program size was 36 faculty (range, 1895; median, 28). On average, 15% of faculty members at SCHOLAR programs were fellowship trained (range, 0%37%). Reporting structure among the SCHOLAR programs was as follows: 53% were an independent division or section of the department of medicine; 29% were a section within general internal medicine, and 18% were an independent clinical group.
Grant Funding
Table 3 compares grant funding in the SCHOLAR programs to programs in the overall LAHP‐50 sample. Mean funding per group and mean funding per FTE were significantly higher in the SCHOLAR group than in the overall sample.
| Funding (Millions) | ||
|---|---|---|
| LAHP‐50 Overall Sample | SCHOLAR | |
| ||
| Median grant funding/AHP | 0.060 | 1.500* |
| Mean grant funding/AHP | 1.147 (015) | 3.984* (015) |
| Median grant funding/FTE | 0.004 | 0.038* |
| Mean grant funding/FTE | 0.095 (01.4) | 0.364* (01.4) |
Thirteen of the SCHOLAR programs were represented in the initial LAHP‐50, but 2 did not report a dollar amount for grants and contracts. Therefore, data for total grant funding were available for only 65% (11 of 17) of the programs in the SCHOLAR cohort. Of note, 28% of AHPs in the overall LAHP‐50 sample reported no external funding sources.
Faculty Promotion
Figure 1 demonstrates the proportion of faculty at various academic ranks. The percent of faculty above the rank of assistant professor in the SCHOLAR programs exceeded those in the overall LAHP‐50 by 5% (17.9% vs 12.8%, P = 0.01). Of note, 6% of the hospitalists at AHPs in the SCHOLAR programs were on nonfaculty tracks.
Scholarship
Mean abstract output over the 2‐year period measured was 10.8 (range, 323) in the SCHOLAR cohort. Because we did not collect these data for the LAHP‐50 group, comparative analyses were not possible.
DISCUSSION
Using a definition of academic success that incorporated metrics of grant funding, faculty promotion, and scholarly output, we identified a unique subset of successful AHPsthe SCHOLAR cohort. The programs represented in the SCHOLAR cohort were generally large and relatively mature. Despite this, the cohort consisted of mostly junior faculty, had a paucity of fellowship‐trained hospitalists, and not all reported grant funding.
Prior published work reported complementary findings.[6, 8, 9] A survey of 20 large, well‐established academic hospitalist programs in 2008 found that the majority of hospitalists were junior faculty with a limited publication portfolio. Of the 266 respondents in that study, 86% reported an academic rank at or below assistant professor; funding was not explored.[9] Our similar findings 4 years later add to this work by demonstrating trends over time, and suggest that progress toward creating successful pathways for academic advancement has been slow. In a 2012 survey of the SHM membership, 28% of hospitalists with academic appointments reported no current or future plans to engage in research.[8] These findings suggest that faculty in AHPs may define scholarship through nontraditional pathways, or in some cases choose not to pursue or prioritize scholarship altogether.
Our findings also add to the literature with regard to our assessment of funding, which was variable across the SCHOLAR group. The broad range of funding in the SCHOLAR programs for which we have data (grant dollars $0$15 million per program) suggests that opportunities to improve supported scholarship remain, even among a selected cohort of successful AHPs. The predominance of junior faculty in the SCHOLAR programs may be a reason for this variation. Junior faculty may be engaged in research with funding directed to senior mentors outside their AHP. Alternatively, they may pursue meaningful local hospital quality improvement or educational innovations not supported by external grants, or hold leadership roles in education, quality, or information technology that allow for advancement and promotion without external grant funding. As the scope and impact of these roles increases, senior leaders with alternate sources of support may rely less on research funds; this too may explain some of the differences. Our findings are congruent with results of a study that reviewed original research published by hospitalists, and concluded that the majority of hospitalist research was not externally funded.[8] Our approach for assessing grant funding by adjusting for FTE had the potential to inadvertently favor smaller well‐funded groups over larger ones; however, programs in our sample were similarly represented when ranked by funding/FTE or total grant dollars. As many successful AHPs do concentrate their research funding among a core of focused hospitalist researchers, our definition may not be the ideal metric for some programs.
We chose to define scholarship based on abstract output, rather than peer‐reviewed publications. Although this choice was necessary from a feasibility perspective, it may have excluded programs that prioritize peer‐reviewed publications over abstracts. Although we were unable to incorporate a search strategy to accurately and comprehensively track the publication output attributed specifically to hospitalist researchers and quantify it by program, others have since defined such an approach.[8] However, tracking abstracts theoretically allowed insights into a larger volume of innovative and creative work generated by top AHPs by potentially including work in the earlier stages of development.
We used a consensus‐based definition of success to define our SCHOLAR cohort. There are other ways to measure academic success, which if applied, may have yielded a different sample of programs. For example, over half of the original research articles published in the Journal of Hospital Medicine over a 7‐year span were generated from 5 academic centers.[8] This definition of success may be equally credible, though we note that 4 of these 5 programs were also included in the SCHOLAR cohort. We feel our broader approach was more reflective of the variety of pathways to success available to academic hospitalists. Before our metrics are applied as a benchmarking tool, however, they should ideally be combined with factors not measured in our study to ensure a more comprehensive or balanced reflection of academic success. Factors such as mentorship, level of hospitalist engagement,[10] prevalence of leadership opportunities, operational and fiscal infrastructure, and the impact of local quality, safety, and value efforts should be considered.
Comparison of successfully promoted faculty at AHPs across the country is inherently limited by the wide variation in promotion standards across different institutions; controlling for such differences was not possible with our methodology. For example, it appears that several programs with relatively few senior faculty may have met metrics leading to their inclusion in the SCHOLAR group because of their small program size. Future benchmarking efforts for promotion at AHPs should take scaling into account and consider both total number as well as percentage of senior faculty when evaluating success.
Our methodology has several limitations. Survey data were self‐reported and not independently validated, and as such are subject to recall and reporting biases. Response bias inherently excluded some AHPs that may have met our grant funding or promotions criteria had they participated in the initial LAHP‐50 survey, though we identified and included additional programs through our scholarship metric, increasing the representativeness of the SCHOLAR cohort. Given the dynamic nature of the field, the age of the data we relied upon for analysis limits the generalizability of our specific benchmarks to current practice. However, the development of academic success occurs over the long‐term, and published data on academic hospitalist productivity are consistent with this slower time course.[8] Despite these limitations, our data inform the general topic of gauging performance of AHPs, underscoring the challenges of developing and applying metrics of success, and highlight the variability of performance on selected metrics even among a relatively small group of 17 programs.
In conclusion, we have created a method to quantify academic success that may be useful to academic hospitalists and their group leaders as they set targets for improvement in the field. Even among our SCHOLAR cohort, room for ongoing improvement in development of funded scholarship and a core of senior faculty exists. Further investigation into the unique features of successful groups will offer insight to leaders in academic hospital medicine regarding infrastructure and processes that should be embraced to raise the bar for all AHPs. In addition, efforts to further define and validate nontraditional approaches to scholarship that allow for successful promotion at AHPs would be informative. We view our work less as a singular approach to benchmarking standards for AHPs, and more a call to action to continue efforts to balance scholarly activity and broad professional development of academic hospitalists with increasing clinical demands.
Acknowledgements
The authors thank all of the AHP leaders who participated in the SCHOLAR project. They also thank the Society of Hospital Medicine and Society of General Internal Medicine and the SHM Academic Committee and SGIM Academic Hospitalist Task Force for their support of this work.
Disclosures
The work reported here was supported by the Department of Veterans Affairs, Veterans Health Administration, South Texas Veterans Health Care System. The views expressed in this article are those of the authors and do not necessarily reflect the position or policy of the Department of Veterans Affairs. The authors report no conflicts of interest.
- , , , , . Characteristics of primary care providers who adopted the hospitalist model from 2001 to 2009. J Hosp Med. 2015;10(2):75–82.
- , , , . Growth in the care of older patients by hospitalists in the United States. N Engl J Med. 2009;360(11):1102–1112.
- , , , , . Updating threshold‐based identification of hospitalists in 2012 Medicare pay data. J Hosp Med. 2016;11(1):45–47.
- , , , . Use of hospitalists by Medicare beneficiaries: a national picture. Medicare Medicaid Res Rev. 2014;4(2).
- , , , , , . Challenges and opportunities in Academic Hospital Medicine: report from the Academic Hospital Medicine Summit. J Hosp Med. 2009;4(4):240–246.
- , , , . Survey of US academic hospitalist leaders about mentorship and academic activities in hospitalist groups. J Hosp Med. 2011;6(1):5–9.
- , , , , , . The structure of hospital medicine programs at academic medical centers [abstract]. J Hosp Med. 2012;7(suppl 2):s92.
- , , , , . Research and publication trends in hospital medicine. J Hosp Med. 2014;9(3):148–154.
- , , , , , . Mentorship, productivity, and promotion among academic hospitalists. J Gen Intern Med. 2012;27(1):23–27.
- , , , et al. The key principles and characteristics of an effective hospital medicine group: an assessment guide for hospitals and hospitalists. J Hosp Med. 2014;9(2):123–128.
