User login
PCPs Who Adopted the Hospitalist Model
Although primary care physicians (PCPs) have traditionally treated patients in both ambulatory and hospital settings, many relinquished inpatient duties to hospitalists in recent decades.[1] Little is known about the PCPs who relinquished inpatient care duties or how the transition to the hospitalist model occurred. For example, what are the characteristics of PCPs who change? Do PCPs adopt the hospitalist model enthusiastically or cautiously? Characterizing PCPs who adopted the hospitalist model can help hospitalists understand their specialty's history and also inform health services research.
Much of the interest in the hospitalist model has been generated by studies reporting improved outcomes and lower hospital lengths of stay associated with hospitalist care.[2, 3, 4, 5] Conversely, detractors of the model point to reports of higher postacute care utilization among hospitalist patients.[6] Although these studies usually adjusted for differences among patients and hospitals, they did not account for PCP characteristics. As patients' access to PCPs and their PCP's capabilities are both plausible factors that could influence hospital length of stay (eg, decisions to complete more or less of a workup in the hospital), quality of care transitions, and postdischarge utilization, it is important to determine if PCPs who use hospitalists differ systematically from those who do not to correctly interpret health system utilization patterns that currently are attributed only to hospitalists.[7, 8]
We conducted this study to determine if observable PCP factors are associated with patients' use of hospitalists and to describe the trajectory by which PCPs referred their patients to hospitalists over time.
METHODS
Source of Data
We used claims data from 100% of Texas Medicare beneficiaries from 2000 to 2009, including Medicare beneficiary summary files, Medicare Provider Analysis and Review (MedPAR) files, Outpatient Standard Analytical Files (OutSAF), and Medicare Carrier files. Diagnosis related group (DRG)‐associated information, including weights, and Major Diagnostic Categories, were obtained from Centers for Medicare & Medicaid Services (
Establishment of the Study Cohort
Using the MedPAR file, we first selected hospital admissions from acute care hospitals in Texas for each year of the study period. We excluded beneficiaries younger than 66 years old, with incomplete Medicare Parts A and B enrollment, or with any health maintenance organization enrollment in the 12 months prior to the admission of interest. For patients with more than 1 admission in a given year, we randomly selected 1 admission. We then attempted to assign each patient to a PCP. We defined a PCP as a generalist (general practitioner, family physician, internist, or geriatrician) who saw a given beneficiary on 3 or more occasions in an outpatient setting in the year prior to the admission of interest.[9] We identified outpatient visits using Current Procedural Terminology (CPT) codes 99201 to 99205 (new patient encounters), and 99211 to 99215 (established patient encounters) from Carrier files. If more than 1 generalist physician saw the beneficiary on 3 or more occasions in a given year, the physician with more than 75% of the total outpatient evaluation and management (E&M) billings was classified as the beneficiary's PCP. Using these criteria, approximately 66% of patients were assigned to a PCP.
For cross‐sectional analyses, we restricted our cohort to beneficiaries whose PCPs were associated with at least 20 inpatients in a given year. To study trends in PCP practice patterns over time, we further restricted the cohort to beneficiaries whose PCPs were associated with at least 20 inpatients in every year of the study period, resulting in 1172 PCPs for the trajectory analyses. The reliability of PCPs' practice profiles increases as the number of patients in their panel increases. We chose 20 inpatients as the minimum because PCPs with 20 hospitalized patients per study year would achieve a reliability of 0.9 for estimating the proportion of their patients that received care from hospitalists.[10]
Identification of Hospitalists
We defined hospitalists as generalists who had at least 100 E&M billings in a given year and generated at least 90% of their total E&M billings in the year from inpatient services.[1] Inpatient E&M billings were identified by CPT codes 99221 to 99223 (new or established patient encounters), 99231 to 99233 (subsequent hospital care), and 99251 to 99255 (inpatient consultations).[1]
Patient Measures
Patient demographic information including, age at admission, gender, race/ethnicity, and Medicaid eligibility were obtained from Medicare beneficiary summary files. We used the Medicaid indicator as a proxy for low socioeconomic status. Information on weekday versus weekend admission, emergent admission, and DRG were obtained from MedPAR files. The DRG category (circulatory system, digestive system, infectious disease, nervous system, respiratory system, or other) was determined based on its Major Diagnostic Category. We determined residence in a nursing facility in the 3 months before the admission of interest from the MedPAR files and by E&M codes 99304 to 99318 (nursing facility services) from Carrier files.[11] Comorbidities were identified using the claims from MedPAR, Carrier, and OutSAF files in the year prior to the admission of interest.[12] Total hospitalizations and outpatient visits in the prior year were identified from MedPAR files and Carrier files, respectively.
PCP Measures
We categorized PCPs by specialty (general practice, gamily practice, geriatric medicine, or internal medicine), years in practice, gender, US‐ versus foreign‐trained, metropolitan statistical area (MSA) of their practice location, and board certification status. The specialty was identified from Carrier files and the other information from AMA data. For each PCP, the total number of outpatient visits and total number of patients seen as outpatients in each year was calculated based on E&M codes (9920199205, 9921199215) from Carrier files. For each year, we computed the average outpatient age, gender, race, and outpatient comorbidity for each PCP's patient panel. We computed hospital volumes using the number of hospitalized patients associated with each PCP in the study cohort.
Study Outcome
To determine whether hospitalized patients received care from hospitalists during a given hospitalization, we identified all inpatient E&M bills from generalist physicians during the admission of interest by linking MedPAR and Carrier files. If more than 50% of the generalist inpatient E&M billings from generalist physicians were from 1 or more hospitalists, the patient was considered to have received care from hospitalists.
Statistical Analyses
Multilevel analyses were used to account for the clustering of patients within PCPs. All multilevel models were adjusted for patient characteristics including age, race/ethnicity, gender, Medicaid eligibility, emergency admission, weekend admission, DRG weight, DRG category, any nursing home stay in the prior 3 months, number of comorbidities, number of hospitalizations, and number of physician visits in the year prior to the admission of interest. To analyze trends in practice patterns, we first used multilevel models to calculate the proportions of inpatients cared for by hospitalists each year for each of the 1172 PCPs with at least 20 patients. Then we employed an SAS procedure (PROC TRAJ) developed by Jones et al. to classify these PCPs into groups based on their trajectories.[13] This group‐based trajectory modeling allowed us to identify relatively homogeneous clusters within a heterogeneous sample population.[14] We chose a model that classified the PCPs into 4 groups.[15] With 4 groups, the average of the posterior probabilities of group membership for the PCPs assigned to each group exceeded 0.93, indicating a low rate of misclassification among these 4 distinct groups. For the 1172 PCPs, we tested interactions between year of hospitalization and PCP characteristics while adjusting for patient characteristics in order to investigate whether or not the impacts of PCP characteristics on how likely their patients being cared for by hospitalists differed with time. All analyses were performed with SAS version 9.2 (SAS Institute Inc., Cary, NC).
RESULTS
During the 2001 through 2009 study period, between 2252 and 2848 PCPs were associated with at least 20 hospitalized beneficiaries in any single year. Among these, 1172 PCPs were associated with at least 20 hospitalized beneficiaries in every year of the study period. These 1172 PCPs were associated with 608,686 hospitalizations over the 9 years.
Table 1 presents the characteristics of the PCPs who contributed to the cross‐sectional analyses in 2001 (N=2252) and 2009 (N=2387), as well as the 1172 PCPs for whom we had data for all 9 years for the longitudinal analyses. Most PCPs were male, trained in the United States, and were board certified. The average number of Medicare patients seen by these PCPs and number of outpatient Medicare visits went up about 7% between 2001 and 2009.
| PCP Characteristics | Cross‐Sectional Analysis | Trajectory Analysis, 20012009 | |
|---|---|---|---|
| 2001 | 2009 | ||
| |||
| Overall, no. (%) | 2,252 (100%) | 2,387 (100%) | 1,172 (100%) |
| Specialty, no. (%) | |||
| General practice | 39 (1.7%) | 34 (1.4%) | 15 (1.3%) |
| Family practice | 948 (42.1%) | 1,089 (45.6%) | 466 (39.8%) |
| Internal medicine | 1,255 (55.7%) | 1,249 (52.3%) | 688 (58.7%) |
| Geriatrics | 10 (0.4%) | 15 (0.6%) | 3 (0.3%) |
| Gender, no. (%) | |||
| Male | 1,990 (88.4%) | 2,015 (84.4%) | 1,072 (91.5%) |
| Female | 262 (11.6%) | 372 (15.6%) | 100 (8.5%) |
| Trained in the United States, no. (%) | |||
| Yes | 1,669 (74.1%) | 1,738 (72.8%) | 844 (72.0%) |
| No | 583 (25.9%) | 649 (27.2%) | 328 (28.0%) |
| Metropolitan statistical area, no. (%) | |||
| 99,999 or less | 417 (17.5) | 237 (20.2) | |
| 100,000249,000 | 438 (18.3) | 234 (20.0) | |
| 250,000999,999 | 381 (16.0) | 216 (18.4) | |
| 1,000,000 or more | 1,151 (48.2) | 485 (41.4) | |
| Board certification, no. (%) | |||
| Yes | 1,657 (69.4%) | 800 (68.3%) | |
| No | 730 (30.6%) | 372 (31.7%) | |
| Years in practice, 2001, meanSD (Q1Q3) | 22.310.6 (15.028.0) | 21.28.9 (15.027.0) | |
| Years in practice, 2009, meanSD (Q1Q3) | 25.010.2 (17.032.0) | 29.28.9 (23.035.0) | |
| Total no. of Medicare outpatient visits, 2001, meanSD (Q1Q3) | 1,624.8879.2 (1,057.51,970.0) | 1,883.39,48.5 (1,236.52,240.5) | |
| Total no. of Medicare outpatient visits, 2009, meanSD (Q1Q3) | 1,733.81,053.3 (1,080.02,048.0) | 2,020.51,200.9 (1,334.52,373.0) | |
| Total no. of Medicare outpatients, 2001, meanSD (Q1Q3) | 418.6186.9 (284.0522.0) | 473.4189.5 (338.0580.5) | |
| Total no. of Medicare outpatients, 2009, meanSD (Q1Q3) | 448.7217.8 (300.0548.0) | 508.7238.2 (350.5615.0) | |
| No. of hospitalized patients, 2001, meanSD (Q1Q3) | 46.025.0 (27.057.0) | 53.028.0 (32.066.0) | |
| No. of hospitalized patients, 2009, meanSD (Q1Q3) | 44.024.0 (26.052.0) | 52.027.0 (33.065.0) | |
| Average outpatient age, 2001, meanSD (Q1Q3) | 72.82.3 (71.574.2) | 72.82.1 (71.774.1) | |
| Average outpatient age, 2009, meanSD (Q1Q3) | 72.12.8 (70.673.9) | 72.82.7 (71.474.5) | |
| Average outpatient gender (% male), 2001, meanSD (Q1Q3) | 38.17.0 (35.542.3) | 38.56.4 (36.242.3) | |
| Average outpatient gender (% male), 2009, meanSD (Q1Q3) | 40.27.6 (37.644.8) | 41.06.5 (38.644.8) | |
| Average outpatient race (% white), 2001, meanSD (Q1Q3) | 84.316.4 (79.295.5) | 85.414.3 (79.995.7) | |
| Average outpatient race (% white), 2009, meanSD (Q1Q3) | 85.214.4 (79.895.2) | 86.312.9 (80.895.6) | |
| Average outpatient comorbidity, 2001, meanSD (Q1Q3)a | 1.60.5 (1.21.8) | 1.60.4 (1.21.8) | |
| Average outpatient comorbidity, 2009, meanSD (Q1Q3)a | 2.20.6 (1.82.5) | 2.20.6 (1.72.5) | |
Figure 1 graphs the percentage of PCPs as a function of what percent of their hospitalized patients received care from hospitalists, and how that changed from 2001 to 2009. For 70.9% of PCPs, fewer than 5% of their hospitalized patients received hospitalist care in 2001. By 2009, the percent of PCPs in this category had decreased to 15.2%. In contrast, in 2001, more than half of the patients for 2.1% of PCPs received hospitalist care, and the percent of PCPs in this category increased to 26.3% by 2009.
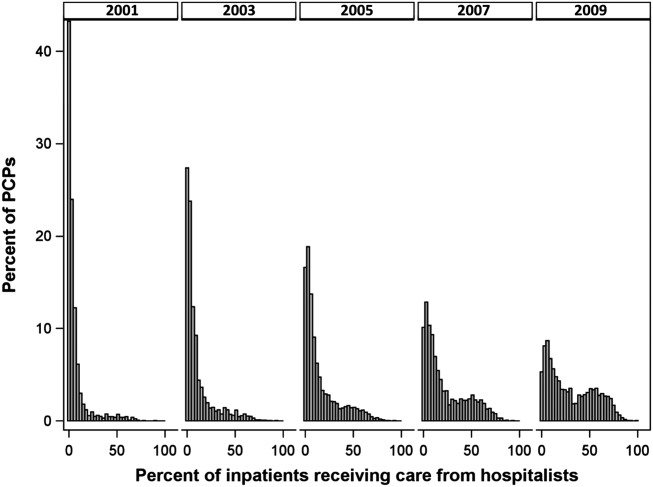
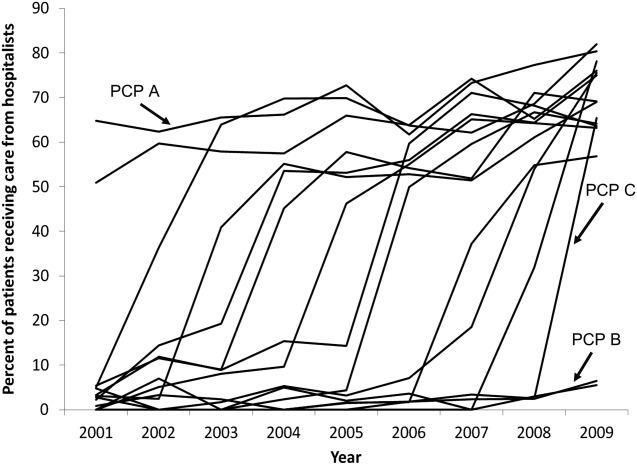
The pattern in Figure 1 shows that PCPs' use of hospitalists changed continuously and gradually over time. However, this pattern describes the PCPs as a group. When examined at the individual PCP level, different patterns emerge. Figure 2, which presents selected individual PCP's use of hospitalists over time, shows several distinct subpatterns of PCP practice behaviors. First, there are PCPs whose use of hospitalists was high in 2001 and stayed high or increased over time (eg, PCP A). There also were PCPs whose use of hospitalists stayed low over the entire study period (eg, PCP B). Finally, there were PCPs whose use of hospitalists was low in 2001 but high in 2009 (eg, PCP C). For this last group, the pattern of change in hospitalist utilization over time was discontinuous; that is, most of the increase occurred over a 1‐ or 2‐year period, instead of increasing gradually over time.
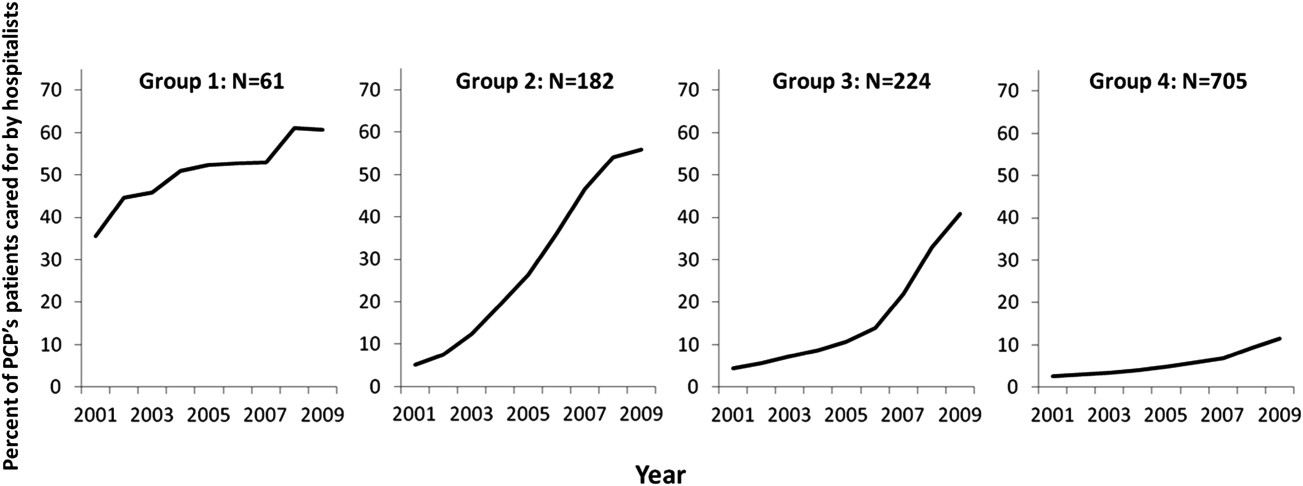
Among the 1172 PCPs associated with 20 hospitalized beneficiaries each year in all 9 years of the study period, group‐based trajectory modeling classified their practice patterns into 4 distinct trajectories (Figure 3). Among PCPs in group 1, more than one‐third of their hospitalized patients were cared for by hospitalists in 2001, and this increased to 60% by 2009. PCPs in groups 2 and 3 rarely used hospitalist care in 2001 but increased their use over time. The increase started early in the period for PCPs in group 2 and later for those in group 3. PCPs in group 4 were associated with little hospitalist use throughout the study period.
We constructed a model to describe the odds of a patient receiving care from hospitalists during the study period using patients associated with these 1172 PCPs. After adjusting for patient characteristics, the residual intraclass correlation coefficient for PCP level was 0.334, which indicates that 33.4% of the variance in whether a hospitalized patient received care from a hospitalist is explained by which PCP the patient saw. When adjusting for both patient and PCP characteristics, the overall odds of a patient receiving hospitalist care increased by 30% (95% confidence interval [CI]: 1.29‐1.30) per year from 2001 through 2009.
There were also significant interactions between year of hospitalization and several PCP characteristics. These interactions are illustrated in Table 2, which stratifies each of those PCP characteristics by 3 time periods: 2001 to 2003, 2004 to 2006, and 2007 to 2009. In all time periods, patients were more likely to receive hospitalist care if their PCP was US trained (US vs international medical graduate: odds ratio [OR]: 1.42, 95% CI: 1.19‐1.69 in 20012003; OR: 1.46, 95% CI: 1.23‐1.73 in 20072009), or specialized in family medicine (family medicine vs internal medicine: OR: 1.46, 95% CI: 1.25‐1.72 in 20012003; OR: 1.46, 95% CI: 1.25‐1.70 in 20072009). Over time, the relative odds of a patient receiving care from hospitalists decreased if their PCP was female (female vs male: OR: 1.91, 95% CI: 1.46‐2.50 in 20012003 vs OR: 1.50, 95% CI: 1.15‐1.95 in 20072009) or practiced in an urban area (largest vs smallest MSA: OR: 3.34, 95% CI: 2.72‐4.09 in 20012003; OR: 2.22, 95% CI: 1.82‐2.71 in 20072009). Although the longest‐practicing PCPs were most likely to use hospitalists in the early 2000s, this effect disappeared by 2007 to 2009 (most vs least years in practice: OR: 1.35, 95% CI: 1.06‐1.72 in 20012003 vs OR: 0.92, 95% CI: 0.73‐1.17 in 20072009).
| PCP Characteristics | 20012003, OR (95% CI) | 20042006, OR (95% CI) | 20072009, OR (95% CI) |
|---|---|---|---|
| |||
| Family practicea vs. internal medicineb | 1.46 (1.251.72) | 1.50 (1.281.76) | 1.46 (1.251.70) |
| Female vs male | 1.91 (1.462.50) | 1.43 (1.091.86) | 1.50 (1.151.95) |
| United States trained (yes vs no) | 1.42 (1.191.69) | 1.53 (1.281.81) | 1.46 (1.231.73) |
| Metropolitan statistical area | |||
| 99,999 or less | 1.00 | 1.00 | 1.00 |
| 100,000249,000 | 0.83 (0.651.05) | 1.00 (0.791.25) | 1.13 (0.901.41) |
| 250,000999,999 | 0.92 (0.721.17) | 1.03 (0.821.31) | 0.98 (0.771.23) |
| 1,000,000 or more | 3.34 (2.724.09) | 2.90 (2.373.54) | 2.22 (1.822.71) |
| Years in practice, 2001 | |||
| Q1 (lowest) | 1.00 | 1.00 | 1.00 |
| Q2 | 0.89 (0.711.12) | 0.83 (0.671.04) | 0.92 (0.741.14) |
| Q3 | 1.06 (0.841.34) | 0.99 (0.791.24) | 1.03 (0.821.29) |
| Q4 | 1.25 (0.991.59) | 1.13 (0.891.42) | 1.15 (0.921.45) |
| Q5 (highest) | 1.35 (1.061.72) | 1.05 (0.831.33) | 0.92 (0.731.17) |
| Total no. of outpatient visitsc | |||
| Q1 (lowest) | 1.00 | 1.00 | 1.00 |
| Q2 | 1.21 (1.121.30) | 1.07 (1.001.14) | 1.13 (1.071.19) |
| Q3 | 1.42 (1.301.54) | 1.18 (1.091.27) | 1.14 (1.071.22) |
| Q4 | 1.34 (1.211.47) | 1.34 (1.231.46) | 1.25 (1.161.35) |
| Q5 (highest) | 1.46 (1.301.63) | 1.33 (1.211.47) | 1.32 (1.201.44) |
| No. of hospitalized patientsc | |||
| Q1 (lowest) | 1.00 | 1.00 | 1.00 |
| Q2 | 1.07 (1.001.15) | 0.91 (0.860.96) | 0.85 (0.810.89) |
| Q3 | 1.00 (0.921.08) | 0.87 (0.820.93) | 0.74 (0.700.79) |
| Q4 | 0.89 (0.810.97) | 0.76 (0.710.82) | 0.62 (0.580.67) |
| Q5 (highest) | 1.05 (0.951.18) | 0.67 (0.610.73) | 0.55 (0.510.60) |
| Average outpatient agec | |||
| Q1 (lowest) | 1.00 | 1.00 | 1.00 |
| Q2 | 0.94 (0.871.01) | 1.15 (1.081.23) | 1.18 (1.111.25) |
| Q3 | 0.82 (0.760.90) | 1.05 (0.971.13) | 1.17 (1.091.25) |
| Q4 | 0.71 (0.650.79) | 1.03 (0.951.12) | 1.10 (1.021.19) |
| Q5 (highest) | 0.72 (0.640.81) | 1.12 (1.011.23) | 1.15 (1.051.26) |
| Average outpatient gender (% male)c | |||
| Q1 (lowest) | 1.00 | 1.00 | 1.00 |
| Q2 | 1.10 (1.021.18) | 1.19 (1.101.27) | 1.27 (1.181.37) |
| Q3 | 1.12 (1.031.22) | 1.27 (1.171.37) | 1.43 (1.321.54) |
| Q4 | 1.36 (1.251.48) | 1.49 (1.371.61) | 1.52 (1.401.65) |
| Q5 (highest) | 1.47 (1.341.61) | 1.84 (1.682.00) | 1.68 (1.541.83) |
| Average outpatient race (% white)c | |||
| Q1 (lowest) | 1.00 | 1.00 | 1.00 |
| Q2 | 1.08 (0.981.20) | 1.01 (0.921.10) | 1.23 (1.131.34) |
| Q3 | 1.27 (1.131.43) | 1.06 (0.951.18) | 1.21 (1.091.34) |
| Q4 | 1.47 (1.291.67) | 0.97 (0.861.09) | 1.33 (1.181.48) |
| Q5 (highest) | 1.39 (1.211.59) | 1.18 (1.041.34) | 1.25 (1.101.42) |
| Average outpatient comorbidityc | |||
| Q1 (lowest) | 1.00 | 1.00 | 1.00 |
| Q2 | 1.26 (1.191.35) | 1.23 (1.161.31) | 1.22 (1.141.30) |
| Q3 | 1.62 (1.491.75) | 1.61 (1.501.72) | 1.43 (1.341.54) |
| Q4 | 1.96 (1.792.15) | 1.86 (1.722.02) | 1.59 (1.471.72) |
| Q5 (highest) | 1.79 (1.592.01) | 2.20 (2.002.41) | 2.03 (1.852.22) |
In terms of PCP workload, patients of PCPs with high outpatient activity were more likely to receive hospitalists care throughout the study period, although the association had decreased by 2007 to 2009 (highest vs lowest outpatient volume: OR: 1.46, 95% CI: 1.30‐1.63 in 20012003 vs OR: 1.32, 95% CI: 1.20‐1.44 in 20072009). In contrast, PCPs with the lowest inpatient volumes became more likely to use hospitalists by the end of the study period (highest vs lowest inpatient volume: OR: 1.05, 95% CI: 0.95‐1.18 in 20012003 vs OR: 0.55, 95% CI: 0.51‐0.60 in 20072009).
The characteristics of PCPs' practice panels also were associated with patients' likelihood of receiving care from hospitalists. PCPs whose practice panels consisted of patients who were predominantly male, white, or with more outpatient comorbidities were consistently more likely to use hospitalists throughout the study period. PCPs with older patient panels were less likely to use hospitalists in 2001 to 2003, but by 2007 to 2009, they were slightly more likely to do so (oldest vs youngest average outpatient panel age: OR: 0.72, 95% CI: 0.64‐0.81 in 20012003 vs OR: 1.15, 95% CI: 1.05‐1.26 in 20072009).
CONCLUSIONS
Prior studies of the hospitalist model have shown that the likelihood of a patient receiving inpatient care from hospitalists is associated with patient characteristics, hospital characteristics, geographic region, and type of admission.[1, 16, 17] We found that PCP characteristics also predict whether patients receive care from hospitalists and that their use of hospitalists developed dynamically between 2001 to 2009. Although many factors (such as whether patients were admitted to a hospital where their PCP had admitting privileges) can influence the decision to use hospitalists, we found that over one‐third of the variance in whether a hospitalized patient received care from a hospitalist is explained by which PCP the patient saw. In showing that systemic differences exist among PCPs who use hospitalists and those who do not, our study suggests that future research on the hospitalist model should, if possible, adjust for PCP characteristics in addition to hospital and patient factors.
Although this study identifies the existence and magnitude of differences in whether or not PCPs use hospitalists, it cannot explain why the differences exist. We only can offer hypotheses. For example, our finding that PCPs with the most years of practice experience were more likely to use hospitalists in the early 2000s but not in more recent years suggests that in hospital medicine's early years, long‐practicing generalist physicians were choosing between practicing traditionalist medicine and adopting the hospitalists model, but by 2009, experienced generalist physicians had already specialized to either inpatient or outpatient settings earlier in their careers. On the other hand, the decreasing odds of urban PCPs using hospitalists may reflect a relative growth in hospitalist use in less populated areas rather than a change in urban PCPs' practice patterns.
PCPs trained in family medicine have reported less inpatient training and less comfort with providing hospital care,[18, 19] thus it is unsurprising that family physicians were more likely to refer patients to hospitalists. Although a recent study reported that family physicians' inpatient volumes remained constant, whereas those of outpatient internists declined between 2003 and 2012, the analysis used University Health Consortium data and thus reflects practice patterns in academic medical centers.[20] Our data suggest that outside of academia, family physicians have embraced the hospitalists as clinical partners.
Meltzer and Chung had previously proposed an economic model to describe the growing use of hospitalists in the United States. They posited that decisions to adopt the hospitalist model are governed by trade‐offs between coordination costs (eg, time and effort spent coordinating multiple providers across different settings) and switching costs (eg, time spent traveling between the office and the hospital or the effort of adjusting to different work settings).[16] The authors hypothesized that empirical testing of this model would show PCPs are more likely to use hospitalists if they have less available professional time (ie, work fewer hours per week), are female (due to competing demands from domestic responsibilities), have relatively few hospitalized patients, or live in areas with high traffic congestion. Our findings provide empirical evidence to support their division‐of‐labor model in showing that patients were more likely to receive hospitalist care if their PCP was female, practiced in an urban location, had higher outpatient practice volumes, or had lower inpatient volumes.
At first glance, some of our findings appear to contradict our earlier study, which showed that younger, black, male patients are more likely to receive inpatient care from hospitalists.[1] However, that study included patients regardless of whether they had a PCP. This study shows that when patients have a PCP, their PCPs are more likely to refer them to hospitalists if they are older, white, male, and have more comorbid conditions. A potential explanation for this finding is that PCPs may preferentially use hospitalists when caring for older and sicker hospitalized patients. For example, commentators often cite hospitalists' constant availability in the hospital as a valuable resource when caring for acutely ill patients.[21, 22]
Another potential explanation is that despite their preferences, PCPs who care for younger, minority patients lack access to hospitalist services. One large study of Medicare beneficiaries reported that physicians who care for black patients are less well‐trained clinically and often lack access to important clinical resources such as diagnostic imaging and nonemergency hospital admissions.[23] Similarly, international medical graduates are more likely than their US‐trained counterparts to care for underserved patients and to practice in small, independent offices.[24, 25, 26] As hospitalist groups often rely on cross‐subsidization from sources within a large healthcare organization, independent PCPs may have less access to their services when compared with PCPs in managed care organizations or large integrated groups. Viewed in this context, our findings imply that although hospitalists often care for socioeconomically vulnerable patients (eg, younger, uninsured, black men) who lack access to primary care services,[1] they also appear to share care responsibilities for more complex hospitalized patients with PCPs in more affluent communities. Further research may determine if the availability of hospitalists influences racial disparities in hospital care.
Our study has limitations. It is an observational study and thus subject to bias and confounding. As our cohort was formed using fee‐for‐service Medicare data in a single, large state, it may not be generalizable to PCPs who practice in other states, who care for a younger population, or who do not accept Medicare. Our findings also may not reflect the practice patterns of physicians‐in‐training, PCP populations with high board‐certification rates, those employed in temporary positions, or those who interrupt their practices for personal reasons, as we restricted our study to established PCPs who had been in practice long and consistently enough to be associated with 20 hospitalized patients during every year of the study. For example, the lower proportion of female PCPs in our cohort (15.6% in our study in 2009 vs 27.5% reported in a nationally representative 2008 survey[27]) may be explained by our exclusion of women who take prolonged time off for childcare duties. We also did not establish whether patient outcomes or healthcare costs differ between PCPs who adopted the hospitalist model and traditionalists. Finally, we could not examine the effect of a number of PCP factors that could plausibly influence whether or not PCPs relinquish inpatient care to hospitalists, such as their comfort with providing inpatient care, having hospital admitting privileges, having office‐based access to hospitals' electronic medical records, or the distance between their office and the hospital. However, this study lays the groundwork for future studies to explore these factors.
In summary, this study is the first, to our knowledge, to characterize PCPs who relinquished inpatient responsibilities to hospitalists. Our findings suggest that some groups of PCPs are more likely to refer patient to hospitalists, that the relationship between hospitalists and PCPs has evolved over time, and that the hospitalist model still has ample room to grow.
ACKNOWLEDGMENTS
Disclosures: This study was supported by grants from the National Institute on Aging (1RO1‐AG033134 and P30‐AG024832) and the National Cancer Institute (K05‐CA124923). The authors have no financial conflicts of interest to disclose. An oral abstract of this article was presented on May 18, 2013 at the Society of Hospital Medicine Annual Meeting in National Harbor, Maryland.
- , , , . Growth in the care of older patients by hospitalists in the United States. N Engl J Med. 2009;360(11):1102–1112.
- , . Effect of hospitalists on length of stay in the medicare population: variation according to hospital and patient characteristics. J Am Geriatr Soc. 2010;58(9):1649–1657.
- , , , , , . Outcomes of care by hospitalists, general internists, and family physicians. N Engl J Med. 2007;357(25):2589–2600.
- , , , , . Hospitalist care and length of stay in patients requiring complex discharge planning and close clinical monitoring. Arch Intern Med. 2007;167(17):1869–1874.
- , . The impact of hospitalists on the cost and quality of inpatient care in the United States: a research synthesis. Med Care Res Rev. 2005;62(4):379–406.
- , . Association of hospitalist care with medical utilization after discharge: evidence of cost shift from a cohort study. Ann Intern Med. 2011;155(3):152–159.
- , . Hospital care and medical utilization after discharge. Ann Intern Med. 2011;155(10):719–720; author reply 722.
- . Hospital care and medical utilization after discharge. Ann Intern Med. 2011;155(10):721; author reply 722.
- , , , , , . Administrative data algorithms can describe ambulatory physician utilization. Health Serv Res. 2007;42:1783–1796.
- , . Estimating the reliability of continuous measures with Cronbach's alpha or the intraclass correlation coefficient: toward the integration of two traditions. J Clin Epidemiol. 1991;44(4–5):381–390.
- , , . Ability of Medicare claims data to identify nursing home patients: a validation study. Med Care. 2008;46(11):1184–1187.
- , , , . Comorbidity measures for use with administrative data. Med Care. 1998;36(1):8–27.
- , , . A SAS procedure based on mixture models for estimating developmental trajectories. Sociol Methods Res. 2001;29(3):374–393.
- . Group‐Based Modeling of Development. Cambridge, MA: Harvard University Press; 2005.
- , . Group‐based trajectory modeling in clinical research. Annu Rev Clin Psychol. 2010;6:109–138.
- , . Coordination, switching costs and the division of labor in general medicine: an economic explanation for the emergence of hospitalists in the United States. National Bureau of Economic Research Working Paper Series No. 16040. Cambridge, MA: National Bureau of Economic Research; 2010.
- , , , , , . Continuity of outpatient and inpatient care by primary care physicians for hospitalized older adults. JAMA. 2009;301(16):1671–1680.
- . Hospitalists and family physicians: understanding opportunities and risks. J Fam Pract. 2004;53(6):473–481.
- , , , , , . Preparedness of internal medicine and family practice residents for treating common conditions. JAMA. 2002;288(20):2609–2614.
- , , , . The status of adult inpatient care by family physicians at US academic medical centers and affiliated teaching hospitals 2003 to 2012: the impact of the hospitalist movement. Fam Med. 2014;46(2):94–99.
- . Hospitalists and the hospital medicine system of care are good for patient care. Arch Intern Med. 2008;168(12):1254–1256; discussion 1259–1260.
- . Hospitalists in the United States—mission accomplished or work in progress? N Engl J Med. 2004;350(19):1935–1936.
- , , , , . Primary care physicians who treat blacks and whites. N Engl J Med. 2004;351(6):575–584.
- , , , . International medical graduates and the primary care workforce for rural underserved areas. Health Aff (Millwood). 2003;22(2):255–262.
- , , . Medical migration and the physician workforce. International medical graduates and American medicine. JAMA. 1995;273(19):1521–1527.
- , , , , . International medical graduates in family medicine in the United States of America: an exploration of professional characteristics and attitudes. Hum Resour Health. 2006;4:17.
- , , . A snapshot of U.S. physicians: key findings from the 2008 Health Tracking Physician Survey. Data Bull (Cent Stud Health Syst Change). 2009(35):1–11.
Although primary care physicians (PCPs) have traditionally treated patients in both ambulatory and hospital settings, many relinquished inpatient duties to hospitalists in recent decades.[1] Little is known about the PCPs who relinquished inpatient care duties or how the transition to the hospitalist model occurred. For example, what are the characteristics of PCPs who change? Do PCPs adopt the hospitalist model enthusiastically or cautiously? Characterizing PCPs who adopted the hospitalist model can help hospitalists understand their specialty's history and also inform health services research.
Much of the interest in the hospitalist model has been generated by studies reporting improved outcomes and lower hospital lengths of stay associated with hospitalist care.[2, 3, 4, 5] Conversely, detractors of the model point to reports of higher postacute care utilization among hospitalist patients.[6] Although these studies usually adjusted for differences among patients and hospitals, they did not account for PCP characteristics. As patients' access to PCPs and their PCP's capabilities are both plausible factors that could influence hospital length of stay (eg, decisions to complete more or less of a workup in the hospital), quality of care transitions, and postdischarge utilization, it is important to determine if PCPs who use hospitalists differ systematically from those who do not to correctly interpret health system utilization patterns that currently are attributed only to hospitalists.[7, 8]
We conducted this study to determine if observable PCP factors are associated with patients' use of hospitalists and to describe the trajectory by which PCPs referred their patients to hospitalists over time.
METHODS
Source of Data
We used claims data from 100% of Texas Medicare beneficiaries from 2000 to 2009, including Medicare beneficiary summary files, Medicare Provider Analysis and Review (MedPAR) files, Outpatient Standard Analytical Files (OutSAF), and Medicare Carrier files. Diagnosis related group (DRG)‐associated information, including weights, and Major Diagnostic Categories, were obtained from Centers for Medicare & Medicaid Services (
Establishment of the Study Cohort
Using the MedPAR file, we first selected hospital admissions from acute care hospitals in Texas for each year of the study period. We excluded beneficiaries younger than 66 years old, with incomplete Medicare Parts A and B enrollment, or with any health maintenance organization enrollment in the 12 months prior to the admission of interest. For patients with more than 1 admission in a given year, we randomly selected 1 admission. We then attempted to assign each patient to a PCP. We defined a PCP as a generalist (general practitioner, family physician, internist, or geriatrician) who saw a given beneficiary on 3 or more occasions in an outpatient setting in the year prior to the admission of interest.[9] We identified outpatient visits using Current Procedural Terminology (CPT) codes 99201 to 99205 (new patient encounters), and 99211 to 99215 (established patient encounters) from Carrier files. If more than 1 generalist physician saw the beneficiary on 3 or more occasions in a given year, the physician with more than 75% of the total outpatient evaluation and management (E&M) billings was classified as the beneficiary's PCP. Using these criteria, approximately 66% of patients were assigned to a PCP.
For cross‐sectional analyses, we restricted our cohort to beneficiaries whose PCPs were associated with at least 20 inpatients in a given year. To study trends in PCP practice patterns over time, we further restricted the cohort to beneficiaries whose PCPs were associated with at least 20 inpatients in every year of the study period, resulting in 1172 PCPs for the trajectory analyses. The reliability of PCPs' practice profiles increases as the number of patients in their panel increases. We chose 20 inpatients as the minimum because PCPs with 20 hospitalized patients per study year would achieve a reliability of 0.9 for estimating the proportion of their patients that received care from hospitalists.[10]
Identification of Hospitalists
We defined hospitalists as generalists who had at least 100 E&M billings in a given year and generated at least 90% of their total E&M billings in the year from inpatient services.[1] Inpatient E&M billings were identified by CPT codes 99221 to 99223 (new or established patient encounters), 99231 to 99233 (subsequent hospital care), and 99251 to 99255 (inpatient consultations).[1]
Patient Measures
Patient demographic information including, age at admission, gender, race/ethnicity, and Medicaid eligibility were obtained from Medicare beneficiary summary files. We used the Medicaid indicator as a proxy for low socioeconomic status. Information on weekday versus weekend admission, emergent admission, and DRG were obtained from MedPAR files. The DRG category (circulatory system, digestive system, infectious disease, nervous system, respiratory system, or other) was determined based on its Major Diagnostic Category. We determined residence in a nursing facility in the 3 months before the admission of interest from the MedPAR files and by E&M codes 99304 to 99318 (nursing facility services) from Carrier files.[11] Comorbidities were identified using the claims from MedPAR, Carrier, and OutSAF files in the year prior to the admission of interest.[12] Total hospitalizations and outpatient visits in the prior year were identified from MedPAR files and Carrier files, respectively.
PCP Measures
We categorized PCPs by specialty (general practice, gamily practice, geriatric medicine, or internal medicine), years in practice, gender, US‐ versus foreign‐trained, metropolitan statistical area (MSA) of their practice location, and board certification status. The specialty was identified from Carrier files and the other information from AMA data. For each PCP, the total number of outpatient visits and total number of patients seen as outpatients in each year was calculated based on E&M codes (9920199205, 9921199215) from Carrier files. For each year, we computed the average outpatient age, gender, race, and outpatient comorbidity for each PCP's patient panel. We computed hospital volumes using the number of hospitalized patients associated with each PCP in the study cohort.
Study Outcome
To determine whether hospitalized patients received care from hospitalists during a given hospitalization, we identified all inpatient E&M bills from generalist physicians during the admission of interest by linking MedPAR and Carrier files. If more than 50% of the generalist inpatient E&M billings from generalist physicians were from 1 or more hospitalists, the patient was considered to have received care from hospitalists.
Statistical Analyses
Multilevel analyses were used to account for the clustering of patients within PCPs. All multilevel models were adjusted for patient characteristics including age, race/ethnicity, gender, Medicaid eligibility, emergency admission, weekend admission, DRG weight, DRG category, any nursing home stay in the prior 3 months, number of comorbidities, number of hospitalizations, and number of physician visits in the year prior to the admission of interest. To analyze trends in practice patterns, we first used multilevel models to calculate the proportions of inpatients cared for by hospitalists each year for each of the 1172 PCPs with at least 20 patients. Then we employed an SAS procedure (PROC TRAJ) developed by Jones et al. to classify these PCPs into groups based on their trajectories.[13] This group‐based trajectory modeling allowed us to identify relatively homogeneous clusters within a heterogeneous sample population.[14] We chose a model that classified the PCPs into 4 groups.[15] With 4 groups, the average of the posterior probabilities of group membership for the PCPs assigned to each group exceeded 0.93, indicating a low rate of misclassification among these 4 distinct groups. For the 1172 PCPs, we tested interactions between year of hospitalization and PCP characteristics while adjusting for patient characteristics in order to investigate whether or not the impacts of PCP characteristics on how likely their patients being cared for by hospitalists differed with time. All analyses were performed with SAS version 9.2 (SAS Institute Inc., Cary, NC).
RESULTS
During the 2001 through 2009 study period, between 2252 and 2848 PCPs were associated with at least 20 hospitalized beneficiaries in any single year. Among these, 1172 PCPs were associated with at least 20 hospitalized beneficiaries in every year of the study period. These 1172 PCPs were associated with 608,686 hospitalizations over the 9 years.
Table 1 presents the characteristics of the PCPs who contributed to the cross‐sectional analyses in 2001 (N=2252) and 2009 (N=2387), as well as the 1172 PCPs for whom we had data for all 9 years for the longitudinal analyses. Most PCPs were male, trained in the United States, and were board certified. The average number of Medicare patients seen by these PCPs and number of outpatient Medicare visits went up about 7% between 2001 and 2009.
| PCP Characteristics | Cross‐Sectional Analysis | Trajectory Analysis, 20012009 | |
|---|---|---|---|
| 2001 | 2009 | ||
| |||
| Overall, no. (%) | 2,252 (100%) | 2,387 (100%) | 1,172 (100%) |
| Specialty, no. (%) | |||
| General practice | 39 (1.7%) | 34 (1.4%) | 15 (1.3%) |
| Family practice | 948 (42.1%) | 1,089 (45.6%) | 466 (39.8%) |
| Internal medicine | 1,255 (55.7%) | 1,249 (52.3%) | 688 (58.7%) |
| Geriatrics | 10 (0.4%) | 15 (0.6%) | 3 (0.3%) |
| Gender, no. (%) | |||
| Male | 1,990 (88.4%) | 2,015 (84.4%) | 1,072 (91.5%) |
| Female | 262 (11.6%) | 372 (15.6%) | 100 (8.5%) |
| Trained in the United States, no. (%) | |||
| Yes | 1,669 (74.1%) | 1,738 (72.8%) | 844 (72.0%) |
| No | 583 (25.9%) | 649 (27.2%) | 328 (28.0%) |
| Metropolitan statistical area, no. (%) | |||
| 99,999 or less | 417 (17.5) | 237 (20.2) | |
| 100,000249,000 | 438 (18.3) | 234 (20.0) | |
| 250,000999,999 | 381 (16.0) | 216 (18.4) | |
| 1,000,000 or more | 1,151 (48.2) | 485 (41.4) | |
| Board certification, no. (%) | |||
| Yes | 1,657 (69.4%) | 800 (68.3%) | |
| No | 730 (30.6%) | 372 (31.7%) | |
| Years in practice, 2001, meanSD (Q1Q3) | 22.310.6 (15.028.0) | 21.28.9 (15.027.0) | |
| Years in practice, 2009, meanSD (Q1Q3) | 25.010.2 (17.032.0) | 29.28.9 (23.035.0) | |
| Total no. of Medicare outpatient visits, 2001, meanSD (Q1Q3) | 1,624.8879.2 (1,057.51,970.0) | 1,883.39,48.5 (1,236.52,240.5) | |
| Total no. of Medicare outpatient visits, 2009, meanSD (Q1Q3) | 1,733.81,053.3 (1,080.02,048.0) | 2,020.51,200.9 (1,334.52,373.0) | |
| Total no. of Medicare outpatients, 2001, meanSD (Q1Q3) | 418.6186.9 (284.0522.0) | 473.4189.5 (338.0580.5) | |
| Total no. of Medicare outpatients, 2009, meanSD (Q1Q3) | 448.7217.8 (300.0548.0) | 508.7238.2 (350.5615.0) | |
| No. of hospitalized patients, 2001, meanSD (Q1Q3) | 46.025.0 (27.057.0) | 53.028.0 (32.066.0) | |
| No. of hospitalized patients, 2009, meanSD (Q1Q3) | 44.024.0 (26.052.0) | 52.027.0 (33.065.0) | |
| Average outpatient age, 2001, meanSD (Q1Q3) | 72.82.3 (71.574.2) | 72.82.1 (71.774.1) | |
| Average outpatient age, 2009, meanSD (Q1Q3) | 72.12.8 (70.673.9) | 72.82.7 (71.474.5) | |
| Average outpatient gender (% male), 2001, meanSD (Q1Q3) | 38.17.0 (35.542.3) | 38.56.4 (36.242.3) | |
| Average outpatient gender (% male), 2009, meanSD (Q1Q3) | 40.27.6 (37.644.8) | 41.06.5 (38.644.8) | |
| Average outpatient race (% white), 2001, meanSD (Q1Q3) | 84.316.4 (79.295.5) | 85.414.3 (79.995.7) | |
| Average outpatient race (% white), 2009, meanSD (Q1Q3) | 85.214.4 (79.895.2) | 86.312.9 (80.895.6) | |
| Average outpatient comorbidity, 2001, meanSD (Q1Q3)a | 1.60.5 (1.21.8) | 1.60.4 (1.21.8) | |
| Average outpatient comorbidity, 2009, meanSD (Q1Q3)a | 2.20.6 (1.82.5) | 2.20.6 (1.72.5) | |
Figure 1 graphs the percentage of PCPs as a function of what percent of their hospitalized patients received care from hospitalists, and how that changed from 2001 to 2009. For 70.9% of PCPs, fewer than 5% of their hospitalized patients received hospitalist care in 2001. By 2009, the percent of PCPs in this category had decreased to 15.2%. In contrast, in 2001, more than half of the patients for 2.1% of PCPs received hospitalist care, and the percent of PCPs in this category increased to 26.3% by 2009.
The pattern in Figure 1 shows that PCPs' use of hospitalists changed continuously and gradually over time. However, this pattern describes the PCPs as a group. When examined at the individual PCP level, different patterns emerge. Figure 2, which presents selected individual PCP's use of hospitalists over time, shows several distinct subpatterns of PCP practice behaviors. First, there are PCPs whose use of hospitalists was high in 2001 and stayed high or increased over time (eg, PCP A). There also were PCPs whose use of hospitalists stayed low over the entire study period (eg, PCP B). Finally, there were PCPs whose use of hospitalists was low in 2001 but high in 2009 (eg, PCP C). For this last group, the pattern of change in hospitalist utilization over time was discontinuous; that is, most of the increase occurred over a 1‐ or 2‐year period, instead of increasing gradually over time.
Among the 1172 PCPs associated with 20 hospitalized beneficiaries each year in all 9 years of the study period, group‐based trajectory modeling classified their practice patterns into 4 distinct trajectories (Figure 3). Among PCPs in group 1, more than one‐third of their hospitalized patients were cared for by hospitalists in 2001, and this increased to 60% by 2009. PCPs in groups 2 and 3 rarely used hospitalist care in 2001 but increased their use over time. The increase started early in the period for PCPs in group 2 and later for those in group 3. PCPs in group 4 were associated with little hospitalist use throughout the study period.
We constructed a model to describe the odds of a patient receiving care from hospitalists during the study period using patients associated with these 1172 PCPs. After adjusting for patient characteristics, the residual intraclass correlation coefficient for PCP level was 0.334, which indicates that 33.4% of the variance in whether a hospitalized patient received care from a hospitalist is explained by which PCP the patient saw. When adjusting for both patient and PCP characteristics, the overall odds of a patient receiving hospitalist care increased by 30% (95% confidence interval [CI]: 1.29‐1.30) per year from 2001 through 2009.
There were also significant interactions between year of hospitalization and several PCP characteristics. These interactions are illustrated in Table 2, which stratifies each of those PCP characteristics by 3 time periods: 2001 to 2003, 2004 to 2006, and 2007 to 2009. In all time periods, patients were more likely to receive hospitalist care if their PCP was US trained (US vs international medical graduate: odds ratio [OR]: 1.42, 95% CI: 1.19‐1.69 in 20012003; OR: 1.46, 95% CI: 1.23‐1.73 in 20072009), or specialized in family medicine (family medicine vs internal medicine: OR: 1.46, 95% CI: 1.25‐1.72 in 20012003; OR: 1.46, 95% CI: 1.25‐1.70 in 20072009). Over time, the relative odds of a patient receiving care from hospitalists decreased if their PCP was female (female vs male: OR: 1.91, 95% CI: 1.46‐2.50 in 20012003 vs OR: 1.50, 95% CI: 1.15‐1.95 in 20072009) or practiced in an urban area (largest vs smallest MSA: OR: 3.34, 95% CI: 2.72‐4.09 in 20012003; OR: 2.22, 95% CI: 1.82‐2.71 in 20072009). Although the longest‐practicing PCPs were most likely to use hospitalists in the early 2000s, this effect disappeared by 2007 to 2009 (most vs least years in practice: OR: 1.35, 95% CI: 1.06‐1.72 in 20012003 vs OR: 0.92, 95% CI: 0.73‐1.17 in 20072009).
| PCP Characteristics | 20012003, OR (95% CI) | 20042006, OR (95% CI) | 20072009, OR (95% CI) |
|---|---|---|---|
| |||
| Family practicea vs. internal medicineb | 1.46 (1.251.72) | 1.50 (1.281.76) | 1.46 (1.251.70) |
| Female vs male | 1.91 (1.462.50) | 1.43 (1.091.86) | 1.50 (1.151.95) |
| United States trained (yes vs no) | 1.42 (1.191.69) | 1.53 (1.281.81) | 1.46 (1.231.73) |
| Metropolitan statistical area | |||
| 99,999 or less | 1.00 | 1.00 | 1.00 |
| 100,000249,000 | 0.83 (0.651.05) | 1.00 (0.791.25) | 1.13 (0.901.41) |
| 250,000999,999 | 0.92 (0.721.17) | 1.03 (0.821.31) | 0.98 (0.771.23) |
| 1,000,000 or more | 3.34 (2.724.09) | 2.90 (2.373.54) | 2.22 (1.822.71) |
| Years in practice, 2001 | |||
| Q1 (lowest) | 1.00 | 1.00 | 1.00 |
| Q2 | 0.89 (0.711.12) | 0.83 (0.671.04) | 0.92 (0.741.14) |
| Q3 | 1.06 (0.841.34) | 0.99 (0.791.24) | 1.03 (0.821.29) |
| Q4 | 1.25 (0.991.59) | 1.13 (0.891.42) | 1.15 (0.921.45) |
| Q5 (highest) | 1.35 (1.061.72) | 1.05 (0.831.33) | 0.92 (0.731.17) |
| Total no. of outpatient visitsc | |||
| Q1 (lowest) | 1.00 | 1.00 | 1.00 |
| Q2 | 1.21 (1.121.30) | 1.07 (1.001.14) | 1.13 (1.071.19) |
| Q3 | 1.42 (1.301.54) | 1.18 (1.091.27) | 1.14 (1.071.22) |
| Q4 | 1.34 (1.211.47) | 1.34 (1.231.46) | 1.25 (1.161.35) |
| Q5 (highest) | 1.46 (1.301.63) | 1.33 (1.211.47) | 1.32 (1.201.44) |
| No. of hospitalized patientsc | |||
| Q1 (lowest) | 1.00 | 1.00 | 1.00 |
| Q2 | 1.07 (1.001.15) | 0.91 (0.860.96) | 0.85 (0.810.89) |
| Q3 | 1.00 (0.921.08) | 0.87 (0.820.93) | 0.74 (0.700.79) |
| Q4 | 0.89 (0.810.97) | 0.76 (0.710.82) | 0.62 (0.580.67) |
| Q5 (highest) | 1.05 (0.951.18) | 0.67 (0.610.73) | 0.55 (0.510.60) |
| Average outpatient agec | |||
| Q1 (lowest) | 1.00 | 1.00 | 1.00 |
| Q2 | 0.94 (0.871.01) | 1.15 (1.081.23) | 1.18 (1.111.25) |
| Q3 | 0.82 (0.760.90) | 1.05 (0.971.13) | 1.17 (1.091.25) |
| Q4 | 0.71 (0.650.79) | 1.03 (0.951.12) | 1.10 (1.021.19) |
| Q5 (highest) | 0.72 (0.640.81) | 1.12 (1.011.23) | 1.15 (1.051.26) |
| Average outpatient gender (% male)c | |||
| Q1 (lowest) | 1.00 | 1.00 | 1.00 |
| Q2 | 1.10 (1.021.18) | 1.19 (1.101.27) | 1.27 (1.181.37) |
| Q3 | 1.12 (1.031.22) | 1.27 (1.171.37) | 1.43 (1.321.54) |
| Q4 | 1.36 (1.251.48) | 1.49 (1.371.61) | 1.52 (1.401.65) |
| Q5 (highest) | 1.47 (1.341.61) | 1.84 (1.682.00) | 1.68 (1.541.83) |
| Average outpatient race (% white)c | |||
| Q1 (lowest) | 1.00 | 1.00 | 1.00 |
| Q2 | 1.08 (0.981.20) | 1.01 (0.921.10) | 1.23 (1.131.34) |
| Q3 | 1.27 (1.131.43) | 1.06 (0.951.18) | 1.21 (1.091.34) |
| Q4 | 1.47 (1.291.67) | 0.97 (0.861.09) | 1.33 (1.181.48) |
| Q5 (highest) | 1.39 (1.211.59) | 1.18 (1.041.34) | 1.25 (1.101.42) |
| Average outpatient comorbidityc | |||
| Q1 (lowest) | 1.00 | 1.00 | 1.00 |
| Q2 | 1.26 (1.191.35) | 1.23 (1.161.31) | 1.22 (1.141.30) |
| Q3 | 1.62 (1.491.75) | 1.61 (1.501.72) | 1.43 (1.341.54) |
| Q4 | 1.96 (1.792.15) | 1.86 (1.722.02) | 1.59 (1.471.72) |
| Q5 (highest) | 1.79 (1.592.01) | 2.20 (2.002.41) | 2.03 (1.852.22) |
In terms of PCP workload, patients of PCPs with high outpatient activity were more likely to receive hospitalists care throughout the study period, although the association had decreased by 2007 to 2009 (highest vs lowest outpatient volume: OR: 1.46, 95% CI: 1.30‐1.63 in 20012003 vs OR: 1.32, 95% CI: 1.20‐1.44 in 20072009). In contrast, PCPs with the lowest inpatient volumes became more likely to use hospitalists by the end of the study period (highest vs lowest inpatient volume: OR: 1.05, 95% CI: 0.95‐1.18 in 20012003 vs OR: 0.55, 95% CI: 0.51‐0.60 in 20072009).
The characteristics of PCPs' practice panels also were associated with patients' likelihood of receiving care from hospitalists. PCPs whose practice panels consisted of patients who were predominantly male, white, or with more outpatient comorbidities were consistently more likely to use hospitalists throughout the study period. PCPs with older patient panels were less likely to use hospitalists in 2001 to 2003, but by 2007 to 2009, they were slightly more likely to do so (oldest vs youngest average outpatient panel age: OR: 0.72, 95% CI: 0.64‐0.81 in 20012003 vs OR: 1.15, 95% CI: 1.05‐1.26 in 20072009).
CONCLUSIONS
Prior studies of the hospitalist model have shown that the likelihood of a patient receiving inpatient care from hospitalists is associated with patient characteristics, hospital characteristics, geographic region, and type of admission.[1, 16, 17] We found that PCP characteristics also predict whether patients receive care from hospitalists and that their use of hospitalists developed dynamically between 2001 to 2009. Although many factors (such as whether patients were admitted to a hospital where their PCP had admitting privileges) can influence the decision to use hospitalists, we found that over one‐third of the variance in whether a hospitalized patient received care from a hospitalist is explained by which PCP the patient saw. In showing that systemic differences exist among PCPs who use hospitalists and those who do not, our study suggests that future research on the hospitalist model should, if possible, adjust for PCP characteristics in addition to hospital and patient factors.
Although this study identifies the existence and magnitude of differences in whether or not PCPs use hospitalists, it cannot explain why the differences exist. We only can offer hypotheses. For example, our finding that PCPs with the most years of practice experience were more likely to use hospitalists in the early 2000s but not in more recent years suggests that in hospital medicine's early years, long‐practicing generalist physicians were choosing between practicing traditionalist medicine and adopting the hospitalists model, but by 2009, experienced generalist physicians had already specialized to either inpatient or outpatient settings earlier in their careers. On the other hand, the decreasing odds of urban PCPs using hospitalists may reflect a relative growth in hospitalist use in less populated areas rather than a change in urban PCPs' practice patterns.
PCPs trained in family medicine have reported less inpatient training and less comfort with providing hospital care,[18, 19] thus it is unsurprising that family physicians were more likely to refer patients to hospitalists. Although a recent study reported that family physicians' inpatient volumes remained constant, whereas those of outpatient internists declined between 2003 and 2012, the analysis used University Health Consortium data and thus reflects practice patterns in academic medical centers.[20] Our data suggest that outside of academia, family physicians have embraced the hospitalists as clinical partners.
Meltzer and Chung had previously proposed an economic model to describe the growing use of hospitalists in the United States. They posited that decisions to adopt the hospitalist model are governed by trade‐offs between coordination costs (eg, time and effort spent coordinating multiple providers across different settings) and switching costs (eg, time spent traveling between the office and the hospital or the effort of adjusting to different work settings).[16] The authors hypothesized that empirical testing of this model would show PCPs are more likely to use hospitalists if they have less available professional time (ie, work fewer hours per week), are female (due to competing demands from domestic responsibilities), have relatively few hospitalized patients, or live in areas with high traffic congestion. Our findings provide empirical evidence to support their division‐of‐labor model in showing that patients were more likely to receive hospitalist care if their PCP was female, practiced in an urban location, had higher outpatient practice volumes, or had lower inpatient volumes.
At first glance, some of our findings appear to contradict our earlier study, which showed that younger, black, male patients are more likely to receive inpatient care from hospitalists.[1] However, that study included patients regardless of whether they had a PCP. This study shows that when patients have a PCP, their PCPs are more likely to refer them to hospitalists if they are older, white, male, and have more comorbid conditions. A potential explanation for this finding is that PCPs may preferentially use hospitalists when caring for older and sicker hospitalized patients. For example, commentators often cite hospitalists' constant availability in the hospital as a valuable resource when caring for acutely ill patients.[21, 22]
Another potential explanation is that despite their preferences, PCPs who care for younger, minority patients lack access to hospitalist services. One large study of Medicare beneficiaries reported that physicians who care for black patients are less well‐trained clinically and often lack access to important clinical resources such as diagnostic imaging and nonemergency hospital admissions.[23] Similarly, international medical graduates are more likely than their US‐trained counterparts to care for underserved patients and to practice in small, independent offices.[24, 25, 26] As hospitalist groups often rely on cross‐subsidization from sources within a large healthcare organization, independent PCPs may have less access to their services when compared with PCPs in managed care organizations or large integrated groups. Viewed in this context, our findings imply that although hospitalists often care for socioeconomically vulnerable patients (eg, younger, uninsured, black men) who lack access to primary care services,[1] they also appear to share care responsibilities for more complex hospitalized patients with PCPs in more affluent communities. Further research may determine if the availability of hospitalists influences racial disparities in hospital care.
Our study has limitations. It is an observational study and thus subject to bias and confounding. As our cohort was formed using fee‐for‐service Medicare data in a single, large state, it may not be generalizable to PCPs who practice in other states, who care for a younger population, or who do not accept Medicare. Our findings also may not reflect the practice patterns of physicians‐in‐training, PCP populations with high board‐certification rates, those employed in temporary positions, or those who interrupt their practices for personal reasons, as we restricted our study to established PCPs who had been in practice long and consistently enough to be associated with 20 hospitalized patients during every year of the study. For example, the lower proportion of female PCPs in our cohort (15.6% in our study in 2009 vs 27.5% reported in a nationally representative 2008 survey[27]) may be explained by our exclusion of women who take prolonged time off for childcare duties. We also did not establish whether patient outcomes or healthcare costs differ between PCPs who adopted the hospitalist model and traditionalists. Finally, we could not examine the effect of a number of PCP factors that could plausibly influence whether or not PCPs relinquish inpatient care to hospitalists, such as their comfort with providing inpatient care, having hospital admitting privileges, having office‐based access to hospitals' electronic medical records, or the distance between their office and the hospital. However, this study lays the groundwork for future studies to explore these factors.
In summary, this study is the first, to our knowledge, to characterize PCPs who relinquished inpatient responsibilities to hospitalists. Our findings suggest that some groups of PCPs are more likely to refer patient to hospitalists, that the relationship between hospitalists and PCPs has evolved over time, and that the hospitalist model still has ample room to grow.
ACKNOWLEDGMENTS
Disclosures: This study was supported by grants from the National Institute on Aging (1RO1‐AG033134 and P30‐AG024832) and the National Cancer Institute (K05‐CA124923). The authors have no financial conflicts of interest to disclose. An oral abstract of this article was presented on May 18, 2013 at the Society of Hospital Medicine Annual Meeting in National Harbor, Maryland.
- , , , . Growth in the care of older patients by hospitalists in the United States. N Engl J Med. 2009;360(11):1102–1112.
- , . Effect of hospitalists on length of stay in the medicare population: variation according to hospital and patient characteristics. J Am Geriatr Soc. 2010;58(9):1649–1657.
- , , , , , . Outcomes of care by hospitalists, general internists, and family physicians. N Engl J Med. 2007;357(25):2589–2600.
- , , , , . Hospitalist care and length of stay in patients requiring complex discharge planning and close clinical monitoring. Arch Intern Med. 2007;167(17):1869–1874.
- , . The impact of hospitalists on the cost and quality of inpatient care in the United States: a research synthesis. Med Care Res Rev. 2005;62(4):379–406.
- , . Association of hospitalist care with medical utilization after discharge: evidence of cost shift from a cohort study. Ann Intern Med. 2011;155(3):152–159.
- , . Hospital care and medical utilization after discharge. Ann Intern Med. 2011;155(10):719–720; author reply 722.
- . Hospital care and medical utilization after discharge. Ann Intern Med. 2011;155(10):721; author reply 722.
- , , , , , . Administrative data algorithms can describe ambulatory physician utilization. Health Serv Res. 2007;42:1783–1796.
- , . Estimating the reliability of continuous measures with Cronbach's alpha or the intraclass correlation coefficient: toward the integration of two traditions. J Clin Epidemiol. 1991;44(4–5):381–390.
- , , . Ability of Medicare claims data to identify nursing home patients: a validation study. Med Care. 2008;46(11):1184–1187.
- , , , . Comorbidity measures for use with administrative data. Med Care. 1998;36(1):8–27.
- , , . A SAS procedure based on mixture models for estimating developmental trajectories. Sociol Methods Res. 2001;29(3):374–393.
- . Group‐Based Modeling of Development. Cambridge, MA: Harvard University Press; 2005.
- , . Group‐based trajectory modeling in clinical research. Annu Rev Clin Psychol. 2010;6:109–138.
- , . Coordination, switching costs and the division of labor in general medicine: an economic explanation for the emergence of hospitalists in the United States. National Bureau of Economic Research Working Paper Series No. 16040. Cambridge, MA: National Bureau of Economic Research; 2010.
- , , , , , . Continuity of outpatient and inpatient care by primary care physicians for hospitalized older adults. JAMA. 2009;301(16):1671–1680.
- . Hospitalists and family physicians: understanding opportunities and risks. J Fam Pract. 2004;53(6):473–481.
- , , , , , . Preparedness of internal medicine and family practice residents for treating common conditions. JAMA. 2002;288(20):2609–2614.
- , , , . The status of adult inpatient care by family physicians at US academic medical centers and affiliated teaching hospitals 2003 to 2012: the impact of the hospitalist movement. Fam Med. 2014;46(2):94–99.
- . Hospitalists and the hospital medicine system of care are good for patient care. Arch Intern Med. 2008;168(12):1254–1256; discussion 1259–1260.
- . Hospitalists in the United States—mission accomplished or work in progress? N Engl J Med. 2004;350(19):1935–1936.
- , , , , . Primary care physicians who treat blacks and whites. N Engl J Med. 2004;351(6):575–584.
- , , , . International medical graduates and the primary care workforce for rural underserved areas. Health Aff (Millwood). 2003;22(2):255–262.
- , , . Medical migration and the physician workforce. International medical graduates and American medicine. JAMA. 1995;273(19):1521–1527.
- , , , , . International medical graduates in family medicine in the United States of America: an exploration of professional characteristics and attitudes. Hum Resour Health. 2006;4:17.
- , , . A snapshot of U.S. physicians: key findings from the 2008 Health Tracking Physician Survey. Data Bull (Cent Stud Health Syst Change). 2009(35):1–11.
© 2015 Society of Hospital Medicine

Successfully Promoted Academic Hospitalists
The growth of academic hospital medicine has been driven by multiple factors including expanding clinical needs, housestaff duty hours' limitations, and an increasing focus on quality and patient safety.1 Hospitalists at academic medical centers frequently assume roles that differ substantially from traditional faculty positions. Academic hospitalists may have predominantly clinical positions, and may be involved in quality improvement and patient safety projects.24 Because of these commitments, many academic hospitalists spend less time on research or educational efforts.1, 5 Many have raised concerns that these unique job descriptions might lead to less time to devote to scholarship and academic pursuits, and consequently greater challenges in the promotions process.2, 5
There are little published data on promotion and tenure in academics, and even less specifically focused on the promotion of hospitalists. Theoretically, promotion should recognize an individual's contribution to his or her institution and field. However, each institution has unique criteria though which faculty achieve promotion. Previous articles addressing specific groups, such as part‐time,6 clinical faculty,79 or clinician‐educators10 may be relevant to hospitalists, as hospitalists may be more likely to fall into these categories. These reports suggest general agreement that promotion committees should consider and weigh clinical and educational work (in addition to scholarly publications) in the promotions process, but assessment methods vary across institutions and the contribution of activities, such as quality improvement, remain unclear. The educator's portfolio has gained momentum as a way to document valued teaching in many institutions,11, 12 but academic hospitalist participation in education may be limited.13
Literature related to the development of Divisions of General Internal Medicine is relevant insofar as similar concerns for promotion were expressed with the growth of their faculty.14, 15 However, its applicability may be limited by differences between roles of hospitalists and more traditional general medicine faculty.
To better understand the factors influencing promotion for academic hospitalists, the Society of General Internal Medicine (SGIM) Academic Hospitalist Task Force (AHTF) undertook a survey of promoted hospitalists who had successfully reached the rank of Associate Professor or higher.
Methods
Development of the Survey
The AHTF is a group of 18 academic hospitalists representing 15 institutions. Draft survey questions were developed by the group and sent to its members for refinement based on group consensus. Three cycles of refinement were performed, and the final survey (Appendix) was converted into an electronic format distributed through SurveyMonkey (SurveyMonkey.com, Portland, OR).
Identification of Survey Recipients
We identified a convenience sample of hospitalists who had been promoted to Associate or Full Professor of Medicine by querying members of the AHTF, the Society of Hospital Medicine (SHM) Academic Committee, and colleagues of academic medical centers with established hospitalist programs. We identified 33 promoted hospitalists.
Each recipient received an email from the AHTF cochairs in January 2009 asking them to complete the survey. If a response was not received in three weeks, a second email was sent. If a response was again not received, an AHTF task‐force member who knew the recipient asked him or her to complete the survey. All responses were received by March 2009.
Data Analysis
We examined responses using descriptive measures. Responses were analyzed across all respondents, as well as between these two subgroups. Statistical analysis with Fisher's exact test was performed using Stata 9.0 (StataCorp, College Station, TX).
Results
Of the 33 hospitalists who received the survey, 26 responded (response rate of 79%). Of these, 25 completed the survey in its entirely and were included in our analysis; 1 did not submit details regarding specific promotion‐related activities. General information regarding the respondents and their programs at the time of their promotion is contained in Table 1.
| |
| No. of institutions represented | 20 |
| Program age | 5.7 years (range 110) |
| Size of hospitalist program at the time of promotion | 10 (range 128) |
| Size of hospitalist program currently | 25 (range 745) |
| Programs that were separate divisions at the time of respondent promotion | 4 (20%) |
| Programs that are now separate divisions | 8 (40%) |
| Programs with 1‐track* promotion system | 2 (10%) |
| Programs with 2‐track promotion system | 8 (40%) |
| Programs with 3‐track promotion system | 9 (45%) |
| Other type of promotion system | 1 (5%) |
| Tenure track* | 8 (32%) |
| Institutions with tenure and promotion criteria that explicitly recognized hospitalist work | 8 (40%) |
The seven nonrespondents were from seven different institutions; however two of these institutions were represented by respondents. One nonrespondent had achieved a rank of Professor (through general medicine); the rest had been promoted to Associate Professor. One nonrespondent is known by the authors to hold a research position.
Ten respondents identified themselves as clinician‐educators (40%), ten as clinician‐administrators (40%), and five as clinician‐researchers (20%). Seventeen (68%) of the promoted hospitalists were not on a tenure track (as defined by them); they were more likely to have administrative or educational roles than a research appointment. Though the majority of self‐identified researchers were among the earliest to have been promoted, there were no statistically significant differences in self‐defined job description between more and less recently promoted hospitalists.
Promoted hospitalists were involved in a diverse range of activities which supported their promotion, including service (eg, institutional committees), education, research, and quality improvement. Nearly all hospitalists surveyed listed teaching and educational activities, and almost all had disseminated scholarly output and some degree of grant funding. Table 2 lists the specific activities in which respondents reported being engaged in each of these domains.
| Activity | Percent of Respondents Engaged in Activity |
|---|---|
| Service | |
| School of Medicine | 56 |
| Department of Medicine | 84 |
| Hospital | 80 |
| Professional societies | 92 |
| Administration | 67 |
| Education | |
| Medical student | 72 |
| Housestaff lectures | 84 |
| Ward/consult attending | 96 |
| Clinic precepting | 40 |
| Course director/curriculum development | 80 |
| Program director (or associate) | 36 |
| Research | |
| Peer‐reviewed publications | 92 |
| Abstract/poster presentations | 80 |
| Invited speaker | 96 |
| Reviewer/editor | 80 |
| Study section | 24 |
| Federal grants | 32 |
| Nonfederal grants (internal and external) | 72 |
| Quality improvement/patient safety | |
| Project member | 36 |
| Project leader | 52 |
| Institutional leadership | 32 |
| Curriculum development | 32 |
A range of individuals assisted the respondents in the promotion process. Twenty‐three (92%) respondents identified the individuals who supported their promotion, and all listed more than one person. Respondents most commonly credited their Section or Division Chief (43%) with facilitating their promotion, followed by Departmental Chairs or Vice/Associate Chairs (22%). Mentors (13%) or peers (8%) were also named. Four respondents (17%) named themselves as the person providing most guidance through the promotions process.
No consistent themes regarding obstacles emerged from free‐text responses to questions about the promotions process. One respondent felt that high clinical expectations made participation in other academic activities a challenge. The only other barriers noted were not being on the radar screen of the Division Chief of GIM, and difficulty identifying external, senior hospitalists to write letters in support of promotion.
When asked about the most important activities supporting their promotion, 24 respondents listed one to two key activities, detailed in Table 3. The most common response was peer‐reviewed publications (33%). Activities related to education and/or teaching were the next most common response (29%), specifically teaching, educational activities, curriculum design, or program director. Research or research funding represented 26% of responses. Valued activities outside of the respondent's institution included national reputation (21%) and service in professional societies (16%). Service or administrative responsibilities were mentioned by 25% of respondents.
| Category of Activity | Frequency of Response* (%) |
|---|---|
| |
| Research | 14 (58) |
| Peer‐reviewed publications | 8 (33) |
| Research | 4 (16) |
| Research funding | 2 (8) |
| Activities outside institution | 8 (33) |
| National reputation | 5 (21) |
| Professional society membership | 3 (13) |
| Education | 7 (29) |
| Teaching | 3 (13) |
| Educational activities | 2 (8) |
| Residency Director | 1 (4) |
| Curriculum development | 1 (4) |
| Service | 6 (25) |
| Service | 3 (13) |
| Administration/leadership of group | 3 (13) |
Discussion
We conducted a unique and comprehensive survey of academic hospitalists who have been promoted since 1995. We identified the most common and important activities contributing to promotion. Contrary to our expectations, survey respondents generally did not report being a hospitalist was a barrier in the promotions process.
Respondents were engaged in a diverse range of activities, including service, education, and research. Interestingly, no one identified him or herself primarily as a clinician. Teaching appeared to be a core component for all surveyed, regardless of academic appointment. Only one felt that her clinical workload as a hospitalist was an obstacle that prevented her from being engaged in other activities important for promotion. With more programs potentially evolving to separate divisions, the issue of being on the radar screen of a General Internal Medicine Division Chief may become less common over time. We hope that as programs mature and the numbers of associate and full professors increase, there will not be difficulty obtaining outside letters.
Although only 23% self‐identified as clinician‐researchers, nearly all had peer‐reviewed publications and other evidence of disseminated scholarly work. Grant funding, both federal and nonfederal, was also common among this group. This finding is consistent with self‐reported activities of a cohort of junior internal medicine faculty followed over three years who were eventually promoted, though the majority of those participants were classified as having either traditional clinician‐educator or clinician‐researcher positions.16
Despite outlining a seemingly clear pathway to promotion for hospitalists, concerns remain. Most importantly, those surveyed seem to have achieved promotion through relatively traditional academic job descriptions. Obtaining or maintaining these types of positions may be difficult as clinical needs at academic centers increase. According to a recent survey of hospitalist faculty,13 over one‐third spend more than 60% of their time on nonteaching clinical services. In that survey, over half of respondents had little or no protected time for scholarly activities. The contrast between this survey's findings and ours raises the question of whether our promoted sample had positions similar to those of most academic hospitalists. Given that the majority of our respondents noted peer‐reviewed publications and grant funding to be among the most important activities for promotion, there may be a dangerous disconnect for junior academic hospitalists who spend the majority of their time in direct patient care. Moreover, the promoted hospitalists in our survey reported relatively less participation in quality improvement/patient safety activities, in contrast to both anecdotal and survey reports that these activities are a major component of many academic hospitalist positions.5, 17 Most academic medical centers do not yet consider achievements in this area in their promotions criteria, potentially creating a barrier for the ranks of clinician quality improvers.1 Thus, significant obstacles to promotion of academic hospitalists may exist.
Leaders in academic hospital medicine are recognizing these potential barriers. A diverse group from major professional societies recently published a summary of the challenges and opportunities for the field of academic hospital medicine.1 Several needs and areas for intervention were identified, including enhanced faculty development and improved documentation of quality improvement activities. The SGIM, the SHM, and the Association of Chiefs and Leaders of General Internal Medicine (ACLGIM) recently cosponsored an intensive four‐day faculty development course for junior faculty to promote skills necessary for academic hospitalist success. Early reports indicate that this was a success.1820
In addition, the AHTF has developed a Quality Portfolio, paralleling the Educator's Portfolio, that can be used as a tool for documenting quality improvement and patient safety activities in a way that can be useful for career development and promotion.4 Lastly, the Society of Hospital Medicine has hosted the inaugural Academic Hospital Medicine Leadership Summit as part of the national meeting to provide mentorship and professional development opportunities for junior faculty. Our hope is that these opportunities, coupled with the growth of mid‐level and senior leaders in hospital medicine, will provide greater infrastructure for the development and promotion of junior faculty.
Our results may have relevance beyond hospitalist groups. With anticipated further limits on housestaff duty hours, more academic physicians may be asked to fill predominantly clinical roles. In addition, a growing emphasis on quality and patient safety may lead to a more general expansion of academicians who focus on these areas.15
Our survey and methodology have limitations. By including only promoted individuals, we did not survey hospitalists with the most difficulties in the promotions processthose who were not promoted. Thus, we are unable to directly compare successful versus unsuccessful strategies. Identifying nonpromoted academic hospitalists to understand the reasons they were not (or have not yet been) promoted could be a next step in this line of inquiry. Additionally, understanding the attitudes of promotions committees regarding hospitalists, and the clinical and quality improvement roles in which they are engaged, could enhance our current results. Finally, we surveyed a convenience sample of a limited numbers of hospitalists and institutions, and were unable to systematically account for variations in promotions criteria across institutions. However, to our knowledge, this is the most comprehensive study of promotions among academic hospitalists to date. Given the common themes that emerged in terms of activities that supported promotion, mentors, and advice, we believe that our sample was sufficient to identify important themes and advance our understanding of this nascent specialty.
In conclusion, our survey of promoted hospital medicine faculty provides valuable information for junior faculty and hospitalist leaders. Success was found through engaging in a diverse set of activities in the traditional areas of education, service, and scholarship, frequently in conjunction with developing recognition outside of their institutions. While all respondents were clinically active, none described themselves as having purely clinical roles. As academic hospitalist roles evolve, academic leaders will need to provide adequate mentorship, create time for scholarly pursuits, and promote documentation and recognition of nontraditional activities that may nonetheless be worthy of promotion.
- ,,,,,.Challenges and opportunities in academic hospital medicine: report from the academic hospital medicine summit.J Gen Intern Med.2009;24(5):636–641.
- ,,.Hospitalist educators: future of inpatient internal medicine training.Mt Sinai J Med.2008;75(5):436–451.
- ,,,.Hospitalists as emerging leaders in patient safety: lessons learned and future directions.J Patient Saf.2009;5(1):3–8.
- Quality Portfolio—Template and Instructions. Available at: http://www.sgim.org/userfiles/file/AHTF%20QP%20WEB%20TEMPLATE%20INS TRUCTIONS.pdf. Accessed on April 24,2010.
- .An innovative approach to support hospitalist physicians toward academic success.J Hosp Med.2008;3:314–318.
- ,,,.Institutional policies of U.S. medical schools regarding tenure, promotion, and benefits for part‐time faculty.Acad Med.2000;75(8):846–849.
- ,,,,,.Revising appointment, promotion, and tenure procedures to incorporate an expanded definition of scholarship: the University of Kentucky College of Medicine experience.Acad Med.2000;75(9)913–924.
- ,,,.Attitudes of clinical faculty about career progress, career success and recognition, and commitment to academic medicine. Results of a survey.Arch Intern Med.2000;160(17):2625–2629.
- ,,, et al.Promotion criteria for clinician‐educators.J Gen Intern Med.2003;18(9):711–716.
- ,,,.Documentation systems for educators seeking academic promotion in U.S. medical schools.Acad Med.2004;79(8):783–790.
- ,,,.Faculty development: academic opportunities for emergency medicine faculty on education career tracks.Acad Emerg Med.2003;10(10):1113–1117.
- ,,,.Burnout and internal medicine resident work hours restrictions.Arch Intern Med.2005;165(22):2595–2600.
- ,.Development of a Division of General Medicine in a Department of Internal Medicine.J Med Ed.1981;56:390–396.
- .The evolution of departments of medicine.N Engl J Med.1980;303(9):489–496.
- ,.Clinicians in quality improvement: a new career pathway in academic medicine.JAMA.2009;301(7):766–768.
- ,,.A time to be promoted. The prospective study of promotion in academia.J Gen Intern Med.2006;21(2):123–129.
- Academic Hospitalist Academy. Available at: http://www.sgim.org/index. cfm?pageId=815. Accessed on April 24,2010.
- .Reflections on the Academic Hospitalist Academy.SGIM Forum.2010;33(1):5.
- .The Academic Hospitalist Academy: Get anchored, equipped, and energized.SGIM Forum.2010;33(1):5–6.
- .Four formative days in the life of an academic hospitalist: the Academic Hospitalist Academy.SGIM Forum.2010;33(1):6.
The growth of academic hospital medicine has been driven by multiple factors including expanding clinical needs, housestaff duty hours' limitations, and an increasing focus on quality and patient safety.1 Hospitalists at academic medical centers frequently assume roles that differ substantially from traditional faculty positions. Academic hospitalists may have predominantly clinical positions, and may be involved in quality improvement and patient safety projects.24 Because of these commitments, many academic hospitalists spend less time on research or educational efforts.1, 5 Many have raised concerns that these unique job descriptions might lead to less time to devote to scholarship and academic pursuits, and consequently greater challenges in the promotions process.2, 5
There are little published data on promotion and tenure in academics, and even less specifically focused on the promotion of hospitalists. Theoretically, promotion should recognize an individual's contribution to his or her institution and field. However, each institution has unique criteria though which faculty achieve promotion. Previous articles addressing specific groups, such as part‐time,6 clinical faculty,79 or clinician‐educators10 may be relevant to hospitalists, as hospitalists may be more likely to fall into these categories. These reports suggest general agreement that promotion committees should consider and weigh clinical and educational work (in addition to scholarly publications) in the promotions process, but assessment methods vary across institutions and the contribution of activities, such as quality improvement, remain unclear. The educator's portfolio has gained momentum as a way to document valued teaching in many institutions,11, 12 but academic hospitalist participation in education may be limited.13
Literature related to the development of Divisions of General Internal Medicine is relevant insofar as similar concerns for promotion were expressed with the growth of their faculty.14, 15 However, its applicability may be limited by differences between roles of hospitalists and more traditional general medicine faculty.
To better understand the factors influencing promotion for academic hospitalists, the Society of General Internal Medicine (SGIM) Academic Hospitalist Task Force (AHTF) undertook a survey of promoted hospitalists who had successfully reached the rank of Associate Professor or higher.
Methods
Development of the Survey
The AHTF is a group of 18 academic hospitalists representing 15 institutions. Draft survey questions were developed by the group and sent to its members for refinement based on group consensus. Three cycles of refinement were performed, and the final survey (Appendix) was converted into an electronic format distributed through SurveyMonkey (SurveyMonkey.com, Portland, OR).
Identification of Survey Recipients
We identified a convenience sample of hospitalists who had been promoted to Associate or Full Professor of Medicine by querying members of the AHTF, the Society of Hospital Medicine (SHM) Academic Committee, and colleagues of academic medical centers with established hospitalist programs. We identified 33 promoted hospitalists.
Each recipient received an email from the AHTF cochairs in January 2009 asking them to complete the survey. If a response was not received in three weeks, a second email was sent. If a response was again not received, an AHTF task‐force member who knew the recipient asked him or her to complete the survey. All responses were received by March 2009.
Data Analysis
We examined responses using descriptive measures. Responses were analyzed across all respondents, as well as between these two subgroups. Statistical analysis with Fisher's exact test was performed using Stata 9.0 (StataCorp, College Station, TX).
Results
Of the 33 hospitalists who received the survey, 26 responded (response rate of 79%). Of these, 25 completed the survey in its entirely and were included in our analysis; 1 did not submit details regarding specific promotion‐related activities. General information regarding the respondents and their programs at the time of their promotion is contained in Table 1.
| |
| No. of institutions represented | 20 |
| Program age | 5.7 years (range 110) |
| Size of hospitalist program at the time of promotion | 10 (range 128) |
| Size of hospitalist program currently | 25 (range 745) |
| Programs that were separate divisions at the time of respondent promotion | 4 (20%) |
| Programs that are now separate divisions | 8 (40%) |
| Programs with 1‐track* promotion system | 2 (10%) |
| Programs with 2‐track promotion system | 8 (40%) |
| Programs with 3‐track promotion system | 9 (45%) |
| Other type of promotion system | 1 (5%) |
| Tenure track* | 8 (32%) |
| Institutions with tenure and promotion criteria that explicitly recognized hospitalist work | 8 (40%) |
The seven nonrespondents were from seven different institutions; however two of these institutions were represented by respondents. One nonrespondent had achieved a rank of Professor (through general medicine); the rest had been promoted to Associate Professor. One nonrespondent is known by the authors to hold a research position.
Ten respondents identified themselves as clinician‐educators (40%), ten as clinician‐administrators (40%), and five as clinician‐researchers (20%). Seventeen (68%) of the promoted hospitalists were not on a tenure track (as defined by them); they were more likely to have administrative or educational roles than a research appointment. Though the majority of self‐identified researchers were among the earliest to have been promoted, there were no statistically significant differences in self‐defined job description between more and less recently promoted hospitalists.
Promoted hospitalists were involved in a diverse range of activities which supported their promotion, including service (eg, institutional committees), education, research, and quality improvement. Nearly all hospitalists surveyed listed teaching and educational activities, and almost all had disseminated scholarly output and some degree of grant funding. Table 2 lists the specific activities in which respondents reported being engaged in each of these domains.
| Activity | Percent of Respondents Engaged in Activity |
|---|---|
| Service | |
| School of Medicine | 56 |
| Department of Medicine | 84 |
| Hospital | 80 |
| Professional societies | 92 |
| Administration | 67 |
| Education | |
| Medical student | 72 |
| Housestaff lectures | 84 |
| Ward/consult attending | 96 |
| Clinic precepting | 40 |
| Course director/curriculum development | 80 |
| Program director (or associate) | 36 |
| Research | |
| Peer‐reviewed publications | 92 |
| Abstract/poster presentations | 80 |
| Invited speaker | 96 |
| Reviewer/editor | 80 |
| Study section | 24 |
| Federal grants | 32 |
| Nonfederal grants (internal and external) | 72 |
| Quality improvement/patient safety | |
| Project member | 36 |
| Project leader | 52 |
| Institutional leadership | 32 |
| Curriculum development | 32 |
A range of individuals assisted the respondents in the promotion process. Twenty‐three (92%) respondents identified the individuals who supported their promotion, and all listed more than one person. Respondents most commonly credited their Section or Division Chief (43%) with facilitating their promotion, followed by Departmental Chairs or Vice/Associate Chairs (22%). Mentors (13%) or peers (8%) were also named. Four respondents (17%) named themselves as the person providing most guidance through the promotions process.
No consistent themes regarding obstacles emerged from free‐text responses to questions about the promotions process. One respondent felt that high clinical expectations made participation in other academic activities a challenge. The only other barriers noted were not being on the radar screen of the Division Chief of GIM, and difficulty identifying external, senior hospitalists to write letters in support of promotion.
When asked about the most important activities supporting their promotion, 24 respondents listed one to two key activities, detailed in Table 3. The most common response was peer‐reviewed publications (33%). Activities related to education and/or teaching were the next most common response (29%), specifically teaching, educational activities, curriculum design, or program director. Research or research funding represented 26% of responses. Valued activities outside of the respondent's institution included national reputation (21%) and service in professional societies (16%). Service or administrative responsibilities were mentioned by 25% of respondents.
| Category of Activity | Frequency of Response* (%) |
|---|---|
| |
| Research | 14 (58) |
| Peer‐reviewed publications | 8 (33) |
| Research | 4 (16) |
| Research funding | 2 (8) |
| Activities outside institution | 8 (33) |
| National reputation | 5 (21) |
| Professional society membership | 3 (13) |
| Education | 7 (29) |
| Teaching | 3 (13) |
| Educational activities | 2 (8) |
| Residency Director | 1 (4) |
| Curriculum development | 1 (4) |
| Service | 6 (25) |
| Service | 3 (13) |
| Administration/leadership of group | 3 (13) |
Discussion
We conducted a unique and comprehensive survey of academic hospitalists who have been promoted since 1995. We identified the most common and important activities contributing to promotion. Contrary to our expectations, survey respondents generally did not report being a hospitalist was a barrier in the promotions process.
Respondents were engaged in a diverse range of activities, including service, education, and research. Interestingly, no one identified him or herself primarily as a clinician. Teaching appeared to be a core component for all surveyed, regardless of academic appointment. Only one felt that her clinical workload as a hospitalist was an obstacle that prevented her from being engaged in other activities important for promotion. With more programs potentially evolving to separate divisions, the issue of being on the radar screen of a General Internal Medicine Division Chief may become less common over time. We hope that as programs mature and the numbers of associate and full professors increase, there will not be difficulty obtaining outside letters.
Although only 23% self‐identified as clinician‐researchers, nearly all had peer‐reviewed publications and other evidence of disseminated scholarly work. Grant funding, both federal and nonfederal, was also common among this group. This finding is consistent with self‐reported activities of a cohort of junior internal medicine faculty followed over three years who were eventually promoted, though the majority of those participants were classified as having either traditional clinician‐educator or clinician‐researcher positions.16
Despite outlining a seemingly clear pathway to promotion for hospitalists, concerns remain. Most importantly, those surveyed seem to have achieved promotion through relatively traditional academic job descriptions. Obtaining or maintaining these types of positions may be difficult as clinical needs at academic centers increase. According to a recent survey of hospitalist faculty,13 over one‐third spend more than 60% of their time on nonteaching clinical services. In that survey, over half of respondents had little or no protected time for scholarly activities. The contrast between this survey's findings and ours raises the question of whether our promoted sample had positions similar to those of most academic hospitalists. Given that the majority of our respondents noted peer‐reviewed publications and grant funding to be among the most important activities for promotion, there may be a dangerous disconnect for junior academic hospitalists who spend the majority of their time in direct patient care. Moreover, the promoted hospitalists in our survey reported relatively less participation in quality improvement/patient safety activities, in contrast to both anecdotal and survey reports that these activities are a major component of many academic hospitalist positions.5, 17 Most academic medical centers do not yet consider achievements in this area in their promotions criteria, potentially creating a barrier for the ranks of clinician quality improvers.1 Thus, significant obstacles to promotion of academic hospitalists may exist.
Leaders in academic hospital medicine are recognizing these potential barriers. A diverse group from major professional societies recently published a summary of the challenges and opportunities for the field of academic hospital medicine.1 Several needs and areas for intervention were identified, including enhanced faculty development and improved documentation of quality improvement activities. The SGIM, the SHM, and the Association of Chiefs and Leaders of General Internal Medicine (ACLGIM) recently cosponsored an intensive four‐day faculty development course for junior faculty to promote skills necessary for academic hospitalist success. Early reports indicate that this was a success.1820
In addition, the AHTF has developed a Quality Portfolio, paralleling the Educator's Portfolio, that can be used as a tool for documenting quality improvement and patient safety activities in a way that can be useful for career development and promotion.4 Lastly, the Society of Hospital Medicine has hosted the inaugural Academic Hospital Medicine Leadership Summit as part of the national meeting to provide mentorship and professional development opportunities for junior faculty. Our hope is that these opportunities, coupled with the growth of mid‐level and senior leaders in hospital medicine, will provide greater infrastructure for the development and promotion of junior faculty.
Our results may have relevance beyond hospitalist groups. With anticipated further limits on housestaff duty hours, more academic physicians may be asked to fill predominantly clinical roles. In addition, a growing emphasis on quality and patient safety may lead to a more general expansion of academicians who focus on these areas.15
Our survey and methodology have limitations. By including only promoted individuals, we did not survey hospitalists with the most difficulties in the promotions processthose who were not promoted. Thus, we are unable to directly compare successful versus unsuccessful strategies. Identifying nonpromoted academic hospitalists to understand the reasons they were not (or have not yet been) promoted could be a next step in this line of inquiry. Additionally, understanding the attitudes of promotions committees regarding hospitalists, and the clinical and quality improvement roles in which they are engaged, could enhance our current results. Finally, we surveyed a convenience sample of a limited numbers of hospitalists and institutions, and were unable to systematically account for variations in promotions criteria across institutions. However, to our knowledge, this is the most comprehensive study of promotions among academic hospitalists to date. Given the common themes that emerged in terms of activities that supported promotion, mentors, and advice, we believe that our sample was sufficient to identify important themes and advance our understanding of this nascent specialty.
In conclusion, our survey of promoted hospital medicine faculty provides valuable information for junior faculty and hospitalist leaders. Success was found through engaging in a diverse set of activities in the traditional areas of education, service, and scholarship, frequently in conjunction with developing recognition outside of their institutions. While all respondents were clinically active, none described themselves as having purely clinical roles. As academic hospitalist roles evolve, academic leaders will need to provide adequate mentorship, create time for scholarly pursuits, and promote documentation and recognition of nontraditional activities that may nonetheless be worthy of promotion.
- ,,,,,.Challenges and opportunities in academic hospital medicine: report from the academic hospital medicine summit.J Gen Intern Med.2009;24(5):636–641.
- ,,.Hospitalist educators: future of inpatient internal medicine training.Mt Sinai J Med.2008;75(5):436–451.
- ,,,.Hospitalists as emerging leaders in patient safety: lessons learned and future directions.J Patient Saf.2009;5(1):3–8.
- Quality Portfolio—Template and Instructions. Available at: http://www.sgim.org/userfiles/file/AHTF%20QP%20WEB%20TEMPLATE%20INS TRUCTIONS.pdf. Accessed on April 24,2010.
- .An innovative approach to support hospitalist physicians toward academic success.J Hosp Med.2008;3:314–318.
- ,,,.Institutional policies of U.S. medical schools regarding tenure, promotion, and benefits for part‐time faculty.Acad Med.2000;75(8):846–849.
- ,,,,,.Revising appointment, promotion, and tenure procedures to incorporate an expanded definition of scholarship: the University of Kentucky College of Medicine experience.Acad Med.2000;75(9)913–924.
- ,,,.Attitudes of clinical faculty about career progress, career success and recognition, and commitment to academic medicine. Results of a survey.Arch Intern Med.2000;160(17):2625–2629.
- ,,, et al.Promotion criteria for clinician‐educators.J Gen Intern Med.2003;18(9):711–716.
- ,,,.Documentation systems for educators seeking academic promotion in U.S. medical schools.Acad Med.2004;79(8):783–790.
- ,,,.Faculty development: academic opportunities for emergency medicine faculty on education career tracks.Acad Emerg Med.2003;10(10):1113–1117.
- ,,,.Burnout and internal medicine resident work hours restrictions.Arch Intern Med.2005;165(22):2595–2600.
- ,.Development of a Division of General Medicine in a Department of Internal Medicine.J Med Ed.1981;56:390–396.
- .The evolution of departments of medicine.N Engl J Med.1980;303(9):489–496.
- ,.Clinicians in quality improvement: a new career pathway in academic medicine.JAMA.2009;301(7):766–768.
- ,,.A time to be promoted. The prospective study of promotion in academia.J Gen Intern Med.2006;21(2):123–129.
- Academic Hospitalist Academy. Available at: http://www.sgim.org/index. cfm?pageId=815. Accessed on April 24,2010.
- .Reflections on the Academic Hospitalist Academy.SGIM Forum.2010;33(1):5.
- .The Academic Hospitalist Academy: Get anchored, equipped, and energized.SGIM Forum.2010;33(1):5–6.
- .Four formative days in the life of an academic hospitalist: the Academic Hospitalist Academy.SGIM Forum.2010;33(1):6.
Copyright © 2011 Society of Hospital Medicine
In the Literature
In This Edition
Literature at a Glance: A guide to this month’s studies
- PPI use with clopidrogrel in ACS.
- Chlorhexidine sponge use reduces line infections.
- Extended thienopyridine use does not benefit DES patients.
- CABG is revascularization choice for severe CAD.
- Pre-treated CVC use reduces bloodstream infections.
- Hospitalist use grows in U.S.
- Sepsis order set improves outcomes.
- Admission day predicts acute PE mortality.
PEDIATRIC HM LITerature
Early Transition to Oral Therapy in Acute Osteomyelitis in Children Associated with Fewer Complications I By Mark Shen, MD
Clinical question: Can acute osteomyelitis in children be managed with early transition to oral antimicrobial therapy?
Background: Traditional treatment of acute osteomyelitis in children has involved prolonged intravenous antimicrobial therapy, typically greater than three to four weeks in duration. Small studies suggest the feasibility of a transition to prolonged oral therapy after an initial response to intravenous antimicrobial agents.
Study design: Retrospective, cohort study.
Setting: 29 freestanding children’s hospitals.
Synopsis: Using the Pediatric Health Information System (PHIS) database, 1,969 children were identified via ICD-9-CM codes as having been hospitalized with acute osteomyelitis—and without comorbid conditions—between January 2000 and June 2005. Rehospitalizations were reviewed for complications of both treatment failure and the treatment itself. More than half (1,021) of the children underwent central venous catheterization for prolonged intravenous (IV) therapy; 948 were assigned to the oral therapy group. No significant differences in treatment failure existed between the two groups (5% in the IV group; 4% in the oral group).
Overall, the clinical characteristics of the two groups were indistinguishable. Propensity score analysis was used to handle possible patient-level confounders; a validation study was performed to address misclassifications in assignment. No significant confounding effects were found.
Secondary findings included marked variation across hospitals in the use of oral therapy and increased treatment complications in the IV group. Although unmeasured factors not present in an administrative database may affect results, the strikingly similar groups and outcomes suggest the data are relevant.
Bottom line: Early transition to oral therapy for acute osteomyelitis in children does not increase treatment failure and is associated with fewer treatment complications.
Reference: Zaoutis T, Localio AR, Leckerman K, Saddlemire S, Bertoch D, Keren R. Prolonged intravenous therapy versus early transition to oral antimicrobial therapy for acute osteomyelitis in children. Pediatrics. 2009;123:636-642.

PPI Use with Clopidogrel in Acute Coronary Syndrome Is Associated with Readmissions and Mortality
Clinical question: Does concomitant use of clopidogrel and a proton pump inhibitor (PPI) following hospitalization for acute coronary syndrome (ACS) lead to adverse outcomes?
Background: Prophylactic PPIs often are prescribed with clopidogrel to reduce the risk of gastrointestinal bleeding. Mechanistic studies have shown that omeprazole decreases the platelet-inhibitory effect of clopidogrel, raising concerns that PPIs might interfere with clopidogrel’s beneficial effects. The clinical significance of this finding is unknown.
Study design: Retrospective cohort study.
Setting: 127 VA hospitals.
Synopsis: Investigators used data from the Cardiac Care Follow-up Clinical Study and VA pharmacy records to examine 8,205 male veterans who were hospitalized for ACS and treated with clopidogrel. Patients who filled prescriptions for both clopidogrel and a PPI were at significantly higher risk for death or readmission with ACS compared with those who filled prescriptions for clopidogrel only (adjusted odds ratio, 1.25; 95% confidence interval, 1.11-1.41). Patients who filled prescriptions for PPIs alone had similar risk for adverse events as those who took neither medication.
Subanalyses found similarly increased risk among patients prescribed omeprazole and rabeprazole, but those taking lanzoprazole and pantoprazole were not examined due to the small sample size. Although causality cannot be inferred from this observational study, and the risk associated with combined clopidigrel and PPI use appeared small, alternatives for gastric acid reduction exist. Thus, it may be prudent to restrict PPI use to patients who have a clear indication for their use until more definitive clinical trials can be conducted.
Bottom line: Among patients who are treated with clopidogrel for ACS, PPIs should be reserved for patients with a clear indication for gastric acid reduction and who cannot use alternative therapies.
Citation: Ho PM, Maddox TM, Wang L, et al. Risk of adverse outcomes associated with concomitant use of clopidogrel and proton pump inhibitors following acute coronary syndrome. JAMA. 2009;301(9):937-944.
Chlorhexidine-Impregnated Sponge Use Reduces Line Infections
Clinical question: Does dressing vascular catheters with chlorhexidine gluconate-impregnated sponges (CHGIS) reduce rates of catheter-related infections, and are dressing changes every seven days inferior to every three days?
Background: Process improvement strategies—including educating providers, strictly adhering to sterile technique, and promptly removing unnecessary catheters—greatly decrease catheter-related infections. It is unclear if CHGIS dressings offer additional benefit. Also uncertain is whether weekly dressing changes are as safe as changing dressings every three days.
Study design: A 2x2 factorial, assessor-blinded, randomized controlled trial.
Setting: ICUs in three university hospitals and two general hospitals in France.
Synopsis: 1,636 French adults expected to require arterial and central venous catheters for >48 hours were randomly assigned to one of four groups. Each group received either CHGIS dressings or standard dressings, and each group had dressing changes every three or seven days. Dressings were changed sooner if soiled or nonadherent. CHGIS dressings were associated with fewer catheter-related infections than standard dressings (0.6 vs. 1.4 infections per 1,000 catheter days; P=0.03). No significant difference in rates of catheter colonization existed between the three-day and seven-day dressing change strategies (10.4 vs. 11 events per 1,000 catheter days, P>0.05).
Although microbiology assessors were blinded to patients’ status, the ICU staff was not, potentially creating experimenter bias. Approximately 30% of the venous catheters and 40% of the arterial catheters were in a femoral site. Secondary analyses found higher rates of severe dermatitis among patients with CHGIS dressings but no difference in minimal bactericidal concentration (MBC) or colonizing organisms. Preliminary calculations suggested CHGIS dressings could be cost-effective.
Bottom line: Among critically ill adults, CHGIS catheter dressings may marginally reduce catheter-related infection rates, but further evaluation is needed before this technology can be adopted widely.
Citation: Timsit JF, Schwebel C, Bouadma L, et al. Chlorhexidine-impregnated sponges and less frequent dressing changes for prevention of catheter-related infections in critically-ill adults: a randomized controlled trial. JAMA. 2009;301(12):1231-1241.
Thienopyridine Use Six Months after Sirolimus-Eluting Stent Implant-ation Offers No Benefit
Clinical question: What are the relative contributions of aspirin and thienopyridine on preventing stent thrombosis in patients with sirolimus-eluting stents?
Background: There are no randomized clinical trials addressing the optimal duration, or the risks associated with discontinuation, of dual-antiplatelet therapy after drug-eluting stent (DES) implantation. Nevertheless, many patients continue to be maintained on dual-antiplatelet therapy beyond one year of their index DES implantation.
Study design: Prospective multicenter observational study.
Setting: Hospitals in Japan.
Synopsis: This study observed 10,778 Japanese patients undergoing sirolimus-eluting stent implantation. Patients discontinuing both thienopyridine and aspirin had a significantly higher rate of stent thrombosis than those who continued both medications for up to 18 months. However, discontinuation of thienopyridine alone was not associated with an excess risk of stent thrombosis. Additionally, a landmark analysis of patients who were free of events at six months showed rates of death for myocardial infarction (MI) at 24 months were 4.1% for patients taking thienopyridine and 4.1% for patients not taking thienopyridine (P=0.99). Ticlodipine was the thienopyridine used by more than 95% of patients.
Hospitalists should be aware that the role thienopyridine therapy plays in reducing stent thrombosis beyond one month after implantation has not been well addressed.
Bottom line: Discontinuation of thienopyridine therapy after six months while maintaining aspirin therapy is not associated with increased risk of stent thrombosis in patients with sirolimus-eluting stents.
Citation: Kimura T, Morimoto T, Nakagawa Y, et al. Antiplatelet therapy and stent thrombosis after sirolimus-eluting stent implantation. Circulation. 2009;119(7):987-995.
Compared with PCI, CABG Results in Lower Rates of Major Adverse Events in Severe CAD Patients
Clinical question: What is the optimal revascularization strategy for previously untreated severe coronary artery disease (CAD)?
Background: Coronary artery bypass grafting (CABG) is the treatment of choice in three-vessel and left-main CAD. However, percutaneous coronary intervention (PCI) with drug-eluting stents often is utilized despite the lack of adequately powered randomized trials.
Study design: Prospective multicenter randomized clinical trial.
Setting: 85 hospitals in Europe and the U.S.
Synopsis: 1,800 patients with an average age of 65 and previously untreated three-vessel or left-main CAD amenable to therapy with both PCI and CABG were randomized to CABG or PCI. The primary combined endpoint was a major adverse cardiac or cerebrovascular event, defined as death, stroke, MI, or repeat revascularization. PCI was associated with a significantly higher rate of major adverse cardiac or cerebrovascular events, due mostly to a higher rate of repeat revascularization (13.5% vs. 5.9%, P<0.001). At 12 months, the two groups had similar rates of death from any cause or MI, and similar rates of the combined endpoint of death from any cause, stroke, or MI; however, the rate of stroke was 1.6% higher in the CABG group.
Hospitalists should continue to favor CABG over PCI but give consideration to the risks involved with such an intervention.
Bottom line: CABG remains the revascularization choice in patients with severe CAD.
Citation: Serruys PW, Morice MC, Kappetein AP, et al. Percuta-neous coronary intervention versus coronary artery bypass grafting for severe coronary artery disease. N Engl J Med. 2009;360(10):961-972.
Pre-Medicated Central Venous Catheters Reduce Risk of Catheter-Related Bloodstream Infections
Clinical question: Does pre-treating central venous catheters with anti-infective agents prevent catheter-related bloodstream infections?
Background: Use of central venous catheters (CVC) is associated with catheter-related bloodstream infection (CRBSI), with CRBSI-related mortality rates as high as 25%. Previous reviews have indicated that CVCs coated or impregnated with anti-infectives may reduce CRBSI incidence. This review integrates new trial data with information from prior reviews.
Study design: Meta-analysis of 27 randomized controlled trials.
Setting: Meta-analysis.
Synopsis: The authors report CVCs pre-treated with anti-infectives (AI-CVCs) are clinically effective in reducing the risk of CRBSI. The odds of having a CRBSI with a treated CVC versus an untreated CVC are 0.49 to 1 (95% CI, 0.37–0.64, 27 studies, fixed effects). The study also finds the use of AI-CVCs might provide a large cost savings in Great Britain. Because the findings are based on a meta-analysis, they are limited by the quality, context, and consistency of the original studies. The authors note that many of the studies had unsatisfactory descriptions of methodology. The current study is unable to separate the risk reduction attributable to AI-CVC versus that attributable to other infection control practices. Also, original data is insufficient to assess the benefits of AI-CVCs placed for longer than 12 days.
To summarize, AI-CVCs may present a means to reduce CRBSI, but more investigation of its role within infection control protocols is needed, as is investigation of longer duration of treatment.
Bottom line: Central venous catheters pre-treated with anti-infectives significantly reduce catheter-related bloodstream infections.
Citation: Hockenhull JC, Dwan KM, Smith GW, et al. The clinical effectiveness of central venous catheters treated with anti-infective agents in preventing catheter-related bloodstream infections: a systematic review. Crit Care Med. 2009;37(2):702-712.
Fivefold Increase in Hospitalists in the U.S. from 1995 to 2006
Clinical question: What is the growth rate of hospitalists and hospitalist-provided care?
Background: Survey data has shown a sharp increase in the number of hospitalists, but until now there have not been any national or population-based data on the growth of hospitalist care.
Study design: Descriptive analysis.
Setting: Medicare-enrolled patients.
Synopsis: The study is based on national Medicare data from 2.1 million admissions involving 990,785 patients in 5,800 hospitals and 120,226 general internists. It represents 5% of inpatient Medicare claims generated by general internists. The authors define “hospitalist” as a general internist who generates >90% of his or her claims from the care of hospitalized patients.
U.S. hospitals have seen substantial growth in hospitalists over the period examined. The nation saw a 500% increase in the number of general-internist hospitalists, and a 28% increase (to 37.1% in 2006 from 9.1% in 1995) in the number of Medicare patients who received care from a hospitalist. The odds that a hospitalized Medicare patient received care from a hospitalist increased 29.2% per year from 1997 to 2006. The percentage of hospitals with at least three hospitalists rose to 47.1% in 2006 from 11.6% in 1995.
This analysis might actually have underestimated HM’s growth. Analysis of Medicare claims does not identify pediatric hospitalists and hospitalists who work exclusively within HMOs. This analysis also did not include family practitioners or internal-medicine subspecialists who are hospitalists.
Bottom line: Medicare claims data confirm survey data findings: Hospitalists and hospitalist care has grown sharply over the last decade.
Citation: Kuo YF, Sharma G, Freeman JL, Goodwin JS. Growth in the care of older patients by hospitalists in the United States. N Engl J Med. 2009;360:1102-1012.
Standardized Order Set for Bacteremic Sepsis Improves LOS and Mortality
Clinical question: Does a standardized order set for bacteremic sepsis impact patient management and outcomes?
Background: Prompt cardiovascular resuscitation and appropriate antibiotics decrease morbidity and mortality in bacteremic sepsis. This study examined whether hospitalwide, standardized sepsis order set improved management and outcomes.
Study design: Retrospective, before-and-after study design.
Setting: 1,200-bed academic medical center.
Synopsis: Two hundred patients with bacteremic severe sepsis were randomly selected from 18 months before the order set was introduced, and 200 were selected from 18 months after the order set was introduced. Primary outcomes measured were quantity of fluid administered and appropriate initial antibiotics. Secondary outcomes measured were hospital mortality and length of stay. Patients in the “after” group received more intravenous fluid (1627±1862 ml vs. 2054±2237 ml, P=.04), more appropriate antibiotics (53.0% vs. 65.5%, P=.01), had shorter hospital stays (28.7±30.1 days vs. 22.4±20.9 days, P=.02), and decreased in-house mortality (55.0% vs. 39.5%, P =<0.01).
The retrospective design of the study limited its ability to determine causal relationship. Extensive education may have contributed to the change (Hawthorne effect). Management in the ICU and ED, not the hospital wards, was the primary reason for mortality difference.
Bottom line: A standardized order set for bacteremic sepsis was associated with increased compliance with evidence-based treatment and improved outcomes. Hospitalists should promptly treat bacteremic sepsis with appropriate fluid resuscitation and antibiotics.
Citation: Thiel SW, Asghar MF, Micek ST, Reichley RM, Doherty JA, Kollef MH. Hospital-wide impact of a standardized order set for the management of bacteremic severe sepsis. Crit Care Med. 2009;37(3):819-824.
Admission Day of the Week Predicts Mortality in Patients with Acute Pulmonary Embolus
Clinical question: Do weekend pulmonary embolus (PE) admissions have worse outcomes than weekday admissions?
Background: Studies of patients with acute cardiovascular diagnoses (e.g., stroke, cardiac arrest) have shown higher short-term mortality and longer length of stay (LOS) for weekend versus weekday admissions. PE diagnosis is complex, requiring timely testing and experienced staff who are sometimes unavailable on weekends. Optimal anticoagulation therapy also depends on provider skill.
Study design: Retrospective observational study.
Setting: 186 private Pennsylvania hospitals, January 2000 through November 2002.
Synopsis: Using the Pennsylvania Health Care Cost Containment Council database, the authors reviewed 15,531 records of patients with a primary or secondary PE diagnosis code. The primary outcome was all-cause mortality over 30 days; LOS was the secondary outcome.
Weekend admissions in the highest severity of illness risk class had higher 30-day mortality than weekday admissions. Weekend admissions were significantly more likely than weekday admissions to be clinically unstable and to have abnormal lab parameters. Adjusted for severity of illness risk class, overall mortality was 1.4% higher for weekend versus weekday admissions. All excess mortality came from the sickest group of patients. LOS did not differ.
Less-experienced caregivers or delayed diagnostic testing may play a role in poor outcomes. Patients admitted on weekends might receive delayed care from the first onset of symptoms. This is important because timely therapy has been shown to influence outcomes in acute PE. Reasons for these observed differences should be explored further to help provide more consistent PE management, regardless of admission day.
Bottom line: The sickest patients with PE admitted on weekends experienced small but significantly greater 30-day mortality compared with those admitted on weekdays.
Citation: Aujesky D, Jimenez D, Mor M, Geng M, Fine M, Ibrahim S. Weekend versus weekday admission and mortality after acute pulmonary embolism. Circulation. 2009;119:962-968. TH
In This Edition
Literature at a Glance: A guide to this month’s studies
- PPI use with clopidrogrel in ACS.
- Chlorhexidine sponge use reduces line infections.
- Extended thienopyridine use does not benefit DES patients.
- CABG is revascularization choice for severe CAD.
- Pre-treated CVC use reduces bloodstream infections.
- Hospitalist use grows in U.S.
- Sepsis order set improves outcomes.
- Admission day predicts acute PE mortality.
PEDIATRIC HM LITerature
Early Transition to Oral Therapy in Acute Osteomyelitis in Children Associated with Fewer Complications I By Mark Shen, MD
Clinical question: Can acute osteomyelitis in children be managed with early transition to oral antimicrobial therapy?
Background: Traditional treatment of acute osteomyelitis in children has involved prolonged intravenous antimicrobial therapy, typically greater than three to four weeks in duration. Small studies suggest the feasibility of a transition to prolonged oral therapy after an initial response to intravenous antimicrobial agents.
Study design: Retrospective, cohort study.
Setting: 29 freestanding children’s hospitals.
Synopsis: Using the Pediatric Health Information System (PHIS) database, 1,969 children were identified via ICD-9-CM codes as having been hospitalized with acute osteomyelitis—and without comorbid conditions—between January 2000 and June 2005. Rehospitalizations were reviewed for complications of both treatment failure and the treatment itself. More than half (1,021) of the children underwent central venous catheterization for prolonged intravenous (IV) therapy; 948 were assigned to the oral therapy group. No significant differences in treatment failure existed between the two groups (5% in the IV group; 4% in the oral group).
Overall, the clinical characteristics of the two groups were indistinguishable. Propensity score analysis was used to handle possible patient-level confounders; a validation study was performed to address misclassifications in assignment. No significant confounding effects were found.
Secondary findings included marked variation across hospitals in the use of oral therapy and increased treatment complications in the IV group. Although unmeasured factors not present in an administrative database may affect results, the strikingly similar groups and outcomes suggest the data are relevant.
Bottom line: Early transition to oral therapy for acute osteomyelitis in children does not increase treatment failure and is associated with fewer treatment complications.
Reference: Zaoutis T, Localio AR, Leckerman K, Saddlemire S, Bertoch D, Keren R. Prolonged intravenous therapy versus early transition to oral antimicrobial therapy for acute osteomyelitis in children. Pediatrics. 2009;123:636-642.
PPI Use with Clopidogrel in Acute Coronary Syndrome Is Associated with Readmissions and Mortality
Clinical question: Does concomitant use of clopidogrel and a proton pump inhibitor (PPI) following hospitalization for acute coronary syndrome (ACS) lead to adverse outcomes?
Background: Prophylactic PPIs often are prescribed with clopidogrel to reduce the risk of gastrointestinal bleeding. Mechanistic studies have shown that omeprazole decreases the platelet-inhibitory effect of clopidogrel, raising concerns that PPIs might interfere with clopidogrel’s beneficial effects. The clinical significance of this finding is unknown.
Study design: Retrospective cohort study.
Setting: 127 VA hospitals.
Synopsis: Investigators used data from the Cardiac Care Follow-up Clinical Study and VA pharmacy records to examine 8,205 male veterans who were hospitalized for ACS and treated with clopidogrel. Patients who filled prescriptions for both clopidogrel and a PPI were at significantly higher risk for death or readmission with ACS compared with those who filled prescriptions for clopidogrel only (adjusted odds ratio, 1.25; 95% confidence interval, 1.11-1.41). Patients who filled prescriptions for PPIs alone had similar risk for adverse events as those who took neither medication.
Subanalyses found similarly increased risk among patients prescribed omeprazole and rabeprazole, but those taking lanzoprazole and pantoprazole were not examined due to the small sample size. Although causality cannot be inferred from this observational study, and the risk associated with combined clopidigrel and PPI use appeared small, alternatives for gastric acid reduction exist. Thus, it may be prudent to restrict PPI use to patients who have a clear indication for their use until more definitive clinical trials can be conducted.
Bottom line: Among patients who are treated with clopidogrel for ACS, PPIs should be reserved for patients with a clear indication for gastric acid reduction and who cannot use alternative therapies.
Citation: Ho PM, Maddox TM, Wang L, et al. Risk of adverse outcomes associated with concomitant use of clopidogrel and proton pump inhibitors following acute coronary syndrome. JAMA. 2009;301(9):937-944.
Chlorhexidine-Impregnated Sponge Use Reduces Line Infections
Clinical question: Does dressing vascular catheters with chlorhexidine gluconate-impregnated sponges (CHGIS) reduce rates of catheter-related infections, and are dressing changes every seven days inferior to every three days?
Background: Process improvement strategies—including educating providers, strictly adhering to sterile technique, and promptly removing unnecessary catheters—greatly decrease catheter-related infections. It is unclear if CHGIS dressings offer additional benefit. Also uncertain is whether weekly dressing changes are as safe as changing dressings every three days.
Study design: A 2x2 factorial, assessor-blinded, randomized controlled trial.
Setting: ICUs in three university hospitals and two general hospitals in France.
Synopsis: 1,636 French adults expected to require arterial and central venous catheters for >48 hours were randomly assigned to one of four groups. Each group received either CHGIS dressings or standard dressings, and each group had dressing changes every three or seven days. Dressings were changed sooner if soiled or nonadherent. CHGIS dressings were associated with fewer catheter-related infections than standard dressings (0.6 vs. 1.4 infections per 1,000 catheter days; P=0.03). No significant difference in rates of catheter colonization existed between the three-day and seven-day dressing change strategies (10.4 vs. 11 events per 1,000 catheter days, P>0.05).
Although microbiology assessors were blinded to patients’ status, the ICU staff was not, potentially creating experimenter bias. Approximately 30% of the venous catheters and 40% of the arterial catheters were in a femoral site. Secondary analyses found higher rates of severe dermatitis among patients with CHGIS dressings but no difference in minimal bactericidal concentration (MBC) or colonizing organisms. Preliminary calculations suggested CHGIS dressings could be cost-effective.
Bottom line: Among critically ill adults, CHGIS catheter dressings may marginally reduce catheter-related infection rates, but further evaluation is needed before this technology can be adopted widely.
Citation: Timsit JF, Schwebel C, Bouadma L, et al. Chlorhexidine-impregnated sponges and less frequent dressing changes for prevention of catheter-related infections in critically-ill adults: a randomized controlled trial. JAMA. 2009;301(12):1231-1241.
Thienopyridine Use Six Months after Sirolimus-Eluting Stent Implant-ation Offers No Benefit
Clinical question: What are the relative contributions of aspirin and thienopyridine on preventing stent thrombosis in patients with sirolimus-eluting stents?
Background: There are no randomized clinical trials addressing the optimal duration, or the risks associated with discontinuation, of dual-antiplatelet therapy after drug-eluting stent (DES) implantation. Nevertheless, many patients continue to be maintained on dual-antiplatelet therapy beyond one year of their index DES implantation.
Study design: Prospective multicenter observational study.
Setting: Hospitals in Japan.
Synopsis: This study observed 10,778 Japanese patients undergoing sirolimus-eluting stent implantation. Patients discontinuing both thienopyridine and aspirin had a significantly higher rate of stent thrombosis than those who continued both medications for up to 18 months. However, discontinuation of thienopyridine alone was not associated with an excess risk of stent thrombosis. Additionally, a landmark analysis of patients who were free of events at six months showed rates of death for myocardial infarction (MI) at 24 months were 4.1% for patients taking thienopyridine and 4.1% for patients not taking thienopyridine (P=0.99). Ticlodipine was the thienopyridine used by more than 95% of patients.
Hospitalists should be aware that the role thienopyridine therapy plays in reducing stent thrombosis beyond one month after implantation has not been well addressed.
Bottom line: Discontinuation of thienopyridine therapy after six months while maintaining aspirin therapy is not associated with increased risk of stent thrombosis in patients with sirolimus-eluting stents.
Citation: Kimura T, Morimoto T, Nakagawa Y, et al. Antiplatelet therapy and stent thrombosis after sirolimus-eluting stent implantation. Circulation. 2009;119(7):987-995.
Compared with PCI, CABG Results in Lower Rates of Major Adverse Events in Severe CAD Patients
Clinical question: What is the optimal revascularization strategy for previously untreated severe coronary artery disease (CAD)?
Background: Coronary artery bypass grafting (CABG) is the treatment of choice in three-vessel and left-main CAD. However, percutaneous coronary intervention (PCI) with drug-eluting stents often is utilized despite the lack of adequately powered randomized trials.
Study design: Prospective multicenter randomized clinical trial.
Setting: 85 hospitals in Europe and the U.S.
Synopsis: 1,800 patients with an average age of 65 and previously untreated three-vessel or left-main CAD amenable to therapy with both PCI and CABG were randomized to CABG or PCI. The primary combined endpoint was a major adverse cardiac or cerebrovascular event, defined as death, stroke, MI, or repeat revascularization. PCI was associated with a significantly higher rate of major adverse cardiac or cerebrovascular events, due mostly to a higher rate of repeat revascularization (13.5% vs. 5.9%, P<0.001). At 12 months, the two groups had similar rates of death from any cause or MI, and similar rates of the combined endpoint of death from any cause, stroke, or MI; however, the rate of stroke was 1.6% higher in the CABG group.
Hospitalists should continue to favor CABG over PCI but give consideration to the risks involved with such an intervention.
Bottom line: CABG remains the revascularization choice in patients with severe CAD.
Citation: Serruys PW, Morice MC, Kappetein AP, et al. Percuta-neous coronary intervention versus coronary artery bypass grafting for severe coronary artery disease. N Engl J Med. 2009;360(10):961-972.
Pre-Medicated Central Venous Catheters Reduce Risk of Catheter-Related Bloodstream Infections
Clinical question: Does pre-treating central venous catheters with anti-infective agents prevent catheter-related bloodstream infections?
Background: Use of central venous catheters (CVC) is associated with catheter-related bloodstream infection (CRBSI), with CRBSI-related mortality rates as high as 25%. Previous reviews have indicated that CVCs coated or impregnated with anti-infectives may reduce CRBSI incidence. This review integrates new trial data with information from prior reviews.
Study design: Meta-analysis of 27 randomized controlled trials.
Setting: Meta-analysis.
Synopsis: The authors report CVCs pre-treated with anti-infectives (AI-CVCs) are clinically effective in reducing the risk of CRBSI. The odds of having a CRBSI with a treated CVC versus an untreated CVC are 0.49 to 1 (95% CI, 0.37–0.64, 27 studies, fixed effects). The study also finds the use of AI-CVCs might provide a large cost savings in Great Britain. Because the findings are based on a meta-analysis, they are limited by the quality, context, and consistency of the original studies. The authors note that many of the studies had unsatisfactory descriptions of methodology. The current study is unable to separate the risk reduction attributable to AI-CVC versus that attributable to other infection control practices. Also, original data is insufficient to assess the benefits of AI-CVCs placed for longer than 12 days.
To summarize, AI-CVCs may present a means to reduce CRBSI, but more investigation of its role within infection control protocols is needed, as is investigation of longer duration of treatment.
Bottom line: Central venous catheters pre-treated with anti-infectives significantly reduce catheter-related bloodstream infections.
Citation: Hockenhull JC, Dwan KM, Smith GW, et al. The clinical effectiveness of central venous catheters treated with anti-infective agents in preventing catheter-related bloodstream infections: a systematic review. Crit Care Med. 2009;37(2):702-712.
Fivefold Increase in Hospitalists in the U.S. from 1995 to 2006
Clinical question: What is the growth rate of hospitalists and hospitalist-provided care?
Background: Survey data has shown a sharp increase in the number of hospitalists, but until now there have not been any national or population-based data on the growth of hospitalist care.
Study design: Descriptive analysis.
Setting: Medicare-enrolled patients.
Synopsis: The study is based on national Medicare data from 2.1 million admissions involving 990,785 patients in 5,800 hospitals and 120,226 general internists. It represents 5% of inpatient Medicare claims generated by general internists. The authors define “hospitalist” as a general internist who generates >90% of his or her claims from the care of hospitalized patients.
U.S. hospitals have seen substantial growth in hospitalists over the period examined. The nation saw a 500% increase in the number of general-internist hospitalists, and a 28% increase (to 37.1% in 2006 from 9.1% in 1995) in the number of Medicare patients who received care from a hospitalist. The odds that a hospitalized Medicare patient received care from a hospitalist increased 29.2% per year from 1997 to 2006. The percentage of hospitals with at least three hospitalists rose to 47.1% in 2006 from 11.6% in 1995.
This analysis might actually have underestimated HM’s growth. Analysis of Medicare claims does not identify pediatric hospitalists and hospitalists who work exclusively within HMOs. This analysis also did not include family practitioners or internal-medicine subspecialists who are hospitalists.
Bottom line: Medicare claims data confirm survey data findings: Hospitalists and hospitalist care has grown sharply over the last decade.
Citation: Kuo YF, Sharma G, Freeman JL, Goodwin JS. Growth in the care of older patients by hospitalists in the United States. N Engl J Med. 2009;360:1102-1012.
Standardized Order Set for Bacteremic Sepsis Improves LOS and Mortality
Clinical question: Does a standardized order set for bacteremic sepsis impact patient management and outcomes?
Background: Prompt cardiovascular resuscitation and appropriate antibiotics decrease morbidity and mortality in bacteremic sepsis. This study examined whether hospitalwide, standardized sepsis order set improved management and outcomes.
Study design: Retrospective, before-and-after study design.
Setting: 1,200-bed academic medical center.
Synopsis: Two hundred patients with bacteremic severe sepsis were randomly selected from 18 months before the order set was introduced, and 200 were selected from 18 months after the order set was introduced. Primary outcomes measured were quantity of fluid administered and appropriate initial antibiotics. Secondary outcomes measured were hospital mortality and length of stay. Patients in the “after” group received more intravenous fluid (1627±1862 ml vs. 2054±2237 ml, P=.04), more appropriate antibiotics (53.0% vs. 65.5%, P=.01), had shorter hospital stays (28.7±30.1 days vs. 22.4±20.9 days, P=.02), and decreased in-house mortality (55.0% vs. 39.5%, P =<0.01).
The retrospective design of the study limited its ability to determine causal relationship. Extensive education may have contributed to the change (Hawthorne effect). Management in the ICU and ED, not the hospital wards, was the primary reason for mortality difference.
Bottom line: A standardized order set for bacteremic sepsis was associated with increased compliance with evidence-based treatment and improved outcomes. Hospitalists should promptly treat bacteremic sepsis with appropriate fluid resuscitation and antibiotics.
Citation: Thiel SW, Asghar MF, Micek ST, Reichley RM, Doherty JA, Kollef MH. Hospital-wide impact of a standardized order set for the management of bacteremic severe sepsis. Crit Care Med. 2009;37(3):819-824.
Admission Day of the Week Predicts Mortality in Patients with Acute Pulmonary Embolus
Clinical question: Do weekend pulmonary embolus (PE) admissions have worse outcomes than weekday admissions?
Background: Studies of patients with acute cardiovascular diagnoses (e.g., stroke, cardiac arrest) have shown higher short-term mortality and longer length of stay (LOS) for weekend versus weekday admissions. PE diagnosis is complex, requiring timely testing and experienced staff who are sometimes unavailable on weekends. Optimal anticoagulation therapy also depends on provider skill.
Study design: Retrospective observational study.
Setting: 186 private Pennsylvania hospitals, January 2000 through November 2002.
Synopsis: Using the Pennsylvania Health Care Cost Containment Council database, the authors reviewed 15,531 records of patients with a primary or secondary PE diagnosis code. The primary outcome was all-cause mortality over 30 days; LOS was the secondary outcome.
Weekend admissions in the highest severity of illness risk class had higher 30-day mortality than weekday admissions. Weekend admissions were significantly more likely than weekday admissions to be clinically unstable and to have abnormal lab parameters. Adjusted for severity of illness risk class, overall mortality was 1.4% higher for weekend versus weekday admissions. All excess mortality came from the sickest group of patients. LOS did not differ.
Less-experienced caregivers or delayed diagnostic testing may play a role in poor outcomes. Patients admitted on weekends might receive delayed care from the first onset of symptoms. This is important because timely therapy has been shown to influence outcomes in acute PE. Reasons for these observed differences should be explored further to help provide more consistent PE management, regardless of admission day.
Bottom line: The sickest patients with PE admitted on weekends experienced small but significantly greater 30-day mortality compared with those admitted on weekdays.
Citation: Aujesky D, Jimenez D, Mor M, Geng M, Fine M, Ibrahim S. Weekend versus weekday admission and mortality after acute pulmonary embolism. Circulation. 2009;119:962-968. TH