User login
Variation in Readmission Rates by EDs
Readmissions of Medicare beneficiaries within 30 days of discharge are frequent and costly.[1] Concern about readmissions has prompted the Centers for Medicare & Medicaid Services (CMS) to reduce payments to hospitals with excess readmissions.[2] Research has identified a number of patient clinical and socio‐demographic factors associated with readmissions.[3] However, interventions designed to reduce readmissions have met with limited success. In a systematic review, no single intervention was regularly effective in reducing readmissions, despite the fact that interventions have targeted both predischarge, transition of care, and postdischarge processes of care.[4]
The different trajectories of care experienced by patients after hospital discharge, and their effect on risk of readmission, have been incompletely studied. Although early outpatient follow‐up after discharge is associated with lower readmission rates,[5, 6] a factor that has been minimally studied is the role of the emergency department (ED) and the ED provider in readmissions. The ED and ED providers feature prominently in the care received by patients shortly after discharge from a hospital. About a quarter of all hospitalized Medicare patients are evaluated in an ED within 30 days of discharge,[7, 8] and a majority of readmissions within 30 days of discharge are precipitated by an ED visit.[9] Hence, we asked whether when a recently discharged patient is seen in an ED, does the rate of readmission vary by ED provider and by ED facility?
We used Texas Medicare claims data to examine patients visiting the ED within 30 days of discharge from an initial hospitalization to determine if their risk of readmission varies by the ED provider caring for them and by the ED facility they visit.
METHODS
Sources of Data
We used claims from the years 2007 to 2011 for 100% of Texas Medicare beneficiaries, including Medicare beneficiary summary files, Medicare Provider Analysis and Review (MedPAR) files, Outpatient Standard Analytical Files (OutSAF), and Medicare Carrier files. We obtained diagnosis‐related group associated information, including weights, and Major Diagnostic Category from CMS, and used Provider of Services files to determine facility characteristics.
Establishment of the Study Cohort
From 2008 through 2011 MedPAR files, we initially selected all hospital discharges from acute‐care hospitals in Texas. From these 3,191,160 admissions, we excluded those discharged dead or transferred to other acute‐care hospitals (N=230,343), those who were younger than 66 years at admission (N=736,685) and those without complete Parts A and B enrollment or with any health maintenance organization enrollment in the 12 months prior to and 2 months after the admission of interest (N=596,427). From the remaining 1,627,705 discharges, we identified 302,949 discharges that were followed by at least 1 ED visit within 30 days.
We applied the algorithm developed by Kaskie et al. to identify ED visits.[10] We identified claims for ED services with Current Procedural Terminology (CPT) codes 99281‐99285 from Carrier files and bundled claims with overlapping dates or those that were within 1 day of each other. Then we identified claims for ED services using the same CPT codes from OutSAF and bundled those with overlapping dates or those that were within 3 days of each other. Finally, we bundled Carrier and OutSAF claims with overlapping dates and defined them as the same ED visit. From these, we retained only the first ED visit. We excluded those receiving care from multiple ED providers during the ED visit (N=38,565), and those who had a readmission before the first ED visit (N=1436), leaving 262,948 ED visits. For patients who had more than 1 hospitalization followed by an ED visit in a given year, we selected the first hospitalization, resulting in 199,143 ED visits. We then selected ED providers associated with at least 30 ED visits in this cohort, resulting in 1922 ED providers and 174,209 ED visits. For analyses where we examined both ED provider and facility variation in admission rates, we eliminated ED providers that generated charges from more than 1 ED facility, resulting in 525 providers and 48,883 ED visits at 143 ED facilities.
Measures
Patient Characteristics
We categorized beneficiaries by age, gender, and ethnicity using Medicare beneficiary summary files. We used the Medicaid indicator as a proxy of low socioeconomic status. We obtained information on weekend admission, emergent admission, discharge destination, and diagnosis‐related groupt (DRG) from MedPAR files. We identified comorbidities using the claims from MedPAR, Carrier, and OutSAF files in the year prior to the admission.[11] We identified total hospitalizations and outpatient visits in the prior year from MedPAR files and Carrier files, respectively. We obtained education status at the level of zip code of residence from the 2011 American Community Survey estimates from the United States Census Bureau. We determined urban or rural residence using the 2013 Rural‐Urban Continuum Codes developed by the United States Department of Agriculture.
ED Facility Characteristics
We used the provider number of the ED facility to link to the Provider of Services files and obtained information on medical school affiliation, facility size, and for profit status.
Study Outcomes
The outcome of this study was readmission after an ED visit within 30 days of discharge from an initial hospitalization. We defined readmission after an ED visit as a hospitalization starting the day of or the day following the ED visit
Statistical Analyses
We performed 2‐level analyses where patients were clustered with ED providers to examine variation among ED providers. The effect of ED providers was modeled as a random effect to account for the correlation among the patients cared for by the same ED provider. We derived ED provider‐specific estimates from models adjusted for patient age, gender, race/ethnicity, rural or urban residence, Medicaid eligibility, education at the zip code level of residence, and characteristics of the initial admission (emergency admission, weekend admission, discharge destination, its major diagnostic category and DRG weight). We also adjusted for comorbidities, number of hospitalizations, and number of physician visits in the year before the initial admission.
We also conducted 2‐level analyses where patients were nested in ED facilities and 3‐level analyses where patients were nested in ED providers and ED providers were nested in ED facilities. We adjusted for all factors described above. We computed the change in the variance between 2‐level and 2‐level analyses to determine the variation in readmission rates that was explained by the ED provider and the ED facility. All analyses were performed with SAS version 9.2 (SAS Institute Inc., Cary, NC).
RESULTS
We identified 174,209 patients who visited an ED within 30 days of discharge from an initial hospitalization. Table 1 describes the characteristics of these patients as well as the readmission rates associated with these characteristics. The rate of readmission of our cohort of 1,627,705 discharges with or without a following ED visit was 16.2%, whereas the rate of readmission following an ED visit in our final cohort of 174,209 patients was 52.67%. This readmission rate increased with age, from 49.31% for patients between 66 and 70 years of age to 55.33% for patients older than 85 years. There were minor variations by gender and ethnicity. Patients residing in metropolitan areas or in zip codes with low education levels had higher readmission rates, as did those whose original admission was classified as emergency or those who were not discharged home.
| Patient Characteristic | No. of ED Visits (%) | % Readmitted | Odds Ratio (95% CI)a |
|---|---|---|---|
| MeanSD, Median (Q1Q3) | Odds Ratio (95% CI)a | ||
| |||
| Overall | 174,209 (100) | 52.67 | |
| Age, y | |||
| 6670 | 32,962 (18.92) | 49.31 | 1.00 |
| 7175 | 34,979 (20.08) | 51.48 | 1.10 (1.06‐1.13)b |
| 7680 | 36,728 (21.08) | 53.01 | 1.15 (1.12‐1.19)b |
| 8185 | 34,784 (19.97) | 54.05 | 1.19 (1.15‐1.23)b |
| >85 | 34,756 (19.95) | 55.33 | 1.25 (1.21‐1.29)b |
| Gender | |||
| Male | 71,049 (40.78) | 52.95 | 1.02 (1.00‐1.04) |
| Female | 103,160 (59.22) | 52.48 | 1.00 |
| Race | |||
| Non‐Hispanic white | 124,312 (71.36) | 52.77 | 1.00 |
| Black | 16,809 (9.65) | 51.45 | 0.84 (0.81‐0.87)b |
| Hispanic | 30,618 (17.58) | 52.70 | 0.88 (0.85‐0.91)b |
| Other | 2,470 (1.42) | 55.71 | 1.06 (0.97‐1.15) |
| Rural/urban residence | |||
| Metropolitan | 136,739 (78.49) | 53.88 | 1.00 |
| Nonmetropolitan | 35,000 (20.09) | 48.16 | 0.96 (0.93‐0.99)b |
| Rural | 2,448 (1.41) | 50.04 | 1.04 (0.95‐1.13) |
| Medicaid eligible | |||
| No | 128,909 (74.00) | 52.65 | 1.00 |
| Yes | 45,300 (26.00) | 52.72 | 0.97 (0.94‐0.99)b |
| Education levelc | |||
| 1st quartile (lowest) | 43,863 (25.18) | 54.61 | 1.00 |
| 2nd quartile | 43,316 (24.86) | 53.92 | 1.00 (0.97‐1.03) |
| 3rd quartile | 43,571 (25.01) | 50.72 | 0.99 (0.96‐1.02) |
| 4th quartile (highest) | 43,318 (24.87) | 51.98 | 1.01 (0.97‐1.04) |
| Emergency admission | |||
| No | 99,101 (56.89) | 51.15 | 1.00 |
| Yes | 75,108 (43.11) | 54.68 | 1.07 (1.05‐1.09)b |
| Weekend admission | |||
| No | 131,266 (75.35) | 52.45 | 1.00 |
| Yes | 42,943 (24.65) | 53.35 | 1.01 (0.99‐1.04) |
| Discharge destination | |||
| Home | 122,542 (70.34) | 50.90 | 1.00 |
| Inpatient rehabilitation facility | 9,512 (5.46) | 55.48 | 1.31 (1.25‐1.37)b |
| Skilled nursing facility | 37,248 (21.38) | 57.25 | 1.29 (1.26‐1.33)b |
| Other | 4,907 (2.82) | 56.88 | 1.14 (1.07‐1.21)b |
| DRG weight (per unit) | 1.561.27, 0.82 (1.16‐1.83) | 1.06 (1.05‐1.07)b | |
| Hospitalization in the prior year (per hospitalization) | 1.031.49, 0.00 (1.00‐2.00) | 1.04 (1.03‐1.04)b | |
| Physician visits in the prior year (per 10 visits) | 11.759.80, 5.00 (10.00‐17.00) | 0.97 (0.96‐0.98)b | |
Table 1 also presents the odds of readmission adjusted for all other factors in the table and also adjusted for clustering within ED providers in a 2‐level model. Increasing age, white race, metropolitan residence, nonhome discharge, higher severity of illness, more hospitalizations in the prior year, fewer physician visits in the prior year, and an emergency initial admission were each associated with a higher readmission rate.
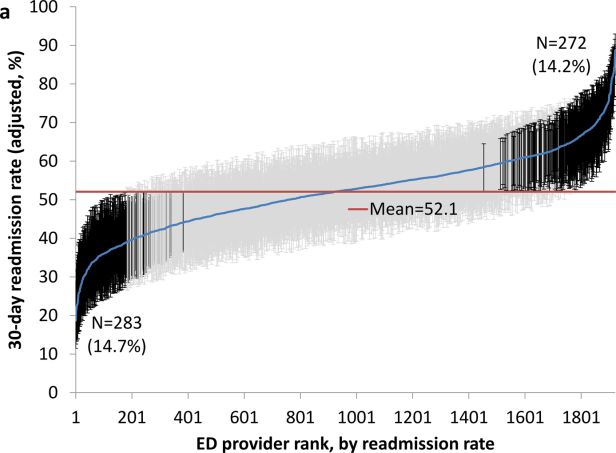
We next generated estimates of readmission rates for each ED provider from the adjusted 2‐level models. Figure 1 shows the adjusted cumulative readmission rates for the 1922 ED providers. This figure shows the mean value and 95% confidence intervals of the readmission rates for each provider. Dark vertical lines indicate providers whose readmission rate differed significantly from the mean adjusted readmission rate of 52.1% for all providers. Of the ED providers, 14.2% had significantly higher readmission rates. The mean readmission rate for these 272 providers was 67.2%. Of the ED providers, 14.7% had significantly lower readmission rates. The mean readmission rate for these 283 providers was 36.8%.

To determine the contribution of the ED facility to the variation in readmission rates, we restricted our analysis to 48,883 patients (28.06% of our cohort) seen by 525 ED providers who were associated with only 1 facility (total of 143 facilities). Table 2 describes the unadjusted readmission rates stratified by specific characteristics of those facilities. The unadjusted readmission rate increased with the size of the associated hospital, from 47.61% for hospitals with less than 100 beds to 57.06% for hospitals with more than 400 beds. The readmission rate for nonprofit facilities was 53.81% and for for‐profit facilities was 57.39%. Facilities with no medical school affiliation had a readmission rate of 54.51%, whereas those with a major affiliation had a readmission rate of 58.72%.
| ED Facility Characteristic | No. of ED Visits (%) | % Readmitted | Odds Ratio (95% CI)a |
|---|---|---|---|
| |||
| Overall | 48,883 | ||
| Total beds | |||
| 100 | 3,936 (8.05) | 47.61 | 1.00 |
| 101200 | 6,251 (12.79) | 52.07 | 1.38 (1.06‐1.81)b |
| 201400 | 13,000 (26.59) | 56.26 | 1.69 (1.32‐2.17)b |
| >400 | 25,696 (52.57) | 57.06 | 1.77 (1.35‐2.33)b |
| Type of control | |||
| Nonprofit | 24,999 (51.14) | 53.81 | 1.00 |
| Proprietary | 17,108 (35.00) | 57.39 | 1.32 (1.09‐1.61)b |
| Government | 6,776 (13.86) | 56.60 | 1.11 (0.88‐1.41) |
| Medical school affiliation | |||
| Major | 6,487 (13.27) | 58.72 | 1.00 |
| Limited | 7,066 (14.45) | 56.37 | 0.85 (0.58‐1.25) |
| Graduate | 3,164 (6.47) | 56.19 | 0.71 (0.44‐1.15) |
| No affiliation | 32,166 (65.80) | 54.51 | 0.78 (0.57‐1.05) |
| If the same hospital patient was discharged from | |||
| Yes | 38,532 (78.82) | 55.64 | 0.96 (0.91‐1.00) |
| No | 10,351 (21.18) | 54.73 | 1.00 |
With this smaller cohort, we performed 2 types of 2‐level models, where patients clustered within ED facilities and ER providers, respectively, and a 3‐level model accounting for clustering of patients within providers and of providers within facilities. From the facility‐patient 2‐level model, the variance of the ED facility was 0.2718 (95% confidence interval [CI]: 0.2083‐0.3696). From the provider‐patient 2‐level model, the variance of ED provider was 0.2532 (95% CI: 0.2166‐0.3002). However, when the 3‐level model was performed, the variance of ED provider decreased to 0.0893 (95% CI: 0.0723‐0.1132) and the variance of ED facility dropped to 0.2316 (95% CI: 0.1704‐0.3331) . This indicates 65% of the variation among ED providers was explained by the ED facility, and in contrast, 15% of the variation among ED facilities was explained by ED providers.
Table 2 also shows the adjusted odds of readmission generated from the 3‐level model. Patients receiving care in ED facilities in hospitals with more beds and in for‐profit hospitals were at higher risk for readmission. It is possible that patients seen at the ED associated with the discharging hospital had a lower risk of readmission. This finding was close to being statistically significant (P=0.051).
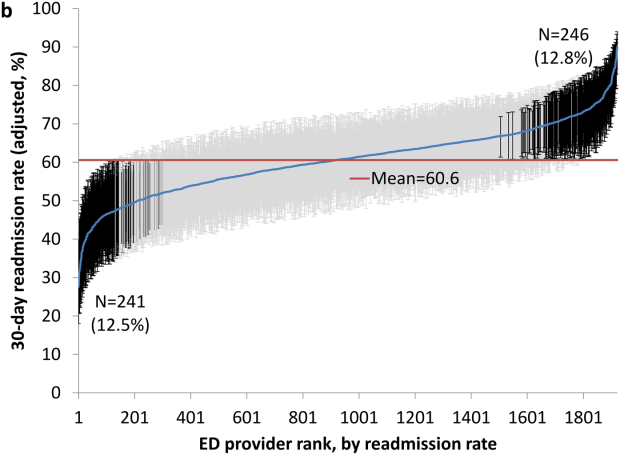
We repeated all the above analyses using an outcome of readmission anytime between the ED visit and 30 days after discharge from the initial hospitalization (rather than readmission on the day of or after the ED visit). All analyses produced results similar to the results presented above. For example, Figure 2 shows the adjusted cumulative readmission rates for the 1922 ED providers using this outcome. Of the ED providers, 12.8% had higher and 12.5% had lower readmission rates as compared to the mean readmission rate for all ED providers. The Spearman correlation coefficient between the rank of ED providers in immediate readmission rate (Figure 1) and readmission rate within 30 days of hospital discharge (Figure 2) was 0.94 (P<0.001).
DISCUSSION
This study found substantial variation in readmission rates by ED provider, despite controlling for patient clinical and sociodemographic factors. In 3‐level models, the ED facility explained a substantial part of the variation by ED provider, with patients seen at larger facilities and for‐profit facilities having higher readmission rates.
Variation among ED facilities and ED providers in readmission rates has not previously been studied. There is literature on the variation in ED facility and ED provider admission rates. As readmissions are a subset of all admissions, this literature provides context to our findings. Abualenain et al. examined admission rates for 89 ED physicians for adult patients presenting with an acute medical or surgical complaint at 3 EDs in a health system.[12] After adjusting for patient and clinical characteristics, admission rates varied from 21% to 49% among physicians and from 27% to 41% among 3 facilities. Two other studies from single hospitals have found similar variation among providers.[13, 14] The reasons for the variation among ED providers presumably relate to subjective aspects of clinical assessment and the reluctance of providers to rely solely on objective scales, even when they are available.[14, 15] Variation in admission rates among different facilities may relate to clustering of providers with similar practice styles within facilities, lack of clinical guidelines for certain conditions, as well as differences among facilities in the socioeconomic status and access to primary care of their clientele.[12, 16, 17] For example, Pines et al. have shown that ED facility admission rates are higher in communities with fewer primary care physicians per capita and are influenced by the prevailing county level admission rates.[16] Capp et al. showed persistent variation in admission rates across hospitals, despite adjusting for clinical criteria such as vital signs, chief complaints, and severity of illness.[18]
Structural differences in ED facilities may also influence the decision to admit. We found that patients visiting ED facilities in hospitals with more beds had a higher readmission rate. ED facility systems of care such as observation units or protocols are associated with lower admission rates.[19, 20] Finally, certain hospitals may actively influence the admission practice patterns of their ED providers. We noted that patients seen at for‐profit ED facilities had a greater risk of readmission. A similar finding has been described by Pines et al., who noted higher admission rates at for‐profit facilities.[16] In an extreme example, a recent Justice Department lawsuit alleged that a for‐profit hospital chain used software systems and financial incentives to ED providers to increase admissions.[21]
It is possible that the providers with low readmission rates may have inappropriately released patients who truly should have been admitted. A signal that this occurred would be if these patients were readmitted in the days after the ED visits. We examined this possibility by additionally examining readmissions occurring anytime between the ED visit until 30 days after discharge from the initial hospitalization. The results were similar to when we only included readmissions that occurred immediately following the ED visit, with a very high correlation (r=0.94) between the ranking of the ED providers by readmission rates in both circumstances. This suggests that the decisions of the ED providers with low readmission rates to admit or release from the ED were likely appropriate.
Our research has limitations. We studied patients with fee‐for‐service Medicare in a single large state in the United States over a 4‐year period. Our findings may not be generalizable to younger patient populations, other regions with different sociodemographic patterns and healthcare systems, or other time periods. We could not control for many factors that may impact the risk of readmission but are not measured in Medicare databases (eg, clinical data such as vital signs, measures of quality of transition from discharging hospital, ED provider workload). To attribute care to a single ED provider, we excluded patients who were taken care of by multiple ED providers. These patients may have different needs from our study population (eg, more complex issues and longer stays in the ED) and may bias our results.
This study provides a new direction for research and quality improvement targeting readmissions. Research should extend beyond the discharge transition and examine the entire trajectory of posthospitalization care to better understand readmissions. Based directly on this study, research could investigate the practice patterns of ED providers and systems of care at ED facilities that affect readmissions rates. Such investigation could inform quality improvement efforts to standardize care for patients in the ED.
CMS policies hold hospitals accountable for readmissions of the patients they discharge, but do not address the admission process in the ED that leads to readmissions of recently discharged patients. Given the present study, and the fact that the proportion of all hospital admissions that occur through the ED has grown to 44%,[22] consideration of the role of the ED in public policy efforts to discourage unnecessary inpatient care may be appropriate.
In summary, this study shows that a recently discharged patient's chances of being readmitted depends partly on the ED provider who evaluates them and on the ED facility at which they seek care. ED provider practice patterns and ED facility systems of care may be a target for interventions aimed at decreasing readmission rates.
Disclosures
This research was supported by grants from the National Institutes of Health (AG033134 and K05CA134923) and from the Agency for Healthcare Research and Quality (R24H5022134). The authors report no conflicts of interest.
- , , Rehospitalizations among patients in the Medicare Fee‐for‐Service Program. N Engl J Med. 2009;360:1418–1428.
- Centers for Medicare 306:1688–1698.
- , , , , Interventions to reduce 30‐day rehospitalization: a systematic review. Ann Intern Med. 2011;155:520–528.
- , , , , Outpatient follow‐up visit and 30‐day emergency department visit and readmission in patients hospitalized for chronic obstructive pulmonary disease. Arch Intern Med. 2010;170:1664–1670.
- , , , et al. Relationship between early physician follow‐up and 30‐day readmission among Medicare beneficiaries hospitalized for heart failure. JAMA. 2010;303:1716–1722.
- , , After hospitalization: a Dartmouth Atlas report on post‐acute care for Medicare beneficiaries. Dartmouth Atlas website. Available at: www.dartmouthatlas.org/downloads/reports/Post_discharge_events_092811.pdf. Accessed August 8, 2013.
- , , , Emergency department visits after hospital discharge: a missing part of the equation. Ann Emerg Med. 2013;62:145–150.
- , , , Emergency department visits after surgery are common for Medicare patients, suggesting opportunities to improve care. Health Aff (Millwood). 2013;32:1600–1607.
- , , , et al. Defining emergency department episodes by severity and intensity: a 15‐year study of Medicare beneficiaries. BMC Health Serv Res. 2010;10:1–13.
- , , , Comorbidity measures for use with administrative data. Med Care. 1998;36:8–27.
- , , , , , Emergency department physician‐level and hospital‐level variation in admission rates. Ann Emerg Med. 2013;61:638–643.
- , , , et al. Hospital admission decision for patients with community‐acquired pneumonia: variability among physicians in an emergency department. Ann Emerg Med. 2012;59:35–41.
- , , Individual emergency physician admission rates: predictably unpredictable. CJEM. 2009;11(2):149–155.
- , , , , , Reasons why emergency department providers do not rely on the pneumonia severity index to determine the initial site of treatment for patients with pneumonia. Clin Infect Dis. 2009;49:e100–e108.
- , , Variation in emergency department admission rates across the United States. Med Care Res Rev. 2013;70:218–231.
- , , , , , Variation in US hospital emergency department admission rates by clinical condition. Med Care. 2015;53:237–244.
- , , , et al. Hospital variation in risk‐standardized hospital admission rates from US EDs among adults. Am J Emerg Med. 2014;32:837–843.
- , , The effect of an observation unit on the rate of ED admission and discharge for pyelonephritis. Am J Emerg Med. 2010;28:682–688.
- , , , , , Protocol‐driven emergency department observation units offer savings, shorter stays, and reduced admissions. Health Aff (Millwood). 2013;32:2149–2156.
- , Hospital chain said to scheme to inflate bills. New York Times. January 23, 2014. Available at: http://www.nytimes.com/2014/01/24/business/hospital‐chain‐said‐to‐scheme‐to‐inflate‐bills.html?emc=eta1367:391–393.
Readmissions of Medicare beneficiaries within 30 days of discharge are frequent and costly.[1] Concern about readmissions has prompted the Centers for Medicare & Medicaid Services (CMS) to reduce payments to hospitals with excess readmissions.[2] Research has identified a number of patient clinical and socio‐demographic factors associated with readmissions.[3] However, interventions designed to reduce readmissions have met with limited success. In a systematic review, no single intervention was regularly effective in reducing readmissions, despite the fact that interventions have targeted both predischarge, transition of care, and postdischarge processes of care.[4]
The different trajectories of care experienced by patients after hospital discharge, and their effect on risk of readmission, have been incompletely studied. Although early outpatient follow‐up after discharge is associated with lower readmission rates,[5, 6] a factor that has been minimally studied is the role of the emergency department (ED) and the ED provider in readmissions. The ED and ED providers feature prominently in the care received by patients shortly after discharge from a hospital. About a quarter of all hospitalized Medicare patients are evaluated in an ED within 30 days of discharge,[7, 8] and a majority of readmissions within 30 days of discharge are precipitated by an ED visit.[9] Hence, we asked whether when a recently discharged patient is seen in an ED, does the rate of readmission vary by ED provider and by ED facility?
We used Texas Medicare claims data to examine patients visiting the ED within 30 days of discharge from an initial hospitalization to determine if their risk of readmission varies by the ED provider caring for them and by the ED facility they visit.
METHODS
Sources of Data
We used claims from the years 2007 to 2011 for 100% of Texas Medicare beneficiaries, including Medicare beneficiary summary files, Medicare Provider Analysis and Review (MedPAR) files, Outpatient Standard Analytical Files (OutSAF), and Medicare Carrier files. We obtained diagnosis‐related group associated information, including weights, and Major Diagnostic Category from CMS, and used Provider of Services files to determine facility characteristics.
Establishment of the Study Cohort
From 2008 through 2011 MedPAR files, we initially selected all hospital discharges from acute‐care hospitals in Texas. From these 3,191,160 admissions, we excluded those discharged dead or transferred to other acute‐care hospitals (N=230,343), those who were younger than 66 years at admission (N=736,685) and those without complete Parts A and B enrollment or with any health maintenance organization enrollment in the 12 months prior to and 2 months after the admission of interest (N=596,427). From the remaining 1,627,705 discharges, we identified 302,949 discharges that were followed by at least 1 ED visit within 30 days.
We applied the algorithm developed by Kaskie et al. to identify ED visits.[10] We identified claims for ED services with Current Procedural Terminology (CPT) codes 99281‐99285 from Carrier files and bundled claims with overlapping dates or those that were within 1 day of each other. Then we identified claims for ED services using the same CPT codes from OutSAF and bundled those with overlapping dates or those that were within 3 days of each other. Finally, we bundled Carrier and OutSAF claims with overlapping dates and defined them as the same ED visit. From these, we retained only the first ED visit. We excluded those receiving care from multiple ED providers during the ED visit (N=38,565), and those who had a readmission before the first ED visit (N=1436), leaving 262,948 ED visits. For patients who had more than 1 hospitalization followed by an ED visit in a given year, we selected the first hospitalization, resulting in 199,143 ED visits. We then selected ED providers associated with at least 30 ED visits in this cohort, resulting in 1922 ED providers and 174,209 ED visits. For analyses where we examined both ED provider and facility variation in admission rates, we eliminated ED providers that generated charges from more than 1 ED facility, resulting in 525 providers and 48,883 ED visits at 143 ED facilities.
Measures
Patient Characteristics
We categorized beneficiaries by age, gender, and ethnicity using Medicare beneficiary summary files. We used the Medicaid indicator as a proxy of low socioeconomic status. We obtained information on weekend admission, emergent admission, discharge destination, and diagnosis‐related groupt (DRG) from MedPAR files. We identified comorbidities using the claims from MedPAR, Carrier, and OutSAF files in the year prior to the admission.[11] We identified total hospitalizations and outpatient visits in the prior year from MedPAR files and Carrier files, respectively. We obtained education status at the level of zip code of residence from the 2011 American Community Survey estimates from the United States Census Bureau. We determined urban or rural residence using the 2013 Rural‐Urban Continuum Codes developed by the United States Department of Agriculture.
ED Facility Characteristics
We used the provider number of the ED facility to link to the Provider of Services files and obtained information on medical school affiliation, facility size, and for profit status.
Study Outcomes
The outcome of this study was readmission after an ED visit within 30 days of discharge from an initial hospitalization. We defined readmission after an ED visit as a hospitalization starting the day of or the day following the ED visit
Statistical Analyses
We performed 2‐level analyses where patients were clustered with ED providers to examine variation among ED providers. The effect of ED providers was modeled as a random effect to account for the correlation among the patients cared for by the same ED provider. We derived ED provider‐specific estimates from models adjusted for patient age, gender, race/ethnicity, rural or urban residence, Medicaid eligibility, education at the zip code level of residence, and characteristics of the initial admission (emergency admission, weekend admission, discharge destination, its major diagnostic category and DRG weight). We also adjusted for comorbidities, number of hospitalizations, and number of physician visits in the year before the initial admission.
We also conducted 2‐level analyses where patients were nested in ED facilities and 3‐level analyses where patients were nested in ED providers and ED providers were nested in ED facilities. We adjusted for all factors described above. We computed the change in the variance between 2‐level and 2‐level analyses to determine the variation in readmission rates that was explained by the ED provider and the ED facility. All analyses were performed with SAS version 9.2 (SAS Institute Inc., Cary, NC).
RESULTS
We identified 174,209 patients who visited an ED within 30 days of discharge from an initial hospitalization. Table 1 describes the characteristics of these patients as well as the readmission rates associated with these characteristics. The rate of readmission of our cohort of 1,627,705 discharges with or without a following ED visit was 16.2%, whereas the rate of readmission following an ED visit in our final cohort of 174,209 patients was 52.67%. This readmission rate increased with age, from 49.31% for patients between 66 and 70 years of age to 55.33% for patients older than 85 years. There were minor variations by gender and ethnicity. Patients residing in metropolitan areas or in zip codes with low education levels had higher readmission rates, as did those whose original admission was classified as emergency or those who were not discharged home.
| Patient Characteristic | No. of ED Visits (%) | % Readmitted | Odds Ratio (95% CI)a |
|---|---|---|---|
| MeanSD, Median (Q1Q3) | Odds Ratio (95% CI)a | ||
| |||
| Overall | 174,209 (100) | 52.67 | |
| Age, y | |||
| 6670 | 32,962 (18.92) | 49.31 | 1.00 |
| 7175 | 34,979 (20.08) | 51.48 | 1.10 (1.06‐1.13)b |
| 7680 | 36,728 (21.08) | 53.01 | 1.15 (1.12‐1.19)b |
| 8185 | 34,784 (19.97) | 54.05 | 1.19 (1.15‐1.23)b |
| >85 | 34,756 (19.95) | 55.33 | 1.25 (1.21‐1.29)b |
| Gender | |||
| Male | 71,049 (40.78) | 52.95 | 1.02 (1.00‐1.04) |
| Female | 103,160 (59.22) | 52.48 | 1.00 |
| Race | |||
| Non‐Hispanic white | 124,312 (71.36) | 52.77 | 1.00 |
| Black | 16,809 (9.65) | 51.45 | 0.84 (0.81‐0.87)b |
| Hispanic | 30,618 (17.58) | 52.70 | 0.88 (0.85‐0.91)b |
| Other | 2,470 (1.42) | 55.71 | 1.06 (0.97‐1.15) |
| Rural/urban residence | |||
| Metropolitan | 136,739 (78.49) | 53.88 | 1.00 |
| Nonmetropolitan | 35,000 (20.09) | 48.16 | 0.96 (0.93‐0.99)b |
| Rural | 2,448 (1.41) | 50.04 | 1.04 (0.95‐1.13) |
| Medicaid eligible | |||
| No | 128,909 (74.00) | 52.65 | 1.00 |
| Yes | 45,300 (26.00) | 52.72 | 0.97 (0.94‐0.99)b |
| Education levelc | |||
| 1st quartile (lowest) | 43,863 (25.18) | 54.61 | 1.00 |
| 2nd quartile | 43,316 (24.86) | 53.92 | 1.00 (0.97‐1.03) |
| 3rd quartile | 43,571 (25.01) | 50.72 | 0.99 (0.96‐1.02) |
| 4th quartile (highest) | 43,318 (24.87) | 51.98 | 1.01 (0.97‐1.04) |
| Emergency admission | |||
| No | 99,101 (56.89) | 51.15 | 1.00 |
| Yes | 75,108 (43.11) | 54.68 | 1.07 (1.05‐1.09)b |
| Weekend admission | |||
| No | 131,266 (75.35) | 52.45 | 1.00 |
| Yes | 42,943 (24.65) | 53.35 | 1.01 (0.99‐1.04) |
| Discharge destination | |||
| Home | 122,542 (70.34) | 50.90 | 1.00 |
| Inpatient rehabilitation facility | 9,512 (5.46) | 55.48 | 1.31 (1.25‐1.37)b |
| Skilled nursing facility | 37,248 (21.38) | 57.25 | 1.29 (1.26‐1.33)b |
| Other | 4,907 (2.82) | 56.88 | 1.14 (1.07‐1.21)b |
| DRG weight (per unit) | 1.561.27, 0.82 (1.16‐1.83) | 1.06 (1.05‐1.07)b | |
| Hospitalization in the prior year (per hospitalization) | 1.031.49, 0.00 (1.00‐2.00) | 1.04 (1.03‐1.04)b | |
| Physician visits in the prior year (per 10 visits) | 11.759.80, 5.00 (10.00‐17.00) | 0.97 (0.96‐0.98)b | |
Table 1 also presents the odds of readmission adjusted for all other factors in the table and also adjusted for clustering within ED providers in a 2‐level model. Increasing age, white race, metropolitan residence, nonhome discharge, higher severity of illness, more hospitalizations in the prior year, fewer physician visits in the prior year, and an emergency initial admission were each associated with a higher readmission rate.
We next generated estimates of readmission rates for each ED provider from the adjusted 2‐level models. Figure 1 shows the adjusted cumulative readmission rates for the 1922 ED providers. This figure shows the mean value and 95% confidence intervals of the readmission rates for each provider. Dark vertical lines indicate providers whose readmission rate differed significantly from the mean adjusted readmission rate of 52.1% for all providers. Of the ED providers, 14.2% had significantly higher readmission rates. The mean readmission rate for these 272 providers was 67.2%. Of the ED providers, 14.7% had significantly lower readmission rates. The mean readmission rate for these 283 providers was 36.8%.
To determine the contribution of the ED facility to the variation in readmission rates, we restricted our analysis to 48,883 patients (28.06% of our cohort) seen by 525 ED providers who were associated with only 1 facility (total of 143 facilities). Table 2 describes the unadjusted readmission rates stratified by specific characteristics of those facilities. The unadjusted readmission rate increased with the size of the associated hospital, from 47.61% for hospitals with less than 100 beds to 57.06% for hospitals with more than 400 beds. The readmission rate for nonprofit facilities was 53.81% and for for‐profit facilities was 57.39%. Facilities with no medical school affiliation had a readmission rate of 54.51%, whereas those with a major affiliation had a readmission rate of 58.72%.
| ED Facility Characteristic | No. of ED Visits (%) | % Readmitted | Odds Ratio (95% CI)a |
|---|---|---|---|
| |||
| Overall | 48,883 | ||
| Total beds | |||
| 100 | 3,936 (8.05) | 47.61 | 1.00 |
| 101200 | 6,251 (12.79) | 52.07 | 1.38 (1.06‐1.81)b |
| 201400 | 13,000 (26.59) | 56.26 | 1.69 (1.32‐2.17)b |
| >400 | 25,696 (52.57) | 57.06 | 1.77 (1.35‐2.33)b |
| Type of control | |||
| Nonprofit | 24,999 (51.14) | 53.81 | 1.00 |
| Proprietary | 17,108 (35.00) | 57.39 | 1.32 (1.09‐1.61)b |
| Government | 6,776 (13.86) | 56.60 | 1.11 (0.88‐1.41) |
| Medical school affiliation | |||
| Major | 6,487 (13.27) | 58.72 | 1.00 |
| Limited | 7,066 (14.45) | 56.37 | 0.85 (0.58‐1.25) |
| Graduate | 3,164 (6.47) | 56.19 | 0.71 (0.44‐1.15) |
| No affiliation | 32,166 (65.80) | 54.51 | 0.78 (0.57‐1.05) |
| If the same hospital patient was discharged from | |||
| Yes | 38,532 (78.82) | 55.64 | 0.96 (0.91‐1.00) |
| No | 10,351 (21.18) | 54.73 | 1.00 |
With this smaller cohort, we performed 2 types of 2‐level models, where patients clustered within ED facilities and ER providers, respectively, and a 3‐level model accounting for clustering of patients within providers and of providers within facilities. From the facility‐patient 2‐level model, the variance of the ED facility was 0.2718 (95% confidence interval [CI]: 0.2083‐0.3696). From the provider‐patient 2‐level model, the variance of ED provider was 0.2532 (95% CI: 0.2166‐0.3002). However, when the 3‐level model was performed, the variance of ED provider decreased to 0.0893 (95% CI: 0.0723‐0.1132) and the variance of ED facility dropped to 0.2316 (95% CI: 0.1704‐0.3331) . This indicates 65% of the variation among ED providers was explained by the ED facility, and in contrast, 15% of the variation among ED facilities was explained by ED providers.
Table 2 also shows the adjusted odds of readmission generated from the 3‐level model. Patients receiving care in ED facilities in hospitals with more beds and in for‐profit hospitals were at higher risk for readmission. It is possible that patients seen at the ED associated with the discharging hospital had a lower risk of readmission. This finding was close to being statistically significant (P=0.051).
We repeated all the above analyses using an outcome of readmission anytime between the ED visit and 30 days after discharge from the initial hospitalization (rather than readmission on the day of or after the ED visit). All analyses produced results similar to the results presented above. For example, Figure 2 shows the adjusted cumulative readmission rates for the 1922 ED providers using this outcome. Of the ED providers, 12.8% had higher and 12.5% had lower readmission rates as compared to the mean readmission rate for all ED providers. The Spearman correlation coefficient between the rank of ED providers in immediate readmission rate (Figure 1) and readmission rate within 30 days of hospital discharge (Figure 2) was 0.94 (P<0.001).
DISCUSSION
This study found substantial variation in readmission rates by ED provider, despite controlling for patient clinical and sociodemographic factors. In 3‐level models, the ED facility explained a substantial part of the variation by ED provider, with patients seen at larger facilities and for‐profit facilities having higher readmission rates.
Variation among ED facilities and ED providers in readmission rates has not previously been studied. There is literature on the variation in ED facility and ED provider admission rates. As readmissions are a subset of all admissions, this literature provides context to our findings. Abualenain et al. examined admission rates for 89 ED physicians for adult patients presenting with an acute medical or surgical complaint at 3 EDs in a health system.[12] After adjusting for patient and clinical characteristics, admission rates varied from 21% to 49% among physicians and from 27% to 41% among 3 facilities. Two other studies from single hospitals have found similar variation among providers.[13, 14] The reasons for the variation among ED providers presumably relate to subjective aspects of clinical assessment and the reluctance of providers to rely solely on objective scales, even when they are available.[14, 15] Variation in admission rates among different facilities may relate to clustering of providers with similar practice styles within facilities, lack of clinical guidelines for certain conditions, as well as differences among facilities in the socioeconomic status and access to primary care of their clientele.[12, 16, 17] For example, Pines et al. have shown that ED facility admission rates are higher in communities with fewer primary care physicians per capita and are influenced by the prevailing county level admission rates.[16] Capp et al. showed persistent variation in admission rates across hospitals, despite adjusting for clinical criteria such as vital signs, chief complaints, and severity of illness.[18]
Structural differences in ED facilities may also influence the decision to admit. We found that patients visiting ED facilities in hospitals with more beds had a higher readmission rate. ED facility systems of care such as observation units or protocols are associated with lower admission rates.[19, 20] Finally, certain hospitals may actively influence the admission practice patterns of their ED providers. We noted that patients seen at for‐profit ED facilities had a greater risk of readmission. A similar finding has been described by Pines et al., who noted higher admission rates at for‐profit facilities.[16] In an extreme example, a recent Justice Department lawsuit alleged that a for‐profit hospital chain used software systems and financial incentives to ED providers to increase admissions.[21]
It is possible that the providers with low readmission rates may have inappropriately released patients who truly should have been admitted. A signal that this occurred would be if these patients were readmitted in the days after the ED visits. We examined this possibility by additionally examining readmissions occurring anytime between the ED visit until 30 days after discharge from the initial hospitalization. The results were similar to when we only included readmissions that occurred immediately following the ED visit, with a very high correlation (r=0.94) between the ranking of the ED providers by readmission rates in both circumstances. This suggests that the decisions of the ED providers with low readmission rates to admit or release from the ED were likely appropriate.
Our research has limitations. We studied patients with fee‐for‐service Medicare in a single large state in the United States over a 4‐year period. Our findings may not be generalizable to younger patient populations, other regions with different sociodemographic patterns and healthcare systems, or other time periods. We could not control for many factors that may impact the risk of readmission but are not measured in Medicare databases (eg, clinical data such as vital signs, measures of quality of transition from discharging hospital, ED provider workload). To attribute care to a single ED provider, we excluded patients who were taken care of by multiple ED providers. These patients may have different needs from our study population (eg, more complex issues and longer stays in the ED) and may bias our results.
This study provides a new direction for research and quality improvement targeting readmissions. Research should extend beyond the discharge transition and examine the entire trajectory of posthospitalization care to better understand readmissions. Based directly on this study, research could investigate the practice patterns of ED providers and systems of care at ED facilities that affect readmissions rates. Such investigation could inform quality improvement efforts to standardize care for patients in the ED.
CMS policies hold hospitals accountable for readmissions of the patients they discharge, but do not address the admission process in the ED that leads to readmissions of recently discharged patients. Given the present study, and the fact that the proportion of all hospital admissions that occur through the ED has grown to 44%,[22] consideration of the role of the ED in public policy efforts to discourage unnecessary inpatient care may be appropriate.
In summary, this study shows that a recently discharged patient's chances of being readmitted depends partly on the ED provider who evaluates them and on the ED facility at which they seek care. ED provider practice patterns and ED facility systems of care may be a target for interventions aimed at decreasing readmission rates.
Disclosures
This research was supported by grants from the National Institutes of Health (AG033134 and K05CA134923) and from the Agency for Healthcare Research and Quality (R24H5022134). The authors report no conflicts of interest.
- , , Rehospitalizations among patients in the Medicare Fee‐for‐Service Program. N Engl J Med. 2009;360:1418–1428.
- Centers for Medicare 306:1688–1698.
- , , , , Interventions to reduce 30‐day rehospitalization: a systematic review. Ann Intern Med. 2011;155:520–528.
- , , , , Outpatient follow‐up visit and 30‐day emergency department visit and readmission in patients hospitalized for chronic obstructive pulmonary disease. Arch Intern Med. 2010;170:1664–1670.
- , , , et al. Relationship between early physician follow‐up and 30‐day readmission among Medicare beneficiaries hospitalized for heart failure. JAMA. 2010;303:1716–1722.
- , , After hospitalization: a Dartmouth Atlas report on post‐acute care for Medicare beneficiaries. Dartmouth Atlas website. Available at: www.dartmouthatlas.org/downloads/reports/Post_discharge_events_092811.pdf. Accessed August 8, 2013.
- , , , Emergency department visits after hospital discharge: a missing part of the equation. Ann Emerg Med. 2013;62:145–150.
- , , , Emergency department visits after surgery are common for Medicare patients, suggesting opportunities to improve care. Health Aff (Millwood). 2013;32:1600–1607.
- , , , et al. Defining emergency department episodes by severity and intensity: a 15‐year study of Medicare beneficiaries. BMC Health Serv Res. 2010;10:1–13.
- , , , Comorbidity measures for use with administrative data. Med Care. 1998;36:8–27.
- , , , , , Emergency department physician‐level and hospital‐level variation in admission rates. Ann Emerg Med. 2013;61:638–643.
- , , , et al. Hospital admission decision for patients with community‐acquired pneumonia: variability among physicians in an emergency department. Ann Emerg Med. 2012;59:35–41.
- , , Individual emergency physician admission rates: predictably unpredictable. CJEM. 2009;11(2):149–155.
- , , , , , Reasons why emergency department providers do not rely on the pneumonia severity index to determine the initial site of treatment for patients with pneumonia. Clin Infect Dis. 2009;49:e100–e108.
- , , Variation in emergency department admission rates across the United States. Med Care Res Rev. 2013;70:218–231.
- , , , , , Variation in US hospital emergency department admission rates by clinical condition. Med Care. 2015;53:237–244.
- , , , et al. Hospital variation in risk‐standardized hospital admission rates from US EDs among adults. Am J Emerg Med. 2014;32:837–843.
- , , The effect of an observation unit on the rate of ED admission and discharge for pyelonephritis. Am J Emerg Med. 2010;28:682–688.
- , , , , , Protocol‐driven emergency department observation units offer savings, shorter stays, and reduced admissions. Health Aff (Millwood). 2013;32:2149–2156.
- , Hospital chain said to scheme to inflate bills. New York Times. January 23, 2014. Available at: http://www.nytimes.com/2014/01/24/business/hospital‐chain‐said‐to‐scheme‐to‐inflate‐bills.html?emc=eta1367:391–393.
© 2015 Society of Hospital Medicine
PCPs Who Adopted the Hospitalist Model
Although primary care physicians (PCPs) have traditionally treated patients in both ambulatory and hospital settings, many relinquished inpatient duties to hospitalists in recent decades.[1] Little is known about the PCPs who relinquished inpatient care duties or how the transition to the hospitalist model occurred. For example, what are the characteristics of PCPs who change? Do PCPs adopt the hospitalist model enthusiastically or cautiously? Characterizing PCPs who adopted the hospitalist model can help hospitalists understand their specialty's history and also inform health services research.
Much of the interest in the hospitalist model has been generated by studies reporting improved outcomes and lower hospital lengths of stay associated with hospitalist care.[2, 3, 4, 5] Conversely, detractors of the model point to reports of higher postacute care utilization among hospitalist patients.[6] Although these studies usually adjusted for differences among patients and hospitals, they did not account for PCP characteristics. As patients' access to PCPs and their PCP's capabilities are both plausible factors that could influence hospital length of stay (eg, decisions to complete more or less of a workup in the hospital), quality of care transitions, and postdischarge utilization, it is important to determine if PCPs who use hospitalists differ systematically from those who do not to correctly interpret health system utilization patterns that currently are attributed only to hospitalists.[7, 8]
We conducted this study to determine if observable PCP factors are associated with patients' use of hospitalists and to describe the trajectory by which PCPs referred their patients to hospitalists over time.
METHODS
Source of Data
We used claims data from 100% of Texas Medicare beneficiaries from 2000 to 2009, including Medicare beneficiary summary files, Medicare Provider Analysis and Review (MedPAR) files, Outpatient Standard Analytical Files (OutSAF), and Medicare Carrier files. Diagnosis related group (DRG)‐associated information, including weights, and Major Diagnostic Categories, were obtained from Centers for Medicare & Medicaid Services (
Establishment of the Study Cohort
Using the MedPAR file, we first selected hospital admissions from acute care hospitals in Texas for each year of the study period. We excluded beneficiaries younger than 66 years old, with incomplete Medicare Parts A and B enrollment, or with any health maintenance organization enrollment in the 12 months prior to the admission of interest. For patients with more than 1 admission in a given year, we randomly selected 1 admission. We then attempted to assign each patient to a PCP. We defined a PCP as a generalist (general practitioner, family physician, internist, or geriatrician) who saw a given beneficiary on 3 or more occasions in an outpatient setting in the year prior to the admission of interest.[9] We identified outpatient visits using Current Procedural Terminology (CPT) codes 99201 to 99205 (new patient encounters), and 99211 to 99215 (established patient encounters) from Carrier files. If more than 1 generalist physician saw the beneficiary on 3 or more occasions in a given year, the physician with more than 75% of the total outpatient evaluation and management (E&M) billings was classified as the beneficiary's PCP. Using these criteria, approximately 66% of patients were assigned to a PCP.
For cross‐sectional analyses, we restricted our cohort to beneficiaries whose PCPs were associated with at least 20 inpatients in a given year. To study trends in PCP practice patterns over time, we further restricted the cohort to beneficiaries whose PCPs were associated with at least 20 inpatients in every year of the study period, resulting in 1172 PCPs for the trajectory analyses. The reliability of PCPs' practice profiles increases as the number of patients in their panel increases. We chose 20 inpatients as the minimum because PCPs with 20 hospitalized patients per study year would achieve a reliability of 0.9 for estimating the proportion of their patients that received care from hospitalists.[10]
Identification of Hospitalists
We defined hospitalists as generalists who had at least 100 E&M billings in a given year and generated at least 90% of their total E&M billings in the year from inpatient services.[1] Inpatient E&M billings were identified by CPT codes 99221 to 99223 (new or established patient encounters), 99231 to 99233 (subsequent hospital care), and 99251 to 99255 (inpatient consultations).[1]
Patient Measures
Patient demographic information including, age at admission, gender, race/ethnicity, and Medicaid eligibility were obtained from Medicare beneficiary summary files. We used the Medicaid indicator as a proxy for low socioeconomic status. Information on weekday versus weekend admission, emergent admission, and DRG were obtained from MedPAR files. The DRG category (circulatory system, digestive system, infectious disease, nervous system, respiratory system, or other) was determined based on its Major Diagnostic Category. We determined residence in a nursing facility in the 3 months before the admission of interest from the MedPAR files and by E&M codes 99304 to 99318 (nursing facility services) from Carrier files.[11] Comorbidities were identified using the claims from MedPAR, Carrier, and OutSAF files in the year prior to the admission of interest.[12] Total hospitalizations and outpatient visits in the prior year were identified from MedPAR files and Carrier files, respectively.
PCP Measures
We categorized PCPs by specialty (general practice, gamily practice, geriatric medicine, or internal medicine), years in practice, gender, US‐ versus foreign‐trained, metropolitan statistical area (MSA) of their practice location, and board certification status. The specialty was identified from Carrier files and the other information from AMA data. For each PCP, the total number of outpatient visits and total number of patients seen as outpatients in each year was calculated based on E&M codes (9920199205, 9921199215) from Carrier files. For each year, we computed the average outpatient age, gender, race, and outpatient comorbidity for each PCP's patient panel. We computed hospital volumes using the number of hospitalized patients associated with each PCP in the study cohort.
Study Outcome
To determine whether hospitalized patients received care from hospitalists during a given hospitalization, we identified all inpatient E&M bills from generalist physicians during the admission of interest by linking MedPAR and Carrier files. If more than 50% of the generalist inpatient E&M billings from generalist physicians were from 1 or more hospitalists, the patient was considered to have received care from hospitalists.
Statistical Analyses
Multilevel analyses were used to account for the clustering of patients within PCPs. All multilevel models were adjusted for patient characteristics including age, race/ethnicity, gender, Medicaid eligibility, emergency admission, weekend admission, DRG weight, DRG category, any nursing home stay in the prior 3 months, number of comorbidities, number of hospitalizations, and number of physician visits in the year prior to the admission of interest. To analyze trends in practice patterns, we first used multilevel models to calculate the proportions of inpatients cared for by hospitalists each year for each of the 1172 PCPs with at least 20 patients. Then we employed an SAS procedure (PROC TRAJ) developed by Jones et al. to classify these PCPs into groups based on their trajectories.[13] This group‐based trajectory modeling allowed us to identify relatively homogeneous clusters within a heterogeneous sample population.[14] We chose a model that classified the PCPs into 4 groups.[15] With 4 groups, the average of the posterior probabilities of group membership for the PCPs assigned to each group exceeded 0.93, indicating a low rate of misclassification among these 4 distinct groups. For the 1172 PCPs, we tested interactions between year of hospitalization and PCP characteristics while adjusting for patient characteristics in order to investigate whether or not the impacts of PCP characteristics on how likely their patients being cared for by hospitalists differed with time. All analyses were performed with SAS version 9.2 (SAS Institute Inc., Cary, NC).
RESULTS
During the 2001 through 2009 study period, between 2252 and 2848 PCPs were associated with at least 20 hospitalized beneficiaries in any single year. Among these, 1172 PCPs were associated with at least 20 hospitalized beneficiaries in every year of the study period. These 1172 PCPs were associated with 608,686 hospitalizations over the 9 years.
Table 1 presents the characteristics of the PCPs who contributed to the cross‐sectional analyses in 2001 (N=2252) and 2009 (N=2387), as well as the 1172 PCPs for whom we had data for all 9 years for the longitudinal analyses. Most PCPs were male, trained in the United States, and were board certified. The average number of Medicare patients seen by these PCPs and number of outpatient Medicare visits went up about 7% between 2001 and 2009.
| PCP Characteristics | Cross‐Sectional Analysis | Trajectory Analysis, 20012009 | |
|---|---|---|---|
| 2001 | 2009 | ||
| |||
| Overall, no. (%) | 2,252 (100%) | 2,387 (100%) | 1,172 (100%) |
| Specialty, no. (%) | |||
| General practice | 39 (1.7%) | 34 (1.4%) | 15 (1.3%) |
| Family practice | 948 (42.1%) | 1,089 (45.6%) | 466 (39.8%) |
| Internal medicine | 1,255 (55.7%) | 1,249 (52.3%) | 688 (58.7%) |
| Geriatrics | 10 (0.4%) | 15 (0.6%) | 3 (0.3%) |
| Gender, no. (%) | |||
| Male | 1,990 (88.4%) | 2,015 (84.4%) | 1,072 (91.5%) |
| Female | 262 (11.6%) | 372 (15.6%) | 100 (8.5%) |
| Trained in the United States, no. (%) | |||
| Yes | 1,669 (74.1%) | 1,738 (72.8%) | 844 (72.0%) |
| No | 583 (25.9%) | 649 (27.2%) | 328 (28.0%) |
| Metropolitan statistical area, no. (%) | |||
| 99,999 or less | 417 (17.5) | 237 (20.2) | |
| 100,000249,000 | 438 (18.3) | 234 (20.0) | |
| 250,000999,999 | 381 (16.0) | 216 (18.4) | |
| 1,000,000 or more | 1,151 (48.2) | 485 (41.4) | |
| Board certification, no. (%) | |||
| Yes | 1,657 (69.4%) | 800 (68.3%) | |
| No | 730 (30.6%) | 372 (31.7%) | |
| Years in practice, 2001, meanSD (Q1Q3) | 22.310.6 (15.028.0) | 21.28.9 (15.027.0) | |
| Years in practice, 2009, meanSD (Q1Q3) | 25.010.2 (17.032.0) | 29.28.9 (23.035.0) | |
| Total no. of Medicare outpatient visits, 2001, meanSD (Q1Q3) | 1,624.8879.2 (1,057.51,970.0) | 1,883.39,48.5 (1,236.52,240.5) | |
| Total no. of Medicare outpatient visits, 2009, meanSD (Q1Q3) | 1,733.81,053.3 (1,080.02,048.0) | 2,020.51,200.9 (1,334.52,373.0) | |
| Total no. of Medicare outpatients, 2001, meanSD (Q1Q3) | 418.6186.9 (284.0522.0) | 473.4189.5 (338.0580.5) | |
| Total no. of Medicare outpatients, 2009, meanSD (Q1Q3) | 448.7217.8 (300.0548.0) | 508.7238.2 (350.5615.0) | |
| No. of hospitalized patients, 2001, meanSD (Q1Q3) | 46.025.0 (27.057.0) | 53.028.0 (32.066.0) | |
| No. of hospitalized patients, 2009, meanSD (Q1Q3) | 44.024.0 (26.052.0) | 52.027.0 (33.065.0) | |
| Average outpatient age, 2001, meanSD (Q1Q3) | 72.82.3 (71.574.2) | 72.82.1 (71.774.1) | |
| Average outpatient age, 2009, meanSD (Q1Q3) | 72.12.8 (70.673.9) | 72.82.7 (71.474.5) | |
| Average outpatient gender (% male), 2001, meanSD (Q1Q3) | 38.17.0 (35.542.3) | 38.56.4 (36.242.3) | |
| Average outpatient gender (% male), 2009, meanSD (Q1Q3) | 40.27.6 (37.644.8) | 41.06.5 (38.644.8) | |
| Average outpatient race (% white), 2001, meanSD (Q1Q3) | 84.316.4 (79.295.5) | 85.414.3 (79.995.7) | |
| Average outpatient race (% white), 2009, meanSD (Q1Q3) | 85.214.4 (79.895.2) | 86.312.9 (80.895.6) | |
| Average outpatient comorbidity, 2001, meanSD (Q1Q3)a | 1.60.5 (1.21.8) | 1.60.4 (1.21.8) | |
| Average outpatient comorbidity, 2009, meanSD (Q1Q3)a | 2.20.6 (1.82.5) | 2.20.6 (1.72.5) | |
Figure 1 graphs the percentage of PCPs as a function of what percent of their hospitalized patients received care from hospitalists, and how that changed from 2001 to 2009. For 70.9% of PCPs, fewer than 5% of their hospitalized patients received hospitalist care in 2001. By 2009, the percent of PCPs in this category had decreased to 15.2%. In contrast, in 2001, more than half of the patients for 2.1% of PCPs received hospitalist care, and the percent of PCPs in this category increased to 26.3% by 2009.
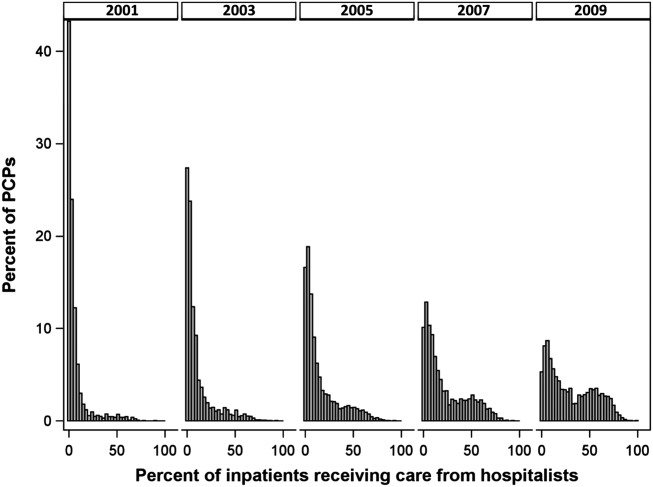
The pattern in Figure 1 shows that PCPs' use of hospitalists changed continuously and gradually over time. However, this pattern describes the PCPs as a group. When examined at the individual PCP level, different patterns emerge. Figure 2, which presents selected individual PCP's use of hospitalists over time, shows several distinct subpatterns of PCP practice behaviors. First, there are PCPs whose use of hospitalists was high in 2001 and stayed high or increased over time (eg, PCP A). There also were PCPs whose use of hospitalists stayed low over the entire study period (eg, PCP B). Finally, there were PCPs whose use of hospitalists was low in 2001 but high in 2009 (eg, PCP C). For this last group, the pattern of change in hospitalist utilization over time was discontinuous; that is, most of the increase occurred over a 1‐ or 2‐year period, instead of increasing gradually over time.
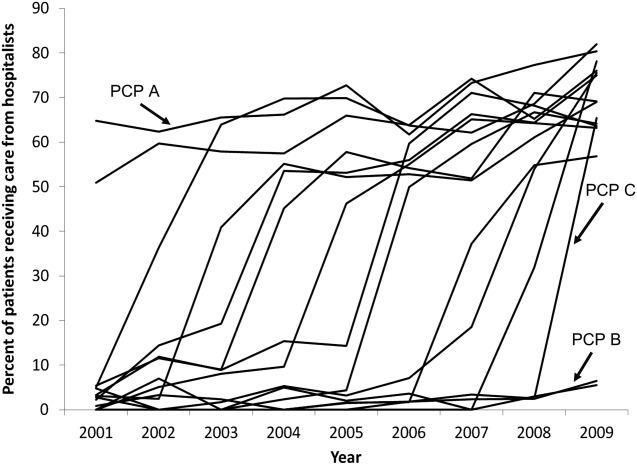
Among the 1172 PCPs associated with 20 hospitalized beneficiaries each year in all 9 years of the study period, group‐based trajectory modeling classified their practice patterns into 4 distinct trajectories (Figure 3). Among PCPs in group 1, more than one‐third of their hospitalized patients were cared for by hospitalists in 2001, and this increased to 60% by 2009. PCPs in groups 2 and 3 rarely used hospitalist care in 2001 but increased their use over time. The increase started early in the period for PCPs in group 2 and later for those in group 3. PCPs in group 4 were associated with little hospitalist use throughout the study period.
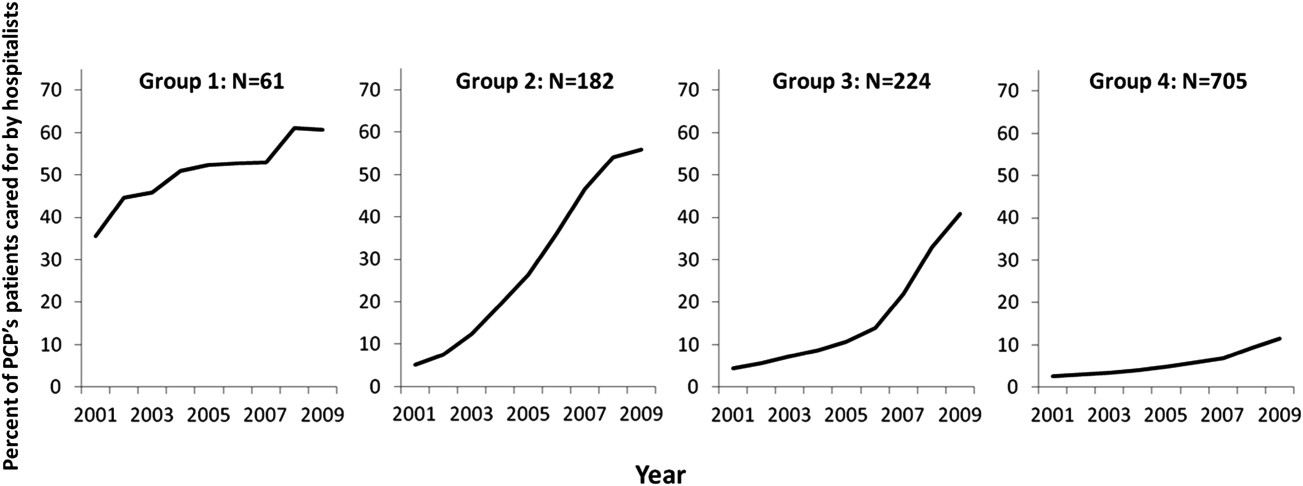
We constructed a model to describe the odds of a patient receiving care from hospitalists during the study period using patients associated with these 1172 PCPs. After adjusting for patient characteristics, the residual intraclass correlation coefficient for PCP level was 0.334, which indicates that 33.4% of the variance in whether a hospitalized patient received care from a hospitalist is explained by which PCP the patient saw. When adjusting for both patient and PCP characteristics, the overall odds of a patient receiving hospitalist care increased by 30% (95% confidence interval [CI]: 1.29‐1.30) per year from 2001 through 2009.
There were also significant interactions between year of hospitalization and several PCP characteristics. These interactions are illustrated in Table 2, which stratifies each of those PCP characteristics by 3 time periods: 2001 to 2003, 2004 to 2006, and 2007 to 2009. In all time periods, patients were more likely to receive hospitalist care if their PCP was US trained (US vs international medical graduate: odds ratio [OR]: 1.42, 95% CI: 1.19‐1.69 in 20012003; OR: 1.46, 95% CI: 1.23‐1.73 in 20072009), or specialized in family medicine (family medicine vs internal medicine: OR: 1.46, 95% CI: 1.25‐1.72 in 20012003; OR: 1.46, 95% CI: 1.25‐1.70 in 20072009). Over time, the relative odds of a patient receiving care from hospitalists decreased if their PCP was female (female vs male: OR: 1.91, 95% CI: 1.46‐2.50 in 20012003 vs OR: 1.50, 95% CI: 1.15‐1.95 in 20072009) or practiced in an urban area (largest vs smallest MSA: OR: 3.34, 95% CI: 2.72‐4.09 in 20012003; OR: 2.22, 95% CI: 1.82‐2.71 in 20072009). Although the longest‐practicing PCPs were most likely to use hospitalists in the early 2000s, this effect disappeared by 2007 to 2009 (most vs least years in practice: OR: 1.35, 95% CI: 1.06‐1.72 in 20012003 vs OR: 0.92, 95% CI: 0.73‐1.17 in 20072009).
| PCP Characteristics | 20012003, OR (95% CI) | 20042006, OR (95% CI) | 20072009, OR (95% CI) |
|---|---|---|---|
| |||
| Family practicea vs. internal medicineb | 1.46 (1.251.72) | 1.50 (1.281.76) | 1.46 (1.251.70) |
| Female vs male | 1.91 (1.462.50) | 1.43 (1.091.86) | 1.50 (1.151.95) |
| United States trained (yes vs no) | 1.42 (1.191.69) | 1.53 (1.281.81) | 1.46 (1.231.73) |
| Metropolitan statistical area | |||
| 99,999 or less | 1.00 | 1.00 | 1.00 |
| 100,000249,000 | 0.83 (0.651.05) | 1.00 (0.791.25) | 1.13 (0.901.41) |
| 250,000999,999 | 0.92 (0.721.17) | 1.03 (0.821.31) | 0.98 (0.771.23) |
| 1,000,000 or more | 3.34 (2.724.09) | 2.90 (2.373.54) | 2.22 (1.822.71) |
| Years in practice, 2001 | |||
| Q1 (lowest) | 1.00 | 1.00 | 1.00 |
| Q2 | 0.89 (0.711.12) | 0.83 (0.671.04) | 0.92 (0.741.14) |
| Q3 | 1.06 (0.841.34) | 0.99 (0.791.24) | 1.03 (0.821.29) |
| Q4 | 1.25 (0.991.59) | 1.13 (0.891.42) | 1.15 (0.921.45) |
| Q5 (highest) | 1.35 (1.061.72) | 1.05 (0.831.33) | 0.92 (0.731.17) |
| Total no. of outpatient visitsc | |||
| Q1 (lowest) | 1.00 | 1.00 | 1.00 |
| Q2 | 1.21 (1.121.30) | 1.07 (1.001.14) | 1.13 (1.071.19) |
| Q3 | 1.42 (1.301.54) | 1.18 (1.091.27) | 1.14 (1.071.22) |
| Q4 | 1.34 (1.211.47) | 1.34 (1.231.46) | 1.25 (1.161.35) |
| Q5 (highest) | 1.46 (1.301.63) | 1.33 (1.211.47) | 1.32 (1.201.44) |
| No. of hospitalized patientsc | |||
| Q1 (lowest) | 1.00 | 1.00 | 1.00 |
| Q2 | 1.07 (1.001.15) | 0.91 (0.860.96) | 0.85 (0.810.89) |
| Q3 | 1.00 (0.921.08) | 0.87 (0.820.93) | 0.74 (0.700.79) |
| Q4 | 0.89 (0.810.97) | 0.76 (0.710.82) | 0.62 (0.580.67) |
| Q5 (highest) | 1.05 (0.951.18) | 0.67 (0.610.73) | 0.55 (0.510.60) |
| Average outpatient agec | |||
| Q1 (lowest) | 1.00 | 1.00 | 1.00 |
| Q2 | 0.94 (0.871.01) | 1.15 (1.081.23) | 1.18 (1.111.25) |
| Q3 | 0.82 (0.760.90) | 1.05 (0.971.13) | 1.17 (1.091.25) |
| Q4 | 0.71 (0.650.79) | 1.03 (0.951.12) | 1.10 (1.021.19) |
| Q5 (highest) | 0.72 (0.640.81) | 1.12 (1.011.23) | 1.15 (1.051.26) |
| Average outpatient gender (% male)c | |||
| Q1 (lowest) | 1.00 | 1.00 | 1.00 |
| Q2 | 1.10 (1.021.18) | 1.19 (1.101.27) | 1.27 (1.181.37) |
| Q3 | 1.12 (1.031.22) | 1.27 (1.171.37) | 1.43 (1.321.54) |
| Q4 | 1.36 (1.251.48) | 1.49 (1.371.61) | 1.52 (1.401.65) |
| Q5 (highest) | 1.47 (1.341.61) | 1.84 (1.682.00) | 1.68 (1.541.83) |
| Average outpatient race (% white)c | |||
| Q1 (lowest) | 1.00 | 1.00 | 1.00 |
| Q2 | 1.08 (0.981.20) | 1.01 (0.921.10) | 1.23 (1.131.34) |
| Q3 | 1.27 (1.131.43) | 1.06 (0.951.18) | 1.21 (1.091.34) |
| Q4 | 1.47 (1.291.67) | 0.97 (0.861.09) | 1.33 (1.181.48) |
| Q5 (highest) | 1.39 (1.211.59) | 1.18 (1.041.34) | 1.25 (1.101.42) |
| Average outpatient comorbidityc | |||
| Q1 (lowest) | 1.00 | 1.00 | 1.00 |
| Q2 | 1.26 (1.191.35) | 1.23 (1.161.31) | 1.22 (1.141.30) |
| Q3 | 1.62 (1.491.75) | 1.61 (1.501.72) | 1.43 (1.341.54) |
| Q4 | 1.96 (1.792.15) | 1.86 (1.722.02) | 1.59 (1.471.72) |
| Q5 (highest) | 1.79 (1.592.01) | 2.20 (2.002.41) | 2.03 (1.852.22) |
In terms of PCP workload, patients of PCPs with high outpatient activity were more likely to receive hospitalists care throughout the study period, although the association had decreased by 2007 to 2009 (highest vs lowest outpatient volume: OR: 1.46, 95% CI: 1.30‐1.63 in 20012003 vs OR: 1.32, 95% CI: 1.20‐1.44 in 20072009). In contrast, PCPs with the lowest inpatient volumes became more likely to use hospitalists by the end of the study period (highest vs lowest inpatient volume: OR: 1.05, 95% CI: 0.95‐1.18 in 20012003 vs OR: 0.55, 95% CI: 0.51‐0.60 in 20072009).
The characteristics of PCPs' practice panels also were associated with patients' likelihood of receiving care from hospitalists. PCPs whose practice panels consisted of patients who were predominantly male, white, or with more outpatient comorbidities were consistently more likely to use hospitalists throughout the study period. PCPs with older patient panels were less likely to use hospitalists in 2001 to 2003, but by 2007 to 2009, they were slightly more likely to do so (oldest vs youngest average outpatient panel age: OR: 0.72, 95% CI: 0.64‐0.81 in 20012003 vs OR: 1.15, 95% CI: 1.05‐1.26 in 20072009).
CONCLUSIONS
Prior studies of the hospitalist model have shown that the likelihood of a patient receiving inpatient care from hospitalists is associated with patient characteristics, hospital characteristics, geographic region, and type of admission.[1, 16, 17] We found that PCP characteristics also predict whether patients receive care from hospitalists and that their use of hospitalists developed dynamically between 2001 to 2009. Although many factors (such as whether patients were admitted to a hospital where their PCP had admitting privileges) can influence the decision to use hospitalists, we found that over one‐third of the variance in whether a hospitalized patient received care from a hospitalist is explained by which PCP the patient saw. In showing that systemic differences exist among PCPs who use hospitalists and those who do not, our study suggests that future research on the hospitalist model should, if possible, adjust for PCP characteristics in addition to hospital and patient factors.
Although this study identifies the existence and magnitude of differences in whether or not PCPs use hospitalists, it cannot explain why the differences exist. We only can offer hypotheses. For example, our finding that PCPs with the most years of practice experience were more likely to use hospitalists in the early 2000s but not in more recent years suggests that in hospital medicine's early years, long‐practicing generalist physicians were choosing between practicing traditionalist medicine and adopting the hospitalists model, but by 2009, experienced generalist physicians had already specialized to either inpatient or outpatient settings earlier in their careers. On the other hand, the decreasing odds of urban PCPs using hospitalists may reflect a relative growth in hospitalist use in less populated areas rather than a change in urban PCPs' practice patterns.
PCPs trained in family medicine have reported less inpatient training and less comfort with providing hospital care,[18, 19] thus it is unsurprising that family physicians were more likely to refer patients to hospitalists. Although a recent study reported that family physicians' inpatient volumes remained constant, whereas those of outpatient internists declined between 2003 and 2012, the analysis used University Health Consortium data and thus reflects practice patterns in academic medical centers.[20] Our data suggest that outside of academia, family physicians have embraced the hospitalists as clinical partners.
Meltzer and Chung had previously proposed an economic model to describe the growing use of hospitalists in the United States. They posited that decisions to adopt the hospitalist model are governed by trade‐offs between coordination costs (eg, time and effort spent coordinating multiple providers across different settings) and switching costs (eg, time spent traveling between the office and the hospital or the effort of adjusting to different work settings).[16] The authors hypothesized that empirical testing of this model would show PCPs are more likely to use hospitalists if they have less available professional time (ie, work fewer hours per week), are female (due to competing demands from domestic responsibilities), have relatively few hospitalized patients, or live in areas with high traffic congestion. Our findings provide empirical evidence to support their division‐of‐labor model in showing that patients were more likely to receive hospitalist care if their PCP was female, practiced in an urban location, had higher outpatient practice volumes, or had lower inpatient volumes.
At first glance, some of our findings appear to contradict our earlier study, which showed that younger, black, male patients are more likely to receive inpatient care from hospitalists.[1] However, that study included patients regardless of whether they had a PCP. This study shows that when patients have a PCP, their PCPs are more likely to refer them to hospitalists if they are older, white, male, and have more comorbid conditions. A potential explanation for this finding is that PCPs may preferentially use hospitalists when caring for older and sicker hospitalized patients. For example, commentators often cite hospitalists' constant availability in the hospital as a valuable resource when caring for acutely ill patients.[21, 22]
Another potential explanation is that despite their preferences, PCPs who care for younger, minority patients lack access to hospitalist services. One large study of Medicare beneficiaries reported that physicians who care for black patients are less well‐trained clinically and often lack access to important clinical resources such as diagnostic imaging and nonemergency hospital admissions.[23] Similarly, international medical graduates are more likely than their US‐trained counterparts to care for underserved patients and to practice in small, independent offices.[24, 25, 26] As hospitalist groups often rely on cross‐subsidization from sources within a large healthcare organization, independent PCPs may have less access to their services when compared with PCPs in managed care organizations or large integrated groups. Viewed in this context, our findings imply that although hospitalists often care for socioeconomically vulnerable patients (eg, younger, uninsured, black men) who lack access to primary care services,[1] they also appear to share care responsibilities for more complex hospitalized patients with PCPs in more affluent communities. Further research may determine if the availability of hospitalists influences racial disparities in hospital care.
Our study has limitations. It is an observational study and thus subject to bias and confounding. As our cohort was formed using fee‐for‐service Medicare data in a single, large state, it may not be generalizable to PCPs who practice in other states, who care for a younger population, or who do not accept Medicare. Our findings also may not reflect the practice patterns of physicians‐in‐training, PCP populations with high board‐certification rates, those employed in temporary positions, or those who interrupt their practices for personal reasons, as we restricted our study to established PCPs who had been in practice long and consistently enough to be associated with 20 hospitalized patients during every year of the study. For example, the lower proportion of female PCPs in our cohort (15.6% in our study in 2009 vs 27.5% reported in a nationally representative 2008 survey[27]) may be explained by our exclusion of women who take prolonged time off for childcare duties. We also did not establish whether patient outcomes or healthcare costs differ between PCPs who adopted the hospitalist model and traditionalists. Finally, we could not examine the effect of a number of PCP factors that could plausibly influence whether or not PCPs relinquish inpatient care to hospitalists, such as their comfort with providing inpatient care, having hospital admitting privileges, having office‐based access to hospitals' electronic medical records, or the distance between their office and the hospital. However, this study lays the groundwork for future studies to explore these factors.
In summary, this study is the first, to our knowledge, to characterize PCPs who relinquished inpatient responsibilities to hospitalists. Our findings suggest that some groups of PCPs are more likely to refer patient to hospitalists, that the relationship between hospitalists and PCPs has evolved over time, and that the hospitalist model still has ample room to grow.
ACKNOWLEDGMENTS
Disclosures: This study was supported by grants from the National Institute on Aging (1RO1‐AG033134 and P30‐AG024832) and the National Cancer Institute (K05‐CA124923). The authors have no financial conflicts of interest to disclose. An oral abstract of this article was presented on May 18, 2013 at the Society of Hospital Medicine Annual Meeting in National Harbor, Maryland.
- , , , . Growth in the care of older patients by hospitalists in the United States. N Engl J Med. 2009;360(11):1102–1112.
- , . Effect of hospitalists on length of stay in the medicare population: variation according to hospital and patient characteristics. J Am Geriatr Soc. 2010;58(9):1649–1657.
- , , , , , . Outcomes of care by hospitalists, general internists, and family physicians. N Engl J Med. 2007;357(25):2589–2600.
- , , , , . Hospitalist care and length of stay in patients requiring complex discharge planning and close clinical monitoring. Arch Intern Med. 2007;167(17):1869–1874.
- , . The impact of hospitalists on the cost and quality of inpatient care in the United States: a research synthesis. Med Care Res Rev. 2005;62(4):379–406.
- , . Association of hospitalist care with medical utilization after discharge: evidence of cost shift from a cohort study. Ann Intern Med. 2011;155(3):152–159.
- , . Hospital care and medical utilization after discharge. Ann Intern Med. 2011;155(10):719–720; author reply 722.
- . Hospital care and medical utilization after discharge. Ann Intern Med. 2011;155(10):721; author reply 722.
- , , , , , . Administrative data algorithms can describe ambulatory physician utilization. Health Serv Res. 2007;42:1783–1796.
- , . Estimating the reliability of continuous measures with Cronbach's alpha or the intraclass correlation coefficient: toward the integration of two traditions. J Clin Epidemiol. 1991;44(4–5):381–390.
- , , . Ability of Medicare claims data to identify nursing home patients: a validation study. Med Care. 2008;46(11):1184–1187.
- , , , . Comorbidity measures for use with administrative data. Med Care. 1998;36(1):8–27.
- , , . A SAS procedure based on mixture models for estimating developmental trajectories. Sociol Methods Res. 2001;29(3):374–393.
- . Group‐Based Modeling of Development. Cambridge, MA: Harvard University Press; 2005.
- , . Group‐based trajectory modeling in clinical research. Annu Rev Clin Psychol. 2010;6:109–138.
- , . Coordination, switching costs and the division of labor in general medicine: an economic explanation for the emergence of hospitalists in the United States. National Bureau of Economic Research Working Paper Series No. 16040. Cambridge, MA: National Bureau of Economic Research; 2010.
- , , , , , . Continuity of outpatient and inpatient care by primary care physicians for hospitalized older adults. JAMA. 2009;301(16):1671–1680.
- . Hospitalists and family physicians: understanding opportunities and risks. J Fam Pract. 2004;53(6):473–481.
- , , , , , . Preparedness of internal medicine and family practice residents for treating common conditions. JAMA. 2002;288(20):2609–2614.
- , , , . The status of adult inpatient care by family physicians at US academic medical centers and affiliated teaching hospitals 2003 to 2012: the impact of the hospitalist movement. Fam Med. 2014;46(2):94–99.
- . Hospitalists and the hospital medicine system of care are good for patient care. Arch Intern Med. 2008;168(12):1254–1256; discussion 1259–1260.
- . Hospitalists in the United States—mission accomplished or work in progress? N Engl J Med. 2004;350(19):1935–1936.
- , , , , . Primary care physicians who treat blacks and whites. N Engl J Med. 2004;351(6):575–584.
- , , , . International medical graduates and the primary care workforce for rural underserved areas. Health Aff (Millwood). 2003;22(2):255–262.
- , , . Medical migration and the physician workforce. International medical graduates and American medicine. JAMA. 1995;273(19):1521–1527.
- , , , , . International medical graduates in family medicine in the United States of America: an exploration of professional characteristics and attitudes. Hum Resour Health. 2006;4:17.
- , , . A snapshot of U.S. physicians: key findings from the 2008 Health Tracking Physician Survey. Data Bull (Cent Stud Health Syst Change). 2009(35):1–11.
Although primary care physicians (PCPs) have traditionally treated patients in both ambulatory and hospital settings, many relinquished inpatient duties to hospitalists in recent decades.[1] Little is known about the PCPs who relinquished inpatient care duties or how the transition to the hospitalist model occurred. For example, what are the characteristics of PCPs who change? Do PCPs adopt the hospitalist model enthusiastically or cautiously? Characterizing PCPs who adopted the hospitalist model can help hospitalists understand their specialty's history and also inform health services research.
Much of the interest in the hospitalist model has been generated by studies reporting improved outcomes and lower hospital lengths of stay associated with hospitalist care.[2, 3, 4, 5] Conversely, detractors of the model point to reports of higher postacute care utilization among hospitalist patients.[6] Although these studies usually adjusted for differences among patients and hospitals, they did not account for PCP characteristics. As patients' access to PCPs and their PCP's capabilities are both plausible factors that could influence hospital length of stay (eg, decisions to complete more or less of a workup in the hospital), quality of care transitions, and postdischarge utilization, it is important to determine if PCPs who use hospitalists differ systematically from those who do not to correctly interpret health system utilization patterns that currently are attributed only to hospitalists.[7, 8]
We conducted this study to determine if observable PCP factors are associated with patients' use of hospitalists and to describe the trajectory by which PCPs referred their patients to hospitalists over time.
METHODS
Source of Data
We used claims data from 100% of Texas Medicare beneficiaries from 2000 to 2009, including Medicare beneficiary summary files, Medicare Provider Analysis and Review (MedPAR) files, Outpatient Standard Analytical Files (OutSAF), and Medicare Carrier files. Diagnosis related group (DRG)‐associated information, including weights, and Major Diagnostic Categories, were obtained from Centers for Medicare & Medicaid Services (
Establishment of the Study Cohort
Using the MedPAR file, we first selected hospital admissions from acute care hospitals in Texas for each year of the study period. We excluded beneficiaries younger than 66 years old, with incomplete Medicare Parts A and B enrollment, or with any health maintenance organization enrollment in the 12 months prior to the admission of interest. For patients with more than 1 admission in a given year, we randomly selected 1 admission. We then attempted to assign each patient to a PCP. We defined a PCP as a generalist (general practitioner, family physician, internist, or geriatrician) who saw a given beneficiary on 3 or more occasions in an outpatient setting in the year prior to the admission of interest.[9] We identified outpatient visits using Current Procedural Terminology (CPT) codes 99201 to 99205 (new patient encounters), and 99211 to 99215 (established patient encounters) from Carrier files. If more than 1 generalist physician saw the beneficiary on 3 or more occasions in a given year, the physician with more than 75% of the total outpatient evaluation and management (E&M) billings was classified as the beneficiary's PCP. Using these criteria, approximately 66% of patients were assigned to a PCP.
For cross‐sectional analyses, we restricted our cohort to beneficiaries whose PCPs were associated with at least 20 inpatients in a given year. To study trends in PCP practice patterns over time, we further restricted the cohort to beneficiaries whose PCPs were associated with at least 20 inpatients in every year of the study period, resulting in 1172 PCPs for the trajectory analyses. The reliability of PCPs' practice profiles increases as the number of patients in their panel increases. We chose 20 inpatients as the minimum because PCPs with 20 hospitalized patients per study year would achieve a reliability of 0.9 for estimating the proportion of their patients that received care from hospitalists.[10]
Identification of Hospitalists
We defined hospitalists as generalists who had at least 100 E&M billings in a given year and generated at least 90% of their total E&M billings in the year from inpatient services.[1] Inpatient E&M billings were identified by CPT codes 99221 to 99223 (new or established patient encounters), 99231 to 99233 (subsequent hospital care), and 99251 to 99255 (inpatient consultations).[1]
Patient Measures
Patient demographic information including, age at admission, gender, race/ethnicity, and Medicaid eligibility were obtained from Medicare beneficiary summary files. We used the Medicaid indicator as a proxy for low socioeconomic status. Information on weekday versus weekend admission, emergent admission, and DRG were obtained from MedPAR files. The DRG category (circulatory system, digestive system, infectious disease, nervous system, respiratory system, or other) was determined based on its Major Diagnostic Category. We determined residence in a nursing facility in the 3 months before the admission of interest from the MedPAR files and by E&M codes 99304 to 99318 (nursing facility services) from Carrier files.[11] Comorbidities were identified using the claims from MedPAR, Carrier, and OutSAF files in the year prior to the admission of interest.[12] Total hospitalizations and outpatient visits in the prior year were identified from MedPAR files and Carrier files, respectively.
PCP Measures
We categorized PCPs by specialty (general practice, gamily practice, geriatric medicine, or internal medicine), years in practice, gender, US‐ versus foreign‐trained, metropolitan statistical area (MSA) of their practice location, and board certification status. The specialty was identified from Carrier files and the other information from AMA data. For each PCP, the total number of outpatient visits and total number of patients seen as outpatients in each year was calculated based on E&M codes (9920199205, 9921199215) from Carrier files. For each year, we computed the average outpatient age, gender, race, and outpatient comorbidity for each PCP's patient panel. We computed hospital volumes using the number of hospitalized patients associated with each PCP in the study cohort.
Study Outcome
To determine whether hospitalized patients received care from hospitalists during a given hospitalization, we identified all inpatient E&M bills from generalist physicians during the admission of interest by linking MedPAR and Carrier files. If more than 50% of the generalist inpatient E&M billings from generalist physicians were from 1 or more hospitalists, the patient was considered to have received care from hospitalists.
Statistical Analyses
Multilevel analyses were used to account for the clustering of patients within PCPs. All multilevel models were adjusted for patient characteristics including age, race/ethnicity, gender, Medicaid eligibility, emergency admission, weekend admission, DRG weight, DRG category, any nursing home stay in the prior 3 months, number of comorbidities, number of hospitalizations, and number of physician visits in the year prior to the admission of interest. To analyze trends in practice patterns, we first used multilevel models to calculate the proportions of inpatients cared for by hospitalists each year for each of the 1172 PCPs with at least 20 patients. Then we employed an SAS procedure (PROC TRAJ) developed by Jones et al. to classify these PCPs into groups based on their trajectories.[13] This group‐based trajectory modeling allowed us to identify relatively homogeneous clusters within a heterogeneous sample population.[14] We chose a model that classified the PCPs into 4 groups.[15] With 4 groups, the average of the posterior probabilities of group membership for the PCPs assigned to each group exceeded 0.93, indicating a low rate of misclassification among these 4 distinct groups. For the 1172 PCPs, we tested interactions between year of hospitalization and PCP characteristics while adjusting for patient characteristics in order to investigate whether or not the impacts of PCP characteristics on how likely their patients being cared for by hospitalists differed with time. All analyses were performed with SAS version 9.2 (SAS Institute Inc., Cary, NC).
RESULTS
During the 2001 through 2009 study period, between 2252 and 2848 PCPs were associated with at least 20 hospitalized beneficiaries in any single year. Among these, 1172 PCPs were associated with at least 20 hospitalized beneficiaries in every year of the study period. These 1172 PCPs were associated with 608,686 hospitalizations over the 9 years.
Table 1 presents the characteristics of the PCPs who contributed to the cross‐sectional analyses in 2001 (N=2252) and 2009 (N=2387), as well as the 1172 PCPs for whom we had data for all 9 years for the longitudinal analyses. Most PCPs were male, trained in the United States, and were board certified. The average number of Medicare patients seen by these PCPs and number of outpatient Medicare visits went up about 7% between 2001 and 2009.
| PCP Characteristics | Cross‐Sectional Analysis | Trajectory Analysis, 20012009 | |
|---|---|---|---|
| 2001 | 2009 | ||
| |||
| Overall, no. (%) | 2,252 (100%) | 2,387 (100%) | 1,172 (100%) |
| Specialty, no. (%) | |||
| General practice | 39 (1.7%) | 34 (1.4%) | 15 (1.3%) |
| Family practice | 948 (42.1%) | 1,089 (45.6%) | 466 (39.8%) |
| Internal medicine | 1,255 (55.7%) | 1,249 (52.3%) | 688 (58.7%) |
| Geriatrics | 10 (0.4%) | 15 (0.6%) | 3 (0.3%) |
| Gender, no. (%) | |||
| Male | 1,990 (88.4%) | 2,015 (84.4%) | 1,072 (91.5%) |
| Female | 262 (11.6%) | 372 (15.6%) | 100 (8.5%) |
| Trained in the United States, no. (%) | |||
| Yes | 1,669 (74.1%) | 1,738 (72.8%) | 844 (72.0%) |
| No | 583 (25.9%) | 649 (27.2%) | 328 (28.0%) |
| Metropolitan statistical area, no. (%) | |||
| 99,999 or less | 417 (17.5) | 237 (20.2) | |
| 100,000249,000 | 438 (18.3) | 234 (20.0) | |
| 250,000999,999 | 381 (16.0) | 216 (18.4) | |
| 1,000,000 or more | 1,151 (48.2) | 485 (41.4) | |
| Board certification, no. (%) | |||
| Yes | 1,657 (69.4%) | 800 (68.3%) | |
| No | 730 (30.6%) | 372 (31.7%) | |
| Years in practice, 2001, meanSD (Q1Q3) | 22.310.6 (15.028.0) | 21.28.9 (15.027.0) | |
| Years in practice, 2009, meanSD (Q1Q3) | 25.010.2 (17.032.0) | 29.28.9 (23.035.0) | |
| Total no. of Medicare outpatient visits, 2001, meanSD (Q1Q3) | 1,624.8879.2 (1,057.51,970.0) | 1,883.39,48.5 (1,236.52,240.5) | |
| Total no. of Medicare outpatient visits, 2009, meanSD (Q1Q3) | 1,733.81,053.3 (1,080.02,048.0) | 2,020.51,200.9 (1,334.52,373.0) | |
| Total no. of Medicare outpatients, 2001, meanSD (Q1Q3) | 418.6186.9 (284.0522.0) | 473.4189.5 (338.0580.5) | |
| Total no. of Medicare outpatients, 2009, meanSD (Q1Q3) | 448.7217.8 (300.0548.0) | 508.7238.2 (350.5615.0) | |
| No. of hospitalized patients, 2001, meanSD (Q1Q3) | 46.025.0 (27.057.0) | 53.028.0 (32.066.0) | |
| No. of hospitalized patients, 2009, meanSD (Q1Q3) | 44.024.0 (26.052.0) | 52.027.0 (33.065.0) | |
| Average outpatient age, 2001, meanSD (Q1Q3) | 72.82.3 (71.574.2) | 72.82.1 (71.774.1) | |
| Average outpatient age, 2009, meanSD (Q1Q3) | 72.12.8 (70.673.9) | 72.82.7 (71.474.5) | |
| Average outpatient gender (% male), 2001, meanSD (Q1Q3) | 38.17.0 (35.542.3) | 38.56.4 (36.242.3) | |
| Average outpatient gender (% male), 2009, meanSD (Q1Q3) | 40.27.6 (37.644.8) | 41.06.5 (38.644.8) | |
| Average outpatient race (% white), 2001, meanSD (Q1Q3) | 84.316.4 (79.295.5) | 85.414.3 (79.995.7) | |
| Average outpatient race (% white), 2009, meanSD (Q1Q3) | 85.214.4 (79.895.2) | 86.312.9 (80.895.6) | |
| Average outpatient comorbidity, 2001, meanSD (Q1Q3)a | 1.60.5 (1.21.8) | 1.60.4 (1.21.8) | |
| Average outpatient comorbidity, 2009, meanSD (Q1Q3)a | 2.20.6 (1.82.5) | 2.20.6 (1.72.5) | |
Figure 1 graphs the percentage of PCPs as a function of what percent of their hospitalized patients received care from hospitalists, and how that changed from 2001 to 2009. For 70.9% of PCPs, fewer than 5% of their hospitalized patients received hospitalist care in 2001. By 2009, the percent of PCPs in this category had decreased to 15.2%. In contrast, in 2001, more than half of the patients for 2.1% of PCPs received hospitalist care, and the percent of PCPs in this category increased to 26.3% by 2009.
The pattern in Figure 1 shows that PCPs' use of hospitalists changed continuously and gradually over time. However, this pattern describes the PCPs as a group. When examined at the individual PCP level, different patterns emerge. Figure 2, which presents selected individual PCP's use of hospitalists over time, shows several distinct subpatterns of PCP practice behaviors. First, there are PCPs whose use of hospitalists was high in 2001 and stayed high or increased over time (eg, PCP A). There also were PCPs whose use of hospitalists stayed low over the entire study period (eg, PCP B). Finally, there were PCPs whose use of hospitalists was low in 2001 but high in 2009 (eg, PCP C). For this last group, the pattern of change in hospitalist utilization over time was discontinuous; that is, most of the increase occurred over a 1‐ or 2‐year period, instead of increasing gradually over time.
Among the 1172 PCPs associated with 20 hospitalized beneficiaries each year in all 9 years of the study period, group‐based trajectory modeling classified their practice patterns into 4 distinct trajectories (Figure 3). Among PCPs in group 1, more than one‐third of their hospitalized patients were cared for by hospitalists in 2001, and this increased to 60% by 2009. PCPs in groups 2 and 3 rarely used hospitalist care in 2001 but increased their use over time. The increase started early in the period for PCPs in group 2 and later for those in group 3. PCPs in group 4 were associated with little hospitalist use throughout the study period.
We constructed a model to describe the odds of a patient receiving care from hospitalists during the study period using patients associated with these 1172 PCPs. After adjusting for patient characteristics, the residual intraclass correlation coefficient for PCP level was 0.334, which indicates that 33.4% of the variance in whether a hospitalized patient received care from a hospitalist is explained by which PCP the patient saw. When adjusting for both patient and PCP characteristics, the overall odds of a patient receiving hospitalist care increased by 30% (95% confidence interval [CI]: 1.29‐1.30) per year from 2001 through 2009.
There were also significant interactions between year of hospitalization and several PCP characteristics. These interactions are illustrated in Table 2, which stratifies each of those PCP characteristics by 3 time periods: 2001 to 2003, 2004 to 2006, and 2007 to 2009. In all time periods, patients were more likely to receive hospitalist care if their PCP was US trained (US vs international medical graduate: odds ratio [OR]: 1.42, 95% CI: 1.19‐1.69 in 20012003; OR: 1.46, 95% CI: 1.23‐1.73 in 20072009), or specialized in family medicine (family medicine vs internal medicine: OR: 1.46, 95% CI: 1.25‐1.72 in 20012003; OR: 1.46, 95% CI: 1.25‐1.70 in 20072009). Over time, the relative odds of a patient receiving care from hospitalists decreased if their PCP was female (female vs male: OR: 1.91, 95% CI: 1.46‐2.50 in 20012003 vs OR: 1.50, 95% CI: 1.15‐1.95 in 20072009) or practiced in an urban area (largest vs smallest MSA: OR: 3.34, 95% CI: 2.72‐4.09 in 20012003; OR: 2.22, 95% CI: 1.82‐2.71 in 20072009). Although the longest‐practicing PCPs were most likely to use hospitalists in the early 2000s, this effect disappeared by 2007 to 2009 (most vs least years in practice: OR: 1.35, 95% CI: 1.06‐1.72 in 20012003 vs OR: 0.92, 95% CI: 0.73‐1.17 in 20072009).
| PCP Characteristics | 20012003, OR (95% CI) | 20042006, OR (95% CI) | 20072009, OR (95% CI) |
|---|---|---|---|
| |||
| Family practicea vs. internal medicineb | 1.46 (1.251.72) | 1.50 (1.281.76) | 1.46 (1.251.70) |
| Female vs male | 1.91 (1.462.50) | 1.43 (1.091.86) | 1.50 (1.151.95) |
| United States trained (yes vs no) | 1.42 (1.191.69) | 1.53 (1.281.81) | 1.46 (1.231.73) |
| Metropolitan statistical area | |||
| 99,999 or less | 1.00 | 1.00 | 1.00 |
| 100,000249,000 | 0.83 (0.651.05) | 1.00 (0.791.25) | 1.13 (0.901.41) |
| 250,000999,999 | 0.92 (0.721.17) | 1.03 (0.821.31) | 0.98 (0.771.23) |
| 1,000,000 or more | 3.34 (2.724.09) | 2.90 (2.373.54) | 2.22 (1.822.71) |
| Years in practice, 2001 | |||
| Q1 (lowest) | 1.00 | 1.00 | 1.00 |
| Q2 | 0.89 (0.711.12) | 0.83 (0.671.04) | 0.92 (0.741.14) |
| Q3 | 1.06 (0.841.34) | 0.99 (0.791.24) | 1.03 (0.821.29) |
| Q4 | 1.25 (0.991.59) | 1.13 (0.891.42) | 1.15 (0.921.45) |
| Q5 (highest) | 1.35 (1.061.72) | 1.05 (0.831.33) | 0.92 (0.731.17) |
| Total no. of outpatient visitsc | |||
| Q1 (lowest) | 1.00 | 1.00 | 1.00 |
| Q2 | 1.21 (1.121.30) | 1.07 (1.001.14) | 1.13 (1.071.19) |
| Q3 | 1.42 (1.301.54) | 1.18 (1.091.27) | 1.14 (1.071.22) |
| Q4 | 1.34 (1.211.47) | 1.34 (1.231.46) | 1.25 (1.161.35) |
| Q5 (highest) | 1.46 (1.301.63) | 1.33 (1.211.47) | 1.32 (1.201.44) |
| No. of hospitalized patientsc | |||
| Q1 (lowest) | 1.00 | 1.00 | 1.00 |
| Q2 | 1.07 (1.001.15) | 0.91 (0.860.96) | 0.85 (0.810.89) |
| Q3 | 1.00 (0.921.08) | 0.87 (0.820.93) | 0.74 (0.700.79) |
| Q4 | 0.89 (0.810.97) | 0.76 (0.710.82) | 0.62 (0.580.67) |
| Q5 (highest) | 1.05 (0.951.18) | 0.67 (0.610.73) | 0.55 (0.510.60) |
| Average outpatient agec | |||
| Q1 (lowest) | 1.00 | 1.00 | 1.00 |
| Q2 | 0.94 (0.871.01) | 1.15 (1.081.23) | 1.18 (1.111.25) |
| Q3 | 0.82 (0.760.90) | 1.05 (0.971.13) | 1.17 (1.091.25) |
| Q4 | 0.71 (0.650.79) | 1.03 (0.951.12) | 1.10 (1.021.19) |
| Q5 (highest) | 0.72 (0.640.81) | 1.12 (1.011.23) | 1.15 (1.051.26) |
| Average outpatient gender (% male)c | |||
| Q1 (lowest) | 1.00 | 1.00 | 1.00 |
| Q2 | 1.10 (1.021.18) | 1.19 (1.101.27) | 1.27 (1.181.37) |
| Q3 | 1.12 (1.031.22) | 1.27 (1.171.37) | 1.43 (1.321.54) |
| Q4 | 1.36 (1.251.48) | 1.49 (1.371.61) | 1.52 (1.401.65) |
| Q5 (highest) | 1.47 (1.341.61) | 1.84 (1.682.00) | 1.68 (1.541.83) |
| Average outpatient race (% white)c | |||
| Q1 (lowest) | 1.00 | 1.00 | 1.00 |
| Q2 | 1.08 (0.981.20) | 1.01 (0.921.10) | 1.23 (1.131.34) |
| Q3 | 1.27 (1.131.43) | 1.06 (0.951.18) | 1.21 (1.091.34) |
| Q4 | 1.47 (1.291.67) | 0.97 (0.861.09) | 1.33 (1.181.48) |
| Q5 (highest) | 1.39 (1.211.59) | 1.18 (1.041.34) | 1.25 (1.101.42) |
| Average outpatient comorbidityc | |||
| Q1 (lowest) | 1.00 | 1.00 | 1.00 |
| Q2 | 1.26 (1.191.35) | 1.23 (1.161.31) | 1.22 (1.141.30) |
| Q3 | 1.62 (1.491.75) | 1.61 (1.501.72) | 1.43 (1.341.54) |
| Q4 | 1.96 (1.792.15) | 1.86 (1.722.02) | 1.59 (1.471.72) |
| Q5 (highest) | 1.79 (1.592.01) | 2.20 (2.002.41) | 2.03 (1.852.22) |
In terms of PCP workload, patients of PCPs with high outpatient activity were more likely to receive hospitalists care throughout the study period, although the association had decreased by 2007 to 2009 (highest vs lowest outpatient volume: OR: 1.46, 95% CI: 1.30‐1.63 in 20012003 vs OR: 1.32, 95% CI: 1.20‐1.44 in 20072009). In contrast, PCPs with the lowest inpatient volumes became more likely to use hospitalists by the end of the study period (highest vs lowest inpatient volume: OR: 1.05, 95% CI: 0.95‐1.18 in 20012003 vs OR: 0.55, 95% CI: 0.51‐0.60 in 20072009).
The characteristics of PCPs' practice panels also were associated with patients' likelihood of receiving care from hospitalists. PCPs whose practice panels consisted of patients who were predominantly male, white, or with more outpatient comorbidities were consistently more likely to use hospitalists throughout the study period. PCPs with older patient panels were less likely to use hospitalists in 2001 to 2003, but by 2007 to 2009, they were slightly more likely to do so (oldest vs youngest average outpatient panel age: OR: 0.72, 95% CI: 0.64‐0.81 in 20012003 vs OR: 1.15, 95% CI: 1.05‐1.26 in 20072009).
CONCLUSIONS
Prior studies of the hospitalist model have shown that the likelihood of a patient receiving inpatient care from hospitalists is associated with patient characteristics, hospital characteristics, geographic region, and type of admission.[1, 16, 17] We found that PCP characteristics also predict whether patients receive care from hospitalists and that their use of hospitalists developed dynamically between 2001 to 2009. Although many factors (such as whether patients were admitted to a hospital where their PCP had admitting privileges) can influence the decision to use hospitalists, we found that over one‐third of the variance in whether a hospitalized patient received care from a hospitalist is explained by which PCP the patient saw. In showing that systemic differences exist among PCPs who use hospitalists and those who do not, our study suggests that future research on the hospitalist model should, if possible, adjust for PCP characteristics in addition to hospital and patient factors.
Although this study identifies the existence and magnitude of differences in whether or not PCPs use hospitalists, it cannot explain why the differences exist. We only can offer hypotheses. For example, our finding that PCPs with the most years of practice experience were more likely to use hospitalists in the early 2000s but not in more recent years suggests that in hospital medicine's early years, long‐practicing generalist physicians were choosing between practicing traditionalist medicine and adopting the hospitalists model, but by 2009, experienced generalist physicians had already specialized to either inpatient or outpatient settings earlier in their careers. On the other hand, the decreasing odds of urban PCPs using hospitalists may reflect a relative growth in hospitalist use in less populated areas rather than a change in urban PCPs' practice patterns.
PCPs trained in family medicine have reported less inpatient training and less comfort with providing hospital care,[18, 19] thus it is unsurprising that family physicians were more likely to refer patients to hospitalists. Although a recent study reported that family physicians' inpatient volumes remained constant, whereas those of outpatient internists declined between 2003 and 2012, the analysis used University Health Consortium data and thus reflects practice patterns in academic medical centers.[20] Our data suggest that outside of academia, family physicians have embraced the hospitalists as clinical partners.
Meltzer and Chung had previously proposed an economic model to describe the growing use of hospitalists in the United States. They posited that decisions to adopt the hospitalist model are governed by trade‐offs between coordination costs (eg, time and effort spent coordinating multiple providers across different settings) and switching costs (eg, time spent traveling between the office and the hospital or the effort of adjusting to different work settings).[16] The authors hypothesized that empirical testing of this model would show PCPs are more likely to use hospitalists if they have less available professional time (ie, work fewer hours per week), are female (due to competing demands from domestic responsibilities), have relatively few hospitalized patients, or live in areas with high traffic congestion. Our findings provide empirical evidence to support their division‐of‐labor model in showing that patients were more likely to receive hospitalist care if their PCP was female, practiced in an urban location, had higher outpatient practice volumes, or had lower inpatient volumes.
At first glance, some of our findings appear to contradict our earlier study, which showed that younger, black, male patients are more likely to receive inpatient care from hospitalists.[1] However, that study included patients regardless of whether they had a PCP. This study shows that when patients have a PCP, their PCPs are more likely to refer them to hospitalists if they are older, white, male, and have more comorbid conditions. A potential explanation for this finding is that PCPs may preferentially use hospitalists when caring for older and sicker hospitalized patients. For example, commentators often cite hospitalists' constant availability in the hospital as a valuable resource when caring for acutely ill patients.[21, 22]
Another potential explanation is that despite their preferences, PCPs who care for younger, minority patients lack access to hospitalist services. One large study of Medicare beneficiaries reported that physicians who care for black patients are less well‐trained clinically and often lack access to important clinical resources such as diagnostic imaging and nonemergency hospital admissions.[23] Similarly, international medical graduates are more likely than their US‐trained counterparts to care for underserved patients and to practice in small, independent offices.[24, 25, 26] As hospitalist groups often rely on cross‐subsidization from sources within a large healthcare organization, independent PCPs may have less access to their services when compared with PCPs in managed care organizations or large integrated groups. Viewed in this context, our findings imply that although hospitalists often care for socioeconomically vulnerable patients (eg, younger, uninsured, black men) who lack access to primary care services,[1] they also appear to share care responsibilities for more complex hospitalized patients with PCPs in more affluent communities. Further research may determine if the availability of hospitalists influences racial disparities in hospital care.
Our study has limitations. It is an observational study and thus subject to bias and confounding. As our cohort was formed using fee‐for‐service Medicare data in a single, large state, it may not be generalizable to PCPs who practice in other states, who care for a younger population, or who do not accept Medicare. Our findings also may not reflect the practice patterns of physicians‐in‐training, PCP populations with high board‐certification rates, those employed in temporary positions, or those who interrupt their practices for personal reasons, as we restricted our study to established PCPs who had been in practice long and consistently enough to be associated with 20 hospitalized patients during every year of the study. For example, the lower proportion of female PCPs in our cohort (15.6% in our study in 2009 vs 27.5% reported in a nationally representative 2008 survey[27]) may be explained by our exclusion of women who take prolonged time off for childcare duties. We also did not establish whether patient outcomes or healthcare costs differ between PCPs who adopted the hospitalist model and traditionalists. Finally, we could not examine the effect of a number of PCP factors that could plausibly influence whether or not PCPs relinquish inpatient care to hospitalists, such as their comfort with providing inpatient care, having hospital admitting privileges, having office‐based access to hospitals' electronic medical records, or the distance between their office and the hospital. However, this study lays the groundwork for future studies to explore these factors.
In summary, this study is the first, to our knowledge, to characterize PCPs who relinquished inpatient responsibilities to hospitalists. Our findings suggest that some groups of PCPs are more likely to refer patient to hospitalists, that the relationship between hospitalists and PCPs has evolved over time, and that the hospitalist model still has ample room to grow.
ACKNOWLEDGMENTS
Disclosures: This study was supported by grants from the National Institute on Aging (1RO1‐AG033134 and P30‐AG024832) and the National Cancer Institute (K05‐CA124923). The authors have no financial conflicts of interest to disclose. An oral abstract of this article was presented on May 18, 2013 at the Society of Hospital Medicine Annual Meeting in National Harbor, Maryland.
- , , , . Growth in the care of older patients by hospitalists in the United States. N Engl J Med. 2009;360(11):1102–1112.
- , . Effect of hospitalists on length of stay in the medicare population: variation according to hospital and patient characteristics. J Am Geriatr Soc. 2010;58(9):1649–1657.
- , , , , , . Outcomes of care by hospitalists, general internists, and family physicians. N Engl J Med. 2007;357(25):2589–2600.
- , , , , . Hospitalist care and length of stay in patients requiring complex discharge planning and close clinical monitoring. Arch Intern Med. 2007;167(17):1869–1874.
- , . The impact of hospitalists on the cost and quality of inpatient care in the United States: a research synthesis. Med Care Res Rev. 2005;62(4):379–406.
- , . Association of hospitalist care with medical utilization after discharge: evidence of cost shift from a cohort study. Ann Intern Med. 2011;155(3):152–159.
- , . Hospital care and medical utilization after discharge. Ann Intern Med. 2011;155(10):719–720; author reply 722.
- . Hospital care and medical utilization after discharge. Ann Intern Med. 2011;155(10):721; author reply 722.
- , , , , , . Administrative data algorithms can describe ambulatory physician utilization. Health Serv Res. 2007;42:1783–1796.
- , . Estimating the reliability of continuous measures with Cronbach's alpha or the intraclass correlation coefficient: toward the integration of two traditions. J Clin Epidemiol. 1991;44(4–5):381–390.
- , , . Ability of Medicare claims data to identify nursing home patients: a validation study. Med Care. 2008;46(11):1184–1187.
- , , , . Comorbidity measures for use with administrative data. Med Care. 1998;36(1):8–27.
- , , . A SAS procedure based on mixture models for estimating developmental trajectories. Sociol Methods Res. 2001;29(3):374–393.
- . Group‐Based Modeling of Development. Cambridge, MA: Harvard University Press; 2005.
- , . Group‐based trajectory modeling in clinical research. Annu Rev Clin Psychol. 2010;6:109–138.
- , . Coordination, switching costs and the division of labor in general medicine: an economic explanation for the emergence of hospitalists in the United States. National Bureau of Economic Research Working Paper Series No. 16040. Cambridge, MA: National Bureau of Economic Research; 2010.
- , , , , , . Continuity of outpatient and inpatient care by primary care physicians for hospitalized older adults. JAMA. 2009;301(16):1671–1680.
- . Hospitalists and family physicians: understanding opportunities and risks. J Fam Pract. 2004;53(6):473–481.
- , , , , , . Preparedness of internal medicine and family practice residents for treating common conditions. JAMA. 2002;288(20):2609–2614.
- , , , . The status of adult inpatient care by family physicians at US academic medical centers and affiliated teaching hospitals 2003 to 2012: the impact of the hospitalist movement. Fam Med. 2014;46(2):94–99.
- . Hospitalists and the hospital medicine system of care are good for patient care. Arch Intern Med. 2008;168(12):1254–1256; discussion 1259–1260.
- . Hospitalists in the United States—mission accomplished or work in progress? N Engl J Med. 2004;350(19):1935–1936.
- , , , , . Primary care physicians who treat blacks and whites. N Engl J Med. 2004;351(6):575–584.
- , , , . International medical graduates and the primary care workforce for rural underserved areas. Health Aff (Millwood). 2003;22(2):255–262.
- , , . Medical migration and the physician workforce. International medical graduates and American medicine. JAMA. 1995;273(19):1521–1527.
- , , , , . International medical graduates in family medicine in the United States of America: an exploration of professional characteristics and attitudes. Hum Resour Health. 2006;4:17.
- , , . A snapshot of U.S. physicians: key findings from the 2008 Health Tracking Physician Survey. Data Bull (Cent Stud Health Syst Change). 2009(35):1–11.
© 2015 Society of Hospital Medicine

Trends in Inpatient Continuity of Care
Continuity of care is considered by many physicians to be of critical importance in providing high‐quality patient care. Most of the research to date has focused on continuity in outpatient primary care. Research on outpatient continuity of care has been facilitated by the fact that a number of measurement tools for outpatient continuity exist.1 Outpatient continuity of care has been linked to better quality of life scores,2 lower costs,3 and less emergency room use.4 As hospital medicine has taken on more and more of the responsibility of inpatient care, primary care doctors have voiced concerns about the impact of hospitalists on overall continuity of care5 and the quality of the doctorpatient relationship.6
Recently, continuity of care in the hospital setting has also received attention. When the Accreditation Council for Graduate Medical Education (ACGME) first proposed restrictions to resident duty hours, the importance of continuity of inpatient care began to be debated in earnest in large part because of the increase in hand‐offs which accompanies discontinuity.7, 8 A recent study of hospitalist communication documented that as many as 13% of hand‐offs at the time of service changes are judged as incomplete by the receiving physician. These incomplete hand‐offs were more likely to be associated with uncertainty regarding the plan of care, as well as perceived near misses or adverse events.9 In addition, several case reports and studies suggest that systems with less continuity may have poorer outcomes.7, 1015
Continuity in the hospital setting is likely to be important for several reasons. First, the acuity of a patient's problem during a hospitalization is likely greater than during an outpatient visit. Thus the complexity of information to be transferred between physicians during a hospital stay is correspondingly greater. Second, the diagnostic uncertainty surrounding many admissions leads to complex thought processes that may be difficult to recreate when handing off patient care to another physician. Finally, knowledge of a patient's hospital course and the likely trajectory of care is facilitated by firsthand knowledge of where the patient has been. All this information can be difficult to distill into a brief sign‐out to another physician who assumes care of the patient.
In the current study, we sought to examine the trends over time in continuity of inpatient care. We chose patients likely to be cared for by general internists: those hospitalized for chronic obstructive pulmonary disease (COPD), pneumonia, and congestive heart failure (CHF). The general internists caring for patients in the hospital could be the patient's primary care physician (PCP), a physician covering for the patient's PCP, a physician assigned at admission by the hospital, or a hospitalist. Our goals were to describe the current level of continuity of care in the hospital setting, to examine whether continuity has changed over time, and to determine factors affecting continuity of care.
Methods
We used a 5% national sample of claims data from Medicare beneficiaries for the years 19962006.16 This included Medicare enrollment files, Medicare Provider Analysis and Review (MEDPAR) files, Medicare Carrier files, and Provider of Services (POS) files.17, 18
Establishment of the Study Cohort
Hospital admissions for COPD (Diagnosis Related Group [DRG] 088), pneumonia (DRG 089, 090), and CHF (DRG 127) from 1996 to 2006 for patients older than 66 years in MEDPAR were selected (n = 781,348). We excluded admissions for patients enrolled in health maintenance organizations (HMOs) or who did not have Medicare Parts A and B for the entire year prior to admission (n = 57,558). Admissions with a length of stay >18 days (n = 10,688) were considered outliers (exceeding the 99th percentile) and were excluded. Only admissions cared for by a general internist, family physician, general practitioner, or geriatrician were included (n = 528,453).
Measures
We categorized patients by age, gender, and ethnicity using Medicare enrollment files. We used the Medicaid indicator in the Medicare file as a proxy of low socioeconomic status. We used MEDPAR files to determine the origin of the admission (via the emergency department vs other), weekend versus weekday admission, and DRG. A comorbidity score was generated using the Elixhauser comorbidity scale using inpatient and outpatient billing data.19 In analyses, we listed the total number of comorbidities identified. The specialty of each physician was determined from the codes in the Medicare Carrier files. The 2004 POS files provided hospital‐level information such as zip code, metropolitan size, state, total number of beds, type of hospital, and medical school affiliation. We divided metropolitan size and total number of hospital beds into quartiles. We categorized hospitals as nonprofit, for profit, or public; medical school affiliation was categorized as non, minor, or major.
Determination of Primary Care Physician (PCP)
We identified outpatient visits using American Medical AssociationCommon Procedure Terminology (CPT) evaluation and management codes 99201 to 99205 (new patient) and 99221 to 99215 (established patient encounters). Individual providers were differentiated by using their Unique Provider Identification Number (UPIN). We defined a PCP as a general practitioner, family physician, internist, or geriatrician. Patients had to make at least 3 visits on different days to the same PCP within a year prior to the hospitalization to be categorized as having a PCP.20
Identification of Hospitalists Versus Other Generalist Physicians
As previously described, we defined hospitalists as general internal medicine physicians who derive at least 90% of their Medicare claims for Evaluation and Management services from care provided to hospitalized patients.21 Non‐hospitalist generalist physicians were those generalists who met the criteria for generalists but did not derive at least 90% of their Medicare claims from inpatient medicine.
Definition of Inpatient Continuity of Care
We measured inpatient continuity of care by number of generalist physicians (including hospitalists) who provided care during a hospitalization, through all inpatient claims made during that hospitalization. We considered patients to have had inpatient continuity of care if all billing by generalist physicians was done by one physician during the entire hospitalization.
Statistical Analyses
We calculated the percentage of admissions that received care from 1, 2, or 3 or more generalist physicians during the hospitalization, and stratified by selected patient and hospital characteristics. These proportions were also stratified by whether the patients were cared for by their outpatient PCP or not, and whether they were cared for by hospitalists or not. Based on who cared for the patient during the hospitalization, all admissions were classified as receiving care from: 1) non‐hospitalist generalist physicians, 2) a combination of generalist physicians and hospitalists, and 3) hospitalists only. The effect of patient and hospital characteristics on whether a patient experienced inpatient continuity was evaluated using a hierarchical generalized linear model (HGLM) with a logistic link, adjusting for clustering of admissions within hospitals and all covariates. We repeated our analyses using HGLM with an ordinal logit link to explore the factors associated with number of generalists seen in the hospital. All analyses were performed with SAS version 9.1 (SAS Inc, Cary, NC). The SAS GLIMMIX procedure was used to conduct multilevel analyses.
Results
Between 1996 and 2006, 528,453 patients hospitalized for COPD, pneumonia, and CHF received care by a generalist physician during their hospital stay. Of these, 64.3% were seen by one generalist physician, 26.9% by two generalist physicians, and 8.8% by three or more generalist physicians during hospitalization.
Figure 1 shows the percentage of all patients seen by 1, 2, and 3 or more generalist physicians between 1996 and 2006. The percentage of patients receiving care from one generalist physician declined from 70.7% in 1996 to 59.4% in 2006 (P < 0.001). During the same period, the percentage of patients receiving care from 3 or more generalist physicians increased from 6.5% to 10.7% (P < 0.001). Similar trends were seen for each of the 3 conditions. There was a decrease in overall length of stay during this period, from a mean of 5.7 to 4.9 days (P < 0.001). The increase in the number of generalist physicians providing care during the hospital stay did not correspond to an increase in total number of visits during the hospitalization. The average number of daily visits from a generalist physician was 0.94 (0.30) in 1996 and 0.96 (0.35) in 2006.

Table 1 presents the percentage of patients receiving care from 1, 2, and 3 or more generalist physicians during hospitalization stratified by patient and hospital characteristics. Older adults, females, non‐Hispanic whites, those with higher socioeconomic status, and those with more comorbidities were more likely to receive care by multiple generalist physicians. There was also large variation by geographic region, metropolitan area size, and hospital characteristics. All of these differences were significant at the P < 0.0001 level.
| No. of Generalist Physicians Seen During Hospitalization | ||||
|---|---|---|---|---|
| Characteristic | N | 1 | 2 | 3 (Percentage of Patients) |
| ||||
| Age at admission | ||||
| 6674 | 152,488 | 66.4 | 25.6 | 8.0 |
| 7584 | 226,802 | 63.8 | 27.3 | 8.9 |
| 85+ | 149,163 | 63.0 | 27.7 | 9.3 |
| Gender | ||||
| Male | 216,602 | 65.3 | 26.4 | 8.3 |
| Female | 311,851 | 63.6 | 27.3 | 9.1 |
| Ethnicity | ||||
| White | 461,543 | 63.7 | 27.4 | 9.0 |
| Black | 46,960 | 68.6 | 23.8 | 7.6 |
| Other | 19,950 | 67.9 | 24.5 | 7.6 |
| Low socioeconomic status | ||||
| No | 366,392 | 63.4 | 27.5 | 9.1 |
| Yes | 162,061 | 66.3 | 25.7 | 8.0 |
| Emergency admission | ||||
| No | 188,354 | 66.8 | 25.6 | 7.6 |
| Yes | 340,099 | 62.9 | 27.7 | 9.4 |
| Weekend admission | ||||
| No | 392,150 | 65.7 | 25.8 | 8.5 |
| Yes | 136,303 | 60.1 | 30.3 | 9.6 |
| Diagnosis‐related groups | ||||
| CHF | 213,914 | 65.0 | 26.3 | 8.7 |
| Pneumonia | 195,430 | 62.5 | 28.0 | 9.5 |
| COPD | 119,109 | 66.1 | 26.2 | 7.7 |
| Had a PCP | ||||
| No | 201,016 | 66.5 | 25.4 | 8.0 |
| Yes | 327,437 | 62.9 | 27.9 | 9.2 |
| Seen hospitalist | ||||
| No | 431,784 | 67.8 | 25.1 | 7.0 |
| Yes | 96,669 | 48.5 | 34.9 | 16.6 |
| Charlson comorbidity score | ||||
| 0 | 127,385 | 64.0 | 27.2 | 8.8 |
| 1 | 131,402 | 65.1 | 26.8 | 8.1 |
| 2 | 105,831 | 64.9 | 26.6 | 8.5 |
| 3 | 163,835 | 63.4 | 27.1 | 9.5 |
| ICU use | ||||
| No | 431,462 | 65.3 | 26.5 | 8.2 |
| Yes | 96,991 | 60.1 | 28.7 | 11.2 |
| Length of stay (in days) | ||||
| Mean (SD) | 4.7 (2.9) | 5.8 (3.1) | 8.1 (3.7) | |
| Geographic region | ||||
| New England | 23,572 | 55.7 | 30.8 | 13.5 |
| Middle Atlantic | 78,181 | 60.8 | 27.8 | 11.4 |
| East North Central | 98,072 | 65.7 | 26.3 | 8.0 |
| West North Central | 44,785 | 59.6 | 30.5 | 9.9 |
| South Atlantic | 104,894 | 63.8 | 27.0 | 9.2 |
| East South Central | 51,450 | 67.8 | 24.6 | 7.6 |
| West South Central | 63,493 | 69.2 | 24.8 | 6.0 |
| Mountain | 20,310 | 61.9 | 29.4 | 8.7 |
| Pacific | 36,484 | 66.7 | 26.3 | 7.0 |
| Size of metropolitan area* | ||||
| 1,000,000 | 229,145 | 63.7 | 26.5 | 9.8 |
| 250,000999,999 | 114,448 | 61.0 | 29.2 | 9.8 |
| 100,000249,999 | 11,448 | 61.3 | 30.4 | 8.3 |
| <100,000 | 171,585 | 67.4 | 25.8 | 6.8 |
| Medical school affiliation* | ||||
| Major | 77,605 | 62.9 | 26.8 | 10.3 |
| Minor | 107,144 | 61.5 | 28.4 | 10.1 |
| Non | 341,874 | 65.5 | 26.5 | 8.0 |
| Type of hospital* | ||||
| Nonprofit | 375,888 | 62.7 | 27.8 | 9.5 |
| For profit | 63,898 | 67.5 | 25.5 | 7.0 |
| Public | 86,837 | 68.9 | 24.2 | 6.9 |
| Hospital size* | . | . | . | |
| <200 beds | 232,869 | 67.2 | 25.7 | 7.1 |
| 200349 beds | 135,954 | 62.6 | 27.9 | 9.5 |
| 350499 beds | 77,080 | 61.1 | 28.3 | 10.6 |
| 500 beds | 80,723 | 61.7 | 27.6 | 10.7 |
| Discharge location | ||||
| Home | 361,893 | 66.6 | 26.0 | 7.4 |
| SNF | 94,723 | 57.6 | 30.1 | 12.3 |
| Rehab | 3,030 | 45.7 | 34.2 | 20.1 |
| Death | 22,133 | 63.1 | 25.4 | 11.5 |
| Other | 46,674 | 61.8 | 28.1 | 10.1 |
Table 2 presents the results of a multivariable analysis of factors independently associated with experiencing continuity of care. In this analysis, continuity of care was defined as receiving inpatient care from one generalist physician (vs two or more). In the unadjusted models, the odds of experiencing continuity of care decreased by 5.5% per year from 1996 through 2006, and this decrease did not substantially change after adjusting for all other variables (4.8% yearly decrease). Younger patients, females, black patients, and those with low socioeconomic status were slightly more likely to experience continuity of care. As expected, patients admitted on weekends, emergency admissions, and those with intensive care unit (ICU) stays were less likely to experience continuity. There were marked geographic variations in continuity, with continuity approximately half as likely in New England as in the South. Continuity was greatest in smaller metropolitan areas versus rural and large metropolitan areas. Hospital size and teaching status produced only minor variation.
| Characteristic | Odds Ratio (95% CI) |
|---|---|
| |
| Admission year (increase by year) | 0.952 (0.9500.954) |
| Length of stay (increase by day) | 0.822 (0.8200.823) |
| Had a PCP | |
| No | 1.0 |
| Yes | 0.762 (0.7520.773) |
| Seen by a hospitalist | |
| No | 1.0 |
| Yes | 0.391 (0.3840.398) |
| Age | |
| 6674 | 1.0 |
| 7584 | 0.959 (0.9440.973) |
| 85+ | 0.946 (0.9300.962) |
| Gender | |
| Male | 1.0 |
| Female | 1.047 (1.0331.060) |
| Ethnicity | |
| White | 1.0 |
| Black | 1.126 (1.0971.155) |
| Other | 1.062 (1.0231.103) |
| Low socioeconomic status | |
| No | 1.0 |
| Yes | 1.036 (1.0201.051) |
| Emergency admission | |
| No | 1.0 |
| Yes | 0.864 (0.8510.878) |
| Weekend admission | |
| No | 1.0 |
| Yes | 0.778 (0.7680.789) |
| Diagnosis‐related group | |
| CHF | 1.0 |
| Pneumonia | 0.964 (0.9500.978) |
| COPD | 1.002 (0.9851.019) |
| Charlson comorbidity score | |
| 0 | 1.0 |
| 1 | 1.053 (1.0351.072) |
| 2 | 1.062 (1.0421.083) |
| 3 | 1.040 (1.0221.058) |
| ICU use | |
| No | 1.0 |
| Yes | 0.918 (0.9020.935) |
| Geographic region | |
| Middle Atlantic | 1.0 |
| New England | 0.714 (0.6210.822) |
| East North Central | 1.015 (0.9221.119) |
| West North Central | 0.791 (0.7110.879) |
| South Atlantic | 1.074 (0.9711.186) |
| East South Central | 1.250 (1.1131.403) |
| West South Central | 1.377 (1.2401.530) |
| Mountain | 0.839 (0.7400.951) |
| Pacific | 0.985 (0.8841.097) |
| Size of metropolitan area | |
| 1,000,000 | 1.0 |
| 250,000999,999 | 0.743 (0.6910.798) |
| 100,000249,999 | 0.651 (0.5380.789) |
| <100,000 | 1.062 (0.9911.138) |
| Medical school affiliation | |
| None | 1.0 |
| Minor | 0.889 (0.8270.956) |
| Major | 1.048 (0.9521.154) |
| Type of hospital | |
| Nonprofit | 1.0 |
| For profit | 1.194 (1.1061.289) |
| Public | 1.394 (1.3091.484) |
| Size of hospital | |
| <200 beds | 1.0 |
| 200349 beds | 0.918 (0.8550.986) |
| 350499 beds | 0.962 (0.8721.061) |
| 500 beds | 1.000 (0.8931.119) |
In Table 2 we also show that patients with an established PCP and those who received care from a hospitalist in the hospital were substantially less likely to experience continuity of care. There are several possible interpretations for that finding. For example, it might be that patients admitted to a hospitalist service were likely to see multiple hospitalists. Alternatively, the decreased continuity associated with hospitalists could reflect the fact that some patients cared for predominantly by non‐hospitalists may have seen a hospitalist on call for a sudden change in health status. To further explore these possible explanatory pathways, we constructed three new cohorts: 1) patients receiving all their care from non‐hospitalists, 2) patients receiving all their care from hospitalists, and 3) patients seen by both. As shown in Table 3, in patients seen by non‐hospitalists only, the mean number of generalist physicians seen during hospitalization was slightly greater than in patients cared for only by hospitalists.
| Received Care During Entire Hospitalization | No. of Admissions | Mean (SD) No. of Generalist Physicians Seen During Hospitalization |
|---|---|---|
| ||
| Non‐hospitalist physician | 431,784 | 1.41 (0.68)* |
| Hospitalist physician | 64,662 | 1.34 (0.62)* |
| Both | 32,007 | 2.55 (0.83)* |
We also tested for interactions in Table 2 between admission year and other factors. There was a significant interaction between admission year and having an identifiable PCP in the year prior to admission (Table 2). The odds of experiencing continuity of care decreased more rapidly for patients who did not have a PCP (5.5% per year; 95% CI: 5.2%5.8%) than for those who had one (4.3% per year; 95% CI: 4.1%4.6%).
Discussion
We conducted this study to better understand the degree to which hospitalized patients experience discontinuity of care within a hospital stay and to determine which patients are most likely to experience discontinuity. In our study, we specifically chose admission conditions that would likely be followed primarily by generalist physicians. We found that, over the past decade, discontinuity of care for hospitalized patients has increased substantially, as indicated by the proportion of patients taken care of by more than one generalist physician during a single hospital stay. This occurred even though overall length of stay was decreasing in this same period.
It is perhaps not surprising that inpatient continuity of care has been decreasing in the past 10 years. Outpatient practices are becoming busier, and more doctors are practicing in large group practices, which could lead to several different physicians in the same practice rounding on a hospitalized patient. We have previously demonstrated that hospitalists are caring for an increasing number of patients over this same time period,21 so another possibility is that hospitalist services are being used more often because of this heavy outpatient workload. Our analyses allowed us to test the hypothesis that having hospitalists involved in patient care increases discontinuity.
At first glance, it appears that being cared for by hospitalists may result in worse continuity of care. However, closer scrutiny of the data reveals that the discontinuity ascribed to the hospitalists in the multivariable model appears to be an artifact of defining the hospitalist variable as having been seen by any hospitalist during the hospital stay. This would include patients who saw a hospitalist in addition to their PCP or another non‐hospitalist generalist. When we compared hospitalist‐only care to other generalist care, we could not detect a difference in discontinuity. We know that generalist visits per day to patients has not substantially increased over time, so this discontinuity trend is not explained by having visits by both a hospitalist and the PCP. Therefore, this combination of findings suggests that the increased discontinuity associated with having a hospitalist involved in patient care is likely the result of system issues rather than hospitalist care per se. In fact, patients seem to experience slightly better continuity when they see only hospitalists as opposed to only non‐hospitalists.
What types of systems issues might lead to this finding? Generalists in most settings could choose to involve a hospitalist at any point in the patient's hospital stay. This could occur because of a change in patient acuity requiring the involvement of hospitalists who are present in the hospital more. It is also possible that hospitalists' schedules are created to maximize inpatient continuity of care with individual hospitalists. Even though hospitalists clearly work shifts, the 7 on, 7 off model22 likely results in patients seeing the same physician each day until the switch day. This is in contrast to outpatient primary care doctors whose concentration may be on maintaining continuity within their practice.
As the field of hospital medicine was emerging, many internal medicine physicians from various specialties were concerned about the impact of hospitalists on patient care. In one study, 73% of internal medicine physicians who were not hospitalists thought that hospitalists would worsen continuity of care.23 Primary care and subspecialist internal medicine physicians also expressed the concern that hospitalists could hurt their own relationships with patients,6 presumably because of lost continuity between the inpatient and outpatient settings. However, this fear seems to diminish once hospitalist programs are implemented and primary care doctors have experience with them.23 Our study suggests that the decrease in continuity that has occurred since these studies were published is not likely due to the emergence of hospital medicine, but rather due to other factors that influence who cares for hospitalized patients.
This study had some limitations. Length of stay is an obvious mediator of number of generalist physicians seen. Therefore, the sickest patients are likely to have both a long length of stay and low continuity. We adjusted for this in the multivariable modeling. In addition, given that this study used a large database, certain details are not discernable. For example, we chose to operationalize discontinuity as visits from multiple generalists during a single hospital stay. That is not a perfect definition, but it does represent multiple physicians directing the care of a patient. Importantly, this does not appear to represent continuity with one physician with extra visits from another, as the total number of generalist visits per day did not change over time. It is also possible that patients in the non‐hospitalist group saw physicians only from a single practice, but those details are not included in the database. Finally, we cannot tell what type of hand‐offs were occurring for individual patients during each hospital stay. Despite these disadvantages, using a large database like this one allows for detection of fairly small differences that could still be clinically important.
In summary, hospitalized patients appear to experience less continuity now than 10 years ago. However, the hospitalist model does not appear to play a role in this discontinuity. It is worth exploring in more detail why patients would see both hospitalists and other generalists. This pattern is not surprising, but may have some repercussions in terms of increasing the number of hand‐offs experienced by patients. These could lead to problems with patient safety and quality of care. Future work should explore the reasons for this discontinuity and look at the relationship between inpatient discontinuity outcomes such as quality of care and the doctorpatient relationship.
Acknowledgements
The authors thank Sarah Toombs Smith, PhD, for help in preparation of the manuscript.
- .Defining and measuring interpersonal continuity of care.Ann Fam Med.2003;1(3):134–143.
- ,,.Good continuity of care may improve quality of life in Type 2 diabetes.Diabetes Res Clin Pract.2001;51(1):21–27.
- ,,,.Provider continuity in family medicine: Does it make a difference for total health care costs?Ann Fam Med.2003;1(3):144–148.
- ,,.The effect of continuity of care on emergency department use.Arch Fam Med.2000;9(4):333–338.
- ,,,,,.Physician attitudes toward and prevalence of the hospitalist model of care: Results of a national survey.Am J Med.2000;109(8):648–653.
- ,,.Physician views on caring for hospitalized patients and the hospitalist model of inpatient care.J Gen Intern Med.2001;16(2):116–119.
- ,,,,,.Systematic review: Effects of resident work hours on patient safety.Ann Intern Med.2004;141(11):851–857.
- ,,.Balancing continuity of care with residents' limited work hours: Defining the implications.Acad Med.2005;80(1):39–43.
- ,,.Understanding communication during hospitalist sevice changes: A mixed methods study.J Hosp Med.2009;4:535–540.
- ,,,Center for Safety in Emergency C. Profiles in patient safety: Emergency care transitions.Acad Emerg Med.2003;10(4):364–367.
- .Fumbled handoffs: One dropped ball after another.Ann Intern Med.2005;142(5):352–358.
- Agency for Healthcare Research and Quality. Fumbled handoff.2004. Available at: http://www.webmm.ahrq.gov/printview.aspx?caseID=55. Accessed December 27, 2005.
- ,,.Graduate medical education and patient safety: A busy—and occasionally hazardous—intersection.Ann Intern Med.2006;145(8):592–598.
- ,,,,.Does housestaff discontinuity of care increase the risk for preventable adverse events?Ann Intern Med.1994;121(11):866–872.
- ,,,.The impact of a regulation restricting medical house staff working hours on the quality of patient care.JAMA.1993;269(3):374–378.
- Centers for Medicare and Medicaid Services. Standard analytical files. Available at: http://www.cms.hhs.gov/IdentifiableDataFiles/02_Standard AnalyticalFiles.asp. Accessed March 1,2009.
- Centers for Medicare and Medicaid Services. Nonidentifiable data files: Provider of services files. Available at: http://www.cms.hhs.gov/NonIdentifiableDataFiles/04_ProviderofSerrvicesFile.asp. Accessed March 1,2009.
- Research Data Assistance Center. Medicare data file description. Available at: http://www.resdac.umn.edu/Medicare/file_descriptions.asp. Accessed March 1,2009.
- ,,,.Effect of comorbidity adjustment on CMS criteria for kidney transplant center performance.Am J Transplant.2009;9:506–516.
- ,,,,,.Continuity of outpatient and inpatient care by primary care physicians for hospitalized older adults.JAMA.2009;301:1671–1680.
- ,,,.Growth in the care of older patients by hospitalists in the United States.N Engl J Med. 2009;360:1102–1112.
- HCPro Inc.Medical Staff Leader blog.2010. Available at: http://blogs. hcpro.com/medicalstaff/2010/01/free‐form‐example‐seven‐day‐on‐seven‐day‐off‐hospitalist‐schedule/. Accessed November 20, 2010.
- ,,,.How physicians perceive hospitalist services after implementation: Anticipation vs reality.Arch Intern Med.2003;163(19):2330–2336.
Continuity of care is considered by many physicians to be of critical importance in providing high‐quality patient care. Most of the research to date has focused on continuity in outpatient primary care. Research on outpatient continuity of care has been facilitated by the fact that a number of measurement tools for outpatient continuity exist.1 Outpatient continuity of care has been linked to better quality of life scores,2 lower costs,3 and less emergency room use.4 As hospital medicine has taken on more and more of the responsibility of inpatient care, primary care doctors have voiced concerns about the impact of hospitalists on overall continuity of care5 and the quality of the doctorpatient relationship.6
Recently, continuity of care in the hospital setting has also received attention. When the Accreditation Council for Graduate Medical Education (ACGME) first proposed restrictions to resident duty hours, the importance of continuity of inpatient care began to be debated in earnest in large part because of the increase in hand‐offs which accompanies discontinuity.7, 8 A recent study of hospitalist communication documented that as many as 13% of hand‐offs at the time of service changes are judged as incomplete by the receiving physician. These incomplete hand‐offs were more likely to be associated with uncertainty regarding the plan of care, as well as perceived near misses or adverse events.9 In addition, several case reports and studies suggest that systems with less continuity may have poorer outcomes.7, 1015
Continuity in the hospital setting is likely to be important for several reasons. First, the acuity of a patient's problem during a hospitalization is likely greater than during an outpatient visit. Thus the complexity of information to be transferred between physicians during a hospital stay is correspondingly greater. Second, the diagnostic uncertainty surrounding many admissions leads to complex thought processes that may be difficult to recreate when handing off patient care to another physician. Finally, knowledge of a patient's hospital course and the likely trajectory of care is facilitated by firsthand knowledge of where the patient has been. All this information can be difficult to distill into a brief sign‐out to another physician who assumes care of the patient.
In the current study, we sought to examine the trends over time in continuity of inpatient care. We chose patients likely to be cared for by general internists: those hospitalized for chronic obstructive pulmonary disease (COPD), pneumonia, and congestive heart failure (CHF). The general internists caring for patients in the hospital could be the patient's primary care physician (PCP), a physician covering for the patient's PCP, a physician assigned at admission by the hospital, or a hospitalist. Our goals were to describe the current level of continuity of care in the hospital setting, to examine whether continuity has changed over time, and to determine factors affecting continuity of care.
Methods
We used a 5% national sample of claims data from Medicare beneficiaries for the years 19962006.16 This included Medicare enrollment files, Medicare Provider Analysis and Review (MEDPAR) files, Medicare Carrier files, and Provider of Services (POS) files.17, 18
Establishment of the Study Cohort
Hospital admissions for COPD (Diagnosis Related Group [DRG] 088), pneumonia (DRG 089, 090), and CHF (DRG 127) from 1996 to 2006 for patients older than 66 years in MEDPAR were selected (n = 781,348). We excluded admissions for patients enrolled in health maintenance organizations (HMOs) or who did not have Medicare Parts A and B for the entire year prior to admission (n = 57,558). Admissions with a length of stay >18 days (n = 10,688) were considered outliers (exceeding the 99th percentile) and were excluded. Only admissions cared for by a general internist, family physician, general practitioner, or geriatrician were included (n = 528,453).
Measures
We categorized patients by age, gender, and ethnicity using Medicare enrollment files. We used the Medicaid indicator in the Medicare file as a proxy of low socioeconomic status. We used MEDPAR files to determine the origin of the admission (via the emergency department vs other), weekend versus weekday admission, and DRG. A comorbidity score was generated using the Elixhauser comorbidity scale using inpatient and outpatient billing data.19 In analyses, we listed the total number of comorbidities identified. The specialty of each physician was determined from the codes in the Medicare Carrier files. The 2004 POS files provided hospital‐level information such as zip code, metropolitan size, state, total number of beds, type of hospital, and medical school affiliation. We divided metropolitan size and total number of hospital beds into quartiles. We categorized hospitals as nonprofit, for profit, or public; medical school affiliation was categorized as non, minor, or major.
Determination of Primary Care Physician (PCP)
We identified outpatient visits using American Medical AssociationCommon Procedure Terminology (CPT) evaluation and management codes 99201 to 99205 (new patient) and 99221 to 99215 (established patient encounters). Individual providers were differentiated by using their Unique Provider Identification Number (UPIN). We defined a PCP as a general practitioner, family physician, internist, or geriatrician. Patients had to make at least 3 visits on different days to the same PCP within a year prior to the hospitalization to be categorized as having a PCP.20
Identification of Hospitalists Versus Other Generalist Physicians
As previously described, we defined hospitalists as general internal medicine physicians who derive at least 90% of their Medicare claims for Evaluation and Management services from care provided to hospitalized patients.21 Non‐hospitalist generalist physicians were those generalists who met the criteria for generalists but did not derive at least 90% of their Medicare claims from inpatient medicine.
Definition of Inpatient Continuity of Care
We measured inpatient continuity of care by number of generalist physicians (including hospitalists) who provided care during a hospitalization, through all inpatient claims made during that hospitalization. We considered patients to have had inpatient continuity of care if all billing by generalist physicians was done by one physician during the entire hospitalization.
Statistical Analyses
We calculated the percentage of admissions that received care from 1, 2, or 3 or more generalist physicians during the hospitalization, and stratified by selected patient and hospital characteristics. These proportions were also stratified by whether the patients were cared for by their outpatient PCP or not, and whether they were cared for by hospitalists or not. Based on who cared for the patient during the hospitalization, all admissions were classified as receiving care from: 1) non‐hospitalist generalist physicians, 2) a combination of generalist physicians and hospitalists, and 3) hospitalists only. The effect of patient and hospital characteristics on whether a patient experienced inpatient continuity was evaluated using a hierarchical generalized linear model (HGLM) with a logistic link, adjusting for clustering of admissions within hospitals and all covariates. We repeated our analyses using HGLM with an ordinal logit link to explore the factors associated with number of generalists seen in the hospital. All analyses were performed with SAS version 9.1 (SAS Inc, Cary, NC). The SAS GLIMMIX procedure was used to conduct multilevel analyses.
Results
Between 1996 and 2006, 528,453 patients hospitalized for COPD, pneumonia, and CHF received care by a generalist physician during their hospital stay. Of these, 64.3% were seen by one generalist physician, 26.9% by two generalist physicians, and 8.8% by three or more generalist physicians during hospitalization.
Figure 1 shows the percentage of all patients seen by 1, 2, and 3 or more generalist physicians between 1996 and 2006. The percentage of patients receiving care from one generalist physician declined from 70.7% in 1996 to 59.4% in 2006 (P < 0.001). During the same period, the percentage of patients receiving care from 3 or more generalist physicians increased from 6.5% to 10.7% (P < 0.001). Similar trends were seen for each of the 3 conditions. There was a decrease in overall length of stay during this period, from a mean of 5.7 to 4.9 days (P < 0.001). The increase in the number of generalist physicians providing care during the hospital stay did not correspond to an increase in total number of visits during the hospitalization. The average number of daily visits from a generalist physician was 0.94 (0.30) in 1996 and 0.96 (0.35) in 2006.
Table 1 presents the percentage of patients receiving care from 1, 2, and 3 or more generalist physicians during hospitalization stratified by patient and hospital characteristics. Older adults, females, non‐Hispanic whites, those with higher socioeconomic status, and those with more comorbidities were more likely to receive care by multiple generalist physicians. There was also large variation by geographic region, metropolitan area size, and hospital characteristics. All of these differences were significant at the P < 0.0001 level.
| No. of Generalist Physicians Seen During Hospitalization | ||||
|---|---|---|---|---|
| Characteristic | N | 1 | 2 | 3 (Percentage of Patients) |
| ||||
| Age at admission | ||||
| 6674 | 152,488 | 66.4 | 25.6 | 8.0 |
| 7584 | 226,802 | 63.8 | 27.3 | 8.9 |
| 85+ | 149,163 | 63.0 | 27.7 | 9.3 |
| Gender | ||||
| Male | 216,602 | 65.3 | 26.4 | 8.3 |
| Female | 311,851 | 63.6 | 27.3 | 9.1 |
| Ethnicity | ||||
| White | 461,543 | 63.7 | 27.4 | 9.0 |
| Black | 46,960 | 68.6 | 23.8 | 7.6 |
| Other | 19,950 | 67.9 | 24.5 | 7.6 |
| Low socioeconomic status | ||||
| No | 366,392 | 63.4 | 27.5 | 9.1 |
| Yes | 162,061 | 66.3 | 25.7 | 8.0 |
| Emergency admission | ||||
| No | 188,354 | 66.8 | 25.6 | 7.6 |
| Yes | 340,099 | 62.9 | 27.7 | 9.4 |
| Weekend admission | ||||
| No | 392,150 | 65.7 | 25.8 | 8.5 |
| Yes | 136,303 | 60.1 | 30.3 | 9.6 |
| Diagnosis‐related groups | ||||
| CHF | 213,914 | 65.0 | 26.3 | 8.7 |
| Pneumonia | 195,430 | 62.5 | 28.0 | 9.5 |
| COPD | 119,109 | 66.1 | 26.2 | 7.7 |
| Had a PCP | ||||
| No | 201,016 | 66.5 | 25.4 | 8.0 |
| Yes | 327,437 | 62.9 | 27.9 | 9.2 |
| Seen hospitalist | ||||
| No | 431,784 | 67.8 | 25.1 | 7.0 |
| Yes | 96,669 | 48.5 | 34.9 | 16.6 |
| Charlson comorbidity score | ||||
| 0 | 127,385 | 64.0 | 27.2 | 8.8 |
| 1 | 131,402 | 65.1 | 26.8 | 8.1 |
| 2 | 105,831 | 64.9 | 26.6 | 8.5 |
| 3 | 163,835 | 63.4 | 27.1 | 9.5 |
| ICU use | ||||
| No | 431,462 | 65.3 | 26.5 | 8.2 |
| Yes | 96,991 | 60.1 | 28.7 | 11.2 |
| Length of stay (in days) | ||||
| Mean (SD) | 4.7 (2.9) | 5.8 (3.1) | 8.1 (3.7) | |
| Geographic region | ||||
| New England | 23,572 | 55.7 | 30.8 | 13.5 |
| Middle Atlantic | 78,181 | 60.8 | 27.8 | 11.4 |
| East North Central | 98,072 | 65.7 | 26.3 | 8.0 |
| West North Central | 44,785 | 59.6 | 30.5 | 9.9 |
| South Atlantic | 104,894 | 63.8 | 27.0 | 9.2 |
| East South Central | 51,450 | 67.8 | 24.6 | 7.6 |
| West South Central | 63,493 | 69.2 | 24.8 | 6.0 |
| Mountain | 20,310 | 61.9 | 29.4 | 8.7 |
| Pacific | 36,484 | 66.7 | 26.3 | 7.0 |
| Size of metropolitan area* | ||||
| 1,000,000 | 229,145 | 63.7 | 26.5 | 9.8 |
| 250,000999,999 | 114,448 | 61.0 | 29.2 | 9.8 |
| 100,000249,999 | 11,448 | 61.3 | 30.4 | 8.3 |
| <100,000 | 171,585 | 67.4 | 25.8 | 6.8 |
| Medical school affiliation* | ||||
| Major | 77,605 | 62.9 | 26.8 | 10.3 |
| Minor | 107,144 | 61.5 | 28.4 | 10.1 |
| Non | 341,874 | 65.5 | 26.5 | 8.0 |
| Type of hospital* | ||||
| Nonprofit | 375,888 | 62.7 | 27.8 | 9.5 |
| For profit | 63,898 | 67.5 | 25.5 | 7.0 |
| Public | 86,837 | 68.9 | 24.2 | 6.9 |
| Hospital size* | . | . | . | |
| <200 beds | 232,869 | 67.2 | 25.7 | 7.1 |
| 200349 beds | 135,954 | 62.6 | 27.9 | 9.5 |
| 350499 beds | 77,080 | 61.1 | 28.3 | 10.6 |
| 500 beds | 80,723 | 61.7 | 27.6 | 10.7 |
| Discharge location | ||||
| Home | 361,893 | 66.6 | 26.0 | 7.4 |
| SNF | 94,723 | 57.6 | 30.1 | 12.3 |
| Rehab | 3,030 | 45.7 | 34.2 | 20.1 |
| Death | 22,133 | 63.1 | 25.4 | 11.5 |
| Other | 46,674 | 61.8 | 28.1 | 10.1 |
Table 2 presents the results of a multivariable analysis of factors independently associated with experiencing continuity of care. In this analysis, continuity of care was defined as receiving inpatient care from one generalist physician (vs two or more). In the unadjusted models, the odds of experiencing continuity of care decreased by 5.5% per year from 1996 through 2006, and this decrease did not substantially change after adjusting for all other variables (4.8% yearly decrease). Younger patients, females, black patients, and those with low socioeconomic status were slightly more likely to experience continuity of care. As expected, patients admitted on weekends, emergency admissions, and those with intensive care unit (ICU) stays were less likely to experience continuity. There were marked geographic variations in continuity, with continuity approximately half as likely in New England as in the South. Continuity was greatest in smaller metropolitan areas versus rural and large metropolitan areas. Hospital size and teaching status produced only minor variation.
| Characteristic | Odds Ratio (95% CI) |
|---|---|
| |
| Admission year (increase by year) | 0.952 (0.9500.954) |
| Length of stay (increase by day) | 0.822 (0.8200.823) |
| Had a PCP | |
| No | 1.0 |
| Yes | 0.762 (0.7520.773) |
| Seen by a hospitalist | |
| No | 1.0 |
| Yes | 0.391 (0.3840.398) |
| Age | |
| 6674 | 1.0 |
| 7584 | 0.959 (0.9440.973) |
| 85+ | 0.946 (0.9300.962) |
| Gender | |
| Male | 1.0 |
| Female | 1.047 (1.0331.060) |
| Ethnicity | |
| White | 1.0 |
| Black | 1.126 (1.0971.155) |
| Other | 1.062 (1.0231.103) |
| Low socioeconomic status | |
| No | 1.0 |
| Yes | 1.036 (1.0201.051) |
| Emergency admission | |
| No | 1.0 |
| Yes | 0.864 (0.8510.878) |
| Weekend admission | |
| No | 1.0 |
| Yes | 0.778 (0.7680.789) |
| Diagnosis‐related group | |
| CHF | 1.0 |
| Pneumonia | 0.964 (0.9500.978) |
| COPD | 1.002 (0.9851.019) |
| Charlson comorbidity score | |
| 0 | 1.0 |
| 1 | 1.053 (1.0351.072) |
| 2 | 1.062 (1.0421.083) |
| 3 | 1.040 (1.0221.058) |
| ICU use | |
| No | 1.0 |
| Yes | 0.918 (0.9020.935) |
| Geographic region | |
| Middle Atlantic | 1.0 |
| New England | 0.714 (0.6210.822) |
| East North Central | 1.015 (0.9221.119) |
| West North Central | 0.791 (0.7110.879) |
| South Atlantic | 1.074 (0.9711.186) |
| East South Central | 1.250 (1.1131.403) |
| West South Central | 1.377 (1.2401.530) |
| Mountain | 0.839 (0.7400.951) |
| Pacific | 0.985 (0.8841.097) |
| Size of metropolitan area | |
| 1,000,000 | 1.0 |
| 250,000999,999 | 0.743 (0.6910.798) |
| 100,000249,999 | 0.651 (0.5380.789) |
| <100,000 | 1.062 (0.9911.138) |
| Medical school affiliation | |
| None | 1.0 |
| Minor | 0.889 (0.8270.956) |
| Major | 1.048 (0.9521.154) |
| Type of hospital | |
| Nonprofit | 1.0 |
| For profit | 1.194 (1.1061.289) |
| Public | 1.394 (1.3091.484) |
| Size of hospital | |
| <200 beds | 1.0 |
| 200349 beds | 0.918 (0.8550.986) |
| 350499 beds | 0.962 (0.8721.061) |
| 500 beds | 1.000 (0.8931.119) |
In Table 2 we also show that patients with an established PCP and those who received care from a hospitalist in the hospital were substantially less likely to experience continuity of care. There are several possible interpretations for that finding. For example, it might be that patients admitted to a hospitalist service were likely to see multiple hospitalists. Alternatively, the decreased continuity associated with hospitalists could reflect the fact that some patients cared for predominantly by non‐hospitalists may have seen a hospitalist on call for a sudden change in health status. To further explore these possible explanatory pathways, we constructed three new cohorts: 1) patients receiving all their care from non‐hospitalists, 2) patients receiving all their care from hospitalists, and 3) patients seen by both. As shown in Table 3, in patients seen by non‐hospitalists only, the mean number of generalist physicians seen during hospitalization was slightly greater than in patients cared for only by hospitalists.
| Received Care During Entire Hospitalization | No. of Admissions | Mean (SD) No. of Generalist Physicians Seen During Hospitalization |
|---|---|---|
| ||
| Non‐hospitalist physician | 431,784 | 1.41 (0.68)* |
| Hospitalist physician | 64,662 | 1.34 (0.62)* |
| Both | 32,007 | 2.55 (0.83)* |
We also tested for interactions in Table 2 between admission year and other factors. There was a significant interaction between admission year and having an identifiable PCP in the year prior to admission (Table 2). The odds of experiencing continuity of care decreased more rapidly for patients who did not have a PCP (5.5% per year; 95% CI: 5.2%5.8%) than for those who had one (4.3% per year; 95% CI: 4.1%4.6%).
Discussion
We conducted this study to better understand the degree to which hospitalized patients experience discontinuity of care within a hospital stay and to determine which patients are most likely to experience discontinuity. In our study, we specifically chose admission conditions that would likely be followed primarily by generalist physicians. We found that, over the past decade, discontinuity of care for hospitalized patients has increased substantially, as indicated by the proportion of patients taken care of by more than one generalist physician during a single hospital stay. This occurred even though overall length of stay was decreasing in this same period.
It is perhaps not surprising that inpatient continuity of care has been decreasing in the past 10 years. Outpatient practices are becoming busier, and more doctors are practicing in large group practices, which could lead to several different physicians in the same practice rounding on a hospitalized patient. We have previously demonstrated that hospitalists are caring for an increasing number of patients over this same time period,21 so another possibility is that hospitalist services are being used more often because of this heavy outpatient workload. Our analyses allowed us to test the hypothesis that having hospitalists involved in patient care increases discontinuity.
At first glance, it appears that being cared for by hospitalists may result in worse continuity of care. However, closer scrutiny of the data reveals that the discontinuity ascribed to the hospitalists in the multivariable model appears to be an artifact of defining the hospitalist variable as having been seen by any hospitalist during the hospital stay. This would include patients who saw a hospitalist in addition to their PCP or another non‐hospitalist generalist. When we compared hospitalist‐only care to other generalist care, we could not detect a difference in discontinuity. We know that generalist visits per day to patients has not substantially increased over time, so this discontinuity trend is not explained by having visits by both a hospitalist and the PCP. Therefore, this combination of findings suggests that the increased discontinuity associated with having a hospitalist involved in patient care is likely the result of system issues rather than hospitalist care per se. In fact, patients seem to experience slightly better continuity when they see only hospitalists as opposed to only non‐hospitalists.
What types of systems issues might lead to this finding? Generalists in most settings could choose to involve a hospitalist at any point in the patient's hospital stay. This could occur because of a change in patient acuity requiring the involvement of hospitalists who are present in the hospital more. It is also possible that hospitalists' schedules are created to maximize inpatient continuity of care with individual hospitalists. Even though hospitalists clearly work shifts, the 7 on, 7 off model22 likely results in patients seeing the same physician each day until the switch day. This is in contrast to outpatient primary care doctors whose concentration may be on maintaining continuity within their practice.
As the field of hospital medicine was emerging, many internal medicine physicians from various specialties were concerned about the impact of hospitalists on patient care. In one study, 73% of internal medicine physicians who were not hospitalists thought that hospitalists would worsen continuity of care.23 Primary care and subspecialist internal medicine physicians also expressed the concern that hospitalists could hurt their own relationships with patients,6 presumably because of lost continuity between the inpatient and outpatient settings. However, this fear seems to diminish once hospitalist programs are implemented and primary care doctors have experience with them.23 Our study suggests that the decrease in continuity that has occurred since these studies were published is not likely due to the emergence of hospital medicine, but rather due to other factors that influence who cares for hospitalized patients.
This study had some limitations. Length of stay is an obvious mediator of number of generalist physicians seen. Therefore, the sickest patients are likely to have both a long length of stay and low continuity. We adjusted for this in the multivariable modeling. In addition, given that this study used a large database, certain details are not discernable. For example, we chose to operationalize discontinuity as visits from multiple generalists during a single hospital stay. That is not a perfect definition, but it does represent multiple physicians directing the care of a patient. Importantly, this does not appear to represent continuity with one physician with extra visits from another, as the total number of generalist visits per day did not change over time. It is also possible that patients in the non‐hospitalist group saw physicians only from a single practice, but those details are not included in the database. Finally, we cannot tell what type of hand‐offs were occurring for individual patients during each hospital stay. Despite these disadvantages, using a large database like this one allows for detection of fairly small differences that could still be clinically important.
In summary, hospitalized patients appear to experience less continuity now than 10 years ago. However, the hospitalist model does not appear to play a role in this discontinuity. It is worth exploring in more detail why patients would see both hospitalists and other generalists. This pattern is not surprising, but may have some repercussions in terms of increasing the number of hand‐offs experienced by patients. These could lead to problems with patient safety and quality of care. Future work should explore the reasons for this discontinuity and look at the relationship between inpatient discontinuity outcomes such as quality of care and the doctorpatient relationship.
Acknowledgements
The authors thank Sarah Toombs Smith, PhD, for help in preparation of the manuscript.
- .Defining and measuring interpersonal continuity of care.Ann Fam Med.2003;1(3):134–143.
- ,,.Good continuity of care may improve quality of life in Type 2 diabetes.Diabetes Res Clin Pract.2001;51(1):21–27.
- ,,,.Provider continuity in family medicine: Does it make a difference for total health care costs?Ann Fam Med.2003;1(3):144–148.
- ,,.The effect of continuity of care on emergency department use.Arch Fam Med.2000;9(4):333–338.
- ,,,,,.Physician attitudes toward and prevalence of the hospitalist model of care: Results of a national survey.Am J Med.2000;109(8):648–653.
- ,,.Physician views on caring for hospitalized patients and the hospitalist model of inpatient care.J Gen Intern Med.2001;16(2):116–119.
- ,,,,,.Systematic review: Effects of resident work hours on patient safety.Ann Intern Med.2004;141(11):851–857.
- ,,.Balancing continuity of care with residents' limited work hours: Defining the implications.Acad Med.2005;80(1):39–43.
- ,,.Understanding communication during hospitalist sevice changes: A mixed methods study.J Hosp Med.2009;4:535–540.
- ,,,Center for Safety in Emergency C. Profiles in patient safety: Emergency care transitions.Acad Emerg Med.2003;10(4):364–367.
- .Fumbled handoffs: One dropped ball after another.Ann Intern Med.2005;142(5):352–358.
- Agency for Healthcare Research and Quality. Fumbled handoff.2004. Available at: http://www.webmm.ahrq.gov/printview.aspx?caseID=55. Accessed December 27, 2005.
- ,,.Graduate medical education and patient safety: A busy—and occasionally hazardous—intersection.Ann Intern Med.2006;145(8):592–598.
- ,,,,.Does housestaff discontinuity of care increase the risk for preventable adverse events?Ann Intern Med.1994;121(11):866–872.
- ,,,.The impact of a regulation restricting medical house staff working hours on the quality of patient care.JAMA.1993;269(3):374–378.
- Centers for Medicare and Medicaid Services. Standard analytical files. Available at: http://www.cms.hhs.gov/IdentifiableDataFiles/02_Standard AnalyticalFiles.asp. Accessed March 1,2009.
- Centers for Medicare and Medicaid Services. Nonidentifiable data files: Provider of services files. Available at: http://www.cms.hhs.gov/NonIdentifiableDataFiles/04_ProviderofSerrvicesFile.asp. Accessed March 1,2009.
- Research Data Assistance Center. Medicare data file description. Available at: http://www.resdac.umn.edu/Medicare/file_descriptions.asp. Accessed March 1,2009.
- ,,,.Effect of comorbidity adjustment on CMS criteria for kidney transplant center performance.Am J Transplant.2009;9:506–516.
- ,,,,,.Continuity of outpatient and inpatient care by primary care physicians for hospitalized older adults.JAMA.2009;301:1671–1680.
- ,,,.Growth in the care of older patients by hospitalists in the United States.N Engl J Med. 2009;360:1102–1112.
- HCPro Inc.Medical Staff Leader blog.2010. Available at: http://blogs. hcpro.com/medicalstaff/2010/01/free‐form‐example‐seven‐day‐on‐seven‐day‐off‐hospitalist‐schedule/. Accessed November 20, 2010.
- ,,,.How physicians perceive hospitalist services after implementation: Anticipation vs reality.Arch Intern Med.2003;163(19):2330–2336.
Copyright © 2011 Society of Hospital Medicine