User login
Teaching Physical Examination to Medical Students on Inpatient Medicine Teams: A Prospective, Mixed-Methods Descriptive Study
1Medical College of Wisconsin Affiliated Hospitals, Milwaukee, Wisconsin. At the time of this study, Dr. Bergl was with the Division of General Internal Medicine, Medical College of Wisconsin, Milwaukee, Wisconsin. 2Medical College of Wisconsin, Milwaukee, Wisconsin.Physical examination (PE) is a core clinical skill in undergraduate medical education.1 Although the optimal approach to teaching clinical skills is debated, robust preclinical curricula should generally be followed by iterative skill development during clinical rotations.2,3
The internal medicine rotation represents a critical time to enhance PE skills. Diagnostic decision making and PE are highly prioritized competencies for the internal medicine clerkship,4 and students will likely utilize many core examination skills1,2 during this time. Bedside teaching of PE during the internal medicine service also provides an opportunity for students to receive feedback based on direct observation,5 a sine qua non of competency-based assessment.
Unfortunately, current internal medicine training environments limit opportunities for workplace-based instruction in PE. Recent studies suggest diminishing time spent on bedside patient care and teaching, with computer-based “indirect patient care” dominating much of the clinical workday of internal medicine services.6-8 However, the literature does not delineate how often medical students are enhancing their PE skills during clinical rotations or describe how the educational environment may influence PE teaching.
We aimed to describe the content and context of PE instruction during the internal medicine clerkship workflow. Specifically, we sought to explore what strategies physician team members used to teach PE to students. We also sought to describe factors in the inpatient learning environment that might explain why physical examination (PE) instruction occurs infrequently.
METHODS
We conducted a prospective mixed-methods study using time motion analysis, checklists on clinical teaching, and daily open-ended observations written by a trained observer from June through August 2015 at a single academic medical center. Subjects were recruited from internal medicine teaching teams and were allowed to opt out. Teaching teams had 2 formats: (1) traditional team with an attending physician (hospitalist or general internist), a senior resident, 2 interns, a fourth-year medical student, and 2 third-year students or (2) hospitalist team in which a third-year student works directly with a hospitalist and advanced practitioner. The proposal was submitted to the Medical College of Wisconsin Institutional Review Board and deemed exempt from further review.
All observations were carried out by a single investigator (A.T.), who was a second-year medical student at the time. To train this observer and to pilot the data collection instruments, our lead investigator (P.B.) directly supervised our observer on 4 separate occasions, totaling over 12 hours of mentored co-observation. Immediately after each training session, both investigators (A.T. and P.B.) debriefed to compare notes, to review checklists on recorded observations, and to discuss areas of uncertainty. During the training period, formal metrics of agreement (eg, kappa coefficients) were not gathered, as data collection instruments were still being refined.
Observation periods were centered on third-year medical students and their interactions with patients and members of the teaching team. Observed activities included pre-rounding, teaching rounds with the attending physician, and new patient admissions during call days. Observations generally occurred between the hours of 7 AM and 6 PM, and we limited periods of observation to 3 consecutive hours to minimize observer fatigue. Observation periods were selected to maximize the number of subjects and teams observed, to adequately capture pre-rounding and new admissions activities, and to account for variations in rounding styles throughout the call cycle. Teams were excluded if a member of the study team was an attending physician on the clinical team or if any member of the patient care team had opted out of the study.
Data were collected on paper checklists that included idealized bedside teaching activities around PE. Teaching activities were identified through a review of relevant literature9,10 and were further informed by our senior investigator’s own experience with faculty development in this area11 and team members’ attendance at bedside teaching workshops. At the end of each day, our observer also wrote brief observations that summarized factors affecting bedside teaching of PE. Checklist data were transferred to an Excel file (Microsoft), and written observations were imported into NVivo 10 (QRS International, Melbourne, Australia) for coding and analysis.
Checklist data were analyzed using simple descriptive statistics. We compared time spent on various types of rounding using ANOVA, and we used a Student two-tailed t-test to compare the amount of time students spent examining patients on pre-rounds versus new admissions. To ascertain differences in the frequency of PE teaching activities by location, we used chi-squared tests. Statistical analysis was performed using embedded statistics functions in Microsoft Excel. A P value of <.05 was used as the cut-off for significance.
We analyzed the written observations using conventional qualitative content analysis. Two investigators (A.T. and P.B.) reviewed the written comments and used open coding to devise a preliminary inductive coding scheme. Codes were refined iteratively, and a schema of categories and nodes was outlined in a codebook that was periodically reviewed by the entire research team. The coding investigators met regularly to ensure consistency in coding, and a third team member remained available to reconcile significant disagreements in code definitions.
RESULTS
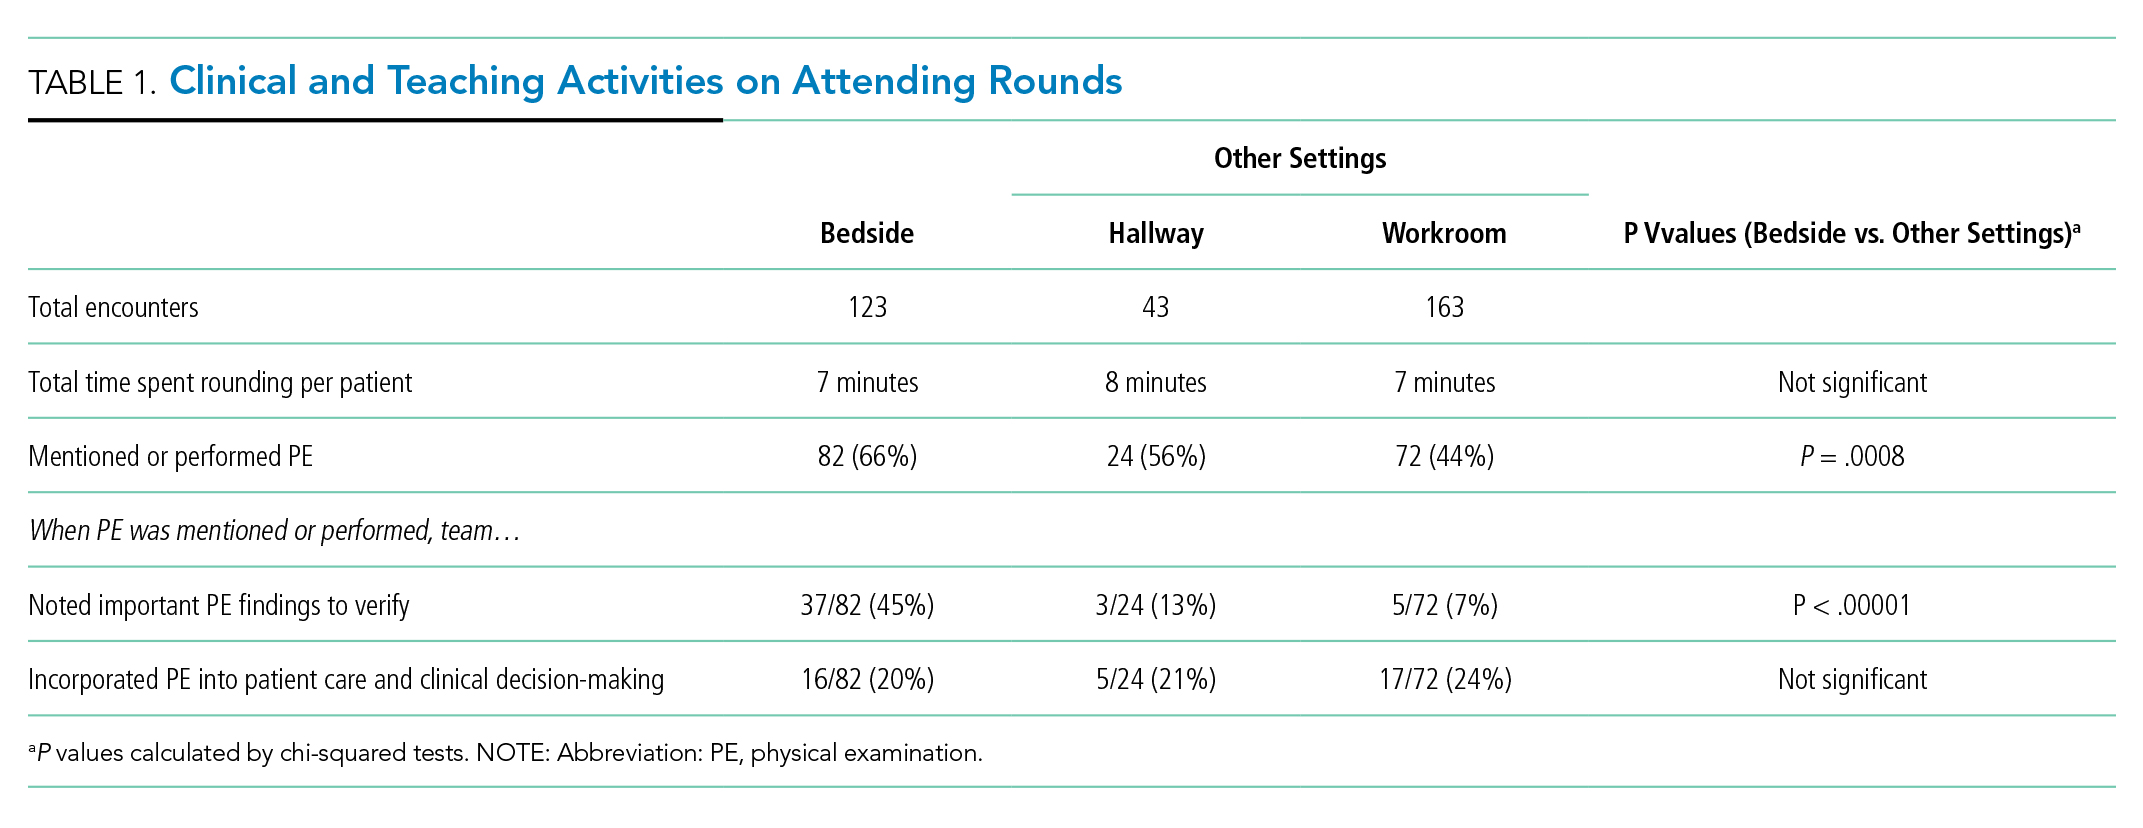
Eighty-one subjects participated in the study: 21 were attending physicians, 12 residents, 21 interns, 11 senior medical students, and 26 junior medical students. We observed 16 distinct inpatient teaching teams and 329 unique patient-related events (discussions and/or patient-clinician encounters), with most events being observed during attending rounds (269/329, or 82%). There were 123 encounters at the bedside, averaging 7 minutes; 43 encounters occurred in the hallway, averaging 8 minutes each; and 163 encounters occurred in a workroom and averaged 7 minutes per patient discussion. We also observed 28 student-patient encounters during pre-round activities and 30 student-patient encounters during new admissions.
Teaching and Direct Observation
During 28 pre-rounding encounters, students usually examined the patient (26 out of 28 instances, 93%) but were observed only 4 times doing so (out of 26 instances, or 15%). During 30 new patient admissions, students examined 27 patients (90%) and had their PE observed 6 times (out of 27 instances, or 22%). There were no significant differences in frequency of these activities (P > .05, chi-squared) between pre-rounds or new admissions.
Observations on Teaching Strategies
In the written observations, we categorized various methods being used to teach PE. Bedside teaching of PE most often involved teachers simply describing or discussing physical findings (42 mentions in observations) or verifying a student’s reported findings (15 mentions). Teachers were also observed to use bedside teaching to contextualize findings (13 mentions), such as relating the quality of bowel sounds to the patient’s constipation or to discuss expected pupillary light reflexes in a neurologically intact patient. Less commonly, attending physicians narrated steps in their PE technique (9 mentions). Students were infrequently encouraged to practice a specific PE skill again (7 mentions) or allowed to re-examine and reconsider their initial interpretations (5 mentions).
DISCUSSION
This observational study of clinical teaching on internal medicine teaching services demonstrates that PE teaching is most likely to occur during bedside rounding. However, even in bedside encounters, most PE instruction is limited to physician team members pointing out significant findings. Although physical findings were mentioned for the majority of patients seen on rounds, attending physicians infrequently verified students’ or residents’ findings, demonstrated technique, or incorporated PE into clinical decision making. We witnessed an alarming dearth of direct observation of students and almost no real-time feedback in performing and teaching PE. Thus, students rarely had opportunities to engage in higher-order learning activities related to PE on the internal medicine rotation.
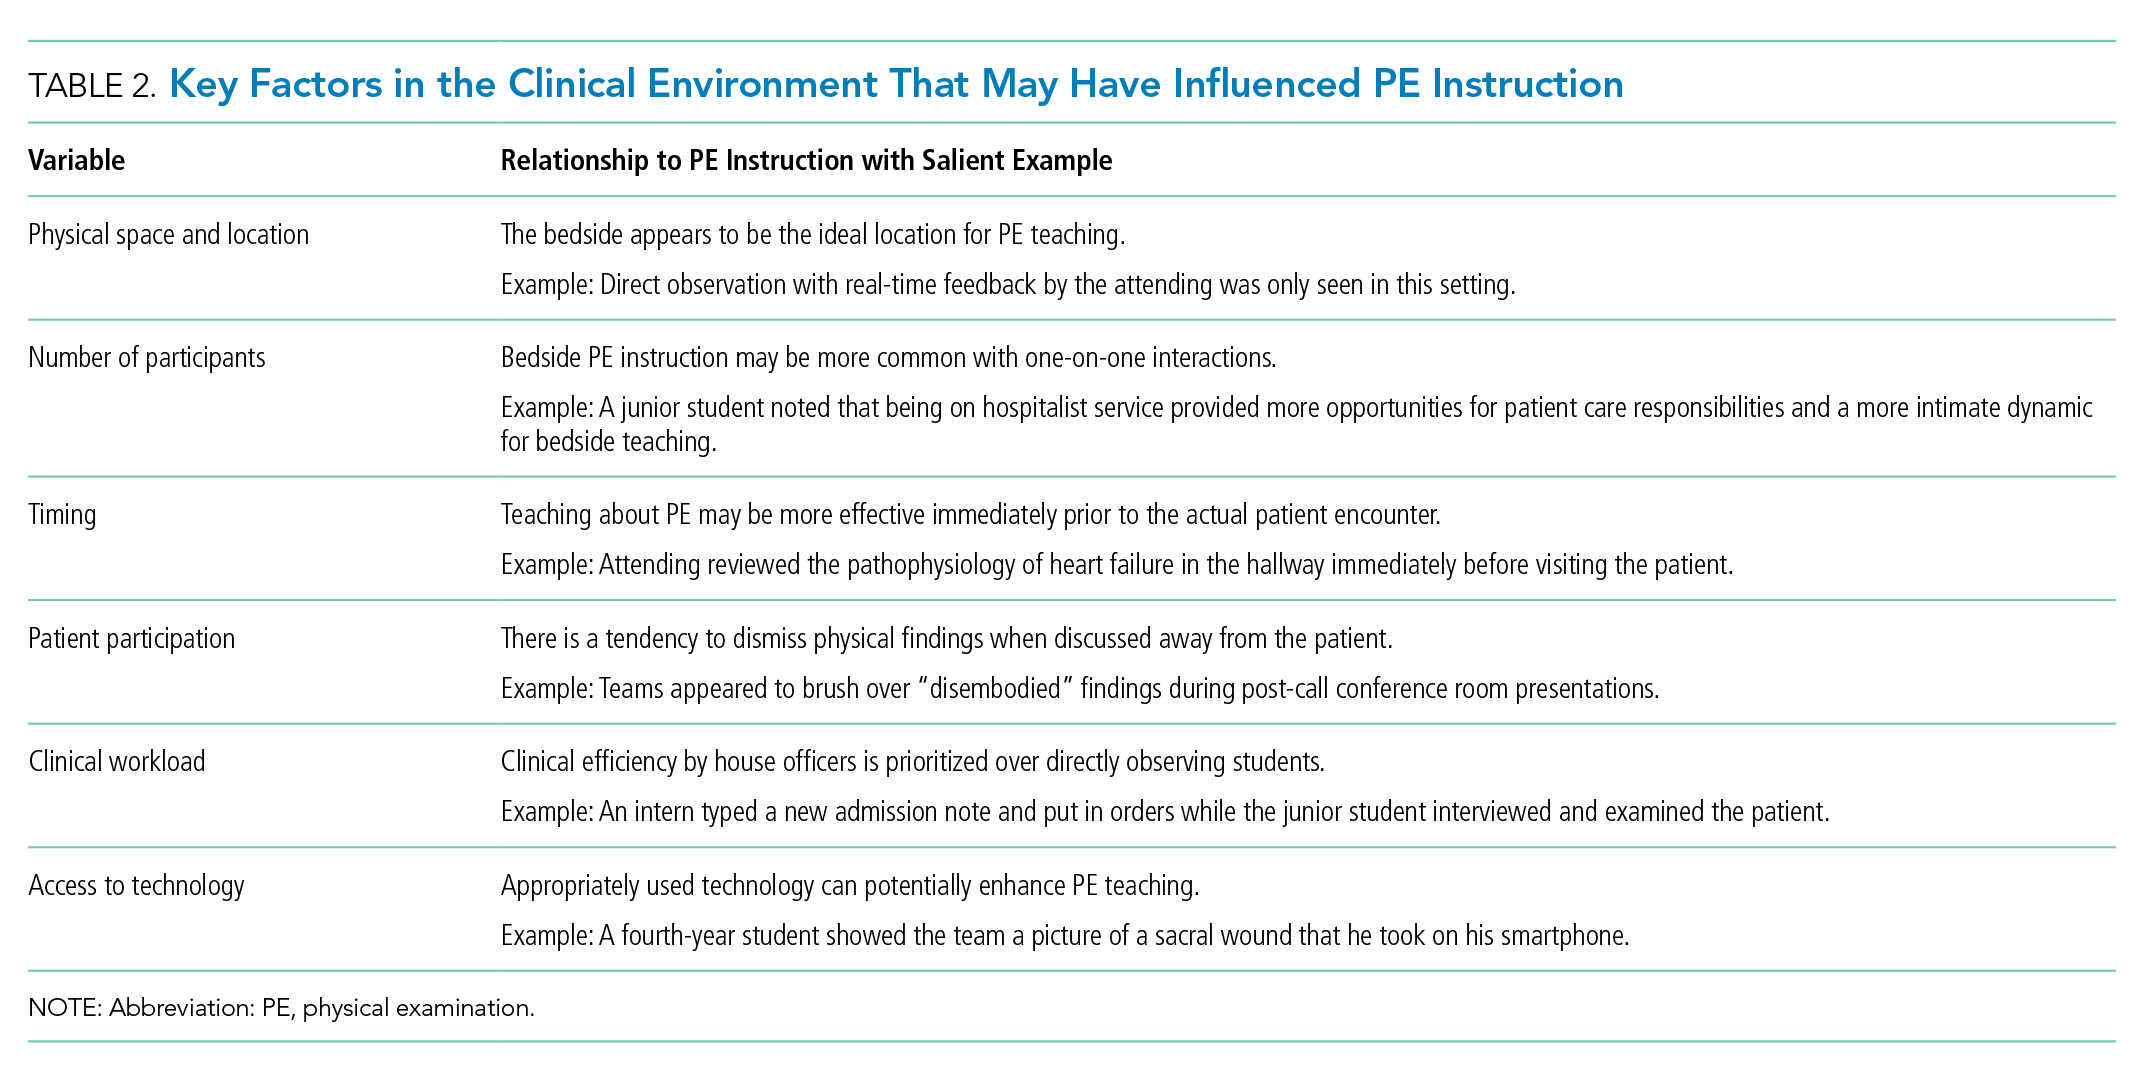
We posit that the learning environment influenced PE instruction on the internal medicine rotation. To optimize inpatient teaching of PE, attending physicians need to consider the factors we identified in Table 2. Such teaching may be effective with a more limited number of participants and without distraction from technology. Time constraints are one of the major perceived barriers to bedside teaching of PE, and our data support this concern, as teams spent an average of only 7 minutes on each bedside encounter. However, many of the strategies observed to be used in real-time PE instruction, such as validating the learners’ findings or examining patients as a team, naturally fit into clinical routines and generally do not require extra thought or preparation.
One of the key strengths of our study is the use of direct observation of students and their teachers. This study is unique in its exclusive focus on PE and its description of factors affecting PE teaching activities on an internal medicine service. This observational, descriptive study also has obvious limitations. The study was conducted at a single institution during a limited time period. Moreover, the study period June through August, which was chosen based on our observer’s availability, includes the transition to a new academic year (July 1, 2015) when medical students and residents were becoming acclimated to their new roles. Additionally, the data were collected by a single researcher, and observer bias may affect the results of qualitative analysis of journal entries.
In conclusion, this study highlights the infrequency of applied PE skills in the daily clinical and educational workflow of internal medicine teaching teams. These findings may reflect a more widespread problem in clinical education, and replication of our findings at other teaching centers could galvanize faculty development around bedside PE teaching.
Disclosures
Dr. Bergl has nothing to disclose. Ms. Taylor reports grant support from the Cohen Endowment for Medical Student Research at the Medical College of Wisconsin during the conduct of the study. Mrs. Klumb, Ms. Quirk, Dr. Muntz, and Dr. Fletcher have nothing to disclose.
Funding
This work was funded in part by the Cohen Endowment for Medical Student Research at the Medical College of Wisconsin.
1. Corbett E, Berkow R, Bernstein L, et al on behalf of the AAMC Task Force on the Preclerkship Clinical Skills Education of Medical Students. Recommendations for clinical skills curricula for undergraduate medical education. Achieving excellence in basic clinical method through clinical skills education: The medical school clinical skills curriculum. Association of American Medical Colleges; 2008. https://www.aamc.org/download/130608/data/clinicalskills_oct09.qxd.pdf.pdf. Accessed July 12, 2017.
2. Gowda D, Blatt B, Fink MJ, Kosowicz LY, Baecker A, Silvestri RC. A core physical exam for medical students: Results of a national survey. Acad Med. 2014;89(3):436-442. PubMed
3. Uchida T, Farnan JM, Schwartz JE, Heiman HL. Teaching the physical examination: A longitudinal strategy for tomorrow’s physicians. Acad Med. 2014;89(3):373-375. PubMed
4. Fazio S, De Fer T, Goroll A . Core Medicine Clerkship Curriculum Guide: A resource for teachers and learners. Clerkship Directors in Internal Medicine and Society of General Internal Medicine; 2006. http://www.im.org/d/do/2285/. Accessed July 12, 2017.
5. Gonzalo J, Heist B, Duffy B, et al. Content and timing of feedback and reflection: A multi-center qualitative study of experienced bedside teachers. BMC Med Educ. 2014;(14):212. doi: 10.1186/1472-6920-14-212. PubMed
6. Stickrath C, Noble M, Prochazka A, et al. Attending rounds in the current era: What is and is not happening. JAMA Intern Med. 2013;173(12):1084-1089. PubMed
7. Block L, Habicht R, Wu AW, et al. In the wake of the 2003 and 2011 duty hours regulations, how do internal medicine interns spend their time? J Gen Intern Med. 2013;28(8):1042-1047. PubMed
8. Wenger N, Méan M, Castioni J, Marques-Vidal P, Waeber G, Garnier A. Allocation of internal medicine resident time in a Swiss Hospital: A time and motion study of day and evening shifts. Ann Intern Med. 2017;166(8):579-586. PubMed
9. Ramani S. Twelve tips for excellent physical examination teaching. Med Teach. 2008;30(9-10):851-856. PubMed
10. Gonzalo JD, Heist BS, Duffy BL, et al. The art of bedside rounds: A multi-center qualitative study of strategies used by experienced bedside teachers. J Gen Intern Med. 2013;28(3):412-420. PubMed
11. Janicik RW, Fletcher KE. Teaching at the bedside: A new model. Med Teach. 2003;25(2):127-130. PubMed
1Medical College of Wisconsin Affiliated Hospitals, Milwaukee, Wisconsin. At the time of this study, Dr. Bergl was with the Division of General Internal Medicine, Medical College of Wisconsin, Milwaukee, Wisconsin. 2Medical College of Wisconsin, Milwaukee, Wisconsin.Physical examination (PE) is a core clinical skill in undergraduate medical education.1 Although the optimal approach to teaching clinical skills is debated, robust preclinical curricula should generally be followed by iterative skill development during clinical rotations.2,3
The internal medicine rotation represents a critical time to enhance PE skills. Diagnostic decision making and PE are highly prioritized competencies for the internal medicine clerkship,4 and students will likely utilize many core examination skills1,2 during this time. Bedside teaching of PE during the internal medicine service also provides an opportunity for students to receive feedback based on direct observation,5 a sine qua non of competency-based assessment.
Unfortunately, current internal medicine training environments limit opportunities for workplace-based instruction in PE. Recent studies suggest diminishing time spent on bedside patient care and teaching, with computer-based “indirect patient care” dominating much of the clinical workday of internal medicine services.6-8 However, the literature does not delineate how often medical students are enhancing their PE skills during clinical rotations or describe how the educational environment may influence PE teaching.
We aimed to describe the content and context of PE instruction during the internal medicine clerkship workflow. Specifically, we sought to explore what strategies physician team members used to teach PE to students. We also sought to describe factors in the inpatient learning environment that might explain why physical examination (PE) instruction occurs infrequently.
METHODS
We conducted a prospective mixed-methods study using time motion analysis, checklists on clinical teaching, and daily open-ended observations written by a trained observer from June through August 2015 at a single academic medical center. Subjects were recruited from internal medicine teaching teams and were allowed to opt out. Teaching teams had 2 formats: (1) traditional team with an attending physician (hospitalist or general internist), a senior resident, 2 interns, a fourth-year medical student, and 2 third-year students or (2) hospitalist team in which a third-year student works directly with a hospitalist and advanced practitioner. The proposal was submitted to the Medical College of Wisconsin Institutional Review Board and deemed exempt from further review.
All observations were carried out by a single investigator (A.T.), who was a second-year medical student at the time. To train this observer and to pilot the data collection instruments, our lead investigator (P.B.) directly supervised our observer on 4 separate occasions, totaling over 12 hours of mentored co-observation. Immediately after each training session, both investigators (A.T. and P.B.) debriefed to compare notes, to review checklists on recorded observations, and to discuss areas of uncertainty. During the training period, formal metrics of agreement (eg, kappa coefficients) were not gathered, as data collection instruments were still being refined.
Observation periods were centered on third-year medical students and their interactions with patients and members of the teaching team. Observed activities included pre-rounding, teaching rounds with the attending physician, and new patient admissions during call days. Observations generally occurred between the hours of 7 AM and 6 PM, and we limited periods of observation to 3 consecutive hours to minimize observer fatigue. Observation periods were selected to maximize the number of subjects and teams observed, to adequately capture pre-rounding and new admissions activities, and to account for variations in rounding styles throughout the call cycle. Teams were excluded if a member of the study team was an attending physician on the clinical team or if any member of the patient care team had opted out of the study.
Data were collected on paper checklists that included idealized bedside teaching activities around PE. Teaching activities were identified through a review of relevant literature9,10 and were further informed by our senior investigator’s own experience with faculty development in this area11 and team members’ attendance at bedside teaching workshops. At the end of each day, our observer also wrote brief observations that summarized factors affecting bedside teaching of PE. Checklist data were transferred to an Excel file (Microsoft), and written observations were imported into NVivo 10 (QRS International, Melbourne, Australia) for coding and analysis.
Checklist data were analyzed using simple descriptive statistics. We compared time spent on various types of rounding using ANOVA, and we used a Student two-tailed t-test to compare the amount of time students spent examining patients on pre-rounds versus new admissions. To ascertain differences in the frequency of PE teaching activities by location, we used chi-squared tests. Statistical analysis was performed using embedded statistics functions in Microsoft Excel. A P value of <.05 was used as the cut-off for significance.
We analyzed the written observations using conventional qualitative content analysis. Two investigators (A.T. and P.B.) reviewed the written comments and used open coding to devise a preliminary inductive coding scheme. Codes were refined iteratively, and a schema of categories and nodes was outlined in a codebook that was periodically reviewed by the entire research team. The coding investigators met regularly to ensure consistency in coding, and a third team member remained available to reconcile significant disagreements in code definitions.
RESULTS
Eighty-one subjects participated in the study: 21 were attending physicians, 12 residents, 21 interns, 11 senior medical students, and 26 junior medical students. We observed 16 distinct inpatient teaching teams and 329 unique patient-related events (discussions and/or patient-clinician encounters), with most events being observed during attending rounds (269/329, or 82%). There were 123 encounters at the bedside, averaging 7 minutes; 43 encounters occurred in the hallway, averaging 8 minutes each; and 163 encounters occurred in a workroom and averaged 7 minutes per patient discussion. We also observed 28 student-patient encounters during pre-round activities and 30 student-patient encounters during new admissions.
Teaching and Direct Observation
During 28 pre-rounding encounters, students usually examined the patient (26 out of 28 instances, 93%) but were observed only 4 times doing so (out of 26 instances, or 15%). During 30 new patient admissions, students examined 27 patients (90%) and had their PE observed 6 times (out of 27 instances, or 22%). There were no significant differences in frequency of these activities (P > .05, chi-squared) between pre-rounds or new admissions.
Observations on Teaching Strategies
In the written observations, we categorized various methods being used to teach PE. Bedside teaching of PE most often involved teachers simply describing or discussing physical findings (42 mentions in observations) or verifying a student’s reported findings (15 mentions). Teachers were also observed to use bedside teaching to contextualize findings (13 mentions), such as relating the quality of bowel sounds to the patient’s constipation or to discuss expected pupillary light reflexes in a neurologically intact patient. Less commonly, attending physicians narrated steps in their PE technique (9 mentions). Students were infrequently encouraged to practice a specific PE skill again (7 mentions) or allowed to re-examine and reconsider their initial interpretations (5 mentions).
DISCUSSION
This observational study of clinical teaching on internal medicine teaching services demonstrates that PE teaching is most likely to occur during bedside rounding. However, even in bedside encounters, most PE instruction is limited to physician team members pointing out significant findings. Although physical findings were mentioned for the majority of patients seen on rounds, attending physicians infrequently verified students’ or residents’ findings, demonstrated technique, or incorporated PE into clinical decision making. We witnessed an alarming dearth of direct observation of students and almost no real-time feedback in performing and teaching PE. Thus, students rarely had opportunities to engage in higher-order learning activities related to PE on the internal medicine rotation.
We posit that the learning environment influenced PE instruction on the internal medicine rotation. To optimize inpatient teaching of PE, attending physicians need to consider the factors we identified in Table 2. Such teaching may be effective with a more limited number of participants and without distraction from technology. Time constraints are one of the major perceived barriers to bedside teaching of PE, and our data support this concern, as teams spent an average of only 7 minutes on each bedside encounter. However, many of the strategies observed to be used in real-time PE instruction, such as validating the learners’ findings or examining patients as a team, naturally fit into clinical routines and generally do not require extra thought or preparation.
One of the key strengths of our study is the use of direct observation of students and their teachers. This study is unique in its exclusive focus on PE and its description of factors affecting PE teaching activities on an internal medicine service. This observational, descriptive study also has obvious limitations. The study was conducted at a single institution during a limited time period. Moreover, the study period June through August, which was chosen based on our observer’s availability, includes the transition to a new academic year (July 1, 2015) when medical students and residents were becoming acclimated to their new roles. Additionally, the data were collected by a single researcher, and observer bias may affect the results of qualitative analysis of journal entries.
In conclusion, this study highlights the infrequency of applied PE skills in the daily clinical and educational workflow of internal medicine teaching teams. These findings may reflect a more widespread problem in clinical education, and replication of our findings at other teaching centers could galvanize faculty development around bedside PE teaching.
Disclosures
Dr. Bergl has nothing to disclose. Ms. Taylor reports grant support from the Cohen Endowment for Medical Student Research at the Medical College of Wisconsin during the conduct of the study. Mrs. Klumb, Ms. Quirk, Dr. Muntz, and Dr. Fletcher have nothing to disclose.
Funding
This work was funded in part by the Cohen Endowment for Medical Student Research at the Medical College of Wisconsin.
1. Corbett E, Berkow R, Bernstein L, et al on behalf of the AAMC Task Force on the Preclerkship Clinical Skills Education of Medical Students. Recommendations for clinical skills curricula for undergraduate medical education. Achieving excellence in basic clinical method through clinical skills education: The medical school clinical skills curriculum. Association of American Medical Colleges; 2008. https://www.aamc.org/download/130608/data/clinicalskills_oct09.qxd.pdf.pdf. Accessed July 12, 2017.
2. Gowda D, Blatt B, Fink MJ, Kosowicz LY, Baecker A, Silvestri RC. A core physical exam for medical students: Results of a national survey. Acad Med. 2014;89(3):436-442. PubMed
3. Uchida T, Farnan JM, Schwartz JE, Heiman HL. Teaching the physical examination: A longitudinal strategy for tomorrow’s physicians. Acad Med. 2014;89(3):373-375. PubMed
4. Fazio S, De Fer T, Goroll A . Core Medicine Clerkship Curriculum Guide: A resource for teachers and learners. Clerkship Directors in Internal Medicine and Society of General Internal Medicine; 2006. http://www.im.org/d/do/2285/. Accessed July 12, 2017.
5. Gonzalo J, Heist B, Duffy B, et al. Content and timing of feedback and reflection: A multi-center qualitative study of experienced bedside teachers. BMC Med Educ. 2014;(14):212. doi: 10.1186/1472-6920-14-212. PubMed
6. Stickrath C, Noble M, Prochazka A, et al. Attending rounds in the current era: What is and is not happening. JAMA Intern Med. 2013;173(12):1084-1089. PubMed
7. Block L, Habicht R, Wu AW, et al. In the wake of the 2003 and 2011 duty hours regulations, how do internal medicine interns spend their time? J Gen Intern Med. 2013;28(8):1042-1047. PubMed
8. Wenger N, Méan M, Castioni J, Marques-Vidal P, Waeber G, Garnier A. Allocation of internal medicine resident time in a Swiss Hospital: A time and motion study of day and evening shifts. Ann Intern Med. 2017;166(8):579-586. PubMed
9. Ramani S. Twelve tips for excellent physical examination teaching. Med Teach. 2008;30(9-10):851-856. PubMed
10. Gonzalo JD, Heist BS, Duffy BL, et al. The art of bedside rounds: A multi-center qualitative study of strategies used by experienced bedside teachers. J Gen Intern Med. 2013;28(3):412-420. PubMed
11. Janicik RW, Fletcher KE. Teaching at the bedside: A new model. Med Teach. 2003;25(2):127-130. PubMed
© 2018 Society of Hospital Medicine
Intrateam Coverage and Handoffs
We have traditionally viewed continuity of care with a particular intern as important for high‐quality inpatient care, but this continuity is difficult to achieve. As we move to a model of team rather than individual continuity, information transfers between team members become critical.
When discontinuity between the primary team and a cross‐covering team occurs, this informational continuity is managed through formal handoffs.[1] Accordingly, there has been ample research on handoffs between different teams,[2, 3, 4, 5] but there has been little published literature to date to describe handoffs between members of the same team. Therefore, we set out (1) to learn how interns view intrateam handoffs and (2) to identify intern‐perceived problems with intrateam handoffs.
MATERIALS AND METHODS
This was a cross‐sectional survey study done at a 500‐bed academic medical center affiliated with a large internal medicine residency program. The survey was developed by the study team and reviewed for content and clarity by our chief residents and by 2 nationally known medical educators outside our institution. Study participants were internal medicine interns. Interns in this program rotate through 3 hospitals and do 7 to 8 ward months. The call schedules are different at each site (see Supporting Information, Appendix A, in the online version of this article). Opportunities for intrateam coverage of 1 intern by another include clinics (1/week), days off (1/week), some overnight periods, and occasional educational conferences. When possible, daily attending rounds include the entire team, but due to clinics, conferences, and days off, it is rare that the entire team is present. Bedside rounds are done at the discretion of the attending. The survey (see Supporting Information, Appendix B, in the online version of this article) included questions regarding situations when the respondent was covering his or her cointern's patients (cointern was defined as another intern on the respondent's same inpatient ward team). We also asked about situations when a cointern was covering the respondent's patients. For those questions, we considered answers of >60% to be a majority. We distributed this anonymous survey on 2 dates (January 2012 and March 2012) during regularly scheduled conferences. We mainly report descriptive findings. We also compared the percentage of study participants reporting problems when covering cointerns' patients to the percentage of study participants reporting problems when cointerns covered their (study participants') patients using 2, with significance set at P<0.05. This study was designated as exempt by the institutional review board.
RESULTS
Thirty‐four interns completed the survey out of a total of 44 interns present at the conferences (response rate=77%). There were 46 interns in the program, including categorical, medicine‐pediatrics, and preliminary interns. The mean age was 28 (standard deviation 2.8). Two‐thirds of respondents were female, and 65% were categorical.
Difference Between Intra‐ and Interteam Handoffs
Eighty‐eight percent felt that a handoff to a cointern was different than a handoff to an overnight cross‐cover intern; many interns said they assumed their cointerns had at least some knowledge of their patients, and therefore put less time and detail into their handoffs. When covering for their cointern, 47% reported feeling the same amount of responsibility as for their own patients, whereas 38% of interns reported feeling much or somewhat less responsible for their cointerns' patients and the remainder (15%) felt somewhat or much more responsible.
Knowledge of Cointern's Patients
Most (65%) interns reported at least 3 days in their last inpatient ward month when they covered a cointern's patient that had not been formally handed off to them. Forty‐five percent of respondents reported seldom or never receiving a written sign‐out on their cointern's patients.
Respondents were asked to think about times before they had covered their cointern's patients. Sixty‐eight percent of respondents reported knowing the number 1 problem for the majority of their cointern's patients. Twenty‐four percent reported having ever actually seen the majority of their cointern's patients. Only 3% of respondents said they had ever examined the majority of their cointern's patients prior to providing coverage.
Perceived Problems With Intrateam Coverage
While covering a cointern's patients, nearly half reported missing changes in patients' exams and forgetting to order labs or imaging. More than half reported unexpected family meetings or phone calls. In contrast, respondents noted more problems when their cointern had covered for them (Table 1). Seventy‐nine percent felt that patient care was at least sometimes delayed because of incomplete knowledge due to intrateam coverage.
| What Problems Have You Noticed | ||
|---|---|---|
| While Respondent Covers a Cointern's Patient? | After Respondent's Patients Were Covered by Cointern? | |
| ||
| Missed labs | 18% | 33% |
| Missed consult recommendations | 21% | 30% |
| Missed exam changes | 42% | 27% |
| Forgot to follow‐up imaging | 27% | 30% |
| Forgot to order labs or imaging | 42%a | 70%a |
| Failure to adjust meds | 27% | 27% |
| Unexpected family meeting/phone calls | 61%a | 30%a |
| Did not understand the plan from cointern's notes | 45% | 27% |
DISCUSSION
In our program, interns commonly cover for each other. This intrateam coverage frequently occurs without a formal handoff, and interns do not always know key information about their cointern's patients. Interns reported frequent problems with intrateam coverage such as missed lab results, consult recommendations, and changes in the physical exam. These missed items could result in delayed diagnoses and delayed treatment. These problems have been identified in interteam handoffs as well.[6, 7] Even in optimized interteam handoffs, receivers fail to identify the most important piece of information about 60% of the patients,[8] and our results mirror this finding.
The finding that fewer than a quarter of the respondents have ever seen the majority of their cointerns' patients is certainly of concern. This likely arises from several inter‐related factors: reduced hours for housestaff, schedules built to accommodate the reduced hours (eg, overlapping rather than simultaneous shifts), and the choice of some attendings to not take the entire team around to see every patient. In institutions where bedside rounds as a team are the norm, this finding will be less applicable, but others across the country have noticed this trend[9, 10] and have tried to counteract it.[11] This situation has both patient care and educational implications. The main patient care implication is that the other team members may be less able to seamlessly assume care when the primary intern is away or busy. Therefore, intrateam coverage becomes much more like traditional cross‐coverage of another team's patients, during which there is no expectation that the covering person will have ever seen the patients for whom they are assuming care. The main educational implication of not seeing the cointerns' patients is that the interns are seeing only half the patients that they could otherwise see. Learning medicine is experiential, and limiting opportunities for seeing and examining patients is unwise in this era of reduced time spent in the hospital.
Limitations of this study include being conducted in a single program. It will be important for other sites to assess their own practices with respect to intrateam handoffs. Another limitation is that it was a cross‐sectional survey subject to recall bias. We may have obtained more detailed information if we had conducted interviews. We also did not quantify the frequency of missed labs, consult recommendations, and physical examination changes that occurred during intrateam coverage. Finally, we did not independently verify the problems identified by the interns.
Some possible strategies to address this issue include (1) treating intrateam handoffs like interteam handoffs by implementing a formal system, (2) better utilizing senior residents/faculty when interns are covering for each other, (3) using bedside attending rounds to increase the exposure of all team members to the team's patients, (4) block scheduling to avoid absences due to clinics,[12] and (5) better communication and teamwork training to increase team awareness of all patients.[13]
Disclosures
Disclosures: There was no external funding for this work. However, this material is the result of work supported with resources and the use of facilities at the Clement J. Zablocki VA Medical Center, Milwaukee, WI. This work was presented in poster format at the national Society of Hospital Medicine meeting in National Harbor, Maryland in May 2013. The authors have no conflicts of interest to report.
- , , , et al. Residents' and attending physicians' handoffs: a systematic review of the literature. Acad Med. 2009;84(12):1775–1787.
- , , . Standardized sign‐out reduces intern perception of medical errors on the general internal medicine ward. Teach Learn Med. 2009;21(2):121–126.
- , , , . Faculty member review and feedback using a sign‐out checklist: improving intern written sign‐out. Acad Med. 2012;87(8):1125–1131.
- , , , , . Using a computerized sign‐out program to improve continuity of inpatient care and prevent adverse events. Jt Comm J Qual Improv. 1998;24(2):77–87.
- , , , . Transfers of patient care between house staff on internal medicine wards. Arch Intern Med. 2006;166:1173–1177.
- , , , , . Communication failures in patient sign‐out and suggestions for improvement: a critical incident analysis. Qual Saf Health Care 2005;14(6):401–407.
- , , , , . Consequences of inadequate sign‐out for patient care. Arch Intern Med. 2008;168(16):1755–1760.
- , , , , . Interns overestimate the effectiveness of their hand‐off communication. Pediatrics. 2010;125(3):491–496.
- . Culture shock—patient as icon, icon as patient. N Engl J Med. 2008;359(26):2748–2751.
- , , , . Attending rounds and bedside case presentations: medical student and medicine resident experiences and attitudes. Teach Learn Med. 2009;21(2):105–110.
- , , , . The return of bedside rounds: an educational intervention. J Gen Intern Med. 2010;25(8):792–798.
- , , , et al. The ambulatory long‐block: an accreditation council for graduate medical education (ACGME) educational innovations project (EIP). J Gen Intern Med. 2008;23(7):921–926.
- AHRQ. TeamSTEPPS: National Implementation. Available at: http://teamstepps.ahrq.gov/. Accessed June 19, 2014.
We have traditionally viewed continuity of care with a particular intern as important for high‐quality inpatient care, but this continuity is difficult to achieve. As we move to a model of team rather than individual continuity, information transfers between team members become critical.
When discontinuity between the primary team and a cross‐covering team occurs, this informational continuity is managed through formal handoffs.[1] Accordingly, there has been ample research on handoffs between different teams,[2, 3, 4, 5] but there has been little published literature to date to describe handoffs between members of the same team. Therefore, we set out (1) to learn how interns view intrateam handoffs and (2) to identify intern‐perceived problems with intrateam handoffs.
MATERIALS AND METHODS
This was a cross‐sectional survey study done at a 500‐bed academic medical center affiliated with a large internal medicine residency program. The survey was developed by the study team and reviewed for content and clarity by our chief residents and by 2 nationally known medical educators outside our institution. Study participants were internal medicine interns. Interns in this program rotate through 3 hospitals and do 7 to 8 ward months. The call schedules are different at each site (see Supporting Information, Appendix A, in the online version of this article). Opportunities for intrateam coverage of 1 intern by another include clinics (1/week), days off (1/week), some overnight periods, and occasional educational conferences. When possible, daily attending rounds include the entire team, but due to clinics, conferences, and days off, it is rare that the entire team is present. Bedside rounds are done at the discretion of the attending. The survey (see Supporting Information, Appendix B, in the online version of this article) included questions regarding situations when the respondent was covering his or her cointern's patients (cointern was defined as another intern on the respondent's same inpatient ward team). We also asked about situations when a cointern was covering the respondent's patients. For those questions, we considered answers of >60% to be a majority. We distributed this anonymous survey on 2 dates (January 2012 and March 2012) during regularly scheduled conferences. We mainly report descriptive findings. We also compared the percentage of study participants reporting problems when covering cointerns' patients to the percentage of study participants reporting problems when cointerns covered their (study participants') patients using 2, with significance set at P<0.05. This study was designated as exempt by the institutional review board.
RESULTS
Thirty‐four interns completed the survey out of a total of 44 interns present at the conferences (response rate=77%). There were 46 interns in the program, including categorical, medicine‐pediatrics, and preliminary interns. The mean age was 28 (standard deviation 2.8). Two‐thirds of respondents were female, and 65% were categorical.
Difference Between Intra‐ and Interteam Handoffs
Eighty‐eight percent felt that a handoff to a cointern was different than a handoff to an overnight cross‐cover intern; many interns said they assumed their cointerns had at least some knowledge of their patients, and therefore put less time and detail into their handoffs. When covering for their cointern, 47% reported feeling the same amount of responsibility as for their own patients, whereas 38% of interns reported feeling much or somewhat less responsible for their cointerns' patients and the remainder (15%) felt somewhat or much more responsible.
Knowledge of Cointern's Patients
Most (65%) interns reported at least 3 days in their last inpatient ward month when they covered a cointern's patient that had not been formally handed off to them. Forty‐five percent of respondents reported seldom or never receiving a written sign‐out on their cointern's patients.
Respondents were asked to think about times before they had covered their cointern's patients. Sixty‐eight percent of respondents reported knowing the number 1 problem for the majority of their cointern's patients. Twenty‐four percent reported having ever actually seen the majority of their cointern's patients. Only 3% of respondents said they had ever examined the majority of their cointern's patients prior to providing coverage.
Perceived Problems With Intrateam Coverage
While covering a cointern's patients, nearly half reported missing changes in patients' exams and forgetting to order labs or imaging. More than half reported unexpected family meetings or phone calls. In contrast, respondents noted more problems when their cointern had covered for them (Table 1). Seventy‐nine percent felt that patient care was at least sometimes delayed because of incomplete knowledge due to intrateam coverage.
| What Problems Have You Noticed | ||
|---|---|---|
| While Respondent Covers a Cointern's Patient? | After Respondent's Patients Were Covered by Cointern? | |
| ||
| Missed labs | 18% | 33% |
| Missed consult recommendations | 21% | 30% |
| Missed exam changes | 42% | 27% |
| Forgot to follow‐up imaging | 27% | 30% |
| Forgot to order labs or imaging | 42%a | 70%a |
| Failure to adjust meds | 27% | 27% |
| Unexpected family meeting/phone calls | 61%a | 30%a |
| Did not understand the plan from cointern's notes | 45% | 27% |
DISCUSSION
In our program, interns commonly cover for each other. This intrateam coverage frequently occurs without a formal handoff, and interns do not always know key information about their cointern's patients. Interns reported frequent problems with intrateam coverage such as missed lab results, consult recommendations, and changes in the physical exam. These missed items could result in delayed diagnoses and delayed treatment. These problems have been identified in interteam handoffs as well.[6, 7] Even in optimized interteam handoffs, receivers fail to identify the most important piece of information about 60% of the patients,[8] and our results mirror this finding.
The finding that fewer than a quarter of the respondents have ever seen the majority of their cointerns' patients is certainly of concern. This likely arises from several inter‐related factors: reduced hours for housestaff, schedules built to accommodate the reduced hours (eg, overlapping rather than simultaneous shifts), and the choice of some attendings to not take the entire team around to see every patient. In institutions where bedside rounds as a team are the norm, this finding will be less applicable, but others across the country have noticed this trend[9, 10] and have tried to counteract it.[11] This situation has both patient care and educational implications. The main patient care implication is that the other team members may be less able to seamlessly assume care when the primary intern is away or busy. Therefore, intrateam coverage becomes much more like traditional cross‐coverage of another team's patients, during which there is no expectation that the covering person will have ever seen the patients for whom they are assuming care. The main educational implication of not seeing the cointerns' patients is that the interns are seeing only half the patients that they could otherwise see. Learning medicine is experiential, and limiting opportunities for seeing and examining patients is unwise in this era of reduced time spent in the hospital.
Limitations of this study include being conducted in a single program. It will be important for other sites to assess their own practices with respect to intrateam handoffs. Another limitation is that it was a cross‐sectional survey subject to recall bias. We may have obtained more detailed information if we had conducted interviews. We also did not quantify the frequency of missed labs, consult recommendations, and physical examination changes that occurred during intrateam coverage. Finally, we did not independently verify the problems identified by the interns.
Some possible strategies to address this issue include (1) treating intrateam handoffs like interteam handoffs by implementing a formal system, (2) better utilizing senior residents/faculty when interns are covering for each other, (3) using bedside attending rounds to increase the exposure of all team members to the team's patients, (4) block scheduling to avoid absences due to clinics,[12] and (5) better communication and teamwork training to increase team awareness of all patients.[13]
Disclosures
Disclosures: There was no external funding for this work. However, this material is the result of work supported with resources and the use of facilities at the Clement J. Zablocki VA Medical Center, Milwaukee, WI. This work was presented in poster format at the national Society of Hospital Medicine meeting in National Harbor, Maryland in May 2013. The authors have no conflicts of interest to report.
- , , , et al. Residents' and attending physicians' handoffs: a systematic review of the literature. Acad Med. 2009;84(12):1775–1787.
- , , . Standardized sign‐out reduces intern perception of medical errors on the general internal medicine ward. Teach Learn Med. 2009;21(2):121–126.
- , , , . Faculty member review and feedback using a sign‐out checklist: improving intern written sign‐out. Acad Med. 2012;87(8):1125–1131.
- , , , , . Using a computerized sign‐out program to improve continuity of inpatient care and prevent adverse events. Jt Comm J Qual Improv. 1998;24(2):77–87.
- , , , . Transfers of patient care between house staff on internal medicine wards. Arch Intern Med. 2006;166:1173–1177.
- , , , , . Communication failures in patient sign‐out and suggestions for improvement: a critical incident analysis. Qual Saf Health Care 2005;14(6):401–407.
- , , , , . Consequences of inadequate sign‐out for patient care. Arch Intern Med. 2008;168(16):1755–1760.
- , , , , . Interns overestimate the effectiveness of their hand‐off communication. Pediatrics. 2010;125(3):491–496.
- . Culture shock—patient as icon, icon as patient. N Engl J Med. 2008;359(26):2748–2751.
- , , , . Attending rounds and bedside case presentations: medical student and medicine resident experiences and attitudes. Teach Learn Med. 2009;21(2):105–110.
- , , , . The return of bedside rounds: an educational intervention. J Gen Intern Med. 2010;25(8):792–798.
- , , , et al. The ambulatory long‐block: an accreditation council for graduate medical education (ACGME) educational innovations project (EIP). J Gen Intern Med. 2008;23(7):921–926.
- AHRQ. TeamSTEPPS: National Implementation. Available at: http://teamstepps.ahrq.gov/. Accessed June 19, 2014.
Localizing General Medical Teams
Localizing inpatient general medical teams to nursing units has high intuitive validity for improving physician productivity, hospital efficiency, and patient outcomes. Motion or the moving of personnel between tasksso prominent if teams are not localizedis 1 of the 7 wastes in lean thinking.1 In a timemotion study, where hospitalists cared for patients on up to 5 different wards, O'Leary et al2 have reported large parts of hospitalists' workdays spent in indirect patient care (69%), paging (13%), and travel (3%). Localization could increase the amount of time available for direct patient care, decrease time spent for (and interruptions due to) paging, and decrease travel time, all leading to greater productivity.
O'Leary et al3 have also reported the beneficial effects of localization of medical inpatients on communication between nurses and physicians, who could identify each other more often, and reported greater communication (specifically face‐to‐face communication) with each other following localization. This improvement in communication and effective multidisciplinary rounds could lead to safer care4 and better outcomes.
Further investigations about the effect of localization are limited. Roy et al5 have compared the outcomes of patients localized to 2 inpatient pods medically staffed by hospitalists and physician assistants (PAs) to geographically dispersed, but structurally different, house staff teams. They noticed significantly lower costs, slight but nonsignificant increase in length of stay, and no difference in mortality or readmissions, but it is impossible to tease out the affect of localization versus the affect of team composition. In a before‐and‐after study, Findlay et al6 have reported a decrease in mortality and complication rates in clinically homogenous surgical patients (proximal hip fractures) when cared for by junior trainee physicians localized to a unit, but their experience cannot be extrapolated to the much more diverse general medical population.
In our hospital, each general medical team could admit patients dispersed over 14 different units. An internal group, commissioned to evaluate our hospitalist practice, recommended reducing this dispersal to improve physician productivity, hospital efficiency, and outcomes of care. We therefore conducted a project to evaluate the impact of localizing general medical inpatient teams to a single nursing unit.
METHODS
Setting
We conducted our project at a 490 bed, urban academic medical center in the midwestern United States where of the 10 total general medical teams, 6 were traditional resident‐based teams and 4 consisted of a hospitalist paired with a PA (H‐PA teams). We focused our study on the 4 H‐PA teams. The hospitalists could be assigned to any H‐PA team and staffed them for 2 weeks (including weekends). The PAs were always assigned to the same team but took weekends off. An in‐house hospitalist provided overnight cross‐coverage for the H‐PA teams. Prior to our intervention, these teams could admit patients to any of the 14 nursing units at our hospital. They admitted patients from 7 AM to 3 PM, and also accepted care of patients admitted overnight after the resident teams had reached their admission limits (overflow). A Faculty Admitting Medical Officer (AMO) balanced the existing workload of the teams against the number and complexity of incoming patients to decide team assignment for the patients. The AMO was given guidelines (soft caps) to limit total admissions to H‐PA teams to 5 per team per day (3 on a weekend), and to not exceed a total patient census of 16 for an H‐PA team.
Intervention
Starting April 1, 2010, until July 15, 2010, we localized patients admitted to 2 of our 4 H‐PA teams on a single 32‐bed nursing unit. The patients of the other 2 H‐PA teams remained dispersed throughout the hospital.
Transition
April 1, 2010 was a scheduled switch day for the hospitalists on the H‐PA teams. We took advantage of this switch day and reassigned all patients cared for by H‐PA teams on our localized unit to the 2 localized teams. Similarly, all patients on nonlocalized units cared for by H‐PA teams were reassigned to the 2 nonlocalized teams. All patients cared for by resident teams on the localized unit, that were anticipated to be discharged soon, stayed until discharge; those that had a longer stay anticipated were transferred to a nonlocalized unit.
Patient Assignment
The 4 H‐PA teams continued to accept patients between 7 AM and 3 PM, as well as overflow patients. Patients with sickle cell crises were admitted exclusively to the nonlocalized teams, as they were cared for on a specialized nursing unit. No other patient characteristic was used to decide team assignment.
The AMO balanced the existing workload of the teams against the number and complexity of incoming patients to decide team assignment for the patients, but if these factors were equivocal, the AMO was now asked to preferentially admit to the localized teams. The admission soft cap for the H‐PA teams remained the same (5 on weekdays and 3 on weekends). The soft cap on the total census of 16 patients for the nonlocalized teams remained, but we imposed hard caps on the total census for the localized teams. These hard caps were 16 for each localized team for the month of April (to fill a 32‐bed unit), then decreased to 12 for the month of May, as informal feedback from the teams suggested a need to decrease workload, and then rebalanced to 14 for the remaining study period.
Evaluation
Clinical Outcomes
Using both concurrent and historical controls, we evaluated the impact of localization on the following clinical outcome measures: length of stay (LOS), charges, and 30‐day readmission rates.
Inclusion Criteria
We included all patients assigned to localized and nonlocalized teams between the period April 1, 2010 to July 15, 2010, and discharged before July 16, 2010, in our intervention group and concurrent control group, respectively. We included all patients assigned to any of the 4 H‐PA teams during the period January 1, 2010 and March 31, 2010 in the historical control group.
Exclusion Criteria
From the historical control group, we excluded patients assigned to one particular H‐PA team during the period January 1, 2010 to February 28, 2010, during which the PA assigned to that team was on leave. We excluded, from all groups, patients with a diagnosis of sickle cell disease and hospitalizations that straddled the start of the intervention. Further, we excluded repeat admissions for each patient.
Data Collection
We used admission logs to determine team assignment and linked them to our hospital's discharge abstract database to get patient level data. We grouped the principal diagnosis, International Classification of Diseases, Ninth Revision, Clinical Modification (ICD‐9‐CM) codes into clinically relevant categories using the Healthcare Cost and Utilization Project Clinical Classification Software for ICD‐9‐CM (Rockville, MD, www.hcup‐us.ahrq.gov/toolssoftware/ccs/ccs.jsp). We created comorbidity measures using Healthcare Cost and Utilization Project Comorbidity Software, version 3.4 (Rockville, MD, www.hcup‐us.ahrq.gov/toolssoftware/comorbidity/comorbidity.jsp).
We calculated LOS by subtracting the discharge day and time from the admission day and time. We summed all charges accrued during the entire hospital stay, but did not include professional fees. The LOS and charges included time spent and charges accrued in the intensive care unit (ICU). As ICU care was not under the control of the general medical teams and could have a significant impact on outcomes reflecting resource utilization, we compared LOS and charges only for 2 subsets of patients: patients not initially admitted to ICU before care by medical teams, and patients never requiring ICU care. We considered any repeat hospitalization to our hospital within 30 days following a discharge to be a readmission, except those for a planned procedure or for inpatient rehabilitation. We compared readmission rates for all patients irrespective of ICU stay, as discharge planning for all patients was under the direct control of the general medical teams.
Data Analysis
We performed unadjusted descriptive statistics using medians and interquartile ranges for continuous variables, and frequencies and percentages for categorical variables. We used chi‐square tests of association, and KruskalWallis analysis of variance, to compare baseline characteristics of patients assigned to localized and control teams.
We used regression models with random effects to risk adjust for a wide variety of variables. We included age, gender, race, insurance, admission source, time, day of week, discharge time, and total number of comorbidities as fixed effects in all models. We then added individual comorbidity measures one by one as fixed effects, including them only if significant at P < 0.01. We always added a variable identifying the admitting physician as a random effect, to account for dependence between admissions to the same physician. We log transformed LOS and charges because they were extremely skewed in nature. We analyzed readmissions after excluding patients who died. We evaluated the affect of our intervention on clinical outcomes using both historical and concurrent controls. We report P values for both overall 3‐way comparisons, as well as each of the 2‐way comparisonsintervention versus historical control and intervention versus concurrent control.
Productivity and Workflow Measures
We also evaluated the impact of localization on the following productivity and workflow measures: number of pages received, number of patient encounters, relative value units (RVUs) generated, and steps walked by PAs.
Data Collection
We queried our in‐house paging systems for the number of pages received by intervention and concurrent control teams between 7 AM and 6 PM (usual workday). We queried our professional billing data to determine the number of encounters per day and RVUs generated by the intervention, as well as historical and concurrent control teams, as a measure of productivity.
During the last 15 days of our intervention (July 1 July 15, 2010), we received 4 pedometers and we asked the PAs to record the number of steps taken during their workday. We chose PAs, rather than physicians, as the PAs had purely clinical duties and their walking activity would reflect activity for solely clinical purposes.
Data Analysis
For productivity and workflow measures, we adjusted for the day of the week and used random effects models to adjust for clustering of data by physician and physician assistant.
Statistical Software
We performed the statistical analysis using R software, versions 2.9.0 (The R Project for Statistical Computing, Vienna, Austria, http://www.R‐project.org).
Ethical Concerns
The study protocol was approved by our institutional review board.
RESULTS
Study Population
There were 2431 hospitalizations to the 4 H‐PA teams during the study period. Data from 37 hospitalizations was excluded because of missing data. After applying all exclusion criteria, our final study sample consisted of a total of 1826 first hospitalizations for patients: 783 historical controls, 478 concurrent controls, and 565 localized patients.
Patients in the control groups and intervention group were similar in age, gender, race, and insurance status. Patients in the intervention group were more likely to be admitted over the weekend, but had similar probability of being discharged over the weekend or having had an ICU stay. Historical controls were admitted more often between 6 AM and 12 noon, while during the intervention period, patients were more likely to be admitted between midnight and 6 AM. The discharge time was similar across all groups. The 5 most common diagnoses were similar across the groups (Table 1).
| Historical Control | Intervention Localized Teams | Concurrent Control | P Value | |
|---|---|---|---|---|
| ||||
| Patients | 783 | 565 | 478 | |
| Age median (IQR) | 57 (4575) | 57 (4573) | 56 (4470) | 0.186 |
| Age groups, n (%) | ||||
| <30 | 65 (8.3) | 37 (6.6) | 46 (9.6) | |
| 3039 | 76 (9.7) | 62 (11.0) | 47 (9.8) | |
| 4049 | 114 (14.6) | 85 (15.0) | 68 (14.2) | |
| 5059 | 162 (20.7) | 124 (22.0) | 118 (24.7) | 0.145 |
| 6069 | 119 (15.2) | 84 (14.9) | 76 (16.0) | |
| 7079 | 100 (12.8) | 62 (11.0) | 58 (12.1) | |
| 8089 | 113 (14.4) | 95 (16.8) | 51 (10.7) | |
| >89 | 34 (4.3) | 16 (2.88) | 14 (2.9) | |
| Female gender, n (%) | 434 (55.4) | 327 (57.9) | 264 (55.2) | 0.602 |
| Race: Black, n (%) | 285 (36.4) | 229 (40.5) | 200 (41.8) | 0.111 |
| Observation status, n (%) | 165 (21.1) | 108 (19.1) | 108 (22.6) | 0.380 |
| Insurance, n (%) | ||||
| Commercial | 171 (21.8) | 101 (17.9) | 101 (21.1) | |
| Medicare | 376 (48.0) | 278 (49.2) | 218 (45.6) | 0.225 |
| Medicaid | 179 (22.8) | 126 (22.3) | 117 (24.5) | |
| Uninsured | 54 (7.3) | 60 (10.6) | 42 (8.8) | |
| Weekend admission, n (%) | 137 (17.5) | 116 (20.5) | 65 (13.6) | 0.013 |
| Weekend discharge, n (%) | 132 (16.9) | 107 (18.9) | 91 (19.0) | 0.505 |
| Source of admission | ||||
| ED, n (%) | 654 (83.5) | 450 (79.7) | 370 (77.4) | 0.022 |
| No ICU stay, n (%) | 600 (76.6) | 440 (77.9) | 383 (80.1) | 0.348 |
| Admission time, n (%) | ||||
| 00000559 | 239 (30.5) | 208 (36.8) | 172 (36.0) | |
| 06001159 | 296 (37.8) | 157 (27.8) | 154 (32.2) | 0.007 |
| 12001759 | 183 (23.4) | 147 (26.0) | 105 (22.0) | |
| 18002359 | 65 (8.3) | 53 (9.4) | 47 (9.8) | |
| Discharge time, n (%) | ||||
| 00001159 | 67 (8.6) | 45 (8.0) | 43 (9.0) | |
| 12001759 | 590 (75.4) | 417 (73.8) | 364 (76.2) | 0.658 |
| 18002359 | 126 (16.1) | 103 (18.2) | 71 (14.9) | |
| Inpatient deaths, n | 13 | 13 | 6 | |
| Top 5 primary diagnoses (%) | ||||
| 1 | Chest pain (11.5) | Chest pain (13.3) | Chest pain (11.9) | |
| 2 | Septicemia (6.4) | Septicemia (5.1) | Septicemia (3.8) | |
| 3 | Diabetes w/cm (4.6) | Pneumonia (4.9) | Diabetes w/cm (3.3) | n/a |
| 4 | Pneumonia (2.8) | Diabetes w/cm (4.1) | Pneumonia (3.3) | |
| 5 | UTI (2.7) | COPD (3.2) | UTI (2.9) | |
Clinical Outcomes
Unadjusted Analyses
The risk of 30‐day readmission was no different between the intervention and control groups. In patients without an initial ICU stay, and without any ICU stay, charges incurred and LOS were no different between the intervention and control groups (Table 2).
| Historical Control | Intervention Localized Teams | Concurrent Control | P Value | |
|---|---|---|---|---|
| ||||
| 30‐day readmissions n (%) | 118 (15.3) | 69 (12.5) | 66 (14.0) | 0.346 |
| Charges: excluding patients initially admitted to ICU | ||||
| Median (IQR) in $ | 9346 (621614,520) | 9724 (665715,390) | 9902 (661115,670) | 0.393 |
| Charges: excluding all patients with an ICU stay | ||||
| Median (IQR) in $ | 9270 (618713,990) | 9509 (660114,940) | 9846 (658015,400) | 0.283 |
| Length of stay: excluding patients initially admitted to ICU | ||||
| Median (IQR) in days | 1.81 (1.223.35) | 2.16 (1.214.02) | 1.89 (1.193.50) | 0.214 |
| Length of stay: excluding all patients with an ICU stay | ||||
| Median (IQR) in days | 1.75 (1.203.26) | 2.12 (1.203.74) | 1.84 (1.193.42) | 0.236 |
Adjusted Analysis
The risk of 30‐day readmission was no different between the intervention and control groups. In patients without an initial ICU stay, and without any ICU stay, charges incurred were no different between the intervention and control groups; LOS was about 11% higher in the localized group as compared to historical controls, and about 9% higher as compared to the concurrent control group. The difference in LOS was not statistically significant on an overall 3‐way comparison (Table 3).
| Localized Teams in Comparison to | |||
|---|---|---|---|
| Historical Control | Concurrent Control | Overall P Value | |
| |||
| 30‐day risk of readmission OR (CI) | 0.85 (0.611.19) | 0.94 (0.651.37) | 0.630 |
| P value | 0.351 | 0.751 | |
| Charges: excluding patients initially admitted to ICU | |||
| % change | 2% higher | 4% lower | 0.367 |
| (CI) | (6% lower to 11% higher) | (12% lower to 5%higher) | |
| P value | 0.572 | 0.427 | |
| Charges: excluding all patients with an ICU stay | |||
| % change | 2% higher | 5% lower | 0.314 |
| (CI) | (6% lower to 10% higher) | (13% lower to 4% higher) | |
| P value | 0.695 | 0.261 | |
| Length of stay: excluding patients initially admitted to ICU | |||
| % change | 11% higher | 9% higher | 0.105 |
| (CI) | (1% to 22% higher) | (3% lower to 21% higher) | |
| P value | 0.038 | 0.138 | |
| Length of stay: excluding all patients with an ICU stay | |||
| % change | 10% higher | 8% higher | 0.133 |
| (CI) | (0% to 22% higher) | (3% lower to 20% higher) | |
| P value | 0.047 | 0.171 | |
Productivity and Workflow Measures
Unadjusted Analyses
The localized teams received fewer pages as compared to concurrently nonlocalized teams. Localized teams had more patient encounters per day and generated more RVUs per day as compared to both historical and concurrent control groups. Physician assistants on localized teams took fewer steps during their work day (Table 4).
| Historical Control | Intervention Localized Teams | Concurrent Control | P Value | |
|---|---|---|---|---|
| ||||
| Pages received/day (7 AM6 PM) Median (IQR) | No data | 15 (921) | 28 (12.540) | <0.001 |
| Total encounters/day Median (IQR) | 10 (813) | 12 (1013) | 11 (913) | <0.001 |
| RVU/day | ||||
| Mean (SD) | 19.9 (6.76) | 22.6 (5.6) | 21.2 (6.7) | <0.001 |
| Steps/day Median (IQR) | No data | 4661 (3922 5166) | 5554 (50606544) | <0.001 |
Adjusted Analysis
On adjusting for clustering by physician and day of week, the significant differences in pages received, total patient encounters, and RVUs generated persisted, while the difference in steps walked by PAs was attenuated to a statistically nonsignificant level (Table 5). The increase in RVU productivity was sustained through various periods of hard caps (data not shown).
| Localized Teams in Comparison to | |||
|---|---|---|---|
| Historical Control | Concurrent Control | Overall P Value | |
| |||
| Pages received (7 AM 6 PM) %(CI) | No data | 51% fewer (4854) | |
| P value | P < 0.001 | ||
| Total encounters | 0.89 more | 1.02 more | |
| N (CI) | (0.371.41) | (0.461.58) | |
| P value | P < 0.001 | P < 0.001 | P < 0.001 |
| RVU/day | 2.20 more | 1.36 more | |
| N (CI) | (1.103.29) | (0.172.55) | |
| P value | P < 0.001 | P = 0.024 | P < 0.001 |
| Steps/day | 1186 fewer (791 more to | ||
| N (CI) | No data | 3164 fewer) | |
| P value | P = 0.240 | ||
DISCUSSION
We found that general medical patients admitted to H‐PA teams and localized to a single nursing unit had similar risk of 30‐day readmission and charges, but may have had a higher length of stay compared to historical and concurrent controls. The localized teams received far fewer pages, had more patient encounters, generated more RVUs, and walked less during their work day. Taken together, these findings imply that in our study, localization led to greater team productivity and a possible decrease in hospital efficiency, with no significant impact on readmissions or charges incurred.
The higher productivity was likely mediated by the preferential assignments of more patients to the localized teams, and improvements in workflow (such as fewer pages and fewer steps walked), which allowed them to provide more care with the same resources as the control teams. Kocher and Sahni7 recently pointed out that the healthcare sector has experienced no gains in labor productivity in the past 20 years. Our intervention fits their prescription for redesigning healthcare delivery models to achieve higher productivity.
The possibility of a higher LOS associated with localization was a counterintuitive finding, and similar to that reported by Roy et al.5 We propose 3 hypotheses to explain this:
Selection bias: Higher workload of the localized teams led to compromised efficiency and a higher length of stay (eg, localized teams had fewer observation admissions, more hospitalizations with an ICU stay, and the AMO was asked to preferentially admit patients to localized teams).
Localization provided teams the opportunity to spend more time with their patients (by decreasing nonvalue‐added tasks) and to consequently address more issues before transitioning to outpatient care, or to provide higher quality of care.
Gaming: By having a hard cap on total number of occupied beds, we provided a perverse incentive to the localized teams to retain patients longer to keep assigned beds occupied, thereby delaying new admissions to avoid higher workload.
Our study cannot tell us which of these hypotheses represents the dominant phenomenon that led to this surprising finding. Hypothesis 3 is most worrying, and we suggest that others looking to localize their medical teams consider the possibility of unintended perverse incentives.
Differences were more pronounced between the historical control group and the intervention group, as opposed to the intervention group and concurrent controls. This may have occurred if we contaminated the concurrent control by decreasing the number of units they had to go to, by sequestering 1 unit for the intervention team.
Our report has limitations. It is a nonrandomized, quasi‐experimental investigation using a single institution's administrative databases. Our intervention was small in scale (localizing 2 out of 10 general medical teams on 1 out of 14 nursing units). What impact a wider implementation of localization may have on emergency department throughput and hospital occupancy remains to be studied. Nevertheless, our research is the first report, to our knowledge, investigating a wide variety of outcomes of localizing inpatient medical teams, and adds significantly to the limited research on this topic. It also provides significant operational details for other institutions to use when localizing medical teams.
We conclude that our intervention of localization of medical teams to a single nursing unit led to higher productivity and better workflow, but did not impact readmissions or charges incurred. We caution others designing similar localization interventions to protect against possible perverse incentives for inefficient care.
Acknowledgements
Disclosure: Nothing to report.
- . Reducing waste in US health care systems. JAMA. 2007;297(8):871–874.
- , , . How hospitalists spend their time: insights on efficiency and safety. J Hosp Med. 2006;1(2):88–93.
- , , , et al. Impact of localizing physicians to hospital units on nurse–physician communication and agreement on the plan of care. J Gen Intern Med. 2009;24(11):1223–1227.
- , , , et al. Structured interdisciplinary rounds in a medical teaching unit: improving patient safety. Arch Intern Med. 2011;171(7):678–684.
- , , , et al. Implementation of a physician assistant/hospitalist service in an academic medical center: impact on efficiency and patient outcomes. J Hosp Med. 2008;3(5):361–368.
- , , , , . Ward‐based rather than team‐based junior surgical doctors reduce mortality for patients with a fracture of the proximal femur: results from a two‐year observational study. J Bone Joint Surg Br. 2011;93‐B(3):393–398.
- , . Rethinking health care labor. N Engl J Med. 2011;365(15):1370–1372.
Localizing inpatient general medical teams to nursing units has high intuitive validity for improving physician productivity, hospital efficiency, and patient outcomes. Motion or the moving of personnel between tasksso prominent if teams are not localizedis 1 of the 7 wastes in lean thinking.1 In a timemotion study, where hospitalists cared for patients on up to 5 different wards, O'Leary et al2 have reported large parts of hospitalists' workdays spent in indirect patient care (69%), paging (13%), and travel (3%). Localization could increase the amount of time available for direct patient care, decrease time spent for (and interruptions due to) paging, and decrease travel time, all leading to greater productivity.
O'Leary et al3 have also reported the beneficial effects of localization of medical inpatients on communication between nurses and physicians, who could identify each other more often, and reported greater communication (specifically face‐to‐face communication) with each other following localization. This improvement in communication and effective multidisciplinary rounds could lead to safer care4 and better outcomes.
Further investigations about the effect of localization are limited. Roy et al5 have compared the outcomes of patients localized to 2 inpatient pods medically staffed by hospitalists and physician assistants (PAs) to geographically dispersed, but structurally different, house staff teams. They noticed significantly lower costs, slight but nonsignificant increase in length of stay, and no difference in mortality or readmissions, but it is impossible to tease out the affect of localization versus the affect of team composition. In a before‐and‐after study, Findlay et al6 have reported a decrease in mortality and complication rates in clinically homogenous surgical patients (proximal hip fractures) when cared for by junior trainee physicians localized to a unit, but their experience cannot be extrapolated to the much more diverse general medical population.
In our hospital, each general medical team could admit patients dispersed over 14 different units. An internal group, commissioned to evaluate our hospitalist practice, recommended reducing this dispersal to improve physician productivity, hospital efficiency, and outcomes of care. We therefore conducted a project to evaluate the impact of localizing general medical inpatient teams to a single nursing unit.
METHODS
Setting
We conducted our project at a 490 bed, urban academic medical center in the midwestern United States where of the 10 total general medical teams, 6 were traditional resident‐based teams and 4 consisted of a hospitalist paired with a PA (H‐PA teams). We focused our study on the 4 H‐PA teams. The hospitalists could be assigned to any H‐PA team and staffed them for 2 weeks (including weekends). The PAs were always assigned to the same team but took weekends off. An in‐house hospitalist provided overnight cross‐coverage for the H‐PA teams. Prior to our intervention, these teams could admit patients to any of the 14 nursing units at our hospital. They admitted patients from 7 AM to 3 PM, and also accepted care of patients admitted overnight after the resident teams had reached their admission limits (overflow). A Faculty Admitting Medical Officer (AMO) balanced the existing workload of the teams against the number and complexity of incoming patients to decide team assignment for the patients. The AMO was given guidelines (soft caps) to limit total admissions to H‐PA teams to 5 per team per day (3 on a weekend), and to not exceed a total patient census of 16 for an H‐PA team.
Intervention
Starting April 1, 2010, until July 15, 2010, we localized patients admitted to 2 of our 4 H‐PA teams on a single 32‐bed nursing unit. The patients of the other 2 H‐PA teams remained dispersed throughout the hospital.
Transition
April 1, 2010 was a scheduled switch day for the hospitalists on the H‐PA teams. We took advantage of this switch day and reassigned all patients cared for by H‐PA teams on our localized unit to the 2 localized teams. Similarly, all patients on nonlocalized units cared for by H‐PA teams were reassigned to the 2 nonlocalized teams. All patients cared for by resident teams on the localized unit, that were anticipated to be discharged soon, stayed until discharge; those that had a longer stay anticipated were transferred to a nonlocalized unit.
Patient Assignment
The 4 H‐PA teams continued to accept patients between 7 AM and 3 PM, as well as overflow patients. Patients with sickle cell crises were admitted exclusively to the nonlocalized teams, as they were cared for on a specialized nursing unit. No other patient characteristic was used to decide team assignment.
The AMO balanced the existing workload of the teams against the number and complexity of incoming patients to decide team assignment for the patients, but if these factors were equivocal, the AMO was now asked to preferentially admit to the localized teams. The admission soft cap for the H‐PA teams remained the same (5 on weekdays and 3 on weekends). The soft cap on the total census of 16 patients for the nonlocalized teams remained, but we imposed hard caps on the total census for the localized teams. These hard caps were 16 for each localized team for the month of April (to fill a 32‐bed unit), then decreased to 12 for the month of May, as informal feedback from the teams suggested a need to decrease workload, and then rebalanced to 14 for the remaining study period.
Evaluation
Clinical Outcomes
Using both concurrent and historical controls, we evaluated the impact of localization on the following clinical outcome measures: length of stay (LOS), charges, and 30‐day readmission rates.
Inclusion Criteria
We included all patients assigned to localized and nonlocalized teams between the period April 1, 2010 to July 15, 2010, and discharged before July 16, 2010, in our intervention group and concurrent control group, respectively. We included all patients assigned to any of the 4 H‐PA teams during the period January 1, 2010 and March 31, 2010 in the historical control group.
Exclusion Criteria
From the historical control group, we excluded patients assigned to one particular H‐PA team during the period January 1, 2010 to February 28, 2010, during which the PA assigned to that team was on leave. We excluded, from all groups, patients with a diagnosis of sickle cell disease and hospitalizations that straddled the start of the intervention. Further, we excluded repeat admissions for each patient.
Data Collection
We used admission logs to determine team assignment and linked them to our hospital's discharge abstract database to get patient level data. We grouped the principal diagnosis, International Classification of Diseases, Ninth Revision, Clinical Modification (ICD‐9‐CM) codes into clinically relevant categories using the Healthcare Cost and Utilization Project Clinical Classification Software for ICD‐9‐CM (Rockville, MD, www.hcup‐us.ahrq.gov/toolssoftware/ccs/ccs.jsp). We created comorbidity measures using Healthcare Cost and Utilization Project Comorbidity Software, version 3.4 (Rockville, MD, www.hcup‐us.ahrq.gov/toolssoftware/comorbidity/comorbidity.jsp).
We calculated LOS by subtracting the discharge day and time from the admission day and time. We summed all charges accrued during the entire hospital stay, but did not include professional fees. The LOS and charges included time spent and charges accrued in the intensive care unit (ICU). As ICU care was not under the control of the general medical teams and could have a significant impact on outcomes reflecting resource utilization, we compared LOS and charges only for 2 subsets of patients: patients not initially admitted to ICU before care by medical teams, and patients never requiring ICU care. We considered any repeat hospitalization to our hospital within 30 days following a discharge to be a readmission, except those for a planned procedure or for inpatient rehabilitation. We compared readmission rates for all patients irrespective of ICU stay, as discharge planning for all patients was under the direct control of the general medical teams.
Data Analysis
We performed unadjusted descriptive statistics using medians and interquartile ranges for continuous variables, and frequencies and percentages for categorical variables. We used chi‐square tests of association, and KruskalWallis analysis of variance, to compare baseline characteristics of patients assigned to localized and control teams.
We used regression models with random effects to risk adjust for a wide variety of variables. We included age, gender, race, insurance, admission source, time, day of week, discharge time, and total number of comorbidities as fixed effects in all models. We then added individual comorbidity measures one by one as fixed effects, including them only if significant at P < 0.01. We always added a variable identifying the admitting physician as a random effect, to account for dependence between admissions to the same physician. We log transformed LOS and charges because they were extremely skewed in nature. We analyzed readmissions after excluding patients who died. We evaluated the affect of our intervention on clinical outcomes using both historical and concurrent controls. We report P values for both overall 3‐way comparisons, as well as each of the 2‐way comparisonsintervention versus historical control and intervention versus concurrent control.
Productivity and Workflow Measures
We also evaluated the impact of localization on the following productivity and workflow measures: number of pages received, number of patient encounters, relative value units (RVUs) generated, and steps walked by PAs.
Data Collection
We queried our in‐house paging systems for the number of pages received by intervention and concurrent control teams between 7 AM and 6 PM (usual workday). We queried our professional billing data to determine the number of encounters per day and RVUs generated by the intervention, as well as historical and concurrent control teams, as a measure of productivity.
During the last 15 days of our intervention (July 1 July 15, 2010), we received 4 pedometers and we asked the PAs to record the number of steps taken during their workday. We chose PAs, rather than physicians, as the PAs had purely clinical duties and their walking activity would reflect activity for solely clinical purposes.
Data Analysis
For productivity and workflow measures, we adjusted for the day of the week and used random effects models to adjust for clustering of data by physician and physician assistant.
Statistical Software
We performed the statistical analysis using R software, versions 2.9.0 (The R Project for Statistical Computing, Vienna, Austria, http://www.R‐project.org).
Ethical Concerns
The study protocol was approved by our institutional review board.
RESULTS
Study Population
There were 2431 hospitalizations to the 4 H‐PA teams during the study period. Data from 37 hospitalizations was excluded because of missing data. After applying all exclusion criteria, our final study sample consisted of a total of 1826 first hospitalizations for patients: 783 historical controls, 478 concurrent controls, and 565 localized patients.
Patients in the control groups and intervention group were similar in age, gender, race, and insurance status. Patients in the intervention group were more likely to be admitted over the weekend, but had similar probability of being discharged over the weekend or having had an ICU stay. Historical controls were admitted more often between 6 AM and 12 noon, while during the intervention period, patients were more likely to be admitted between midnight and 6 AM. The discharge time was similar across all groups. The 5 most common diagnoses were similar across the groups (Table 1).
| Historical Control | Intervention Localized Teams | Concurrent Control | P Value | |
|---|---|---|---|---|
| ||||
| Patients | 783 | 565 | 478 | |
| Age median (IQR) | 57 (4575) | 57 (4573) | 56 (4470) | 0.186 |
| Age groups, n (%) | ||||
| <30 | 65 (8.3) | 37 (6.6) | 46 (9.6) | |
| 3039 | 76 (9.7) | 62 (11.0) | 47 (9.8) | |
| 4049 | 114 (14.6) | 85 (15.0) | 68 (14.2) | |
| 5059 | 162 (20.7) | 124 (22.0) | 118 (24.7) | 0.145 |
| 6069 | 119 (15.2) | 84 (14.9) | 76 (16.0) | |
| 7079 | 100 (12.8) | 62 (11.0) | 58 (12.1) | |
| 8089 | 113 (14.4) | 95 (16.8) | 51 (10.7) | |
| >89 | 34 (4.3) | 16 (2.88) | 14 (2.9) | |
| Female gender, n (%) | 434 (55.4) | 327 (57.9) | 264 (55.2) | 0.602 |
| Race: Black, n (%) | 285 (36.4) | 229 (40.5) | 200 (41.8) | 0.111 |
| Observation status, n (%) | 165 (21.1) | 108 (19.1) | 108 (22.6) | 0.380 |
| Insurance, n (%) | ||||
| Commercial | 171 (21.8) | 101 (17.9) | 101 (21.1) | |
| Medicare | 376 (48.0) | 278 (49.2) | 218 (45.6) | 0.225 |
| Medicaid | 179 (22.8) | 126 (22.3) | 117 (24.5) | |
| Uninsured | 54 (7.3) | 60 (10.6) | 42 (8.8) | |
| Weekend admission, n (%) | 137 (17.5) | 116 (20.5) | 65 (13.6) | 0.013 |
| Weekend discharge, n (%) | 132 (16.9) | 107 (18.9) | 91 (19.0) | 0.505 |
| Source of admission | ||||
| ED, n (%) | 654 (83.5) | 450 (79.7) | 370 (77.4) | 0.022 |
| No ICU stay, n (%) | 600 (76.6) | 440 (77.9) | 383 (80.1) | 0.348 |
| Admission time, n (%) | ||||
| 00000559 | 239 (30.5) | 208 (36.8) | 172 (36.0) | |
| 06001159 | 296 (37.8) | 157 (27.8) | 154 (32.2) | 0.007 |
| 12001759 | 183 (23.4) | 147 (26.0) | 105 (22.0) | |
| 18002359 | 65 (8.3) | 53 (9.4) | 47 (9.8) | |
| Discharge time, n (%) | ||||
| 00001159 | 67 (8.6) | 45 (8.0) | 43 (9.0) | |
| 12001759 | 590 (75.4) | 417 (73.8) | 364 (76.2) | 0.658 |
| 18002359 | 126 (16.1) | 103 (18.2) | 71 (14.9) | |
| Inpatient deaths, n | 13 | 13 | 6 | |
| Top 5 primary diagnoses (%) | ||||
| 1 | Chest pain (11.5) | Chest pain (13.3) | Chest pain (11.9) | |
| 2 | Septicemia (6.4) | Septicemia (5.1) | Septicemia (3.8) | |
| 3 | Diabetes w/cm (4.6) | Pneumonia (4.9) | Diabetes w/cm (3.3) | n/a |
| 4 | Pneumonia (2.8) | Diabetes w/cm (4.1) | Pneumonia (3.3) | |
| 5 | UTI (2.7) | COPD (3.2) | UTI (2.9) | |
Clinical Outcomes
Unadjusted Analyses
The risk of 30‐day readmission was no different between the intervention and control groups. In patients without an initial ICU stay, and without any ICU stay, charges incurred and LOS were no different between the intervention and control groups (Table 2).
| Historical Control | Intervention Localized Teams | Concurrent Control | P Value | |
|---|---|---|---|---|
| ||||
| 30‐day readmissions n (%) | 118 (15.3) | 69 (12.5) | 66 (14.0) | 0.346 |
| Charges: excluding patients initially admitted to ICU | ||||
| Median (IQR) in $ | 9346 (621614,520) | 9724 (665715,390) | 9902 (661115,670) | 0.393 |
| Charges: excluding all patients with an ICU stay | ||||
| Median (IQR) in $ | 9270 (618713,990) | 9509 (660114,940) | 9846 (658015,400) | 0.283 |
| Length of stay: excluding patients initially admitted to ICU | ||||
| Median (IQR) in days | 1.81 (1.223.35) | 2.16 (1.214.02) | 1.89 (1.193.50) | 0.214 |
| Length of stay: excluding all patients with an ICU stay | ||||
| Median (IQR) in days | 1.75 (1.203.26) | 2.12 (1.203.74) | 1.84 (1.193.42) | 0.236 |
Adjusted Analysis
The risk of 30‐day readmission was no different between the intervention and control groups. In patients without an initial ICU stay, and without any ICU stay, charges incurred were no different between the intervention and control groups; LOS was about 11% higher in the localized group as compared to historical controls, and about 9% higher as compared to the concurrent control group. The difference in LOS was not statistically significant on an overall 3‐way comparison (Table 3).
| Localized Teams in Comparison to | |||
|---|---|---|---|
| Historical Control | Concurrent Control | Overall P Value | |
| |||
| 30‐day risk of readmission OR (CI) | 0.85 (0.611.19) | 0.94 (0.651.37) | 0.630 |
| P value | 0.351 | 0.751 | |
| Charges: excluding patients initially admitted to ICU | |||
| % change | 2% higher | 4% lower | 0.367 |
| (CI) | (6% lower to 11% higher) | (12% lower to 5%higher) | |
| P value | 0.572 | 0.427 | |
| Charges: excluding all patients with an ICU stay | |||
| % change | 2% higher | 5% lower | 0.314 |
| (CI) | (6% lower to 10% higher) | (13% lower to 4% higher) | |
| P value | 0.695 | 0.261 | |
| Length of stay: excluding patients initially admitted to ICU | |||
| % change | 11% higher | 9% higher | 0.105 |
| (CI) | (1% to 22% higher) | (3% lower to 21% higher) | |
| P value | 0.038 | 0.138 | |
| Length of stay: excluding all patients with an ICU stay | |||
| % change | 10% higher | 8% higher | 0.133 |
| (CI) | (0% to 22% higher) | (3% lower to 20% higher) | |
| P value | 0.047 | 0.171 | |
Productivity and Workflow Measures
Unadjusted Analyses
The localized teams received fewer pages as compared to concurrently nonlocalized teams. Localized teams had more patient encounters per day and generated more RVUs per day as compared to both historical and concurrent control groups. Physician assistants on localized teams took fewer steps during their work day (Table 4).
| Historical Control | Intervention Localized Teams | Concurrent Control | P Value | |
|---|---|---|---|---|
| ||||
| Pages received/day (7 AM6 PM) Median (IQR) | No data | 15 (921) | 28 (12.540) | <0.001 |
| Total encounters/day Median (IQR) | 10 (813) | 12 (1013) | 11 (913) | <0.001 |
| RVU/day | ||||
| Mean (SD) | 19.9 (6.76) | 22.6 (5.6) | 21.2 (6.7) | <0.001 |
| Steps/day Median (IQR) | No data | 4661 (3922 5166) | 5554 (50606544) | <0.001 |
Adjusted Analysis
On adjusting for clustering by physician and day of week, the significant differences in pages received, total patient encounters, and RVUs generated persisted, while the difference in steps walked by PAs was attenuated to a statistically nonsignificant level (Table 5). The increase in RVU productivity was sustained through various periods of hard caps (data not shown).
| Localized Teams in Comparison to | |||
|---|---|---|---|
| Historical Control | Concurrent Control | Overall P Value | |
| |||
| Pages received (7 AM 6 PM) %(CI) | No data | 51% fewer (4854) | |
| P value | P < 0.001 | ||
| Total encounters | 0.89 more | 1.02 more | |
| N (CI) | (0.371.41) | (0.461.58) | |
| P value | P < 0.001 | P < 0.001 | P < 0.001 |
| RVU/day | 2.20 more | 1.36 more | |
| N (CI) | (1.103.29) | (0.172.55) | |
| P value | P < 0.001 | P = 0.024 | P < 0.001 |
| Steps/day | 1186 fewer (791 more to | ||
| N (CI) | No data | 3164 fewer) | |
| P value | P = 0.240 | ||
DISCUSSION
We found that general medical patients admitted to H‐PA teams and localized to a single nursing unit had similar risk of 30‐day readmission and charges, but may have had a higher length of stay compared to historical and concurrent controls. The localized teams received far fewer pages, had more patient encounters, generated more RVUs, and walked less during their work day. Taken together, these findings imply that in our study, localization led to greater team productivity and a possible decrease in hospital efficiency, with no significant impact on readmissions or charges incurred.
The higher productivity was likely mediated by the preferential assignments of more patients to the localized teams, and improvements in workflow (such as fewer pages and fewer steps walked), which allowed them to provide more care with the same resources as the control teams. Kocher and Sahni7 recently pointed out that the healthcare sector has experienced no gains in labor productivity in the past 20 years. Our intervention fits their prescription for redesigning healthcare delivery models to achieve higher productivity.
The possibility of a higher LOS associated with localization was a counterintuitive finding, and similar to that reported by Roy et al.5 We propose 3 hypotheses to explain this:
Selection bias: Higher workload of the localized teams led to compromised efficiency and a higher length of stay (eg, localized teams had fewer observation admissions, more hospitalizations with an ICU stay, and the AMO was asked to preferentially admit patients to localized teams).
Localization provided teams the opportunity to spend more time with their patients (by decreasing nonvalue‐added tasks) and to consequently address more issues before transitioning to outpatient care, or to provide higher quality of care.
Gaming: By having a hard cap on total number of occupied beds, we provided a perverse incentive to the localized teams to retain patients longer to keep assigned beds occupied, thereby delaying new admissions to avoid higher workload.
Our study cannot tell us which of these hypotheses represents the dominant phenomenon that led to this surprising finding. Hypothesis 3 is most worrying, and we suggest that others looking to localize their medical teams consider the possibility of unintended perverse incentives.
Differences were more pronounced between the historical control group and the intervention group, as opposed to the intervention group and concurrent controls. This may have occurred if we contaminated the concurrent control by decreasing the number of units they had to go to, by sequestering 1 unit for the intervention team.
Our report has limitations. It is a nonrandomized, quasi‐experimental investigation using a single institution's administrative databases. Our intervention was small in scale (localizing 2 out of 10 general medical teams on 1 out of 14 nursing units). What impact a wider implementation of localization may have on emergency department throughput and hospital occupancy remains to be studied. Nevertheless, our research is the first report, to our knowledge, investigating a wide variety of outcomes of localizing inpatient medical teams, and adds significantly to the limited research on this topic. It also provides significant operational details for other institutions to use when localizing medical teams.
We conclude that our intervention of localization of medical teams to a single nursing unit led to higher productivity and better workflow, but did not impact readmissions or charges incurred. We caution others designing similar localization interventions to protect against possible perverse incentives for inefficient care.
Acknowledgements
Disclosure: Nothing to report.
- . Reducing waste in US health care systems. JAMA. 2007;297(8):871–874.
- , , . How hospitalists spend their time: insights on efficiency and safety. J Hosp Med. 2006;1(2):88–93.
- , , , et al. Impact of localizing physicians to hospital units on nurse–physician communication and agreement on the plan of care. J Gen Intern Med. 2009;24(11):1223–1227.
- , , , et al. Structured interdisciplinary rounds in a medical teaching unit: improving patient safety. Arch Intern Med. 2011;171(7):678–684.
- , , , et al. Implementation of a physician assistant/hospitalist service in an academic medical center: impact on efficiency and patient outcomes. J Hosp Med. 2008;3(5):361–368.
- , , , , . Ward‐based rather than team‐based junior surgical doctors reduce mortality for patients with a fracture of the proximal femur: results from a two‐year observational study. J Bone Joint Surg Br. 2011;93‐B(3):393–398.
- , . Rethinking health care labor. N Engl J Med. 2011;365(15):1370–1372.
Copyright © 2012 Society of Hospital Medicine
Effort of Inpatient Work
In internal medicine residency training, the most commonly used metric for measuring workload of physicians is the number of patients being followed or the number being admitted. There are data to support the importance of these census numbers. One study conducted at an academic medical center demonstrated that for patients admitted to medical services, the number of patients admitted on a call night was positively associated with mortality, even after adjustment in multivariable models.1
The problem with a census is that it is only a rough indicator of the amount of work that a given intern or resident will have. In a focus group study that our group conducted with internal medicine residents, several contributors to patient care errors were identified. Workload was identified as a major factor contributing to patient care mistakes.2 In describing workload, residents noted not only census but the complexity of the patient as contributing factors to workload.
A more comprehensive method than relying on census data has been used in anesthesia.3, 4 In 2 studies, anesthesiologists were asked to rate the effort or intensity associated with the tasks that they performed in the operating room.4, 5 In subsequent studies, this group used a trained observer to record the tasks anesthesiologists performed during a case.6, 7 Work density was calculated by multiplying the duration of each task by the previously developed task intensity score. In this way, work per unit of time can be calculated as can a cumulative workload score for a certain duration of time.
These methods provide the background for the work that we conducted in this study. The purpose of this study was to assign a task effort score to the tasks performed during periods that include admitting patients to the hospital.
METHODS
Study Site
A single 500‐bed Midwest academic institution. Residents rotate through 3 hospitals (a private community hospital, a Veterans hospital, and an academic medical center) during a typical 3‐year internal medicine residency program.
Study Design and Subjects
A cross‐sectional survey was conducted. Subjects recruited for the survey included internal medicine interns and residents, internal medicine ward attending physicians and hospitalists. Attending physicians had to have been on the wards in the past year. The survey was conducted in November, when all eligible house staff should have had at least 1 ward month. Nearly every hospitalist recruited had spent time on both teaching and nonteaching services.
Task List Compilation and Survey Development
An expert panel was convened consisting of 10 physicians representing 3 hospitals, including residents and faculty, some of which were hospitalists. During the session, the participants developed a task list and discussed the work intensity associated with some of the tasks. The task list was reviewed by the study team and organized into categories. The final list included 99 tasks divided into 6 categories: (1) direct patient care, (2) indirect patient care, (3) search for/finding things, (4) educational/academic activities, (5) personal/downtime activities, and (6) other. Table 1 gives examples of items found in each category. We used the terminology that the study participants used to describe their work (eg, they used the term eyeballing a patient to describe the process of making an initial assessment of the patient's status). This list of 99 items was formatted into a survey to allow study participants to rate each task across 3 domains: physical effort, mental effort, and psychological effort, based on previous studies in anesthesia4 (see Supporting Information). The term mental refers to cognitive effort, whereas psychological refers to emotional effort. We used the same scales with the same anchors as described in the anesthesia literature,4 but substituted the internal medicine specific tasks. Each item was rated on a 7‐point Likert‐type scale (1 = almost no stress or effort; 7 = most effort). The survey also included demographic information regarding the respondent and instructions. The instructions directed respondents to rate each item based on their average experience in performing each task. They were further instructed not to rate tasks they had never performed.
| Categories of Tasks | Examples |
|---|---|
| |
| Direct patient care | Conducting the physical examination, hand washing, putting on isolation gear |
| Indirect patient care | Writing H&P, writing orders, ordering additional labs or tests |
| Searching for/finding things | Finding a computer, finding materials for procedures, finding the patient |
| Personal/downtime activities | Eating dinner, sleep, socializing, calling family members |
| Educational/academic activities | Literature search, teaching medical students, preparing a talk |
| Other | Transporting patients, traveling from place to place, billing |
Survey Process
The potential survey participants were notified via e‐mail that they would be asked to complete the survey during a regularly scheduled meeting. The interns, residents, and faculty met during separate time slots. Data from residents and interns were obtained from teaching sessions they were required to attend (as long as their schedule permitted them to). Survey data for attending physicians were obtained from a general internal medicine meeting and a hospitalist meeting. Because of the type of meeting, subspecialists were less likely to have been included. The objectives of the study and its voluntary nature were presented to the groups, and the survey was given to all attendees at the meetings. Due to the anonymous nature of the survey, a waiver of written informed consent was granted. Time was reserved during the course of the meeting to complete the survey. Before distributing the survey, we counted the total number of people in the room so that a participation rate could be calculated. Respondents were instructed to place the survey in a designated envelope after completing it or to return a blank survey if they did not wish to complete it. There was no time limit for completion of the survey. At all of these sessions, this survey was one part of the meeting agenda.
Data Analysis
Surveys were entered into a Microsoft Excel (Redmond, WA) spreadsheet and then transferred into Stata version 8.0 (College Station, TX), which was used for analysis. Our analysis focused on (1) the description of the effort associated with individual tasks, (2) the description of the effort associated with task categories and comparisons across key categories, and (3) a comparison of effort across the task categories' physical, mental, and psychological domains.
Each task had 3 individual domain scores associated with it: physical, mental (ie, cognitive work), and psychological (ie, emotional work). A composite task effort score was calculated for each task by determining the mean of the 3 domain scores for that task.
An overall effort score was calculated for each of the 6 task categories by determining the mean of the composite task effort scores within each category. We used the composite effort score for each task to calculate the Cronbach's value for each category except other. We compared the overall category effort scores for direct versus indirect patient care using 2‐tailed paired t tests with a significance level of P < 0.05. We further evaluated differences in overall category effort scores for direct patient care between physicians of different genders and between house staff and faculty, using 2‐tailed unpaired t tests, with a significance level of P < 0.05.
Finally, we compared the physical, mental, and psychological domain scores for direct versus indirect patient care categories, using paired t tests.
Ethics
This study was approved by the Institutional Review Board at the Medical College of Wisconsin.
RESULTS
The study participation rate was 69% (59/85). The sample consisted of 31 (52%) women and 40 (68%) house staff (see Table 2). The mean age was 34 years. This participation rate represents approximately 1/3 of the internal medicine house staff and a smaller percentage of the faculty that would have been eligible.
| Demographic | Value |
|---|---|
| |
| Age, y, mean (SD) | 34 (8.8) |
| Female gender, no. (%) | 31 (52) |
| Physician description, no. (%) | |
| Intern | 7 (12) |
| Resident | 33 (56) |
| Hospitalist | 4 (7) |
| Nonhospitalist faculty | 15 (25) |
Individual Task Effort
The mean composite effort score of all 99 tasks is provided in the Supporting Information Table. Overall, the most difficult task was going to codes (in the direct patient care category), with a mean composite rating of 5.37 (standard deviation [SD] 1.5); this was also the most difficult psychological task (5.78 [SD 1.65]). The most difficult mental task was transferring an unstable patient to the intensive care unit (5.47 [SD 1.53]). The most difficult physical task was placing a central line (5.02 [SD 1.63]). The easiest task was using the Internet (in the personal/downtime activities category), with a mean composite rating of 1.41 (SD 0.74); this was also the easiest mental (1.52 [SD 1.01]), psychological (1.3 [SD 0.68]), and physical (1.42 [SD 0.76]) task.
Analysis of Task Categories
The overall and domain characteristics of each task category are given in Table 3. Categories contained between 5 and 41 tasks. The Cronbach's ranged from 0.83 for the personal/downtime activities category to 0.98 for the direct patient care category. The mean overall effort ranged from least difficult for the personal/downtime category (1.72 [SD 0.76]) to most difficult for the education category (3.61 [SD 1.06]).
| Category | No. of Items | Cronbach's | Effort Score, Mean (SD)* | |||
|---|---|---|---|---|---|---|
| Composite Effort | Physical Effort | Mental Effort | Psychological Effort | |||
| ||||||
| Direct patient care | 32 | 0.97 | 3.55 (0.91) | 3.22 (1.06) | 3.89 (0.99) | 3.52 (1.04) |
| Indirect patient care | 41 | 0.98 | 3.21 (0.92) | 2.71 (1.09) | 3.80 (1.02) | 3.20 (1.08) |
| Education | 8 | 0.92 | 3.61 (1.06) | 3.12 (1.26) | 4.27 (1.17) | 3.43 (1.30) |
| Finding things | 5 | 0.85 | 2.94 (0.91) | 3.59 (1.23) | 2.43 (1.05) | 2.79 (1.13) |
| Personal | 7 | 0.83 | 1.72 (0.76) | 1.86 (0.92) | 1.69 (0.85) | 1.63 (0.72) |
| Other | 6 | NC | NC | NC | NC | NC |
Using paired t tests, we determined that the direct patient care category was more difficult than the indirect patient care category overall (3.58 versus 3.21, P < 0.001). Direct patient care was statistically significantly more challenging than indirect patient care on the physical (3.23 vs 2.71; P < 0.001), mental (3.90 vs 3.84; P < 0.05), and psychological domains (3.57 vs 3.20; P < 0.001) as well. There were no significant differences between men and women or between house staff and faculty on the difficulty of direct patient care. We found a trend toward increased difficulty of indirect patient care for house staff versus faculty (3.36 vs 2.92; P 0.10), but no differences by gender.
DISCUSSION
In this study, we used a comprehensive list of tasks performed by internal medicine doctors while admitting patients and produced a numeric assessment of the effort associated with each. The list was generated by an expert panel and comprised 6 categories and 99 items. Residents and attending physicians then rated each task based on level of difficulty, specifically looking at the mental, psychological, and physical effort required by each.
Indirect patient care was the task category in our study that had the most tasks associated with it (41 out of 99). Direct patient care included 32 items, but 10 of these were procedures (eg, lumbar puncture), some of which are uncommonly performed. Several time‐motion studies have been performed to document the work done by residents815 and hospitalists.16, 17 Although our study did not assess the time spent on each task, the distribution of tasks across categories is consistent with these time‐motion studies, which show that the amount of time spent in direct patient care is a small fraction of the amount of time spent in the hospital,12 and that work such as interprofessional communication10 and documentation16 consume the majority of time.
This project allowed us to consider the effort required for inpatient internal medicine work on a more granular level than has been described previously. Although the difficulty of tasks associated with anesthesia and surgical work has been described,3, 4, 7, 1820 our study is a unique contribution to the internal medicine literature. Understanding the difficulty of tasks performed by inpatient physicians is an important step toward better management of workload. With concerns about burnout in hospitalists21, 22 and residents,2325 it seems wise to take the difficulty of the work they do into consideration in a more proactive manner. In addition, understanding workload may have patient safety applications. In one study of mistakes made by house staff, 51% of the survey respondents identified workload as a contributing factor.26
We assessed effort for inpatient work by generating a task list and then measuring 3 domains of each task: physical, mental, and psychological. As a result, we were able to further quantify the difficulty of work completed by physicians. Recent work from outside of medicine suggests that individuals have a finite capacity for mental workload, and when this is breached, decision‐making quality is impaired.27 This suggests that it is important to take work intensity into account when assigning work to individuals. For example, a detailed assessment of workload at the task level combined with the amount of time spent on each task would allow us to know how much effort is typically involved with admitting a new patient. This information would allow for more equal distribution of workload across admitting teams. In addition, these methods could be expanded to understand how much effort is involved in the discharge process. This could be taken into account at the beginning of a day when allocating work such as admissions and discharges between members of a team.
This methodology has the potential to be used in other ways to help quantify the effort required for the work that physicians do. Many departments are struggling to develop a system for giving credit to faculty for the time they spend on nonpatient care activities. Perhaps these methods could be used to develop effort scores associated with administrative tasks, and administrative relative value units could be calculated accordingly. Similar techniques have been used with educational relative value units.28
We know from the nursing literature that workload is related to both burnout and patient safety. Burnout is a process related to the emotional work of providing care to people.29 Our methods clearly incorporate the psychological stress of work into the workload assessment. Evaluating the amount of time spent on tasks with high psychological scores may be helpful in identifying work patterns that are more likely to produce burnout in physicians and nurses.
With respect to patient safety, higher patient‐to‐nurse ratios are associated with failure to rescue30 and nosocomial infections.31 Furthermore, researchers have demonstrated that systems issues can add substantially to nursing workload.32 Methods such as those described in our study take into account both patient‐related and systems‐related tasks, and therefore could result in more detailed workload assessments. With more detailed information about contributors to workload, better predictions about optimal staffing could be made, which would ultimately lead to fewer adverse patient events.
Our study has limitations. First, the initial task list was based on the compilation efforts from only 10 physicians. However, this group of physicians represented 3 hospitals and included both resident and attending physicians. Second, the survey data were gathered from a single institution. Although we included trainees and faculty, more participants would be needed to answer questions about how experience and setting/environmental factors affect these assessments. However, participants were instructed to reflect on their whole experience with each task, which presumably includes multiple institutions and training levels. Third, the sample size is fairly small, with more house staff than faculty (hospitalists and nonhospitalists) represented. Regardless, this study is the first attempt to define and quantify workload for internal medicine physicians using these methods. In future studies, we will expand the number of institutions and levels of experience to validate our current data. Finally, the difficulty of the tasks is clearly a subjective assessment. Although this methodology has face validity, further work needs to be done to validate these findings against other measurements of workload, such as census, or more general subjective workload assessments, such as the NASA task load index.33
In conclusion, we have described the tasks performed by inpatient physicians and the difficulty associated with them. Moreover, we have described a methodology that could be replicated at other centers for the purpose of validating our findings or quantifying workload of other types of tasks. We believe that this is the first step toward a more comprehensive understanding of the workload encountered by inpatient physicians. Because workload has implications for physician burnout and patient safety, it is essential that we fully understand the contributors to workload, including the innate difficulty of the tasks that comprise it.
Acknowledgements
The authors Alexis Visotcky, MS, and Sergey Tarima, PhD, for their assistance with statistics.
This work was presented in poster form at the Society of Hospital Medicine Annual Meeting in April 2010, the Society of General Internal Medicine Annual Meeting in May 2010, and the Society of General Internal Medicine regional meeting in September 2010.
Funding Source: The study team was supported by the following funds during this work: VA grants PPO 0925901 (Marilyn M. Schapira and Kathlyn E. Fletcher) and IIR 07201 (Marilyn M. Schapira, Siddhartha Singh, and Kathlyn E. Fletcher).
- ,,,,.House staff team workload and organization effects on patient outcomes in an academic general internal medicine inpatient service.Arch Intern Med.2007;167:47–52.
- ,,, et al.The work hour rules and contributors to patient care mistakes: A focus group study with internal medicine residentsJ Hosp Med.2008;3:228–237.
- ,,.Multiple measures of anesthesia workload during teaching and nonteaching cases.Anesth Analg.2004;98:1419–1425.
- ,,,,.Developing a technique to measure anesthesiologists' real‐time workload.Proceedings of the Human Factors and Ergonomics Society Annual Meeting.2000;44:241–244.
- ,,, et al.Quantitative description of the workload associated with airway management procedures.J Clin Anesth.2000;12:273–282.
- ,,,,,.An objective methodology for task analysis and workload assessment in anesthesia providers.Anesthesiology.1994;80:77–92.
- ,.Effects of intraoperative reading on vigilance and workload during anesthesia care in an academic medical center.Anesthesiology.2009;110:275–283.
- ,,.Resident work hours: what they are really doing.Arch Surg.2004;139:490–493; discussion, 493–494.
- ,,,,,.Analyzing the time and value of housestaff inpatient work.J Gen Intern Med.1998;13:534–540.
- ,,,.All in a day's work: an observational study to quantify how and with whom doctors on hospital wards spend their time.[see comment].Med J Aust.2008;188:506–509.
- ,,,,.How do house officers spend their nights? A time study of internal medicine house staff on call.N Engl J Med.1989;320:1673–1677.
- ,,,,.Systematic review of time studies evaluating physicians in the hospital setting.J Hosp Med.2010;5:353–359.
- ,,.Time analysis of a general medicine service: results from a random work sampling study.J Gen Intern Med.1994;9:272–277.
- ,,,.A phenomenology of scut.Ann Intern Med.1991;115:372–376.
- ,,, et al.The on‐call experience of interns in internal medicine. Medical Education Task Force of Henry Ford Hospital.Arch Intern Med.1990;150:2294–2297.
- ,,, et al.Where did the day go? A time‐motion study of hospitalists.J Hosp Med.2010;5:323–328.
- ,,.How hospitalists spend their time: insights on efficiency and safety.J Hosp Med.2006;1:88–93.
- ,,, et al.Differences in day and night shift clinical performance in anesthesiology.Hum Factors.2008;50:276–290.
- ,,,,.Assessment of the intrarater and interrater reliability of an established clinical task analysis methodology.Anesthesiology.2002;96:1129–1139.
- ,,.The effect of electronic record keeping and transesophageal echocardiography on task distribution, workload, and vigilance during cardiac anesthesia.Anesthesiology.1997;87:144–155.
- .Fight burnout while fostering experience: investing in hospitalist programs now can fight burnout later.ACP Hospitalist. July2008.
- .Hospitalist burnout: recognize it in yourself and others, and avoid or eliminate it.The Hospitalist. March2006.
- ,,,.Burnout and internal medicine resident work‐hour restrictions.Arch Intern Med.2005;165:2595–2600.
- ,,,,.The effects of work‐hour limitations on resident well‐being, patient care, and education in an internal medicine residency program.Arch Intern Med.2005;165:2601–2606.
- ,,,.Burnout and self‐reported patient care in an internal medicine residency program.Ann Intern Med.2002;136:358–367.
- ,,,.Do house officers learn from their mistakes?Qual Saf Health Care.2003;12:221–226; discussion, 227–228.
- ,,.Extraneous factors in judicial decisions.Proc Natl Acad Sci U S A.2011;108:6889–6892.
- ,.Quantifying physician teaching productivity using clinical relative value units.J Gen Intern Med.1999;14:617–621.
- .Maslach Burnout Inventory Manual.3rd ed.Palo Alto, CA:Consulting Psychology Press;1986.
- ,,,,.Hospital nurse staffing and patient mortality, nurse burnout, and job dissatisfaction.JAMA.2002;288:1987–1993.
- ,,,,.Patient density, nurse‐to‐patient ratio and nosocomial infection risk in a pediatric cardiac intensive care unit.Pediatr Infect Dis J.1997;16:1045–1048.
- ,.Operational failures and interruptions in hospital nursing.Health Serv Res.2006;41:643–662.
- ,.Development of NASA‐TLX (Task Load Index): results of empirical and theoretical research. In: Hancock PA, Meshkati N, eds.Human Mental Workload.Amsterdam, Netherlands:North Holland Press;1988:239–250.
In internal medicine residency training, the most commonly used metric for measuring workload of physicians is the number of patients being followed or the number being admitted. There are data to support the importance of these census numbers. One study conducted at an academic medical center demonstrated that for patients admitted to medical services, the number of patients admitted on a call night was positively associated with mortality, even after adjustment in multivariable models.1
The problem with a census is that it is only a rough indicator of the amount of work that a given intern or resident will have. In a focus group study that our group conducted with internal medicine residents, several contributors to patient care errors were identified. Workload was identified as a major factor contributing to patient care mistakes.2 In describing workload, residents noted not only census but the complexity of the patient as contributing factors to workload.
A more comprehensive method than relying on census data has been used in anesthesia.3, 4 In 2 studies, anesthesiologists were asked to rate the effort or intensity associated with the tasks that they performed in the operating room.4, 5 In subsequent studies, this group used a trained observer to record the tasks anesthesiologists performed during a case.6, 7 Work density was calculated by multiplying the duration of each task by the previously developed task intensity score. In this way, work per unit of time can be calculated as can a cumulative workload score for a certain duration of time.
These methods provide the background for the work that we conducted in this study. The purpose of this study was to assign a task effort score to the tasks performed during periods that include admitting patients to the hospital.
METHODS
Study Site
A single 500‐bed Midwest academic institution. Residents rotate through 3 hospitals (a private community hospital, a Veterans hospital, and an academic medical center) during a typical 3‐year internal medicine residency program.
Study Design and Subjects
A cross‐sectional survey was conducted. Subjects recruited for the survey included internal medicine interns and residents, internal medicine ward attending physicians and hospitalists. Attending physicians had to have been on the wards in the past year. The survey was conducted in November, when all eligible house staff should have had at least 1 ward month. Nearly every hospitalist recruited had spent time on both teaching and nonteaching services.
Task List Compilation and Survey Development
An expert panel was convened consisting of 10 physicians representing 3 hospitals, including residents and faculty, some of which were hospitalists. During the session, the participants developed a task list and discussed the work intensity associated with some of the tasks. The task list was reviewed by the study team and organized into categories. The final list included 99 tasks divided into 6 categories: (1) direct patient care, (2) indirect patient care, (3) search for/finding things, (4) educational/academic activities, (5) personal/downtime activities, and (6) other. Table 1 gives examples of items found in each category. We used the terminology that the study participants used to describe their work (eg, they used the term eyeballing a patient to describe the process of making an initial assessment of the patient's status). This list of 99 items was formatted into a survey to allow study participants to rate each task across 3 domains: physical effort, mental effort, and psychological effort, based on previous studies in anesthesia4 (see Supporting Information). The term mental refers to cognitive effort, whereas psychological refers to emotional effort. We used the same scales with the same anchors as described in the anesthesia literature,4 but substituted the internal medicine specific tasks. Each item was rated on a 7‐point Likert‐type scale (1 = almost no stress or effort; 7 = most effort). The survey also included demographic information regarding the respondent and instructions. The instructions directed respondents to rate each item based on their average experience in performing each task. They were further instructed not to rate tasks they had never performed.
| Categories of Tasks | Examples |
|---|---|
| |
| Direct patient care | Conducting the physical examination, hand washing, putting on isolation gear |
| Indirect patient care | Writing H&P, writing orders, ordering additional labs or tests |
| Searching for/finding things | Finding a computer, finding materials for procedures, finding the patient |
| Personal/downtime activities | Eating dinner, sleep, socializing, calling family members |
| Educational/academic activities | Literature search, teaching medical students, preparing a talk |
| Other | Transporting patients, traveling from place to place, billing |
Survey Process
The potential survey participants were notified via e‐mail that they would be asked to complete the survey during a regularly scheduled meeting. The interns, residents, and faculty met during separate time slots. Data from residents and interns were obtained from teaching sessions they were required to attend (as long as their schedule permitted them to). Survey data for attending physicians were obtained from a general internal medicine meeting and a hospitalist meeting. Because of the type of meeting, subspecialists were less likely to have been included. The objectives of the study and its voluntary nature were presented to the groups, and the survey was given to all attendees at the meetings. Due to the anonymous nature of the survey, a waiver of written informed consent was granted. Time was reserved during the course of the meeting to complete the survey. Before distributing the survey, we counted the total number of people in the room so that a participation rate could be calculated. Respondents were instructed to place the survey in a designated envelope after completing it or to return a blank survey if they did not wish to complete it. There was no time limit for completion of the survey. At all of these sessions, this survey was one part of the meeting agenda.
Data Analysis
Surveys were entered into a Microsoft Excel (Redmond, WA) spreadsheet and then transferred into Stata version 8.0 (College Station, TX), which was used for analysis. Our analysis focused on (1) the description of the effort associated with individual tasks, (2) the description of the effort associated with task categories and comparisons across key categories, and (3) a comparison of effort across the task categories' physical, mental, and psychological domains.
Each task had 3 individual domain scores associated with it: physical, mental (ie, cognitive work), and psychological (ie, emotional work). A composite task effort score was calculated for each task by determining the mean of the 3 domain scores for that task.
An overall effort score was calculated for each of the 6 task categories by determining the mean of the composite task effort scores within each category. We used the composite effort score for each task to calculate the Cronbach's value for each category except other. We compared the overall category effort scores for direct versus indirect patient care using 2‐tailed paired t tests with a significance level of P < 0.05. We further evaluated differences in overall category effort scores for direct patient care between physicians of different genders and between house staff and faculty, using 2‐tailed unpaired t tests, with a significance level of P < 0.05.
Finally, we compared the physical, mental, and psychological domain scores for direct versus indirect patient care categories, using paired t tests.
Ethics
This study was approved by the Institutional Review Board at the Medical College of Wisconsin.
RESULTS
The study participation rate was 69% (59/85). The sample consisted of 31 (52%) women and 40 (68%) house staff (see Table 2). The mean age was 34 years. This participation rate represents approximately 1/3 of the internal medicine house staff and a smaller percentage of the faculty that would have been eligible.
| Demographic | Value |
|---|---|
| |
| Age, y, mean (SD) | 34 (8.8) |
| Female gender, no. (%) | 31 (52) |
| Physician description, no. (%) | |
| Intern | 7 (12) |
| Resident | 33 (56) |
| Hospitalist | 4 (7) |
| Nonhospitalist faculty | 15 (25) |
Individual Task Effort
The mean composite effort score of all 99 tasks is provided in the Supporting Information Table. Overall, the most difficult task was going to codes (in the direct patient care category), with a mean composite rating of 5.37 (standard deviation [SD] 1.5); this was also the most difficult psychological task (5.78 [SD 1.65]). The most difficult mental task was transferring an unstable patient to the intensive care unit (5.47 [SD 1.53]). The most difficult physical task was placing a central line (5.02 [SD 1.63]). The easiest task was using the Internet (in the personal/downtime activities category), with a mean composite rating of 1.41 (SD 0.74); this was also the easiest mental (1.52 [SD 1.01]), psychological (1.3 [SD 0.68]), and physical (1.42 [SD 0.76]) task.
Analysis of Task Categories
The overall and domain characteristics of each task category are given in Table 3. Categories contained between 5 and 41 tasks. The Cronbach's ranged from 0.83 for the personal/downtime activities category to 0.98 for the direct patient care category. The mean overall effort ranged from least difficult for the personal/downtime category (1.72 [SD 0.76]) to most difficult for the education category (3.61 [SD 1.06]).
| Category | No. of Items | Cronbach's | Effort Score, Mean (SD)* | |||
|---|---|---|---|---|---|---|
| Composite Effort | Physical Effort | Mental Effort | Psychological Effort | |||
| ||||||
| Direct patient care | 32 | 0.97 | 3.55 (0.91) | 3.22 (1.06) | 3.89 (0.99) | 3.52 (1.04) |
| Indirect patient care | 41 | 0.98 | 3.21 (0.92) | 2.71 (1.09) | 3.80 (1.02) | 3.20 (1.08) |
| Education | 8 | 0.92 | 3.61 (1.06) | 3.12 (1.26) | 4.27 (1.17) | 3.43 (1.30) |
| Finding things | 5 | 0.85 | 2.94 (0.91) | 3.59 (1.23) | 2.43 (1.05) | 2.79 (1.13) |
| Personal | 7 | 0.83 | 1.72 (0.76) | 1.86 (0.92) | 1.69 (0.85) | 1.63 (0.72) |
| Other | 6 | NC | NC | NC | NC | NC |
Using paired t tests, we determined that the direct patient care category was more difficult than the indirect patient care category overall (3.58 versus 3.21, P < 0.001). Direct patient care was statistically significantly more challenging than indirect patient care on the physical (3.23 vs 2.71; P < 0.001), mental (3.90 vs 3.84; P < 0.05), and psychological domains (3.57 vs 3.20; P < 0.001) as well. There were no significant differences between men and women or between house staff and faculty on the difficulty of direct patient care. We found a trend toward increased difficulty of indirect patient care for house staff versus faculty (3.36 vs 2.92; P 0.10), but no differences by gender.
DISCUSSION
In this study, we used a comprehensive list of tasks performed by internal medicine doctors while admitting patients and produced a numeric assessment of the effort associated with each. The list was generated by an expert panel and comprised 6 categories and 99 items. Residents and attending physicians then rated each task based on level of difficulty, specifically looking at the mental, psychological, and physical effort required by each.
Indirect patient care was the task category in our study that had the most tasks associated with it (41 out of 99). Direct patient care included 32 items, but 10 of these were procedures (eg, lumbar puncture), some of which are uncommonly performed. Several time‐motion studies have been performed to document the work done by residents815 and hospitalists.16, 17 Although our study did not assess the time spent on each task, the distribution of tasks across categories is consistent with these time‐motion studies, which show that the amount of time spent in direct patient care is a small fraction of the amount of time spent in the hospital,12 and that work such as interprofessional communication10 and documentation16 consume the majority of time.
This project allowed us to consider the effort required for inpatient internal medicine work on a more granular level than has been described previously. Although the difficulty of tasks associated with anesthesia and surgical work has been described,3, 4, 7, 1820 our study is a unique contribution to the internal medicine literature. Understanding the difficulty of tasks performed by inpatient physicians is an important step toward better management of workload. With concerns about burnout in hospitalists21, 22 and residents,2325 it seems wise to take the difficulty of the work they do into consideration in a more proactive manner. In addition, understanding workload may have patient safety applications. In one study of mistakes made by house staff, 51% of the survey respondents identified workload as a contributing factor.26
We assessed effort for inpatient work by generating a task list and then measuring 3 domains of each task: physical, mental, and psychological. As a result, we were able to further quantify the difficulty of work completed by physicians. Recent work from outside of medicine suggests that individuals have a finite capacity for mental workload, and when this is breached, decision‐making quality is impaired.27 This suggests that it is important to take work intensity into account when assigning work to individuals. For example, a detailed assessment of workload at the task level combined with the amount of time spent on each task would allow us to know how much effort is typically involved with admitting a new patient. This information would allow for more equal distribution of workload across admitting teams. In addition, these methods could be expanded to understand how much effort is involved in the discharge process. This could be taken into account at the beginning of a day when allocating work such as admissions and discharges between members of a team.
This methodology has the potential to be used in other ways to help quantify the effort required for the work that physicians do. Many departments are struggling to develop a system for giving credit to faculty for the time they spend on nonpatient care activities. Perhaps these methods could be used to develop effort scores associated with administrative tasks, and administrative relative value units could be calculated accordingly. Similar techniques have been used with educational relative value units.28
We know from the nursing literature that workload is related to both burnout and patient safety. Burnout is a process related to the emotional work of providing care to people.29 Our methods clearly incorporate the psychological stress of work into the workload assessment. Evaluating the amount of time spent on tasks with high psychological scores may be helpful in identifying work patterns that are more likely to produce burnout in physicians and nurses.
With respect to patient safety, higher patient‐to‐nurse ratios are associated with failure to rescue30 and nosocomial infections.31 Furthermore, researchers have demonstrated that systems issues can add substantially to nursing workload.32 Methods such as those described in our study take into account both patient‐related and systems‐related tasks, and therefore could result in more detailed workload assessments. With more detailed information about contributors to workload, better predictions about optimal staffing could be made, which would ultimately lead to fewer adverse patient events.
Our study has limitations. First, the initial task list was based on the compilation efforts from only 10 physicians. However, this group of physicians represented 3 hospitals and included both resident and attending physicians. Second, the survey data were gathered from a single institution. Although we included trainees and faculty, more participants would be needed to answer questions about how experience and setting/environmental factors affect these assessments. However, participants were instructed to reflect on their whole experience with each task, which presumably includes multiple institutions and training levels. Third, the sample size is fairly small, with more house staff than faculty (hospitalists and nonhospitalists) represented. Regardless, this study is the first attempt to define and quantify workload for internal medicine physicians using these methods. In future studies, we will expand the number of institutions and levels of experience to validate our current data. Finally, the difficulty of the tasks is clearly a subjective assessment. Although this methodology has face validity, further work needs to be done to validate these findings against other measurements of workload, such as census, or more general subjective workload assessments, such as the NASA task load index.33
In conclusion, we have described the tasks performed by inpatient physicians and the difficulty associated with them. Moreover, we have described a methodology that could be replicated at other centers for the purpose of validating our findings or quantifying workload of other types of tasks. We believe that this is the first step toward a more comprehensive understanding of the workload encountered by inpatient physicians. Because workload has implications for physician burnout and patient safety, it is essential that we fully understand the contributors to workload, including the innate difficulty of the tasks that comprise it.
Acknowledgements
The authors Alexis Visotcky, MS, and Sergey Tarima, PhD, for their assistance with statistics.
This work was presented in poster form at the Society of Hospital Medicine Annual Meeting in April 2010, the Society of General Internal Medicine Annual Meeting in May 2010, and the Society of General Internal Medicine regional meeting in September 2010.
Funding Source: The study team was supported by the following funds during this work: VA grants PPO 0925901 (Marilyn M. Schapira and Kathlyn E. Fletcher) and IIR 07201 (Marilyn M. Schapira, Siddhartha Singh, and Kathlyn E. Fletcher).
- ,,,,.House staff team workload and organization effects on patient outcomes in an academic general internal medicine inpatient service.Arch Intern Med.2007;167:47–52.
- ,,, et al.The work hour rules and contributors to patient care mistakes: A focus group study with internal medicine residentsJ Hosp Med.2008;3:228–237.
- ,,.Multiple measures of anesthesia workload during teaching and nonteaching cases.Anesth Analg.2004;98:1419–1425.
- ,,,,.Developing a technique to measure anesthesiologists' real‐time workload.Proceedings of the Human Factors and Ergonomics Society Annual Meeting.2000;44:241–244.
- ,,, et al.Quantitative description of the workload associated with airway management procedures.J Clin Anesth.2000;12:273–282.
- ,,,,,.An objective methodology for task analysis and workload assessment in anesthesia providers.Anesthesiology.1994;80:77–92.
- ,.Effects of intraoperative reading on vigilance and workload during anesthesia care in an academic medical center.Anesthesiology.2009;110:275–283.
- ,,.Resident work hours: what they are really doing.Arch Surg.2004;139:490–493; discussion, 493–494.
- ,,,,,.Analyzing the time and value of housestaff inpatient work.J Gen Intern Med.1998;13:534–540.
- ,,,.All in a day's work: an observational study to quantify how and with whom doctors on hospital wards spend their time.[see comment].Med J Aust.2008;188:506–509.
- ,,,,.How do house officers spend their nights? A time study of internal medicine house staff on call.N Engl J Med.1989;320:1673–1677.
- ,,,,.Systematic review of time studies evaluating physicians in the hospital setting.J Hosp Med.2010;5:353–359.
- ,,.Time analysis of a general medicine service: results from a random work sampling study.J Gen Intern Med.1994;9:272–277.
- ,,,.A phenomenology of scut.Ann Intern Med.1991;115:372–376.
- ,,, et al.The on‐call experience of interns in internal medicine. Medical Education Task Force of Henry Ford Hospital.Arch Intern Med.1990;150:2294–2297.
- ,,, et al.Where did the day go? A time‐motion study of hospitalists.J Hosp Med.2010;5:323–328.
- ,,.How hospitalists spend their time: insights on efficiency and safety.J Hosp Med.2006;1:88–93.
- ,,, et al.Differences in day and night shift clinical performance in anesthesiology.Hum Factors.2008;50:276–290.
- ,,,,.Assessment of the intrarater and interrater reliability of an established clinical task analysis methodology.Anesthesiology.2002;96:1129–1139.
- ,,.The effect of electronic record keeping and transesophageal echocardiography on task distribution, workload, and vigilance during cardiac anesthesia.Anesthesiology.1997;87:144–155.
- .Fight burnout while fostering experience: investing in hospitalist programs now can fight burnout later.ACP Hospitalist. July2008.
- .Hospitalist burnout: recognize it in yourself and others, and avoid or eliminate it.The Hospitalist. March2006.
- ,,,.Burnout and internal medicine resident work‐hour restrictions.Arch Intern Med.2005;165:2595–2600.
- ,,,,.The effects of work‐hour limitations on resident well‐being, patient care, and education in an internal medicine residency program.Arch Intern Med.2005;165:2601–2606.
- ,,,.Burnout and self‐reported patient care in an internal medicine residency program.Ann Intern Med.2002;136:358–367.
- ,,,.Do house officers learn from their mistakes?Qual Saf Health Care.2003;12:221–226; discussion, 227–228.
- ,,.Extraneous factors in judicial decisions.Proc Natl Acad Sci U S A.2011;108:6889–6892.
- ,.Quantifying physician teaching productivity using clinical relative value units.J Gen Intern Med.1999;14:617–621.
- .Maslach Burnout Inventory Manual.3rd ed.Palo Alto, CA:Consulting Psychology Press;1986.
- ,,,,.Hospital nurse staffing and patient mortality, nurse burnout, and job dissatisfaction.JAMA.2002;288:1987–1993.
- ,,,,.Patient density, nurse‐to‐patient ratio and nosocomial infection risk in a pediatric cardiac intensive care unit.Pediatr Infect Dis J.1997;16:1045–1048.
- ,.Operational failures and interruptions in hospital nursing.Health Serv Res.2006;41:643–662.
- ,.Development of NASA‐TLX (Task Load Index): results of empirical and theoretical research. In: Hancock PA, Meshkati N, eds.Human Mental Workload.Amsterdam, Netherlands:North Holland Press;1988:239–250.
Copyright © 2012 Society of Hospital Medicine
Trends in Inpatient Continuity of Care
Continuity of care is considered by many physicians to be of critical importance in providing high‐quality patient care. Most of the research to date has focused on continuity in outpatient primary care. Research on outpatient continuity of care has been facilitated by the fact that a number of measurement tools for outpatient continuity exist.1 Outpatient continuity of care has been linked to better quality of life scores,2 lower costs,3 and less emergency room use.4 As hospital medicine has taken on more and more of the responsibility of inpatient care, primary care doctors have voiced concerns about the impact of hospitalists on overall continuity of care5 and the quality of the doctorpatient relationship.6
Recently, continuity of care in the hospital setting has also received attention. When the Accreditation Council for Graduate Medical Education (ACGME) first proposed restrictions to resident duty hours, the importance of continuity of inpatient care began to be debated in earnest in large part because of the increase in hand‐offs which accompanies discontinuity.7, 8 A recent study of hospitalist communication documented that as many as 13% of hand‐offs at the time of service changes are judged as incomplete by the receiving physician. These incomplete hand‐offs were more likely to be associated with uncertainty regarding the plan of care, as well as perceived near misses or adverse events.9 In addition, several case reports and studies suggest that systems with less continuity may have poorer outcomes.7, 1015
Continuity in the hospital setting is likely to be important for several reasons. First, the acuity of a patient's problem during a hospitalization is likely greater than during an outpatient visit. Thus the complexity of information to be transferred between physicians during a hospital stay is correspondingly greater. Second, the diagnostic uncertainty surrounding many admissions leads to complex thought processes that may be difficult to recreate when handing off patient care to another physician. Finally, knowledge of a patient's hospital course and the likely trajectory of care is facilitated by firsthand knowledge of where the patient has been. All this information can be difficult to distill into a brief sign‐out to another physician who assumes care of the patient.
In the current study, we sought to examine the trends over time in continuity of inpatient care. We chose patients likely to be cared for by general internists: those hospitalized for chronic obstructive pulmonary disease (COPD), pneumonia, and congestive heart failure (CHF). The general internists caring for patients in the hospital could be the patient's primary care physician (PCP), a physician covering for the patient's PCP, a physician assigned at admission by the hospital, or a hospitalist. Our goals were to describe the current level of continuity of care in the hospital setting, to examine whether continuity has changed over time, and to determine factors affecting continuity of care.
Methods
We used a 5% national sample of claims data from Medicare beneficiaries for the years 19962006.16 This included Medicare enrollment files, Medicare Provider Analysis and Review (MEDPAR) files, Medicare Carrier files, and Provider of Services (POS) files.17, 18
Establishment of the Study Cohort
Hospital admissions for COPD (Diagnosis Related Group [DRG] 088), pneumonia (DRG 089, 090), and CHF (DRG 127) from 1996 to 2006 for patients older than 66 years in MEDPAR were selected (n = 781,348). We excluded admissions for patients enrolled in health maintenance organizations (HMOs) or who did not have Medicare Parts A and B for the entire year prior to admission (n = 57,558). Admissions with a length of stay >18 days (n = 10,688) were considered outliers (exceeding the 99th percentile) and were excluded. Only admissions cared for by a general internist, family physician, general practitioner, or geriatrician were included (n = 528,453).
Measures
We categorized patients by age, gender, and ethnicity using Medicare enrollment files. We used the Medicaid indicator in the Medicare file as a proxy of low socioeconomic status. We used MEDPAR files to determine the origin of the admission (via the emergency department vs other), weekend versus weekday admission, and DRG. A comorbidity score was generated using the Elixhauser comorbidity scale using inpatient and outpatient billing data.19 In analyses, we listed the total number of comorbidities identified. The specialty of each physician was determined from the codes in the Medicare Carrier files. The 2004 POS files provided hospital‐level information such as zip code, metropolitan size, state, total number of beds, type of hospital, and medical school affiliation. We divided metropolitan size and total number of hospital beds into quartiles. We categorized hospitals as nonprofit, for profit, or public; medical school affiliation was categorized as non, minor, or major.
Determination of Primary Care Physician (PCP)
We identified outpatient visits using American Medical AssociationCommon Procedure Terminology (CPT) evaluation and management codes 99201 to 99205 (new patient) and 99221 to 99215 (established patient encounters). Individual providers were differentiated by using their Unique Provider Identification Number (UPIN). We defined a PCP as a general practitioner, family physician, internist, or geriatrician. Patients had to make at least 3 visits on different days to the same PCP within a year prior to the hospitalization to be categorized as having a PCP.20
Identification of Hospitalists Versus Other Generalist Physicians
As previously described, we defined hospitalists as general internal medicine physicians who derive at least 90% of their Medicare claims for Evaluation and Management services from care provided to hospitalized patients.21 Non‐hospitalist generalist physicians were those generalists who met the criteria for generalists but did not derive at least 90% of their Medicare claims from inpatient medicine.
Definition of Inpatient Continuity of Care
We measured inpatient continuity of care by number of generalist physicians (including hospitalists) who provided care during a hospitalization, through all inpatient claims made during that hospitalization. We considered patients to have had inpatient continuity of care if all billing by generalist physicians was done by one physician during the entire hospitalization.
Statistical Analyses
We calculated the percentage of admissions that received care from 1, 2, or 3 or more generalist physicians during the hospitalization, and stratified by selected patient and hospital characteristics. These proportions were also stratified by whether the patients were cared for by their outpatient PCP or not, and whether they were cared for by hospitalists or not. Based on who cared for the patient during the hospitalization, all admissions were classified as receiving care from: 1) non‐hospitalist generalist physicians, 2) a combination of generalist physicians and hospitalists, and 3) hospitalists only. The effect of patient and hospital characteristics on whether a patient experienced inpatient continuity was evaluated using a hierarchical generalized linear model (HGLM) with a logistic link, adjusting for clustering of admissions within hospitals and all covariates. We repeated our analyses using HGLM with an ordinal logit link to explore the factors associated with number of generalists seen in the hospital. All analyses were performed with SAS version 9.1 (SAS Inc, Cary, NC). The SAS GLIMMIX procedure was used to conduct multilevel analyses.
Results
Between 1996 and 2006, 528,453 patients hospitalized for COPD, pneumonia, and CHF received care by a generalist physician during their hospital stay. Of these, 64.3% were seen by one generalist physician, 26.9% by two generalist physicians, and 8.8% by three or more generalist physicians during hospitalization.
Figure 1 shows the percentage of all patients seen by 1, 2, and 3 or more generalist physicians between 1996 and 2006. The percentage of patients receiving care from one generalist physician declined from 70.7% in 1996 to 59.4% in 2006 (P < 0.001). During the same period, the percentage of patients receiving care from 3 or more generalist physicians increased from 6.5% to 10.7% (P < 0.001). Similar trends were seen for each of the 3 conditions. There was a decrease in overall length of stay during this period, from a mean of 5.7 to 4.9 days (P < 0.001). The increase in the number of generalist physicians providing care during the hospital stay did not correspond to an increase in total number of visits during the hospitalization. The average number of daily visits from a generalist physician was 0.94 (0.30) in 1996 and 0.96 (0.35) in 2006.

Table 1 presents the percentage of patients receiving care from 1, 2, and 3 or more generalist physicians during hospitalization stratified by patient and hospital characteristics. Older adults, females, non‐Hispanic whites, those with higher socioeconomic status, and those with more comorbidities were more likely to receive care by multiple generalist physicians. There was also large variation by geographic region, metropolitan area size, and hospital characteristics. All of these differences were significant at the P < 0.0001 level.
| No. of Generalist Physicians Seen During Hospitalization | ||||
|---|---|---|---|---|
| Characteristic | N | 1 | 2 | 3 (Percentage of Patients) |
| ||||
| Age at admission | ||||
| 6674 | 152,488 | 66.4 | 25.6 | 8.0 |
| 7584 | 226,802 | 63.8 | 27.3 | 8.9 |
| 85+ | 149,163 | 63.0 | 27.7 | 9.3 |
| Gender | ||||
| Male | 216,602 | 65.3 | 26.4 | 8.3 |
| Female | 311,851 | 63.6 | 27.3 | 9.1 |
| Ethnicity | ||||
| White | 461,543 | 63.7 | 27.4 | 9.0 |
| Black | 46,960 | 68.6 | 23.8 | 7.6 |
| Other | 19,950 | 67.9 | 24.5 | 7.6 |
| Low socioeconomic status | ||||
| No | 366,392 | 63.4 | 27.5 | 9.1 |
| Yes | 162,061 | 66.3 | 25.7 | 8.0 |
| Emergency admission | ||||
| No | 188,354 | 66.8 | 25.6 | 7.6 |
| Yes | 340,099 | 62.9 | 27.7 | 9.4 |
| Weekend admission | ||||
| No | 392,150 | 65.7 | 25.8 | 8.5 |
| Yes | 136,303 | 60.1 | 30.3 | 9.6 |
| Diagnosis‐related groups | ||||
| CHF | 213,914 | 65.0 | 26.3 | 8.7 |
| Pneumonia | 195,430 | 62.5 | 28.0 | 9.5 |
| COPD | 119,109 | 66.1 | 26.2 | 7.7 |
| Had a PCP | ||||
| No | 201,016 | 66.5 | 25.4 | 8.0 |
| Yes | 327,437 | 62.9 | 27.9 | 9.2 |
| Seen hospitalist | ||||
| No | 431,784 | 67.8 | 25.1 | 7.0 |
| Yes | 96,669 | 48.5 | 34.9 | 16.6 |
| Charlson comorbidity score | ||||
| 0 | 127,385 | 64.0 | 27.2 | 8.8 |
| 1 | 131,402 | 65.1 | 26.8 | 8.1 |
| 2 | 105,831 | 64.9 | 26.6 | 8.5 |
| 3 | 163,835 | 63.4 | 27.1 | 9.5 |
| ICU use | ||||
| No | 431,462 | 65.3 | 26.5 | 8.2 |
| Yes | 96,991 | 60.1 | 28.7 | 11.2 |
| Length of stay (in days) | ||||
| Mean (SD) | 4.7 (2.9) | 5.8 (3.1) | 8.1 (3.7) | |
| Geographic region | ||||
| New England | 23,572 | 55.7 | 30.8 | 13.5 |
| Middle Atlantic | 78,181 | 60.8 | 27.8 | 11.4 |
| East North Central | 98,072 | 65.7 | 26.3 | 8.0 |
| West North Central | 44,785 | 59.6 | 30.5 | 9.9 |
| South Atlantic | 104,894 | 63.8 | 27.0 | 9.2 |
| East South Central | 51,450 | 67.8 | 24.6 | 7.6 |
| West South Central | 63,493 | 69.2 | 24.8 | 6.0 |
| Mountain | 20,310 | 61.9 | 29.4 | 8.7 |
| Pacific | 36,484 | 66.7 | 26.3 | 7.0 |
| Size of metropolitan area* | ||||
| 1,000,000 | 229,145 | 63.7 | 26.5 | 9.8 |
| 250,000999,999 | 114,448 | 61.0 | 29.2 | 9.8 |
| 100,000249,999 | 11,448 | 61.3 | 30.4 | 8.3 |
| <100,000 | 171,585 | 67.4 | 25.8 | 6.8 |
| Medical school affiliation* | ||||
| Major | 77,605 | 62.9 | 26.8 | 10.3 |
| Minor | 107,144 | 61.5 | 28.4 | 10.1 |
| Non | 341,874 | 65.5 | 26.5 | 8.0 |
| Type of hospital* | ||||
| Nonprofit | 375,888 | 62.7 | 27.8 | 9.5 |
| For profit | 63,898 | 67.5 | 25.5 | 7.0 |
| Public | 86,837 | 68.9 | 24.2 | 6.9 |
| Hospital size* | . | . | . | |
| <200 beds | 232,869 | 67.2 | 25.7 | 7.1 |
| 200349 beds | 135,954 | 62.6 | 27.9 | 9.5 |
| 350499 beds | 77,080 | 61.1 | 28.3 | 10.6 |
| 500 beds | 80,723 | 61.7 | 27.6 | 10.7 |
| Discharge location | ||||
| Home | 361,893 | 66.6 | 26.0 | 7.4 |
| SNF | 94,723 | 57.6 | 30.1 | 12.3 |
| Rehab | 3,030 | 45.7 | 34.2 | 20.1 |
| Death | 22,133 | 63.1 | 25.4 | 11.5 |
| Other | 46,674 | 61.8 | 28.1 | 10.1 |
Table 2 presents the results of a multivariable analysis of factors independently associated with experiencing continuity of care. In this analysis, continuity of care was defined as receiving inpatient care from one generalist physician (vs two or more). In the unadjusted models, the odds of experiencing continuity of care decreased by 5.5% per year from 1996 through 2006, and this decrease did not substantially change after adjusting for all other variables (4.8% yearly decrease). Younger patients, females, black patients, and those with low socioeconomic status were slightly more likely to experience continuity of care. As expected, patients admitted on weekends, emergency admissions, and those with intensive care unit (ICU) stays were less likely to experience continuity. There were marked geographic variations in continuity, with continuity approximately half as likely in New England as in the South. Continuity was greatest in smaller metropolitan areas versus rural and large metropolitan areas. Hospital size and teaching status produced only minor variation.
| Characteristic | Odds Ratio (95% CI) |
|---|---|
| |
| Admission year (increase by year) | 0.952 (0.9500.954) |
| Length of stay (increase by day) | 0.822 (0.8200.823) |
| Had a PCP | |
| No | 1.0 |
| Yes | 0.762 (0.7520.773) |
| Seen by a hospitalist | |
| No | 1.0 |
| Yes | 0.391 (0.3840.398) |
| Age | |
| 6674 | 1.0 |
| 7584 | 0.959 (0.9440.973) |
| 85+ | 0.946 (0.9300.962) |
| Gender | |
| Male | 1.0 |
| Female | 1.047 (1.0331.060) |
| Ethnicity | |
| White | 1.0 |
| Black | 1.126 (1.0971.155) |
| Other | 1.062 (1.0231.103) |
| Low socioeconomic status | |
| No | 1.0 |
| Yes | 1.036 (1.0201.051) |
| Emergency admission | |
| No | 1.0 |
| Yes | 0.864 (0.8510.878) |
| Weekend admission | |
| No | 1.0 |
| Yes | 0.778 (0.7680.789) |
| Diagnosis‐related group | |
| CHF | 1.0 |
| Pneumonia | 0.964 (0.9500.978) |
| COPD | 1.002 (0.9851.019) |
| Charlson comorbidity score | |
| 0 | 1.0 |
| 1 | 1.053 (1.0351.072) |
| 2 | 1.062 (1.0421.083) |
| 3 | 1.040 (1.0221.058) |
| ICU use | |
| No | 1.0 |
| Yes | 0.918 (0.9020.935) |
| Geographic region | |
| Middle Atlantic | 1.0 |
| New England | 0.714 (0.6210.822) |
| East North Central | 1.015 (0.9221.119) |
| West North Central | 0.791 (0.7110.879) |
| South Atlantic | 1.074 (0.9711.186) |
| East South Central | 1.250 (1.1131.403) |
| West South Central | 1.377 (1.2401.530) |
| Mountain | 0.839 (0.7400.951) |
| Pacific | 0.985 (0.8841.097) |
| Size of metropolitan area | |
| 1,000,000 | 1.0 |
| 250,000999,999 | 0.743 (0.6910.798) |
| 100,000249,999 | 0.651 (0.5380.789) |
| <100,000 | 1.062 (0.9911.138) |
| Medical school affiliation | |
| None | 1.0 |
| Minor | 0.889 (0.8270.956) |
| Major | 1.048 (0.9521.154) |
| Type of hospital | |
| Nonprofit | 1.0 |
| For profit | 1.194 (1.1061.289) |
| Public | 1.394 (1.3091.484) |
| Size of hospital | |
| <200 beds | 1.0 |
| 200349 beds | 0.918 (0.8550.986) |
| 350499 beds | 0.962 (0.8721.061) |
| 500 beds | 1.000 (0.8931.119) |
In Table 2 we also show that patients with an established PCP and those who received care from a hospitalist in the hospital were substantially less likely to experience continuity of care. There are several possible interpretations for that finding. For example, it might be that patients admitted to a hospitalist service were likely to see multiple hospitalists. Alternatively, the decreased continuity associated with hospitalists could reflect the fact that some patients cared for predominantly by non‐hospitalists may have seen a hospitalist on call for a sudden change in health status. To further explore these possible explanatory pathways, we constructed three new cohorts: 1) patients receiving all their care from non‐hospitalists, 2) patients receiving all their care from hospitalists, and 3) patients seen by both. As shown in Table 3, in patients seen by non‐hospitalists only, the mean number of generalist physicians seen during hospitalization was slightly greater than in patients cared for only by hospitalists.
| Received Care During Entire Hospitalization | No. of Admissions | Mean (SD) No. of Generalist Physicians Seen During Hospitalization |
|---|---|---|
| ||
| Non‐hospitalist physician | 431,784 | 1.41 (0.68)* |
| Hospitalist physician | 64,662 | 1.34 (0.62)* |
| Both | 32,007 | 2.55 (0.83)* |
We also tested for interactions in Table 2 between admission year and other factors. There was a significant interaction between admission year and having an identifiable PCP in the year prior to admission (Table 2). The odds of experiencing continuity of care decreased more rapidly for patients who did not have a PCP (5.5% per year; 95% CI: 5.2%5.8%) than for those who had one (4.3% per year; 95% CI: 4.1%4.6%).
Discussion
We conducted this study to better understand the degree to which hospitalized patients experience discontinuity of care within a hospital stay and to determine which patients are most likely to experience discontinuity. In our study, we specifically chose admission conditions that would likely be followed primarily by generalist physicians. We found that, over the past decade, discontinuity of care for hospitalized patients has increased substantially, as indicated by the proportion of patients taken care of by more than one generalist physician during a single hospital stay. This occurred even though overall length of stay was decreasing in this same period.
It is perhaps not surprising that inpatient continuity of care has been decreasing in the past 10 years. Outpatient practices are becoming busier, and more doctors are practicing in large group practices, which could lead to several different physicians in the same practice rounding on a hospitalized patient. We have previously demonstrated that hospitalists are caring for an increasing number of patients over this same time period,21 so another possibility is that hospitalist services are being used more often because of this heavy outpatient workload. Our analyses allowed us to test the hypothesis that having hospitalists involved in patient care increases discontinuity.
At first glance, it appears that being cared for by hospitalists may result in worse continuity of care. However, closer scrutiny of the data reveals that the discontinuity ascribed to the hospitalists in the multivariable model appears to be an artifact of defining the hospitalist variable as having been seen by any hospitalist during the hospital stay. This would include patients who saw a hospitalist in addition to their PCP or another non‐hospitalist generalist. When we compared hospitalist‐only care to other generalist care, we could not detect a difference in discontinuity. We know that generalist visits per day to patients has not substantially increased over time, so this discontinuity trend is not explained by having visits by both a hospitalist and the PCP. Therefore, this combination of findings suggests that the increased discontinuity associated with having a hospitalist involved in patient care is likely the result of system issues rather than hospitalist care per se. In fact, patients seem to experience slightly better continuity when they see only hospitalists as opposed to only non‐hospitalists.
What types of systems issues might lead to this finding? Generalists in most settings could choose to involve a hospitalist at any point in the patient's hospital stay. This could occur because of a change in patient acuity requiring the involvement of hospitalists who are present in the hospital more. It is also possible that hospitalists' schedules are created to maximize inpatient continuity of care with individual hospitalists. Even though hospitalists clearly work shifts, the 7 on, 7 off model22 likely results in patients seeing the same physician each day until the switch day. This is in contrast to outpatient primary care doctors whose concentration may be on maintaining continuity within their practice.
As the field of hospital medicine was emerging, many internal medicine physicians from various specialties were concerned about the impact of hospitalists on patient care. In one study, 73% of internal medicine physicians who were not hospitalists thought that hospitalists would worsen continuity of care.23 Primary care and subspecialist internal medicine physicians also expressed the concern that hospitalists could hurt their own relationships with patients,6 presumably because of lost continuity between the inpatient and outpatient settings. However, this fear seems to diminish once hospitalist programs are implemented and primary care doctors have experience with them.23 Our study suggests that the decrease in continuity that has occurred since these studies were published is not likely due to the emergence of hospital medicine, but rather due to other factors that influence who cares for hospitalized patients.
This study had some limitations. Length of stay is an obvious mediator of number of generalist physicians seen. Therefore, the sickest patients are likely to have both a long length of stay and low continuity. We adjusted for this in the multivariable modeling. In addition, given that this study used a large database, certain details are not discernable. For example, we chose to operationalize discontinuity as visits from multiple generalists during a single hospital stay. That is not a perfect definition, but it does represent multiple physicians directing the care of a patient. Importantly, this does not appear to represent continuity with one physician with extra visits from another, as the total number of generalist visits per day did not change over time. It is also possible that patients in the non‐hospitalist group saw physicians only from a single practice, but those details are not included in the database. Finally, we cannot tell what type of hand‐offs were occurring for individual patients during each hospital stay. Despite these disadvantages, using a large database like this one allows for detection of fairly small differences that could still be clinically important.
In summary, hospitalized patients appear to experience less continuity now than 10 years ago. However, the hospitalist model does not appear to play a role in this discontinuity. It is worth exploring in more detail why patients would see both hospitalists and other generalists. This pattern is not surprising, but may have some repercussions in terms of increasing the number of hand‐offs experienced by patients. These could lead to problems with patient safety and quality of care. Future work should explore the reasons for this discontinuity and look at the relationship between inpatient discontinuity outcomes such as quality of care and the doctorpatient relationship.
Acknowledgements
The authors thank Sarah Toombs Smith, PhD, for help in preparation of the manuscript.
- .Defining and measuring interpersonal continuity of care.Ann Fam Med.2003;1(3):134–143.
- ,,.Good continuity of care may improve quality of life in Type 2 diabetes.Diabetes Res Clin Pract.2001;51(1):21–27.
- ,,,.Provider continuity in family medicine: Does it make a difference for total health care costs?Ann Fam Med.2003;1(3):144–148.
- ,,.The effect of continuity of care on emergency department use.Arch Fam Med.2000;9(4):333–338.
- ,,,,,.Physician attitudes toward and prevalence of the hospitalist model of care: Results of a national survey.Am J Med.2000;109(8):648–653.
- ,,.Physician views on caring for hospitalized patients and the hospitalist model of inpatient care.J Gen Intern Med.2001;16(2):116–119.
- ,,,,,.Systematic review: Effects of resident work hours on patient safety.Ann Intern Med.2004;141(11):851–857.
- ,,.Balancing continuity of care with residents' limited work hours: Defining the implications.Acad Med.2005;80(1):39–43.
- ,,.Understanding communication during hospitalist sevice changes: A mixed methods study.J Hosp Med.2009;4:535–540.
- ,,,Center for Safety in Emergency C. Profiles in patient safety: Emergency care transitions.Acad Emerg Med.2003;10(4):364–367.
- .Fumbled handoffs: One dropped ball after another.Ann Intern Med.2005;142(5):352–358.
- Agency for Healthcare Research and Quality. Fumbled handoff.2004. Available at: http://www.webmm.ahrq.gov/printview.aspx?caseID=55. Accessed December 27, 2005.
- ,,.Graduate medical education and patient safety: A busy—and occasionally hazardous—intersection.Ann Intern Med.2006;145(8):592–598.
- ,,,,.Does housestaff discontinuity of care increase the risk for preventable adverse events?Ann Intern Med.1994;121(11):866–872.
- ,,,.The impact of a regulation restricting medical house staff working hours on the quality of patient care.JAMA.1993;269(3):374–378.
- Centers for Medicare and Medicaid Services. Standard analytical files. Available at: http://www.cms.hhs.gov/IdentifiableDataFiles/02_Standard AnalyticalFiles.asp. Accessed March 1,2009.
- Centers for Medicare and Medicaid Services. Nonidentifiable data files: Provider of services files. Available at: http://www.cms.hhs.gov/NonIdentifiableDataFiles/04_ProviderofSerrvicesFile.asp. Accessed March 1,2009.
- Research Data Assistance Center. Medicare data file description. Available at: http://www.resdac.umn.edu/Medicare/file_descriptions.asp. Accessed March 1,2009.
- ,,,.Effect of comorbidity adjustment on CMS criteria for kidney transplant center performance.Am J Transplant.2009;9:506–516.
- ,,,,,.Continuity of outpatient and inpatient care by primary care physicians for hospitalized older adults.JAMA.2009;301:1671–1680.
- ,,,.Growth in the care of older patients by hospitalists in the United States.N Engl J Med. 2009;360:1102–1112.
- HCPro Inc.Medical Staff Leader blog.2010. Available at: http://blogs. hcpro.com/medicalstaff/2010/01/free‐form‐example‐seven‐day‐on‐seven‐day‐off‐hospitalist‐schedule/. Accessed November 20, 2010.
- ,,,.How physicians perceive hospitalist services after implementation: Anticipation vs reality.Arch Intern Med.2003;163(19):2330–2336.
Continuity of care is considered by many physicians to be of critical importance in providing high‐quality patient care. Most of the research to date has focused on continuity in outpatient primary care. Research on outpatient continuity of care has been facilitated by the fact that a number of measurement tools for outpatient continuity exist.1 Outpatient continuity of care has been linked to better quality of life scores,2 lower costs,3 and less emergency room use.4 As hospital medicine has taken on more and more of the responsibility of inpatient care, primary care doctors have voiced concerns about the impact of hospitalists on overall continuity of care5 and the quality of the doctorpatient relationship.6
Recently, continuity of care in the hospital setting has also received attention. When the Accreditation Council for Graduate Medical Education (ACGME) first proposed restrictions to resident duty hours, the importance of continuity of inpatient care began to be debated in earnest in large part because of the increase in hand‐offs which accompanies discontinuity.7, 8 A recent study of hospitalist communication documented that as many as 13% of hand‐offs at the time of service changes are judged as incomplete by the receiving physician. These incomplete hand‐offs were more likely to be associated with uncertainty regarding the plan of care, as well as perceived near misses or adverse events.9 In addition, several case reports and studies suggest that systems with less continuity may have poorer outcomes.7, 1015
Continuity in the hospital setting is likely to be important for several reasons. First, the acuity of a patient's problem during a hospitalization is likely greater than during an outpatient visit. Thus the complexity of information to be transferred between physicians during a hospital stay is correspondingly greater. Second, the diagnostic uncertainty surrounding many admissions leads to complex thought processes that may be difficult to recreate when handing off patient care to another physician. Finally, knowledge of a patient's hospital course and the likely trajectory of care is facilitated by firsthand knowledge of where the patient has been. All this information can be difficult to distill into a brief sign‐out to another physician who assumes care of the patient.
In the current study, we sought to examine the trends over time in continuity of inpatient care. We chose patients likely to be cared for by general internists: those hospitalized for chronic obstructive pulmonary disease (COPD), pneumonia, and congestive heart failure (CHF). The general internists caring for patients in the hospital could be the patient's primary care physician (PCP), a physician covering for the patient's PCP, a physician assigned at admission by the hospital, or a hospitalist. Our goals were to describe the current level of continuity of care in the hospital setting, to examine whether continuity has changed over time, and to determine factors affecting continuity of care.
Methods
We used a 5% national sample of claims data from Medicare beneficiaries for the years 19962006.16 This included Medicare enrollment files, Medicare Provider Analysis and Review (MEDPAR) files, Medicare Carrier files, and Provider of Services (POS) files.17, 18
Establishment of the Study Cohort
Hospital admissions for COPD (Diagnosis Related Group [DRG] 088), pneumonia (DRG 089, 090), and CHF (DRG 127) from 1996 to 2006 for patients older than 66 years in MEDPAR were selected (n = 781,348). We excluded admissions for patients enrolled in health maintenance organizations (HMOs) or who did not have Medicare Parts A and B for the entire year prior to admission (n = 57,558). Admissions with a length of stay >18 days (n = 10,688) were considered outliers (exceeding the 99th percentile) and were excluded. Only admissions cared for by a general internist, family physician, general practitioner, or geriatrician were included (n = 528,453).
Measures
We categorized patients by age, gender, and ethnicity using Medicare enrollment files. We used the Medicaid indicator in the Medicare file as a proxy of low socioeconomic status. We used MEDPAR files to determine the origin of the admission (via the emergency department vs other), weekend versus weekday admission, and DRG. A comorbidity score was generated using the Elixhauser comorbidity scale using inpatient and outpatient billing data.19 In analyses, we listed the total number of comorbidities identified. The specialty of each physician was determined from the codes in the Medicare Carrier files. The 2004 POS files provided hospital‐level information such as zip code, metropolitan size, state, total number of beds, type of hospital, and medical school affiliation. We divided metropolitan size and total number of hospital beds into quartiles. We categorized hospitals as nonprofit, for profit, or public; medical school affiliation was categorized as non, minor, or major.
Determination of Primary Care Physician (PCP)
We identified outpatient visits using American Medical AssociationCommon Procedure Terminology (CPT) evaluation and management codes 99201 to 99205 (new patient) and 99221 to 99215 (established patient encounters). Individual providers were differentiated by using their Unique Provider Identification Number (UPIN). We defined a PCP as a general practitioner, family physician, internist, or geriatrician. Patients had to make at least 3 visits on different days to the same PCP within a year prior to the hospitalization to be categorized as having a PCP.20
Identification of Hospitalists Versus Other Generalist Physicians
As previously described, we defined hospitalists as general internal medicine physicians who derive at least 90% of their Medicare claims for Evaluation and Management services from care provided to hospitalized patients.21 Non‐hospitalist generalist physicians were those generalists who met the criteria for generalists but did not derive at least 90% of their Medicare claims from inpatient medicine.
Definition of Inpatient Continuity of Care
We measured inpatient continuity of care by number of generalist physicians (including hospitalists) who provided care during a hospitalization, through all inpatient claims made during that hospitalization. We considered patients to have had inpatient continuity of care if all billing by generalist physicians was done by one physician during the entire hospitalization.
Statistical Analyses
We calculated the percentage of admissions that received care from 1, 2, or 3 or more generalist physicians during the hospitalization, and stratified by selected patient and hospital characteristics. These proportions were also stratified by whether the patients were cared for by their outpatient PCP or not, and whether they were cared for by hospitalists or not. Based on who cared for the patient during the hospitalization, all admissions were classified as receiving care from: 1) non‐hospitalist generalist physicians, 2) a combination of generalist physicians and hospitalists, and 3) hospitalists only. The effect of patient and hospital characteristics on whether a patient experienced inpatient continuity was evaluated using a hierarchical generalized linear model (HGLM) with a logistic link, adjusting for clustering of admissions within hospitals and all covariates. We repeated our analyses using HGLM with an ordinal logit link to explore the factors associated with number of generalists seen in the hospital. All analyses were performed with SAS version 9.1 (SAS Inc, Cary, NC). The SAS GLIMMIX procedure was used to conduct multilevel analyses.
Results
Between 1996 and 2006, 528,453 patients hospitalized for COPD, pneumonia, and CHF received care by a generalist physician during their hospital stay. Of these, 64.3% were seen by one generalist physician, 26.9% by two generalist physicians, and 8.8% by three or more generalist physicians during hospitalization.
Figure 1 shows the percentage of all patients seen by 1, 2, and 3 or more generalist physicians between 1996 and 2006. The percentage of patients receiving care from one generalist physician declined from 70.7% in 1996 to 59.4% in 2006 (P < 0.001). During the same period, the percentage of patients receiving care from 3 or more generalist physicians increased from 6.5% to 10.7% (P < 0.001). Similar trends were seen for each of the 3 conditions. There was a decrease in overall length of stay during this period, from a mean of 5.7 to 4.9 days (P < 0.001). The increase in the number of generalist physicians providing care during the hospital stay did not correspond to an increase in total number of visits during the hospitalization. The average number of daily visits from a generalist physician was 0.94 (0.30) in 1996 and 0.96 (0.35) in 2006.
Table 1 presents the percentage of patients receiving care from 1, 2, and 3 or more generalist physicians during hospitalization stratified by patient and hospital characteristics. Older adults, females, non‐Hispanic whites, those with higher socioeconomic status, and those with more comorbidities were more likely to receive care by multiple generalist physicians. There was also large variation by geographic region, metropolitan area size, and hospital characteristics. All of these differences were significant at the P < 0.0001 level.
| No. of Generalist Physicians Seen During Hospitalization | ||||
|---|---|---|---|---|
| Characteristic | N | 1 | 2 | 3 (Percentage of Patients) |
| ||||
| Age at admission | ||||
| 6674 | 152,488 | 66.4 | 25.6 | 8.0 |
| 7584 | 226,802 | 63.8 | 27.3 | 8.9 |
| 85+ | 149,163 | 63.0 | 27.7 | 9.3 |
| Gender | ||||
| Male | 216,602 | 65.3 | 26.4 | 8.3 |
| Female | 311,851 | 63.6 | 27.3 | 9.1 |
| Ethnicity | ||||
| White | 461,543 | 63.7 | 27.4 | 9.0 |
| Black | 46,960 | 68.6 | 23.8 | 7.6 |
| Other | 19,950 | 67.9 | 24.5 | 7.6 |
| Low socioeconomic status | ||||
| No | 366,392 | 63.4 | 27.5 | 9.1 |
| Yes | 162,061 | 66.3 | 25.7 | 8.0 |
| Emergency admission | ||||
| No | 188,354 | 66.8 | 25.6 | 7.6 |
| Yes | 340,099 | 62.9 | 27.7 | 9.4 |
| Weekend admission | ||||
| No | 392,150 | 65.7 | 25.8 | 8.5 |
| Yes | 136,303 | 60.1 | 30.3 | 9.6 |
| Diagnosis‐related groups | ||||
| CHF | 213,914 | 65.0 | 26.3 | 8.7 |
| Pneumonia | 195,430 | 62.5 | 28.0 | 9.5 |
| COPD | 119,109 | 66.1 | 26.2 | 7.7 |
| Had a PCP | ||||
| No | 201,016 | 66.5 | 25.4 | 8.0 |
| Yes | 327,437 | 62.9 | 27.9 | 9.2 |
| Seen hospitalist | ||||
| No | 431,784 | 67.8 | 25.1 | 7.0 |
| Yes | 96,669 | 48.5 | 34.9 | 16.6 |
| Charlson comorbidity score | ||||
| 0 | 127,385 | 64.0 | 27.2 | 8.8 |
| 1 | 131,402 | 65.1 | 26.8 | 8.1 |
| 2 | 105,831 | 64.9 | 26.6 | 8.5 |
| 3 | 163,835 | 63.4 | 27.1 | 9.5 |
| ICU use | ||||
| No | 431,462 | 65.3 | 26.5 | 8.2 |
| Yes | 96,991 | 60.1 | 28.7 | 11.2 |
| Length of stay (in days) | ||||
| Mean (SD) | 4.7 (2.9) | 5.8 (3.1) | 8.1 (3.7) | |
| Geographic region | ||||
| New England | 23,572 | 55.7 | 30.8 | 13.5 |
| Middle Atlantic | 78,181 | 60.8 | 27.8 | 11.4 |
| East North Central | 98,072 | 65.7 | 26.3 | 8.0 |
| West North Central | 44,785 | 59.6 | 30.5 | 9.9 |
| South Atlantic | 104,894 | 63.8 | 27.0 | 9.2 |
| East South Central | 51,450 | 67.8 | 24.6 | 7.6 |
| West South Central | 63,493 | 69.2 | 24.8 | 6.0 |
| Mountain | 20,310 | 61.9 | 29.4 | 8.7 |
| Pacific | 36,484 | 66.7 | 26.3 | 7.0 |
| Size of metropolitan area* | ||||
| 1,000,000 | 229,145 | 63.7 | 26.5 | 9.8 |
| 250,000999,999 | 114,448 | 61.0 | 29.2 | 9.8 |
| 100,000249,999 | 11,448 | 61.3 | 30.4 | 8.3 |
| <100,000 | 171,585 | 67.4 | 25.8 | 6.8 |
| Medical school affiliation* | ||||
| Major | 77,605 | 62.9 | 26.8 | 10.3 |
| Minor | 107,144 | 61.5 | 28.4 | 10.1 |
| Non | 341,874 | 65.5 | 26.5 | 8.0 |
| Type of hospital* | ||||
| Nonprofit | 375,888 | 62.7 | 27.8 | 9.5 |
| For profit | 63,898 | 67.5 | 25.5 | 7.0 |
| Public | 86,837 | 68.9 | 24.2 | 6.9 |
| Hospital size* | . | . | . | |
| <200 beds | 232,869 | 67.2 | 25.7 | 7.1 |
| 200349 beds | 135,954 | 62.6 | 27.9 | 9.5 |
| 350499 beds | 77,080 | 61.1 | 28.3 | 10.6 |
| 500 beds | 80,723 | 61.7 | 27.6 | 10.7 |
| Discharge location | ||||
| Home | 361,893 | 66.6 | 26.0 | 7.4 |
| SNF | 94,723 | 57.6 | 30.1 | 12.3 |
| Rehab | 3,030 | 45.7 | 34.2 | 20.1 |
| Death | 22,133 | 63.1 | 25.4 | 11.5 |
| Other | 46,674 | 61.8 | 28.1 | 10.1 |
Table 2 presents the results of a multivariable analysis of factors independently associated with experiencing continuity of care. In this analysis, continuity of care was defined as receiving inpatient care from one generalist physician (vs two or more). In the unadjusted models, the odds of experiencing continuity of care decreased by 5.5% per year from 1996 through 2006, and this decrease did not substantially change after adjusting for all other variables (4.8% yearly decrease). Younger patients, females, black patients, and those with low socioeconomic status were slightly more likely to experience continuity of care. As expected, patients admitted on weekends, emergency admissions, and those with intensive care unit (ICU) stays were less likely to experience continuity. There were marked geographic variations in continuity, with continuity approximately half as likely in New England as in the South. Continuity was greatest in smaller metropolitan areas versus rural and large metropolitan areas. Hospital size and teaching status produced only minor variation.
| Characteristic | Odds Ratio (95% CI) |
|---|---|
| |
| Admission year (increase by year) | 0.952 (0.9500.954) |
| Length of stay (increase by day) | 0.822 (0.8200.823) |
| Had a PCP | |
| No | 1.0 |
| Yes | 0.762 (0.7520.773) |
| Seen by a hospitalist | |
| No | 1.0 |
| Yes | 0.391 (0.3840.398) |
| Age | |
| 6674 | 1.0 |
| 7584 | 0.959 (0.9440.973) |
| 85+ | 0.946 (0.9300.962) |
| Gender | |
| Male | 1.0 |
| Female | 1.047 (1.0331.060) |
| Ethnicity | |
| White | 1.0 |
| Black | 1.126 (1.0971.155) |
| Other | 1.062 (1.0231.103) |
| Low socioeconomic status | |
| No | 1.0 |
| Yes | 1.036 (1.0201.051) |
| Emergency admission | |
| No | 1.0 |
| Yes | 0.864 (0.8510.878) |
| Weekend admission | |
| No | 1.0 |
| Yes | 0.778 (0.7680.789) |
| Diagnosis‐related group | |
| CHF | 1.0 |
| Pneumonia | 0.964 (0.9500.978) |
| COPD | 1.002 (0.9851.019) |
| Charlson comorbidity score | |
| 0 | 1.0 |
| 1 | 1.053 (1.0351.072) |
| 2 | 1.062 (1.0421.083) |
| 3 | 1.040 (1.0221.058) |
| ICU use | |
| No | 1.0 |
| Yes | 0.918 (0.9020.935) |
| Geographic region | |
| Middle Atlantic | 1.0 |
| New England | 0.714 (0.6210.822) |
| East North Central | 1.015 (0.9221.119) |
| West North Central | 0.791 (0.7110.879) |
| South Atlantic | 1.074 (0.9711.186) |
| East South Central | 1.250 (1.1131.403) |
| West South Central | 1.377 (1.2401.530) |
| Mountain | 0.839 (0.7400.951) |
| Pacific | 0.985 (0.8841.097) |
| Size of metropolitan area | |
| 1,000,000 | 1.0 |
| 250,000999,999 | 0.743 (0.6910.798) |
| 100,000249,999 | 0.651 (0.5380.789) |
| <100,000 | 1.062 (0.9911.138) |
| Medical school affiliation | |
| None | 1.0 |
| Minor | 0.889 (0.8270.956) |
| Major | 1.048 (0.9521.154) |
| Type of hospital | |
| Nonprofit | 1.0 |
| For profit | 1.194 (1.1061.289) |
| Public | 1.394 (1.3091.484) |
| Size of hospital | |
| <200 beds | 1.0 |
| 200349 beds | 0.918 (0.8550.986) |
| 350499 beds | 0.962 (0.8721.061) |
| 500 beds | 1.000 (0.8931.119) |
In Table 2 we also show that patients with an established PCP and those who received care from a hospitalist in the hospital were substantially less likely to experience continuity of care. There are several possible interpretations for that finding. For example, it might be that patients admitted to a hospitalist service were likely to see multiple hospitalists. Alternatively, the decreased continuity associated with hospitalists could reflect the fact that some patients cared for predominantly by non‐hospitalists may have seen a hospitalist on call for a sudden change in health status. To further explore these possible explanatory pathways, we constructed three new cohorts: 1) patients receiving all their care from non‐hospitalists, 2) patients receiving all their care from hospitalists, and 3) patients seen by both. As shown in Table 3, in patients seen by non‐hospitalists only, the mean number of generalist physicians seen during hospitalization was slightly greater than in patients cared for only by hospitalists.
| Received Care During Entire Hospitalization | No. of Admissions | Mean (SD) No. of Generalist Physicians Seen During Hospitalization |
|---|---|---|
| ||
| Non‐hospitalist physician | 431,784 | 1.41 (0.68)* |
| Hospitalist physician | 64,662 | 1.34 (0.62)* |
| Both | 32,007 | 2.55 (0.83)* |
We also tested for interactions in Table 2 between admission year and other factors. There was a significant interaction between admission year and having an identifiable PCP in the year prior to admission (Table 2). The odds of experiencing continuity of care decreased more rapidly for patients who did not have a PCP (5.5% per year; 95% CI: 5.2%5.8%) than for those who had one (4.3% per year; 95% CI: 4.1%4.6%).
Discussion
We conducted this study to better understand the degree to which hospitalized patients experience discontinuity of care within a hospital stay and to determine which patients are most likely to experience discontinuity. In our study, we specifically chose admission conditions that would likely be followed primarily by generalist physicians. We found that, over the past decade, discontinuity of care for hospitalized patients has increased substantially, as indicated by the proportion of patients taken care of by more than one generalist physician during a single hospital stay. This occurred even though overall length of stay was decreasing in this same period.
It is perhaps not surprising that inpatient continuity of care has been decreasing in the past 10 years. Outpatient practices are becoming busier, and more doctors are practicing in large group practices, which could lead to several different physicians in the same practice rounding on a hospitalized patient. We have previously demonstrated that hospitalists are caring for an increasing number of patients over this same time period,21 so another possibility is that hospitalist services are being used more often because of this heavy outpatient workload. Our analyses allowed us to test the hypothesis that having hospitalists involved in patient care increases discontinuity.
At first glance, it appears that being cared for by hospitalists may result in worse continuity of care. However, closer scrutiny of the data reveals that the discontinuity ascribed to the hospitalists in the multivariable model appears to be an artifact of defining the hospitalist variable as having been seen by any hospitalist during the hospital stay. This would include patients who saw a hospitalist in addition to their PCP or another non‐hospitalist generalist. When we compared hospitalist‐only care to other generalist care, we could not detect a difference in discontinuity. We know that generalist visits per day to patients has not substantially increased over time, so this discontinuity trend is not explained by having visits by both a hospitalist and the PCP. Therefore, this combination of findings suggests that the increased discontinuity associated with having a hospitalist involved in patient care is likely the result of system issues rather than hospitalist care per se. In fact, patients seem to experience slightly better continuity when they see only hospitalists as opposed to only non‐hospitalists.
What types of systems issues might lead to this finding? Generalists in most settings could choose to involve a hospitalist at any point in the patient's hospital stay. This could occur because of a change in patient acuity requiring the involvement of hospitalists who are present in the hospital more. It is also possible that hospitalists' schedules are created to maximize inpatient continuity of care with individual hospitalists. Even though hospitalists clearly work shifts, the 7 on, 7 off model22 likely results in patients seeing the same physician each day until the switch day. This is in contrast to outpatient primary care doctors whose concentration may be on maintaining continuity within their practice.
As the field of hospital medicine was emerging, many internal medicine physicians from various specialties were concerned about the impact of hospitalists on patient care. In one study, 73% of internal medicine physicians who were not hospitalists thought that hospitalists would worsen continuity of care.23 Primary care and subspecialist internal medicine physicians also expressed the concern that hospitalists could hurt their own relationships with patients,6 presumably because of lost continuity between the inpatient and outpatient settings. However, this fear seems to diminish once hospitalist programs are implemented and primary care doctors have experience with them.23 Our study suggests that the decrease in continuity that has occurred since these studies were published is not likely due to the emergence of hospital medicine, but rather due to other factors that influence who cares for hospitalized patients.
This study had some limitations. Length of stay is an obvious mediator of number of generalist physicians seen. Therefore, the sickest patients are likely to have both a long length of stay and low continuity. We adjusted for this in the multivariable modeling. In addition, given that this study used a large database, certain details are not discernable. For example, we chose to operationalize discontinuity as visits from multiple generalists during a single hospital stay. That is not a perfect definition, but it does represent multiple physicians directing the care of a patient. Importantly, this does not appear to represent continuity with one physician with extra visits from another, as the total number of generalist visits per day did not change over time. It is also possible that patients in the non‐hospitalist group saw physicians only from a single practice, but those details are not included in the database. Finally, we cannot tell what type of hand‐offs were occurring for individual patients during each hospital stay. Despite these disadvantages, using a large database like this one allows for detection of fairly small differences that could still be clinically important.
In summary, hospitalized patients appear to experience less continuity now than 10 years ago. However, the hospitalist model does not appear to play a role in this discontinuity. It is worth exploring in more detail why patients would see both hospitalists and other generalists. This pattern is not surprising, but may have some repercussions in terms of increasing the number of hand‐offs experienced by patients. These could lead to problems with patient safety and quality of care. Future work should explore the reasons for this discontinuity and look at the relationship between inpatient discontinuity outcomes such as quality of care and the doctorpatient relationship.
Acknowledgements
The authors thank Sarah Toombs Smith, PhD, for help in preparation of the manuscript.
- .Defining and measuring interpersonal continuity of care.Ann Fam Med.2003;1(3):134–143.
- ,,.Good continuity of care may improve quality of life in Type 2 diabetes.Diabetes Res Clin Pract.2001;51(1):21–27.
- ,,,.Provider continuity in family medicine: Does it make a difference for total health care costs?Ann Fam Med.2003;1(3):144–148.
- ,,.The effect of continuity of care on emergency department use.Arch Fam Med.2000;9(4):333–338.
- ,,,,,.Physician attitudes toward and prevalence of the hospitalist model of care: Results of a national survey.Am J Med.2000;109(8):648–653.
- ,,.Physician views on caring for hospitalized patients and the hospitalist model of inpatient care.J Gen Intern Med.2001;16(2):116–119.
- ,,,,,.Systematic review: Effects of resident work hours on patient safety.Ann Intern Med.2004;141(11):851–857.
- ,,.Balancing continuity of care with residents' limited work hours: Defining the implications.Acad Med.2005;80(1):39–43.
- ,,.Understanding communication during hospitalist sevice changes: A mixed methods study.J Hosp Med.2009;4:535–540.
- ,,,Center for Safety in Emergency C. Profiles in patient safety: Emergency care transitions.Acad Emerg Med.2003;10(4):364–367.
- .Fumbled handoffs: One dropped ball after another.Ann Intern Med.2005;142(5):352–358.
- Agency for Healthcare Research and Quality. Fumbled handoff.2004. Available at: http://www.webmm.ahrq.gov/printview.aspx?caseID=55. Accessed December 27, 2005.
- ,,.Graduate medical education and patient safety: A busy—and occasionally hazardous—intersection.Ann Intern Med.2006;145(8):592–598.
- ,,,,.Does housestaff discontinuity of care increase the risk for preventable adverse events?Ann Intern Med.1994;121(11):866–872.
- ,,,.The impact of a regulation restricting medical house staff working hours on the quality of patient care.JAMA.1993;269(3):374–378.
- Centers for Medicare and Medicaid Services. Standard analytical files. Available at: http://www.cms.hhs.gov/IdentifiableDataFiles/02_Standard AnalyticalFiles.asp. Accessed March 1,2009.
- Centers for Medicare and Medicaid Services. Nonidentifiable data files: Provider of services files. Available at: http://www.cms.hhs.gov/NonIdentifiableDataFiles/04_ProviderofSerrvicesFile.asp. Accessed March 1,2009.
- Research Data Assistance Center. Medicare data file description. Available at: http://www.resdac.umn.edu/Medicare/file_descriptions.asp. Accessed March 1,2009.
- ,,,.Effect of comorbidity adjustment on CMS criteria for kidney transplant center performance.Am J Transplant.2009;9:506–516.
- ,,,,,.Continuity of outpatient and inpatient care by primary care physicians for hospitalized older adults.JAMA.2009;301:1671–1680.
- ,,,.Growth in the care of older patients by hospitalists in the United States.N Engl J Med. 2009;360:1102–1112.
- HCPro Inc.Medical Staff Leader blog.2010. Available at: http://blogs. hcpro.com/medicalstaff/2010/01/free‐form‐example‐seven‐day‐on‐seven‐day‐off‐hospitalist‐schedule/. Accessed November 20, 2010.
- ,,,.How physicians perceive hospitalist services after implementation: Anticipation vs reality.Arch Intern Med.2003;163(19):2330–2336.
Copyright © 2011 Society of Hospital Medicine
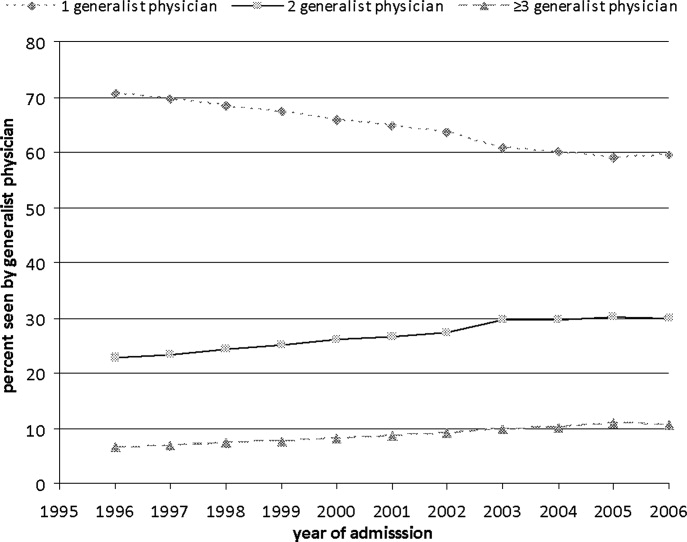
Physician Assistant‐Based General Medical Inpatient Care
In 2003 the Accreditation Council for Graduate Medical Education (ACGME) prescribed residency reform in the form of work hour restrictions without prescribing alternatives to resident based care.1 As a response, many academic medical centers have developed innovative models for providing inpatient care, some of which incorporate Physician Assistants (PAs).2 With further restrictions in resident work hours possible,3 teaching hospitals may increase use of these alternate models to provide inpatient care. Widespread implementation of such new and untested models could impact the care of the approximately 20 million hospitalizations that occur every year in US teaching hospitals.4
Few reports have compared the care delivered by these alternate models with the care provided by traditional resident‐based models of care.58 Roy et al.8 have provided the only recent comparison of a PA‐based model of care with a resident‐based model. They showed lower adjusted costs of inpatient care associated with PA based care but other outcomes were similar to resident‐based teams.
The objective of this study is to provide a valid and usable comparison of the outcomes of a hospitalist‐PA (H‐PA) model of inpatient care with the traditional resident‐based model. This will add to the quantity and quality of the limited research on PA‐based inpatient care, and informs the anticipated increase in the involvement of PAs in this arena.
Methods
Study Design and Setting
We conducted a retrospective cohort study at a 430‐bed urban academic medical center in the Midwestern United States.
Models of General Medical (GM) Inpatient Care at the Study Hospital During the Study Period
In November 2004, as a response to the ACGME‐mandated work hour regulations, we formed 2 Hospitalist‐PA teams (H‐PA) to supplement the 6 preexisting general medicine resident teams (RES).
The H‐PA and RES teams differed in staffing, admitting times and weekend/overnight cross coverage structure (Table 1). There were no predesigned differences between the teams in the ward location of their patients, availability of laboratory/radiology services, specialty consultation, social services/case management resources, nursing resources or documentation requirements for admission, daily care, and discharge.
| H‐PA Teams | RES Teams | |
|---|---|---|
| Attending physician | Always a hospitalist | Hospitalist, non‐hospitalist general internist or rarely a specialist |
| Attending physician role | Supervisory for some patients (about half) and sole care provider for others. | Supervisory for all patients |
| Team composition | One attending paired with 1 PA | Attending + senior resident + (2) interns + (2‐3) medical students |
| Rotation schedule | ||
| Attending | Every 2 weeks | Every 2 weeks |
| Physician assistant | Off on weekends | |
| House staff & medical students | Every month | |
| Weekend | No new admissions & hospitalist manages all patients | Accept new admissions |
| Admission times (weekdays) | 7 AM to 3 PM | Noon to 7 AM |
| Source of admissions | Emergency room, clinics, other hospitals | Emergency room, clinics, other hospitals |
| Number of admissions (weekdays) | 4‐6 patients per day per team | Noon to 5 PM: 2 teams admit a maximum of 9 patients total |
| 5 PM to 7 AM: 3 teams admit a maximum 5 patients each. | ||
| Overnight coverageroles and responsibilities | One in‐house faculty | 3 on call interns |
| Cross‐covering 2 H‐PA teams | Cross‐covering 2 teams each | |
| Performing triage | Admitting up to 5 patients each | |
| Admitting patients if necessary | ||
| Assisting residents if necessary | ||
| General medical consultation |
Admission Schedule for H‐PA or RES Teams
The admitting schedule was designed to decrease the workload of the house staff and to do so specifically during the periods of peak educational activity (morning report, attending‐led teaching rounds, and noon report). A faculty admitting medical officer (AMO) assigned patients strictly based on the time an admission was requested. Importantly, the request for admission preceded the time of actual admission recorded when the patient reached the ward. The time difference between request for admission and actual admission depended on the source of admission and the delay associated with assigning a patient room. The AMO assigned 8 to 12 new patients to the H‐PA teams every weekday between 7 AM and 3 PM and to the RES teams between noon and 7 AM the next day. There was a designed period of overlap from noon to 3 PM during which both H‐PA and RES teams could admit patients. This period allowed for flexibility in assigning patients to either type of team depending on their workload. The AMO did not use patient complexity or teaching value to assign patients.
Exceptions to Admission Schedule
Patients admitted overnight after the on call RES had reached their admission limits were assigned to H‐PA teams the next morning. In addition, recently discharged patients who were readmitted while the discharging hospitalist (H‐PA teams) or the discharging resident (RES teams) was still scheduled for inpatient duties, were assigned back to the discharging team irrespective of the admitting schedule.
The same medicine team cared for a patient from admission to discharge but on transfer to the intensive care unit (ICU), an intensivist led critical care team assumed care. On transfer out of the ICU these patients were assigned back to the original team irrespective of admitting schedulethe so called bounce back rule to promote inpatient continuity of care. But if the residents (RES teams) or the hospitalist (H‐PA teams) had changedthe bounce back rule was no longer in effect and these patients were assigned to a team according to the admission schedule.
Study Population and Study Period
We included all hospitalizations of adult patients to GM teams if both their date of admission and their date of discharge fell within the study period (January 1, 2005 to December 31, 2006). We excluded hospitalizations with admissions during the weekendwhen H‐PA teams did not admit patients; hospitalizations to GM services with transfer to nonGM service (excluding ICU) and hospitalizations involving comanagement with specialty servicesas the contribution of GM teams for these was variable; and hospitalizations of private patients.
Data Collection and Team Assignment
We collected patient data from our hospital's discharge abstract database. This database did not contain team information so to assign teams we matched the discharging attending and the day of discharge to the type of team that the discharging attending was leading that day.
We collected patient age, gender, race, insurance status, zip‐code, primary care provider, source of admission, ward type, time and day of admission, and time and day of discharge for use as independent variables. The time of admission captured in the database was the time of actual admission and not the time the admission was requested.
We grouped the principal diagnosis International Statistical Classification of Diseases and Related Health Problems, 9th edition (ICD‐9) codes into clinically relevant categories using the Clinical Classification Software.9 We created comorbidity measures using Healthcare Cost and Utilization Project Comorbidity Software, version 3.4.10
Outcome Measures
We used length of stay (LOS), charges, readmissions within 7, 14, and 30 days and inpatient mortality as our outcome measures. We calculated LOS by subtracting the discharge day and time from the admission day and time. The LOS included time spent in the ICU. We summed all charges accrued during the entire hospitalization including any stay in the ICU but did not include professional fees. We considered any repeat hospitalization to our hospital within 7, 14, and 30 days following a discharge to be a readmission except that we excluded readmissions for a planned procedure or for inpatient rehabilitation.
Statistical Analysis
Descriptive Analysis
We performed unadjusted descriptive statistics at the level of an individual hospitalization using medians and interquartile ranges for continuous data and frequencies and percentages for categorical data. We used chi‐square tests of association and KruskalWallis analysis of variance to compare H‐PA and RES teams.
Missing Data
Because we lacked data on whether a primary outpatient care provider was available for 284 (2.9%) of our study hospitalizations, we dropped them from our multivariable analyses. We used an arbitrary discharge time of noon for the 11 hospitalizations which did not have a discharge time recorded.
Multivariable Analysis
We used multivariable mixed models to risk adjust for a wide variety of variables. We included age, gender, race, insurance, presence of primary care physician, and total number of comorbidities as fixed effects in all models because of the high face validity of these variables. We then added admission source, ward, time, day of week, discharge day of week, and comorbidity measures one by one as fixed effects, including them only if significant at P < 0.01. For assessing LOS, charges, and readmissions, we added a variable identifying each patient as a random effect to account for multiple admissions for the same patient. We then added variables identifying attending physician, principal diagnostic group, and ZIP code of residence as random effects to account for clustering of hospitalizations within these categories, including them only if significant at P < 0.01. For the model assessing mortality we included variables for attending physician, principal diagnostic group, and ZIP code of residence as random effects if significant at P < 0.01. We log transformed LOS and charges because they were extremely skewed in nature. Readmissions were analyzed after excluding patients who died or were discharged alive within 7, 14, or 30 days of the end of the study period.
Sensitivity Analyses
To assess the influence of LOS outliers, we changed LOS to 6 hours if it was less than 6 hours, and 45 days if it was more than 45 daysa process called winsorizing. We consider winsorizing superior to dropping outliers because it acknowledges that outliers contribute information, but prevent them from being too influential. We chose the 6 hour cut off because we believed that was the minimum time required to admit and then discharge a patient. We chose the upper limit of 45 days on reviewing the frequency distribution for outliers. Similarly, we winsorized charges at the first and 99th percentile after reviewing the frequency distribution for outliers. We then log transformed the winsorized data before analysis.
Inpatient deaths reduce the LOS and charges associated with a hospitalization. Thus excess mortality may provide a false concession in terms of lower LOS or charges. To check if this occurred in our study we repeated the analyses after excluding inpatient deaths.
ICU stays are associated with higher LOS, charges, and mortality. In our model of care, some patients transferred to the ICU are not cared for by the original team on transfer out. Moreover, care in the ICU is not controlled by the team that discharges them. Since this might obscure differences in outcomes achieved by RES vs. H‐PA teams, we repeated these analyses after excluding hospitalizations with an ICU stay.
Since mortality can only occur during 1 hospitalization per patient, we repeated the mortality analysis using only each patient's first admission or last admission and using a randomly selected single admission for each patient.
Subgroup Analysis
To limit the effect of different physician characteristics on H‐PA and RES teams we separately analyzed the hospitalizations under the care of hospitalists who served on both H‐PA and RES teams.
To limit the effect of different admission schedules of H‐PA and RES teams we analyzed the hospitalizations with admission times between 11.00 AM and 4.00 PM. Such hospitalizations were likely to be assigned during the noon to 3 PM period when they could be assigned to either an H‐PA or RES team.
Interactions
Finally we explored interactions between the type of team and the fixed effect variables included in each model.
Statistical Software
We performed the statistical analysis using SAS software version 9.0 for UNIX (SAS Institute, Inc., Cary, NC) and R software (The R Project for Statistical Computing).
This study protocol was approved by the hospital's institutional review board.
Results
Study Population
Of the 52,391 hospitalizations to our hospital during the study period, 13,058 were admitted to general medicine. We excluded 3102 weekend admissions and 209 who met other exclusion criteria. We could not determine the team assignment for 66. Of the remaining 9681 hospitalizations, we assigned 2171 to H‐PA teams and 7510 to RES teams (Figure 1).

Descriptive Analysis
We compare patients assigned to H‐PA and RES teams in Table 2. They were similar in age, gender, race, having a primary care provider or not, and insurance status. Clinically, they had similar comorbidities and a similar distribution of common principal diagnoses. Consistent with their admitting schedule, H‐PA teams admitted and discharged more patients earlier in the day and admitted more patients earlier in the work week. Patients cared for by H‐PA teams were admitted from the Emergency Room (ER) less often and were more likely to reside on wards designated as nonmedicine by nursing specialty. Hospitalizations to H‐PA teams more often included an ICU stay.
| H‐PA (n = 2171) | RES (n = 7510) | P Value | |
|---|---|---|---|
| |||
| Age | |||
| Mean | 56.80 | 57.04 | |
| Median | 56 | 56 | 0.15 |
| Interquartile range | 43‐72 | 43‐73 | |
| Age group (years), n (%) | |||
| < 20 | 10 (0.5) | 57 (0.8) | |
| 20‐29 | 186 (8.6) | 632 (8.7) | |
| 30‐39 | 221 (10.2) | 766 (10.3) | |
| 40‐49 | 387 (17.8) | 1341 (18.1) | |
| 50‐59 | 434 (20.0) | 1492 (20.2) | 0.28 |
| 60‐69 | 325 (15.0) | 974 (12.8) | |
| 70‐79 | 271 (12.5) | 1035 (13.6) | |
| 80‐89 | 262 (12.0) | 951(12.3) | |
| 90< | 75 (3.5) | 262 (3.4) | |
| Female, n (%) | 1175 (54.1) | 4138 (55.1) | 0.42 |
| Race, n (%) | |||
| White | 1282 (59.1) | 4419 (58.9) | |
| Black | 793 (36.5) | 2754 (36.7) | 0.98 |
| Other | 96 (4.4) | 337 (4.5) | |
| Primary care provider, n (%) | 0.16 | ||
| Yes | 1537 (73.2) | 5451 (74.7) | |
| Missing: 284 | 71 (3.3) | 213 (2.8) | |
| Insurance status, n (%) | |||
| Commercial/worker's comp | 440 (20.3) | 1442 (19.2) | |
| Medicare | 1017 (46.8) | 3589 (47.8) | 0.52 |
| Medicaid/others | 714 (32.9) | 2479 (33.0) | |
| Time of admission, n (%) | |||
| 0000‐0259 | 167 (7.7) | 1068 (14.2) | |
| 0300‐0559 | 244 (11.2) | 485 (6.5) | |
| 0600‐0859 | 456 (21.0) | 270 (3.6) | |
| 0900‐1159 | 782 (36.0) | 1146 (15.3) | <0.001 |
| 1200‐1459 | 299 (13.8) | 1750 (23.3) | |
| 1500‐1759 | 155 (7.1) | 1676 (22.3) | |
| 1800‐2359 | 68 (3.1) | 1115 (14.9) | |
| Time of discharge, n (%) | |||
| 2100‐0859 | 36 (1.7) | 174 (2.3) | |
| 0900‐1159 | 275 (12.7) | 495 (6.6) | |
| 1200‐1459 | 858 (39.6) | 2608 (34.8) | <0.001 |
| 1500‐1759 | 749 (34.6) | 3122 (41.6) | |
| 1800‐2059 | 249 (11.5) | 1104 (14.7) | |
| Missing | 4 | 7 | |
| Day of week of admission, n (%) | |||
| Monday | 462 (21.3) | 1549 (20.6) | |
| Tuesday | 499 (23.0) | 1470 (19.6) | |
| Wednesday | 430 (19.8) | 1479 (19.7) | 0.001 |
| Thursday | 400 (18.4) | 1482 (19.7) | |
| Friday | 380 (17.5) | 1530 (20.4) | |
| Day of week of discharge, n (%) | |||
| Monday | 207 (9.5) | 829 (11.0) | |
| Tuesday | 268 (12.3) | 973 (13.0) | |
| Wednesday | 334 (15.4) | 1142 (15.2) | |
| Thursday | 362 (16.7) | 1297 (17.3) | 0.16 |
| Friday | 485 (22.3) | 1523 (20.3) | |
| Saturday | 330 (15.2) | 1165 (15.5) | |
| Sunday | 185 (8.5) | 581 (7.7) | |
| Admit to non‐medicine wards, n (%) | 1332 (61.4) | 2624 (34.9) | <0.001 |
| Transfer to ICU (at least once), n (%) | 299 (13.8) | 504 (6.7) | <0.001 |
| Admit from ER No (%) | 1663 (76.6) | 6063 (80.7) | <0.001 |
| 10 most frequent diagnosis (%) | Pneumonia (4.9) | Pneumonia (5.5) | |
| Congestive heart failure; nonhypertensive (4.2) | Congestive heart failure; nonhypertensive (3.9) | ||
| Sickle cell anemia (3.9) | Nonspecific chest pain (3.7) | ||
| Chronic obstructive pulmonary disease and Bronchiectasis (3.3) | Urinary tract infections(3.6) | ||
| Diabetes mellitus with complications (3.2) | Skin and subcutaneous tissue infections (3.3) | ||
| Urinary tract infections (3.2) | Sickle cell anemia (3.3) | ||
| Asthma (3.0) | Pancreatic disorders (not diabetes) (2.8) | ||
| Nonspecific chest pain (3.0) | Asthma (2.8) | ||
| Pancreatic disorders (not diabetes) (2.9) | Chronic obstructive pulmonary disease and Bronchiectasis (2.6) | ||
| Septicemia (2.2) | Diabetes mellitus with complications (2.6) | ||
| Average number of comorbidities mean (95% CI) | 0.39 (0.37‐0.42) | 0.38 (0.36‐0.39) | 0.23 |
In unadjusted comparisons of outcomes (Table 3), hospitalizations on H‐PA teams had higher lengths of stay and charges than hospitalizations on RES teams, possibly higher inpatient mortality rates but similar unadjusted readmission rates at 7, 14, and 30 days
| H‐PA (n = 2171) | RES (n = 7150) | % Difference* (CI) | P Value | |
|---|---|---|---|---|
| ||||
| LOS | Median (IQR) | Median (IQR) | ||
| Days | 3.17 (2.03‐5.30) | 2.99 (1.80‐5.08) | +8.9% (4.71‐13.29%) | <0.001 |
| Charges | ||||
| US Dollars | 9390 (6196‐16,239) | 9044 (6106‐14,805) | +5.56% (1.96‐9.28%) | 0.002 |
| Readmissions | n (%) | n (%) | Odds Ratio (CI) | |
| Within 7 days | 147 (6.96) | 571 (7.78) | 0.88 (0.73‐1.06) | 0.19 |
| Within14 days | 236 (11.34) | 924 (12.76) | 0.87 (0.75‐1.01) | 0.07 |
| Within 30 days | 383 (18.91) | 1436 (20.31) | 0.91 (0.80‐1.03) | 0.14 |
| Inpatient deaths | 39 (1.8) | 95 (1.3) | 1.36 (0.90‐2.00) | 0.06 |
Multivariable Analysis
LOS
Hospitalizations to H‐PA teams were associated with a 6.73% longer LOS (P = 0.005) (Table 4). This difference persisted when we used the winsorized data (6.45% increase, P = 0.006), excluded inpatient deaths (6.81% increase, P = 0.005), or excluded hospitalizations that involved an ICU stay (6.40%increase, P = 0.011) (Table 5).
| Overall | Subgroup: Restricted to Physicians Attending on Both H‐PA and RES Teams* | Subgroup: Restricted to Hospitalizations Between 11.00 AM and 4.00 PM | ||||
|---|---|---|---|---|---|---|
| % Difference (CI) | P Value | % Difference (CI) | P Value | % Difference (CI) | P Value | |
| ||||||
| LOS | 6.73% (1.99% to 11.70%) | 0.005 | 5.44% (0.65% to 11.91%) | 0.08 | 2.97% (4.47% to 10.98%) | 0.44 |
| Charges | 2.75% (1.30% to 6.97%) | 0.19 | 1.55% (3.76% to 7.16%) | 0.57 | 6.45% (0.62% to 14.03%) | 0.07 |
| Risk of Readmission | Adjusted OR (95%CI) | P Value | Adjusted OR (95% CI) | P Value | Adjusted OR (95% CI) | P Value |
| Within 7 days | 0.88 (0.64‐1.20) | 0.42 | 0.74 (0.40‐1.35) | 0.32 | 0.90 (0.40‐2.00) | 0.78 |
| Within14 days | 0.90 (0.69‐1.19) | 0.46 | 0.71 (0.51‐0.99) | 0.05 | 0.87 (0.36‐2.13) | 0.77 |
| Within 30 days | 0.89 (0.75‐1.06) | 0.20 | 0.75 (0.51‐1.08) | 0.12 | 0.92 (0.55‐1.54) | 0.75 |
| Inpatient mortality | 1.27 (0.82‐1.97) | 0.28 | 1.46 (0.67‐3.17) | 0.33 | 1.14 (0.47‐2.74) | 0.77 |
| Analysis With Winsorized Data | Analysis After Excluding Inpatient Deaths | Analysis After Excluding Patients With ICU Stays | ||||
|---|---|---|---|---|---|---|
| % Difference (CI) | P Value | % Difference (CI) | P Value | % Difference (CI) | P Value | |
| ||||||
| LOS | 6.45% (4.04 to 8.91%) | 0.006 | 6.81% (2.03 to 11.80%) | 0.005 | 6.40% (1.46 to 11.58%) | 0.011 |
| Charges | 2.67 (1.27 to 6.76%) | 0.187 | 2.89% (1.16 to 7.11%) | 0.164 | 0.74% (3.11 to 4.76%) | 0.710 |
Charges
Hospitalizations to H‐PA and RES teams were associated with similar charges (Table 4). The results were similar when we used winsorized data, excluded inpatient deaths or excluded hospitalizations involving an ICU stay (Table 5).
Readmissions
The risk of readmission at 7, 14, and 30 days was similar between hospitalizations to H‐PA and RES teams (Table 4).
Mortality
The risk of inpatient death was similar between all hospitalizations to H‐PA and RES teams or only hospitalizations without an ICU stay (Table 4). The results also remained the same in analyses restricted to first admissions, last admissions, or 1 randomly selected admission per patient.
Sub‐Group Analysis
On restricting the multivariable analyses to the subset of hospitalists who staffed both types of teams (Table 4), the increase in LOS associated with H‐PA care was no longer significant (5.44% higher, P = 0.081). The charges, risk of readmission at 7 and 30 days, and risk of inpatient mortality remained similar. The risk of readmission at 14 days was slightly lower following hospitalizations to H‐PA teams (odds ratio 0.71, 95% confidence interval [CI] 0.51‐0.99).
The increase in LOS associated with H‐PA care was further attenuated in analyses of the subset of admissions between 11.00 AM and 4.00 PM (2.97% higher, P = 0.444). The difference in charges approached significance (6.45% higher, P = 0.07), but risk of readmission at 7, 14, and 30 days and risk of inpatient mortality were no different (Table 4).
Interactions
On adding interaction terms between the team assignment and the fixed effect variables in each model we detected that the effect of H‐PA care on LOS (P < 0.001) and charges (P < 0.001) varied by time of admission (Figure 2a and b). Hospitalizations to H‐PA teams from 6.00 PM to 6.00 AM had greater relative increases in LOS as compared to hospitalizations to RES teams during those times. Similarly, hospitalizations during the period 3.00 PM to 3.00 AM had relatively higher charges associated with H‐PA care compared to RES care.
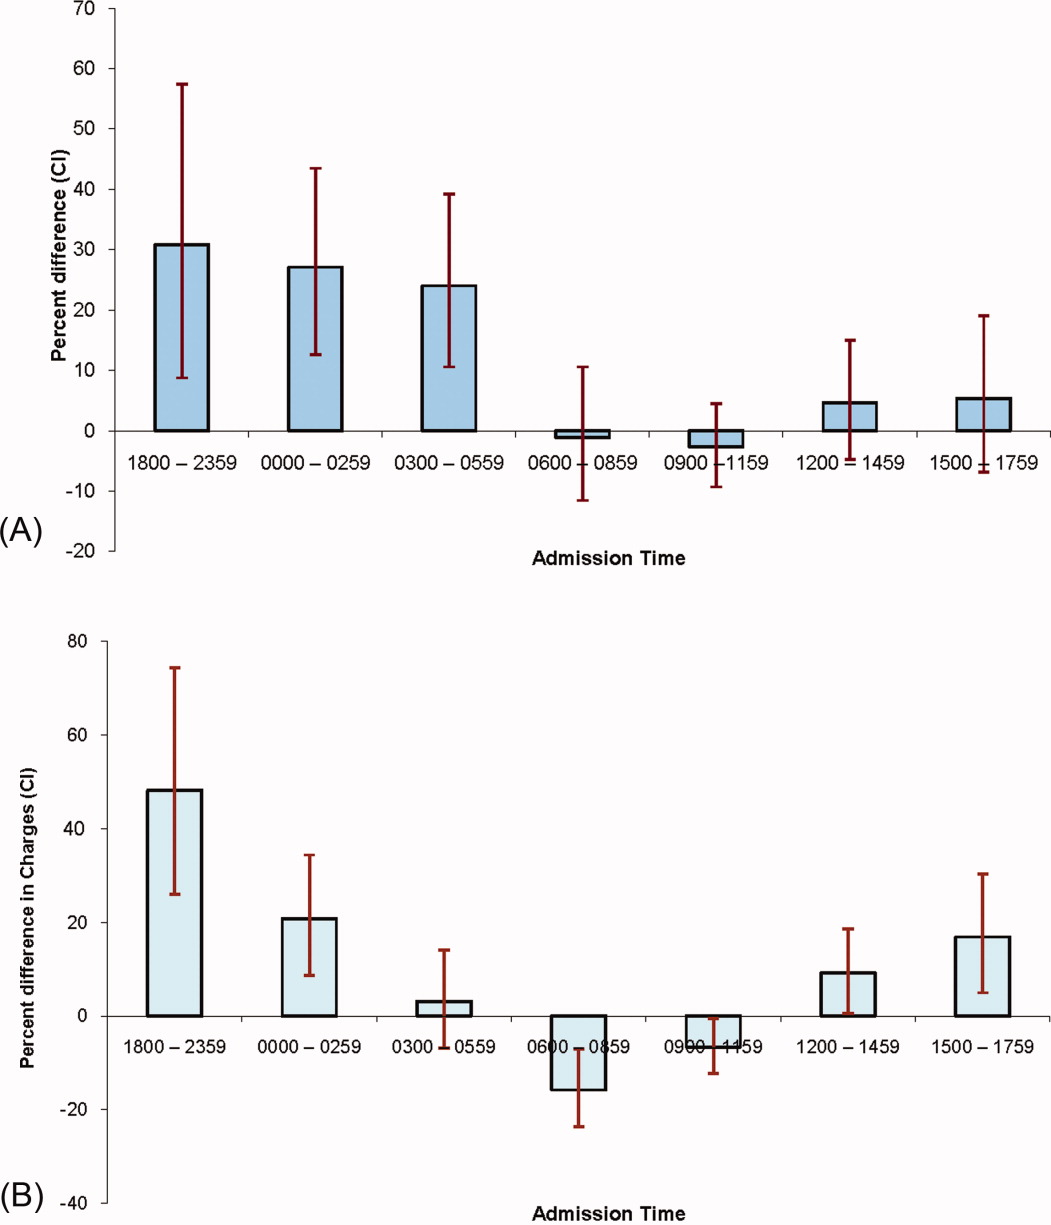
Discussion
We found that hospitalizations to our H‐PA teams had longer LOS but similar charges, readmission rates, and mortality as compared to traditional resident‐based teams. These findings were robust to multiple sensitivity and subgroup analyses but when we examined times when both types of teams could receive admissions, the difference in LOS was markedly attenuated and nonsignificant.
We note that most prior reports comparing PA‐based models of inpatient care predate the ACGME work hour regulations. In a randomized control trial (1987‐1988) Simmer et al.5 showed lower lengths of stay and charges but possibly higher risk of readmission for PA based teams as compared to resident based teams. Van Rhee et al.7 conducted a nonrandomized retrospective cohort study (1994‐1995) using administrative data which showed lower resource utilization for PA‐based inpatient care. Our results from 2005 to 2006 reflect the important changes in the organization and delivery of inpatient care since these previous investigations.
Roy et al.8 report the only previously published comparison of PA and resident based GM inpatient care after the ACGME mandated work hour regulations. They found PA‐based care was associated with lower costs, whereas we found similar charges for admissions to RES and H‐PA teams. They also found that LOS was similar for PA and resident‐based care, while we found a higher LOS for admissions to our H‐PA team. We note that although the design of Roy's study was similar to our own, patients cared for by PA‐based teams were geographically localized in their model. This may contribute to the differences in results noted between our studies.
Despite no designed differences in patients assigned to either type of team other than time of admission we noted some differences between the H‐PA and RES teams in the descriptive analysis. These differences, such as a higher proportion of hospitalizations to H‐PA teams being admitted from the ER, residing on nonmedicine wards or having an ICU stay are likely a result of our system of assigning admissions to H‐PA teams early during the workday. For example patients on H‐PA teams were more often located on nonmedicine wards as a result of later discharges and bed availability on medicine wards. The difference that deserves special comment is the much higher proportion (13.8% vs. 6.7%) of hospitalizations with an ICU stay on the H‐PA teams. Hospitalizations directly to the ICU were excluded from our study which means that the hospitalizations with an ICU stay in our study were initially admitted to either H‐PA or RES teams and then transferred to the ICU. Transfers out of the ICU usually occur early in the workday when H‐PA teams accepted patients per our admission schedule. These patients may have been preferentially assigned to H‐PA teams, if on returning from the ICU the original team's resident had changed (and the bounce back rule was not in effect). Importantly, the conclusions of our research are not altered on controlling for this difference in the teams by excluding hospitalizations with an ICU stay.
Hospitalizations to H‐PA teams were associated with higher resource utilization if they occurred later in the day or overnight (Figure 2a and b). During these times a transition of care occurred shortly after admission. For a late day admission the H‐PA teams would transfer care for overnight cross cover soon after the admission and for patients admitted overnight as overflow they would assume care of a patient from the nighttime covering physician performing the admission. On the other hand, on RES teams, interns admitting patients overnight continued to care for their patients for part of the following day (30‐hour call). Similar findings of higher resource utilization associated with transfer of care after admission in the daytime11 and nighttime12 have been previously reported. An alternative hypothesis for our findings is that the hospital maybe busier and thus less efficient during times when H‐PA teams had to admit later in the day or accept patients admitted overnight as overflow. Future research to determine the cause of this significant interaction between team assignment and time of admission on resource utilization is important as the large increases in LOS (up to 30%) and charges (up to 50%) noted, could have a potentially large impact if a higher proportion of hospitalizations were affected by this phenomenon.
Our H‐PA teams were assigned equally complex patients as our RES teams, in contrast to previous reports.8, 13 This was accomplished while improving the resident's educational experience and we have previously reported increases in our resident's board pass rates and in‐service training exam scores with that introduction of our H‐PA teams.14 We thus believe that selection of less complex patients to H‐PA teams such as ours is unnecessary and may give them a second tier status in academic settings.
Our report has limitations. It is a retrospective, nonrandomized investigation using a single institution's administrative database and has the limitations of not being able to account for unmeasured confounders, severity of illness, errors in the database, selection bias and has limited generalizability. We measured charges not actual costs,15 but we feel charges are a true reflection of relative resource use when compared between similar patients within a single institution. We also did not account for the readmissions that occur to other hospitals16 and our results do not reflect resource utilization for the healthcare system in total. For example, we could not tell if higher LOS on H‐PA teams resulted in lower readmissions for their patients in all hospitals in the region, which may reveal an overall resource savings. Additionally, we measured in‐hospital mortality and could not capture deaths related to hospital care that may occur shortly after discharge.
ACGME has proposed revised standards that may further restrict resident duty hours when they take effect in July 2011.3 This may lead to further decreases in resident‐based inpatient care. Teaching hospitals will need to continue to develop alternate models for inpatient care that do not depend on house staff. Our findings provide important evidence to inform the development of such models. Our study shows that one such model: PAs paired with hospitalists, accepting admissions early in the workday, with hospitalist coverage over the weekend and nights can care for GM inpatients as complex as those cared for by resident‐based teams without increasing readmission rates, inpatient mortality, or charges but at the cost of slightly higher LOS.
- ACGME‐Common Program Requirements for Resident Duty Hours. Available at: http://www.acgme.org/acWebsite/dutyHours/dh_ComProgrRequirmentsDutyHours0707.pdf. Accessed July 2010.
- ,,,,.Non‐housestaff medicine services in academic centers: models and challenges.J Hosp Med.2008;3(3):247–255.
- ACGME. Duty Hours: Proposed Standards for Review and comment. Available at: http://acgme‐2010standards.org/pdf/Proposed_Standards. pdf. Accessed July 22,2010.
- Agency for Health Care Policy and Research. HCUPnet: A tool for identifying, tracking, and analyzing national hospital statistics. Available at: http://hcup.ahrq.gov/HCUPnet.asp. Accessed July2010.
- ,,,,.A randomized, controlled trial of an attending staff service in general internal medicine.Med Care.1991;29(7 suppl):JS31–JS40.
- ,.Replacing an academic internal medicine residency program with a physician assistant‐‐hospitalist model: a Comparative Analysis Study.Am J Med Qual.2009;24(2):132–139.
- ,,.Resource use by physician assistant services versus teaching services.JAAPA.2002;15(1):33–42.
- ,,, et al.Implementation of a physician assistant/hospitalist service in an academic medical center: impact on efficiency and patient outcomes.J Hosp Med.2008;3(5):361–368.
- AHRQ. Clinical Classifications Software (CCS) for ICD‐9‐CM. Available at: http://www.hcup‐us.ahrq.gov/toolssoftware/ccs/ccs.jsp#overview. Accessed July2010.
- AHRQ. HCUP: Comorbidity Software, Version 3.4.;Available at: http://www.hcup‐us.ahrq.gov/toolssoftware/comorbidity/comorbidity.jsp. Accessed July2010.
- ,,, et al.Effect of short call admission on length of stay and quality of care for acute decompensated heart failure.Circulation.2008;117(20):2637–2644.
- ,,,.Post‐call transfer of resident responsibility: its effect on patient care.J Gen Intern Med.1990;5(6):501–505.
- ,,,,,.The effect of nonteaching services on the distribution of inpatient cases for internal medicine residents.Acad Med.2009:84(2):220–225.
- ,,, et al.Allowing for better resident education and improving patient care: hospitalist‐physician assistant teams fill in the gaps.J Hosp Med.2007;2[S2]:1–39.
- .The distinction between cost and charges.Ann Intern Med.1982;96(1):102–109.
- ,,.Rehospitalizations among patients in the Medicare Fee‐for‐Service Program.N Engl J Med.2009;360(14):1418–1428.
In 2003 the Accreditation Council for Graduate Medical Education (ACGME) prescribed residency reform in the form of work hour restrictions without prescribing alternatives to resident based care.1 As a response, many academic medical centers have developed innovative models for providing inpatient care, some of which incorporate Physician Assistants (PAs).2 With further restrictions in resident work hours possible,3 teaching hospitals may increase use of these alternate models to provide inpatient care. Widespread implementation of such new and untested models could impact the care of the approximately 20 million hospitalizations that occur every year in US teaching hospitals.4
Few reports have compared the care delivered by these alternate models with the care provided by traditional resident‐based models of care.58 Roy et al.8 have provided the only recent comparison of a PA‐based model of care with a resident‐based model. They showed lower adjusted costs of inpatient care associated with PA based care but other outcomes were similar to resident‐based teams.
The objective of this study is to provide a valid and usable comparison of the outcomes of a hospitalist‐PA (H‐PA) model of inpatient care with the traditional resident‐based model. This will add to the quantity and quality of the limited research on PA‐based inpatient care, and informs the anticipated increase in the involvement of PAs in this arena.
Methods
Study Design and Setting
We conducted a retrospective cohort study at a 430‐bed urban academic medical center in the Midwestern United States.
Models of General Medical (GM) Inpatient Care at the Study Hospital During the Study Period
In November 2004, as a response to the ACGME‐mandated work hour regulations, we formed 2 Hospitalist‐PA teams (H‐PA) to supplement the 6 preexisting general medicine resident teams (RES).
The H‐PA and RES teams differed in staffing, admitting times and weekend/overnight cross coverage structure (Table 1). There were no predesigned differences between the teams in the ward location of their patients, availability of laboratory/radiology services, specialty consultation, social services/case management resources, nursing resources or documentation requirements for admission, daily care, and discharge.
| H‐PA Teams | RES Teams | |
|---|---|---|
| Attending physician | Always a hospitalist | Hospitalist, non‐hospitalist general internist or rarely a specialist |
| Attending physician role | Supervisory for some patients (about half) and sole care provider for others. | Supervisory for all patients |
| Team composition | One attending paired with 1 PA | Attending + senior resident + (2) interns + (2‐3) medical students |
| Rotation schedule | ||
| Attending | Every 2 weeks | Every 2 weeks |
| Physician assistant | Off on weekends | |
| House staff & medical students | Every month | |
| Weekend | No new admissions & hospitalist manages all patients | Accept new admissions |
| Admission times (weekdays) | 7 AM to 3 PM | Noon to 7 AM |
| Source of admissions | Emergency room, clinics, other hospitals | Emergency room, clinics, other hospitals |
| Number of admissions (weekdays) | 4‐6 patients per day per team | Noon to 5 PM: 2 teams admit a maximum of 9 patients total |
| 5 PM to 7 AM: 3 teams admit a maximum 5 patients each. | ||
| Overnight coverageroles and responsibilities | One in‐house faculty | 3 on call interns |
| Cross‐covering 2 H‐PA teams | Cross‐covering 2 teams each | |
| Performing triage | Admitting up to 5 patients each | |
| Admitting patients if necessary | ||
| Assisting residents if necessary | ||
| General medical consultation |
Admission Schedule for H‐PA or RES Teams
The admitting schedule was designed to decrease the workload of the house staff and to do so specifically during the periods of peak educational activity (morning report, attending‐led teaching rounds, and noon report). A faculty admitting medical officer (AMO) assigned patients strictly based on the time an admission was requested. Importantly, the request for admission preceded the time of actual admission recorded when the patient reached the ward. The time difference between request for admission and actual admission depended on the source of admission and the delay associated with assigning a patient room. The AMO assigned 8 to 12 new patients to the H‐PA teams every weekday between 7 AM and 3 PM and to the RES teams between noon and 7 AM the next day. There was a designed period of overlap from noon to 3 PM during which both H‐PA and RES teams could admit patients. This period allowed for flexibility in assigning patients to either type of team depending on their workload. The AMO did not use patient complexity or teaching value to assign patients.
Exceptions to Admission Schedule
Patients admitted overnight after the on call RES had reached their admission limits were assigned to H‐PA teams the next morning. In addition, recently discharged patients who were readmitted while the discharging hospitalist (H‐PA teams) or the discharging resident (RES teams) was still scheduled for inpatient duties, were assigned back to the discharging team irrespective of the admitting schedule.
The same medicine team cared for a patient from admission to discharge but on transfer to the intensive care unit (ICU), an intensivist led critical care team assumed care. On transfer out of the ICU these patients were assigned back to the original team irrespective of admitting schedulethe so called bounce back rule to promote inpatient continuity of care. But if the residents (RES teams) or the hospitalist (H‐PA teams) had changedthe bounce back rule was no longer in effect and these patients were assigned to a team according to the admission schedule.
Study Population and Study Period
We included all hospitalizations of adult patients to GM teams if both their date of admission and their date of discharge fell within the study period (January 1, 2005 to December 31, 2006). We excluded hospitalizations with admissions during the weekendwhen H‐PA teams did not admit patients; hospitalizations to GM services with transfer to nonGM service (excluding ICU) and hospitalizations involving comanagement with specialty servicesas the contribution of GM teams for these was variable; and hospitalizations of private patients.
Data Collection and Team Assignment
We collected patient data from our hospital's discharge abstract database. This database did not contain team information so to assign teams we matched the discharging attending and the day of discharge to the type of team that the discharging attending was leading that day.
We collected patient age, gender, race, insurance status, zip‐code, primary care provider, source of admission, ward type, time and day of admission, and time and day of discharge for use as independent variables. The time of admission captured in the database was the time of actual admission and not the time the admission was requested.
We grouped the principal diagnosis International Statistical Classification of Diseases and Related Health Problems, 9th edition (ICD‐9) codes into clinically relevant categories using the Clinical Classification Software.9 We created comorbidity measures using Healthcare Cost and Utilization Project Comorbidity Software, version 3.4.10
Outcome Measures
We used length of stay (LOS), charges, readmissions within 7, 14, and 30 days and inpatient mortality as our outcome measures. We calculated LOS by subtracting the discharge day and time from the admission day and time. The LOS included time spent in the ICU. We summed all charges accrued during the entire hospitalization including any stay in the ICU but did not include professional fees. We considered any repeat hospitalization to our hospital within 7, 14, and 30 days following a discharge to be a readmission except that we excluded readmissions for a planned procedure or for inpatient rehabilitation.
Statistical Analysis
Descriptive Analysis
We performed unadjusted descriptive statistics at the level of an individual hospitalization using medians and interquartile ranges for continuous data and frequencies and percentages for categorical data. We used chi‐square tests of association and KruskalWallis analysis of variance to compare H‐PA and RES teams.
Missing Data
Because we lacked data on whether a primary outpatient care provider was available for 284 (2.9%) of our study hospitalizations, we dropped them from our multivariable analyses. We used an arbitrary discharge time of noon for the 11 hospitalizations which did not have a discharge time recorded.
Multivariable Analysis
We used multivariable mixed models to risk adjust for a wide variety of variables. We included age, gender, race, insurance, presence of primary care physician, and total number of comorbidities as fixed effects in all models because of the high face validity of these variables. We then added admission source, ward, time, day of week, discharge day of week, and comorbidity measures one by one as fixed effects, including them only if significant at P < 0.01. For assessing LOS, charges, and readmissions, we added a variable identifying each patient as a random effect to account for multiple admissions for the same patient. We then added variables identifying attending physician, principal diagnostic group, and ZIP code of residence as random effects to account for clustering of hospitalizations within these categories, including them only if significant at P < 0.01. For the model assessing mortality we included variables for attending physician, principal diagnostic group, and ZIP code of residence as random effects if significant at P < 0.01. We log transformed LOS and charges because they were extremely skewed in nature. Readmissions were analyzed after excluding patients who died or were discharged alive within 7, 14, or 30 days of the end of the study period.
Sensitivity Analyses
To assess the influence of LOS outliers, we changed LOS to 6 hours if it was less than 6 hours, and 45 days if it was more than 45 daysa process called winsorizing. We consider winsorizing superior to dropping outliers because it acknowledges that outliers contribute information, but prevent them from being too influential. We chose the 6 hour cut off because we believed that was the minimum time required to admit and then discharge a patient. We chose the upper limit of 45 days on reviewing the frequency distribution for outliers. Similarly, we winsorized charges at the first and 99th percentile after reviewing the frequency distribution for outliers. We then log transformed the winsorized data before analysis.
Inpatient deaths reduce the LOS and charges associated with a hospitalization. Thus excess mortality may provide a false concession in terms of lower LOS or charges. To check if this occurred in our study we repeated the analyses after excluding inpatient deaths.
ICU stays are associated with higher LOS, charges, and mortality. In our model of care, some patients transferred to the ICU are not cared for by the original team on transfer out. Moreover, care in the ICU is not controlled by the team that discharges them. Since this might obscure differences in outcomes achieved by RES vs. H‐PA teams, we repeated these analyses after excluding hospitalizations with an ICU stay.
Since mortality can only occur during 1 hospitalization per patient, we repeated the mortality analysis using only each patient's first admission or last admission and using a randomly selected single admission for each patient.
Subgroup Analysis
To limit the effect of different physician characteristics on H‐PA and RES teams we separately analyzed the hospitalizations under the care of hospitalists who served on both H‐PA and RES teams.
To limit the effect of different admission schedules of H‐PA and RES teams we analyzed the hospitalizations with admission times between 11.00 AM and 4.00 PM. Such hospitalizations were likely to be assigned during the noon to 3 PM period when they could be assigned to either an H‐PA or RES team.
Interactions
Finally we explored interactions between the type of team and the fixed effect variables included in each model.
Statistical Software
We performed the statistical analysis using SAS software version 9.0 for UNIX (SAS Institute, Inc., Cary, NC) and R software (The R Project for Statistical Computing).
This study protocol was approved by the hospital's institutional review board.
Results
Study Population
Of the 52,391 hospitalizations to our hospital during the study period, 13,058 were admitted to general medicine. We excluded 3102 weekend admissions and 209 who met other exclusion criteria. We could not determine the team assignment for 66. Of the remaining 9681 hospitalizations, we assigned 2171 to H‐PA teams and 7510 to RES teams (Figure 1).
Descriptive Analysis
We compare patients assigned to H‐PA and RES teams in Table 2. They were similar in age, gender, race, having a primary care provider or not, and insurance status. Clinically, they had similar comorbidities and a similar distribution of common principal diagnoses. Consistent with their admitting schedule, H‐PA teams admitted and discharged more patients earlier in the day and admitted more patients earlier in the work week. Patients cared for by H‐PA teams were admitted from the Emergency Room (ER) less often and were more likely to reside on wards designated as nonmedicine by nursing specialty. Hospitalizations to H‐PA teams more often included an ICU stay.
| H‐PA (n = 2171) | RES (n = 7510) | P Value | |
|---|---|---|---|
| |||
| Age | |||
| Mean | 56.80 | 57.04 | |
| Median | 56 | 56 | 0.15 |
| Interquartile range | 43‐72 | 43‐73 | |
| Age group (years), n (%) | |||
| < 20 | 10 (0.5) | 57 (0.8) | |
| 20‐29 | 186 (8.6) | 632 (8.7) | |
| 30‐39 | 221 (10.2) | 766 (10.3) | |
| 40‐49 | 387 (17.8) | 1341 (18.1) | |
| 50‐59 | 434 (20.0) | 1492 (20.2) | 0.28 |
| 60‐69 | 325 (15.0) | 974 (12.8) | |
| 70‐79 | 271 (12.5) | 1035 (13.6) | |
| 80‐89 | 262 (12.0) | 951(12.3) | |
| 90< | 75 (3.5) | 262 (3.4) | |
| Female, n (%) | 1175 (54.1) | 4138 (55.1) | 0.42 |
| Race, n (%) | |||
| White | 1282 (59.1) | 4419 (58.9) | |
| Black | 793 (36.5) | 2754 (36.7) | 0.98 |
| Other | 96 (4.4) | 337 (4.5) | |
| Primary care provider, n (%) | 0.16 | ||
| Yes | 1537 (73.2) | 5451 (74.7) | |
| Missing: 284 | 71 (3.3) | 213 (2.8) | |
| Insurance status, n (%) | |||
| Commercial/worker's comp | 440 (20.3) | 1442 (19.2) | |
| Medicare | 1017 (46.8) | 3589 (47.8) | 0.52 |
| Medicaid/others | 714 (32.9) | 2479 (33.0) | |
| Time of admission, n (%) | |||
| 0000‐0259 | 167 (7.7) | 1068 (14.2) | |
| 0300‐0559 | 244 (11.2) | 485 (6.5) | |
| 0600‐0859 | 456 (21.0) | 270 (3.6) | |
| 0900‐1159 | 782 (36.0) | 1146 (15.3) | <0.001 |
| 1200‐1459 | 299 (13.8) | 1750 (23.3) | |
| 1500‐1759 | 155 (7.1) | 1676 (22.3) | |
| 1800‐2359 | 68 (3.1) | 1115 (14.9) | |
| Time of discharge, n (%) | |||
| 2100‐0859 | 36 (1.7) | 174 (2.3) | |
| 0900‐1159 | 275 (12.7) | 495 (6.6) | |
| 1200‐1459 | 858 (39.6) | 2608 (34.8) | <0.001 |
| 1500‐1759 | 749 (34.6) | 3122 (41.6) | |
| 1800‐2059 | 249 (11.5) | 1104 (14.7) | |
| Missing | 4 | 7 | |
| Day of week of admission, n (%) | |||
| Monday | 462 (21.3) | 1549 (20.6) | |
| Tuesday | 499 (23.0) | 1470 (19.6) | |
| Wednesday | 430 (19.8) | 1479 (19.7) | 0.001 |
| Thursday | 400 (18.4) | 1482 (19.7) | |
| Friday | 380 (17.5) | 1530 (20.4) | |
| Day of week of discharge, n (%) | |||
| Monday | 207 (9.5) | 829 (11.0) | |
| Tuesday | 268 (12.3) | 973 (13.0) | |
| Wednesday | 334 (15.4) | 1142 (15.2) | |
| Thursday | 362 (16.7) | 1297 (17.3) | 0.16 |
| Friday | 485 (22.3) | 1523 (20.3) | |
| Saturday | 330 (15.2) | 1165 (15.5) | |
| Sunday | 185 (8.5) | 581 (7.7) | |
| Admit to non‐medicine wards, n (%) | 1332 (61.4) | 2624 (34.9) | <0.001 |
| Transfer to ICU (at least once), n (%) | 299 (13.8) | 504 (6.7) | <0.001 |
| Admit from ER No (%) | 1663 (76.6) | 6063 (80.7) | <0.001 |
| 10 most frequent diagnosis (%) | Pneumonia (4.9) | Pneumonia (5.5) | |
| Congestive heart failure; nonhypertensive (4.2) | Congestive heart failure; nonhypertensive (3.9) | ||
| Sickle cell anemia (3.9) | Nonspecific chest pain (3.7) | ||
| Chronic obstructive pulmonary disease and Bronchiectasis (3.3) | Urinary tract infections(3.6) | ||
| Diabetes mellitus with complications (3.2) | Skin and subcutaneous tissue infections (3.3) | ||
| Urinary tract infections (3.2) | Sickle cell anemia (3.3) | ||
| Asthma (3.0) | Pancreatic disorders (not diabetes) (2.8) | ||
| Nonspecific chest pain (3.0) | Asthma (2.8) | ||
| Pancreatic disorders (not diabetes) (2.9) | Chronic obstructive pulmonary disease and Bronchiectasis (2.6) | ||
| Septicemia (2.2) | Diabetes mellitus with complications (2.6) | ||
| Average number of comorbidities mean (95% CI) | 0.39 (0.37‐0.42) | 0.38 (0.36‐0.39) | 0.23 |
In unadjusted comparisons of outcomes (Table 3), hospitalizations on H‐PA teams had higher lengths of stay and charges than hospitalizations on RES teams, possibly higher inpatient mortality rates but similar unadjusted readmission rates at 7, 14, and 30 days
| H‐PA (n = 2171) | RES (n = 7150) | % Difference* (CI) | P Value | |
|---|---|---|---|---|
| ||||
| LOS | Median (IQR) | Median (IQR) | ||
| Days | 3.17 (2.03‐5.30) | 2.99 (1.80‐5.08) | +8.9% (4.71‐13.29%) | <0.001 |
| Charges | ||||
| US Dollars | 9390 (6196‐16,239) | 9044 (6106‐14,805) | +5.56% (1.96‐9.28%) | 0.002 |
| Readmissions | n (%) | n (%) | Odds Ratio (CI) | |
| Within 7 days | 147 (6.96) | 571 (7.78) | 0.88 (0.73‐1.06) | 0.19 |
| Within14 days | 236 (11.34) | 924 (12.76) | 0.87 (0.75‐1.01) | 0.07 |
| Within 30 days | 383 (18.91) | 1436 (20.31) | 0.91 (0.80‐1.03) | 0.14 |
| Inpatient deaths | 39 (1.8) | 95 (1.3) | 1.36 (0.90‐2.00) | 0.06 |
Multivariable Analysis
LOS
Hospitalizations to H‐PA teams were associated with a 6.73% longer LOS (P = 0.005) (Table 4). This difference persisted when we used the winsorized data (6.45% increase, P = 0.006), excluded inpatient deaths (6.81% increase, P = 0.005), or excluded hospitalizations that involved an ICU stay (6.40%increase, P = 0.011) (Table 5).
| Overall | Subgroup: Restricted to Physicians Attending on Both H‐PA and RES Teams* | Subgroup: Restricted to Hospitalizations Between 11.00 AM and 4.00 PM | ||||
|---|---|---|---|---|---|---|
| % Difference (CI) | P Value | % Difference (CI) | P Value | % Difference (CI) | P Value | |
| ||||||
| LOS | 6.73% (1.99% to 11.70%) | 0.005 | 5.44% (0.65% to 11.91%) | 0.08 | 2.97% (4.47% to 10.98%) | 0.44 |
| Charges | 2.75% (1.30% to 6.97%) | 0.19 | 1.55% (3.76% to 7.16%) | 0.57 | 6.45% (0.62% to 14.03%) | 0.07 |
| Risk of Readmission | Adjusted OR (95%CI) | P Value | Adjusted OR (95% CI) | P Value | Adjusted OR (95% CI) | P Value |
| Within 7 days | 0.88 (0.64‐1.20) | 0.42 | 0.74 (0.40‐1.35) | 0.32 | 0.90 (0.40‐2.00) | 0.78 |
| Within14 days | 0.90 (0.69‐1.19) | 0.46 | 0.71 (0.51‐0.99) | 0.05 | 0.87 (0.36‐2.13) | 0.77 |
| Within 30 days | 0.89 (0.75‐1.06) | 0.20 | 0.75 (0.51‐1.08) | 0.12 | 0.92 (0.55‐1.54) | 0.75 |
| Inpatient mortality | 1.27 (0.82‐1.97) | 0.28 | 1.46 (0.67‐3.17) | 0.33 | 1.14 (0.47‐2.74) | 0.77 |
| Analysis With Winsorized Data | Analysis After Excluding Inpatient Deaths | Analysis After Excluding Patients With ICU Stays | ||||
|---|---|---|---|---|---|---|
| % Difference (CI) | P Value | % Difference (CI) | P Value | % Difference (CI) | P Value | |
| ||||||
| LOS | 6.45% (4.04 to 8.91%) | 0.006 | 6.81% (2.03 to 11.80%) | 0.005 | 6.40% (1.46 to 11.58%) | 0.011 |
| Charges | 2.67 (1.27 to 6.76%) | 0.187 | 2.89% (1.16 to 7.11%) | 0.164 | 0.74% (3.11 to 4.76%) | 0.710 |
Charges
Hospitalizations to H‐PA and RES teams were associated with similar charges (Table 4). The results were similar when we used winsorized data, excluded inpatient deaths or excluded hospitalizations involving an ICU stay (Table 5).
Readmissions
The risk of readmission at 7, 14, and 30 days was similar between hospitalizations to H‐PA and RES teams (Table 4).
Mortality
The risk of inpatient death was similar between all hospitalizations to H‐PA and RES teams or only hospitalizations without an ICU stay (Table 4). The results also remained the same in analyses restricted to first admissions, last admissions, or 1 randomly selected admission per patient.
Sub‐Group Analysis
On restricting the multivariable analyses to the subset of hospitalists who staffed both types of teams (Table 4), the increase in LOS associated with H‐PA care was no longer significant (5.44% higher, P = 0.081). The charges, risk of readmission at 7 and 30 days, and risk of inpatient mortality remained similar. The risk of readmission at 14 days was slightly lower following hospitalizations to H‐PA teams (odds ratio 0.71, 95% confidence interval [CI] 0.51‐0.99).
The increase in LOS associated with H‐PA care was further attenuated in analyses of the subset of admissions between 11.00 AM and 4.00 PM (2.97% higher, P = 0.444). The difference in charges approached significance (6.45% higher, P = 0.07), but risk of readmission at 7, 14, and 30 days and risk of inpatient mortality were no different (Table 4).
Interactions
On adding interaction terms between the team assignment and the fixed effect variables in each model we detected that the effect of H‐PA care on LOS (P < 0.001) and charges (P < 0.001) varied by time of admission (Figure 2a and b). Hospitalizations to H‐PA teams from 6.00 PM to 6.00 AM had greater relative increases in LOS as compared to hospitalizations to RES teams during those times. Similarly, hospitalizations during the period 3.00 PM to 3.00 AM had relatively higher charges associated with H‐PA care compared to RES care.
Discussion
We found that hospitalizations to our H‐PA teams had longer LOS but similar charges, readmission rates, and mortality as compared to traditional resident‐based teams. These findings were robust to multiple sensitivity and subgroup analyses but when we examined times when both types of teams could receive admissions, the difference in LOS was markedly attenuated and nonsignificant.
We note that most prior reports comparing PA‐based models of inpatient care predate the ACGME work hour regulations. In a randomized control trial (1987‐1988) Simmer et al.5 showed lower lengths of stay and charges but possibly higher risk of readmission for PA based teams as compared to resident based teams. Van Rhee et al.7 conducted a nonrandomized retrospective cohort study (1994‐1995) using administrative data which showed lower resource utilization for PA‐based inpatient care. Our results from 2005 to 2006 reflect the important changes in the organization and delivery of inpatient care since these previous investigations.
Roy et al.8 report the only previously published comparison of PA and resident based GM inpatient care after the ACGME mandated work hour regulations. They found PA‐based care was associated with lower costs, whereas we found similar charges for admissions to RES and H‐PA teams. They also found that LOS was similar for PA and resident‐based care, while we found a higher LOS for admissions to our H‐PA team. We note that although the design of Roy's study was similar to our own, patients cared for by PA‐based teams were geographically localized in their model. This may contribute to the differences in results noted between our studies.
Despite no designed differences in patients assigned to either type of team other than time of admission we noted some differences between the H‐PA and RES teams in the descriptive analysis. These differences, such as a higher proportion of hospitalizations to H‐PA teams being admitted from the ER, residing on nonmedicine wards or having an ICU stay are likely a result of our system of assigning admissions to H‐PA teams early during the workday. For example patients on H‐PA teams were more often located on nonmedicine wards as a result of later discharges and bed availability on medicine wards. The difference that deserves special comment is the much higher proportion (13.8% vs. 6.7%) of hospitalizations with an ICU stay on the H‐PA teams. Hospitalizations directly to the ICU were excluded from our study which means that the hospitalizations with an ICU stay in our study were initially admitted to either H‐PA or RES teams and then transferred to the ICU. Transfers out of the ICU usually occur early in the workday when H‐PA teams accepted patients per our admission schedule. These patients may have been preferentially assigned to H‐PA teams, if on returning from the ICU the original team's resident had changed (and the bounce back rule was not in effect). Importantly, the conclusions of our research are not altered on controlling for this difference in the teams by excluding hospitalizations with an ICU stay.
Hospitalizations to H‐PA teams were associated with higher resource utilization if they occurred later in the day or overnight (Figure 2a and b). During these times a transition of care occurred shortly after admission. For a late day admission the H‐PA teams would transfer care for overnight cross cover soon after the admission and for patients admitted overnight as overflow they would assume care of a patient from the nighttime covering physician performing the admission. On the other hand, on RES teams, interns admitting patients overnight continued to care for their patients for part of the following day (30‐hour call). Similar findings of higher resource utilization associated with transfer of care after admission in the daytime11 and nighttime12 have been previously reported. An alternative hypothesis for our findings is that the hospital maybe busier and thus less efficient during times when H‐PA teams had to admit later in the day or accept patients admitted overnight as overflow. Future research to determine the cause of this significant interaction between team assignment and time of admission on resource utilization is important as the large increases in LOS (up to 30%) and charges (up to 50%) noted, could have a potentially large impact if a higher proportion of hospitalizations were affected by this phenomenon.
Our H‐PA teams were assigned equally complex patients as our RES teams, in contrast to previous reports.8, 13 This was accomplished while improving the resident's educational experience and we have previously reported increases in our resident's board pass rates and in‐service training exam scores with that introduction of our H‐PA teams.14 We thus believe that selection of less complex patients to H‐PA teams such as ours is unnecessary and may give them a second tier status in academic settings.
Our report has limitations. It is a retrospective, nonrandomized investigation using a single institution's administrative database and has the limitations of not being able to account for unmeasured confounders, severity of illness, errors in the database, selection bias and has limited generalizability. We measured charges not actual costs,15 but we feel charges are a true reflection of relative resource use when compared between similar patients within a single institution. We also did not account for the readmissions that occur to other hospitals16 and our results do not reflect resource utilization for the healthcare system in total. For example, we could not tell if higher LOS on H‐PA teams resulted in lower readmissions for their patients in all hospitals in the region, which may reveal an overall resource savings. Additionally, we measured in‐hospital mortality and could not capture deaths related to hospital care that may occur shortly after discharge.
ACGME has proposed revised standards that may further restrict resident duty hours when they take effect in July 2011.3 This may lead to further decreases in resident‐based inpatient care. Teaching hospitals will need to continue to develop alternate models for inpatient care that do not depend on house staff. Our findings provide important evidence to inform the development of such models. Our study shows that one such model: PAs paired with hospitalists, accepting admissions early in the workday, with hospitalist coverage over the weekend and nights can care for GM inpatients as complex as those cared for by resident‐based teams without increasing readmission rates, inpatient mortality, or charges but at the cost of slightly higher LOS.
- ACGME‐Common Program Requirements for Resident Duty Hours. Available at: http://www.acgme.org/acWebsite/dutyHours/dh_ComProgrRequirmentsDutyHours0707.pdf. Accessed July 2010.
- ,,,,.Non‐housestaff medicine services in academic centers: models and challenges.J Hosp Med.2008;3(3):247–255.
- ACGME. Duty Hours: Proposed Standards for Review and comment. Available at: http://acgme‐2010standards.org/pdf/Proposed_Standards. pdf. Accessed July 22,2010.
- Agency for Health Care Policy and Research. HCUPnet: A tool for identifying, tracking, and analyzing national hospital statistics. Available at: http://hcup.ahrq.gov/HCUPnet.asp. Accessed July2010.
- ,,,,.A randomized, controlled trial of an attending staff service in general internal medicine.Med Care.1991;29(7 suppl):JS31–JS40.
- ,.Replacing an academic internal medicine residency program with a physician assistant‐‐hospitalist model: a Comparative Analysis Study.Am J Med Qual.2009;24(2):132–139.
- ,,.Resource use by physician assistant services versus teaching services.JAAPA.2002;15(1):33–42.
- ,,, et al.Implementation of a physician assistant/hospitalist service in an academic medical center: impact on efficiency and patient outcomes.J Hosp Med.2008;3(5):361–368.
- AHRQ. Clinical Classifications Software (CCS) for ICD‐9‐CM. Available at: http://www.hcup‐us.ahrq.gov/toolssoftware/ccs/ccs.jsp#overview. Accessed July2010.
- AHRQ. HCUP: Comorbidity Software, Version 3.4.;Available at: http://www.hcup‐us.ahrq.gov/toolssoftware/comorbidity/comorbidity.jsp. Accessed July2010.
- ,,, et al.Effect of short call admission on length of stay and quality of care for acute decompensated heart failure.Circulation.2008;117(20):2637–2644.
- ,,,.Post‐call transfer of resident responsibility: its effect on patient care.J Gen Intern Med.1990;5(6):501–505.
- ,,,,,.The effect of nonteaching services on the distribution of inpatient cases for internal medicine residents.Acad Med.2009:84(2):220–225.
- ,,, et al.Allowing for better resident education and improving patient care: hospitalist‐physician assistant teams fill in the gaps.J Hosp Med.2007;2[S2]:1–39.
- .The distinction between cost and charges.Ann Intern Med.1982;96(1):102–109.
- ,,.Rehospitalizations among patients in the Medicare Fee‐for‐Service Program.N Engl J Med.2009;360(14):1418–1428.
Copyright © 2011 Society of Hospital Medicine