User login
Trends in Inpatient Continuity of Care
Continuity of care is considered by many physicians to be of critical importance in providing high‐quality patient care. Most of the research to date has focused on continuity in outpatient primary care. Research on outpatient continuity of care has been facilitated by the fact that a number of measurement tools for outpatient continuity exist.1 Outpatient continuity of care has been linked to better quality of life scores,2 lower costs,3 and less emergency room use.4 As hospital medicine has taken on more and more of the responsibility of inpatient care, primary care doctors have voiced concerns about the impact of hospitalists on overall continuity of care5 and the quality of the doctorpatient relationship.6
Recently, continuity of care in the hospital setting has also received attention. When the Accreditation Council for Graduate Medical Education (ACGME) first proposed restrictions to resident duty hours, the importance of continuity of inpatient care began to be debated in earnest in large part because of the increase in hand‐offs which accompanies discontinuity.7, 8 A recent study of hospitalist communication documented that as many as 13% of hand‐offs at the time of service changes are judged as incomplete by the receiving physician. These incomplete hand‐offs were more likely to be associated with uncertainty regarding the plan of care, as well as perceived near misses or adverse events.9 In addition, several case reports and studies suggest that systems with less continuity may have poorer outcomes.7, 1015
Continuity in the hospital setting is likely to be important for several reasons. First, the acuity of a patient's problem during a hospitalization is likely greater than during an outpatient visit. Thus the complexity of information to be transferred between physicians during a hospital stay is correspondingly greater. Second, the diagnostic uncertainty surrounding many admissions leads to complex thought processes that may be difficult to recreate when handing off patient care to another physician. Finally, knowledge of a patient's hospital course and the likely trajectory of care is facilitated by firsthand knowledge of where the patient has been. All this information can be difficult to distill into a brief sign‐out to another physician who assumes care of the patient.
In the current study, we sought to examine the trends over time in continuity of inpatient care. We chose patients likely to be cared for by general internists: those hospitalized for chronic obstructive pulmonary disease (COPD), pneumonia, and congestive heart failure (CHF). The general internists caring for patients in the hospital could be the patient's primary care physician (PCP), a physician covering for the patient's PCP, a physician assigned at admission by the hospital, or a hospitalist. Our goals were to describe the current level of continuity of care in the hospital setting, to examine whether continuity has changed over time, and to determine factors affecting continuity of care.
Methods
We used a 5% national sample of claims data from Medicare beneficiaries for the years 19962006.16 This included Medicare enrollment files, Medicare Provider Analysis and Review (MEDPAR) files, Medicare Carrier files, and Provider of Services (POS) files.17, 18
Establishment of the Study Cohort
Hospital admissions for COPD (Diagnosis Related Group [DRG] 088), pneumonia (DRG 089, 090), and CHF (DRG 127) from 1996 to 2006 for patients older than 66 years in MEDPAR were selected (n = 781,348). We excluded admissions for patients enrolled in health maintenance organizations (HMOs) or who did not have Medicare Parts A and B for the entire year prior to admission (n = 57,558). Admissions with a length of stay >18 days (n = 10,688) were considered outliers (exceeding the 99th percentile) and were excluded. Only admissions cared for by a general internist, family physician, general practitioner, or geriatrician were included (n = 528,453).
Measures
We categorized patients by age, gender, and ethnicity using Medicare enrollment files. We used the Medicaid indicator in the Medicare file as a proxy of low socioeconomic status. We used MEDPAR files to determine the origin of the admission (via the emergency department vs other), weekend versus weekday admission, and DRG. A comorbidity score was generated using the Elixhauser comorbidity scale using inpatient and outpatient billing data.19 In analyses, we listed the total number of comorbidities identified. The specialty of each physician was determined from the codes in the Medicare Carrier files. The 2004 POS files provided hospital‐level information such as zip code, metropolitan size, state, total number of beds, type of hospital, and medical school affiliation. We divided metropolitan size and total number of hospital beds into quartiles. We categorized hospitals as nonprofit, for profit, or public; medical school affiliation was categorized as non, minor, or major.
Determination of Primary Care Physician (PCP)
We identified outpatient visits using American Medical AssociationCommon Procedure Terminology (CPT) evaluation and management codes 99201 to 99205 (new patient) and 99221 to 99215 (established patient encounters). Individual providers were differentiated by using their Unique Provider Identification Number (UPIN). We defined a PCP as a general practitioner, family physician, internist, or geriatrician. Patients had to make at least 3 visits on different days to the same PCP within a year prior to the hospitalization to be categorized as having a PCP.20
Identification of Hospitalists Versus Other Generalist Physicians
As previously described, we defined hospitalists as general internal medicine physicians who derive at least 90% of their Medicare claims for Evaluation and Management services from care provided to hospitalized patients.21 Non‐hospitalist generalist physicians were those generalists who met the criteria for generalists but did not derive at least 90% of their Medicare claims from inpatient medicine.
Definition of Inpatient Continuity of Care
We measured inpatient continuity of care by number of generalist physicians (including hospitalists) who provided care during a hospitalization, through all inpatient claims made during that hospitalization. We considered patients to have had inpatient continuity of care if all billing by generalist physicians was done by one physician during the entire hospitalization.
Statistical Analyses
We calculated the percentage of admissions that received care from 1, 2, or 3 or more generalist physicians during the hospitalization, and stratified by selected patient and hospital characteristics. These proportions were also stratified by whether the patients were cared for by their outpatient PCP or not, and whether they were cared for by hospitalists or not. Based on who cared for the patient during the hospitalization, all admissions were classified as receiving care from: 1) non‐hospitalist generalist physicians, 2) a combination of generalist physicians and hospitalists, and 3) hospitalists only. The effect of patient and hospital characteristics on whether a patient experienced inpatient continuity was evaluated using a hierarchical generalized linear model (HGLM) with a logistic link, adjusting for clustering of admissions within hospitals and all covariates. We repeated our analyses using HGLM with an ordinal logit link to explore the factors associated with number of generalists seen in the hospital. All analyses were performed with SAS version 9.1 (SAS Inc, Cary, NC). The SAS GLIMMIX procedure was used to conduct multilevel analyses.
Results
Between 1996 and 2006, 528,453 patients hospitalized for COPD, pneumonia, and CHF received care by a generalist physician during their hospital stay. Of these, 64.3% were seen by one generalist physician, 26.9% by two generalist physicians, and 8.8% by three or more generalist physicians during hospitalization.
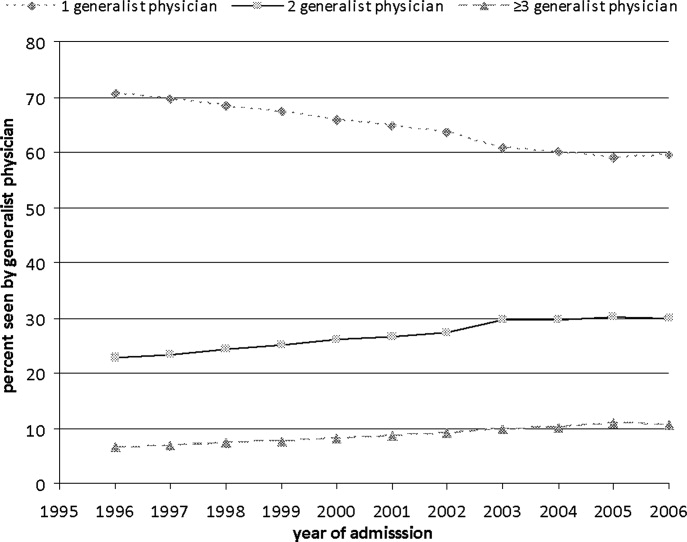
Figure 1 shows the percentage of all patients seen by 1, 2, and 3 or more generalist physicians between 1996 and 2006. The percentage of patients receiving care from one generalist physician declined from 70.7% in 1996 to 59.4% in 2006 (P < 0.001). During the same period, the percentage of patients receiving care from 3 or more generalist physicians increased from 6.5% to 10.7% (P < 0.001). Similar trends were seen for each of the 3 conditions. There was a decrease in overall length of stay during this period, from a mean of 5.7 to 4.9 days (P < 0.001). The increase in the number of generalist physicians providing care during the hospital stay did not correspond to an increase in total number of visits during the hospitalization. The average number of daily visits from a generalist physician was 0.94 (0.30) in 1996 and 0.96 (0.35) in 2006.

Table 1 presents the percentage of patients receiving care from 1, 2, and 3 or more generalist physicians during hospitalization stratified by patient and hospital characteristics. Older adults, females, non‐Hispanic whites, those with higher socioeconomic status, and those with more comorbidities were more likely to receive care by multiple generalist physicians. There was also large variation by geographic region, metropolitan area size, and hospital characteristics. All of these differences were significant at the P < 0.0001 level.
| No. of Generalist Physicians Seen During Hospitalization | ||||
|---|---|---|---|---|
| Characteristic | N | 1 | 2 | 3 (Percentage of Patients) |
| ||||
| Age at admission | ||||
| 6674 | 152,488 | 66.4 | 25.6 | 8.0 |
| 7584 | 226,802 | 63.8 | 27.3 | 8.9 |
| 85+ | 149,163 | 63.0 | 27.7 | 9.3 |
| Gender | ||||
| Male | 216,602 | 65.3 | 26.4 | 8.3 |
| Female | 311,851 | 63.6 | 27.3 | 9.1 |
| Ethnicity | ||||
| White | 461,543 | 63.7 | 27.4 | 9.0 |
| Black | 46,960 | 68.6 | 23.8 | 7.6 |
| Other | 19,950 | 67.9 | 24.5 | 7.6 |
| Low socioeconomic status | ||||
| No | 366,392 | 63.4 | 27.5 | 9.1 |
| Yes | 162,061 | 66.3 | 25.7 | 8.0 |
| Emergency admission | ||||
| No | 188,354 | 66.8 | 25.6 | 7.6 |
| Yes | 340,099 | 62.9 | 27.7 | 9.4 |
| Weekend admission | ||||
| No | 392,150 | 65.7 | 25.8 | 8.5 |
| Yes | 136,303 | 60.1 | 30.3 | 9.6 |
| Diagnosis‐related groups | ||||
| CHF | 213,914 | 65.0 | 26.3 | 8.7 |
| Pneumonia | 195,430 | 62.5 | 28.0 | 9.5 |
| COPD | 119,109 | 66.1 | 26.2 | 7.7 |
| Had a PCP | ||||
| No | 201,016 | 66.5 | 25.4 | 8.0 |
| Yes | 327,437 | 62.9 | 27.9 | 9.2 |
| Seen hospitalist | ||||
| No | 431,784 | 67.8 | 25.1 | 7.0 |
| Yes | 96,669 | 48.5 | 34.9 | 16.6 |
| Charlson comorbidity score | ||||
| 0 | 127,385 | 64.0 | 27.2 | 8.8 |
| 1 | 131,402 | 65.1 | 26.8 | 8.1 |
| 2 | 105,831 | 64.9 | 26.6 | 8.5 |
| 3 | 163,835 | 63.4 | 27.1 | 9.5 |
| ICU use | ||||
| No | 431,462 | 65.3 | 26.5 | 8.2 |
| Yes | 96,991 | 60.1 | 28.7 | 11.2 |
| Length of stay (in days) | ||||
| Mean (SD) | 4.7 (2.9) | 5.8 (3.1) | 8.1 (3.7) | |
| Geographic region | ||||
| New England | 23,572 | 55.7 | 30.8 | 13.5 |
| Middle Atlantic | 78,181 | 60.8 | 27.8 | 11.4 |
| East North Central | 98,072 | 65.7 | 26.3 | 8.0 |
| West North Central | 44,785 | 59.6 | 30.5 | 9.9 |
| South Atlantic | 104,894 | 63.8 | 27.0 | 9.2 |
| East South Central | 51,450 | 67.8 | 24.6 | 7.6 |
| West South Central | 63,493 | 69.2 | 24.8 | 6.0 |
| Mountain | 20,310 | 61.9 | 29.4 | 8.7 |
| Pacific | 36,484 | 66.7 | 26.3 | 7.0 |
| Size of metropolitan area* | ||||
| 1,000,000 | 229,145 | 63.7 | 26.5 | 9.8 |
| 250,000999,999 | 114,448 | 61.0 | 29.2 | 9.8 |
| 100,000249,999 | 11,448 | 61.3 | 30.4 | 8.3 |
| <100,000 | 171,585 | 67.4 | 25.8 | 6.8 |
| Medical school affiliation* | ||||
| Major | 77,605 | 62.9 | 26.8 | 10.3 |
| Minor | 107,144 | 61.5 | 28.4 | 10.1 |
| Non | 341,874 | 65.5 | 26.5 | 8.0 |
| Type of hospital* | ||||
| Nonprofit | 375,888 | 62.7 | 27.8 | 9.5 |
| For profit | 63,898 | 67.5 | 25.5 | 7.0 |
| Public | 86,837 | 68.9 | 24.2 | 6.9 |
| Hospital size* | . | . | . | |
| <200 beds | 232,869 | 67.2 | 25.7 | 7.1 |
| 200349 beds | 135,954 | 62.6 | 27.9 | 9.5 |
| 350499 beds | 77,080 | 61.1 | 28.3 | 10.6 |
| 500 beds | 80,723 | 61.7 | 27.6 | 10.7 |
| Discharge location | ||||
| Home | 361,893 | 66.6 | 26.0 | 7.4 |
| SNF | 94,723 | 57.6 | 30.1 | 12.3 |
| Rehab | 3,030 | 45.7 | 34.2 | 20.1 |
| Death | 22,133 | 63.1 | 25.4 | 11.5 |
| Other | 46,674 | 61.8 | 28.1 | 10.1 |
Table 2 presents the results of a multivariable analysis of factors independently associated with experiencing continuity of care. In this analysis, continuity of care was defined as receiving inpatient care from one generalist physician (vs two or more). In the unadjusted models, the odds of experiencing continuity of care decreased by 5.5% per year from 1996 through 2006, and this decrease did not substantially change after adjusting for all other variables (4.8% yearly decrease). Younger patients, females, black patients, and those with low socioeconomic status were slightly more likely to experience continuity of care. As expected, patients admitted on weekends, emergency admissions, and those with intensive care unit (ICU) stays were less likely to experience continuity. There were marked geographic variations in continuity, with continuity approximately half as likely in New England as in the South. Continuity was greatest in smaller metropolitan areas versus rural and large metropolitan areas. Hospital size and teaching status produced only minor variation.
| Characteristic | Odds Ratio (95% CI) |
|---|---|
| |
| Admission year (increase by year) | 0.952 (0.9500.954) |
| Length of stay (increase by day) | 0.822 (0.8200.823) |
| Had a PCP | |
| No | 1.0 |
| Yes | 0.762 (0.7520.773) |
| Seen by a hospitalist | |
| No | 1.0 |
| Yes | 0.391 (0.3840.398) |
| Age | |
| 6674 | 1.0 |
| 7584 | 0.959 (0.9440.973) |
| 85+ | 0.946 (0.9300.962) |
| Gender | |
| Male | 1.0 |
| Female | 1.047 (1.0331.060) |
| Ethnicity | |
| White | 1.0 |
| Black | 1.126 (1.0971.155) |
| Other | 1.062 (1.0231.103) |
| Low socioeconomic status | |
| No | 1.0 |
| Yes | 1.036 (1.0201.051) |
| Emergency admission | |
| No | 1.0 |
| Yes | 0.864 (0.8510.878) |
| Weekend admission | |
| No | 1.0 |
| Yes | 0.778 (0.7680.789) |
| Diagnosis‐related group | |
| CHF | 1.0 |
| Pneumonia | 0.964 (0.9500.978) |
| COPD | 1.002 (0.9851.019) |
| Charlson comorbidity score | |
| 0 | 1.0 |
| 1 | 1.053 (1.0351.072) |
| 2 | 1.062 (1.0421.083) |
| 3 | 1.040 (1.0221.058) |
| ICU use | |
| No | 1.0 |
| Yes | 0.918 (0.9020.935) |
| Geographic region | |
| Middle Atlantic | 1.0 |
| New England | 0.714 (0.6210.822) |
| East North Central | 1.015 (0.9221.119) |
| West North Central | 0.791 (0.7110.879) |
| South Atlantic | 1.074 (0.9711.186) |
| East South Central | 1.250 (1.1131.403) |
| West South Central | 1.377 (1.2401.530) |
| Mountain | 0.839 (0.7400.951) |
| Pacific | 0.985 (0.8841.097) |
| Size of metropolitan area | |
| 1,000,000 | 1.0 |
| 250,000999,999 | 0.743 (0.6910.798) |
| 100,000249,999 | 0.651 (0.5380.789) |
| <100,000 | 1.062 (0.9911.138) |
| Medical school affiliation | |
| None | 1.0 |
| Minor | 0.889 (0.8270.956) |
| Major | 1.048 (0.9521.154) |
| Type of hospital | |
| Nonprofit | 1.0 |
| For profit | 1.194 (1.1061.289) |
| Public | 1.394 (1.3091.484) |
| Size of hospital | |
| <200 beds | 1.0 |
| 200349 beds | 0.918 (0.8550.986) |
| 350499 beds | 0.962 (0.8721.061) |
| 500 beds | 1.000 (0.8931.119) |
In Table 2 we also show that patients with an established PCP and those who received care from a hospitalist in the hospital were substantially less likely to experience continuity of care. There are several possible interpretations for that finding. For example, it might be that patients admitted to a hospitalist service were likely to see multiple hospitalists. Alternatively, the decreased continuity associated with hospitalists could reflect the fact that some patients cared for predominantly by non‐hospitalists may have seen a hospitalist on call for a sudden change in health status. To further explore these possible explanatory pathways, we constructed three new cohorts: 1) patients receiving all their care from non‐hospitalists, 2) patients receiving all their care from hospitalists, and 3) patients seen by both. As shown in Table 3, in patients seen by non‐hospitalists only, the mean number of generalist physicians seen during hospitalization was slightly greater than in patients cared for only by hospitalists.
| Received Care During Entire Hospitalization | No. of Admissions | Mean (SD) No. of Generalist Physicians Seen During Hospitalization |
|---|---|---|
| ||
| Non‐hospitalist physician | 431,784 | 1.41 (0.68)* |
| Hospitalist physician | 64,662 | 1.34 (0.62)* |
| Both | 32,007 | 2.55 (0.83)* |
We also tested for interactions in Table 2 between admission year and other factors. There was a significant interaction between admission year and having an identifiable PCP in the year prior to admission (Table 2). The odds of experiencing continuity of care decreased more rapidly for patients who did not have a PCP (5.5% per year; 95% CI: 5.2%5.8%) than for those who had one (4.3% per year; 95% CI: 4.1%4.6%).
Discussion
We conducted this study to better understand the degree to which hospitalized patients experience discontinuity of care within a hospital stay and to determine which patients are most likely to experience discontinuity. In our study, we specifically chose admission conditions that would likely be followed primarily by generalist physicians. We found that, over the past decade, discontinuity of care for hospitalized patients has increased substantially, as indicated by the proportion of patients taken care of by more than one generalist physician during a single hospital stay. This occurred even though overall length of stay was decreasing in this same period.
It is perhaps not surprising that inpatient continuity of care has been decreasing in the past 10 years. Outpatient practices are becoming busier, and more doctors are practicing in large group practices, which could lead to several different physicians in the same practice rounding on a hospitalized patient. We have previously demonstrated that hospitalists are caring for an increasing number of patients over this same time period,21 so another possibility is that hospitalist services are being used more often because of this heavy outpatient workload. Our analyses allowed us to test the hypothesis that having hospitalists involved in patient care increases discontinuity.
At first glance, it appears that being cared for by hospitalists may result in worse continuity of care. However, closer scrutiny of the data reveals that the discontinuity ascribed to the hospitalists in the multivariable model appears to be an artifact of defining the hospitalist variable as having been seen by any hospitalist during the hospital stay. This would include patients who saw a hospitalist in addition to their PCP or another non‐hospitalist generalist. When we compared hospitalist‐only care to other generalist care, we could not detect a difference in discontinuity. We know that generalist visits per day to patients has not substantially increased over time, so this discontinuity trend is not explained by having visits by both a hospitalist and the PCP. Therefore, this combination of findings suggests that the increased discontinuity associated with having a hospitalist involved in patient care is likely the result of system issues rather than hospitalist care per se. In fact, patients seem to experience slightly better continuity when they see only hospitalists as opposed to only non‐hospitalists.
What types of systems issues might lead to this finding? Generalists in most settings could choose to involve a hospitalist at any point in the patient's hospital stay. This could occur because of a change in patient acuity requiring the involvement of hospitalists who are present in the hospital more. It is also possible that hospitalists' schedules are created to maximize inpatient continuity of care with individual hospitalists. Even though hospitalists clearly work shifts, the 7 on, 7 off model22 likely results in patients seeing the same physician each day until the switch day. This is in contrast to outpatient primary care doctors whose concentration may be on maintaining continuity within their practice.
As the field of hospital medicine was emerging, many internal medicine physicians from various specialties were concerned about the impact of hospitalists on patient care. In one study, 73% of internal medicine physicians who were not hospitalists thought that hospitalists would worsen continuity of care.23 Primary care and subspecialist internal medicine physicians also expressed the concern that hospitalists could hurt their own relationships with patients,6 presumably because of lost continuity between the inpatient and outpatient settings. However, this fear seems to diminish once hospitalist programs are implemented and primary care doctors have experience with them.23 Our study suggests that the decrease in continuity that has occurred since these studies were published is not likely due to the emergence of hospital medicine, but rather due to other factors that influence who cares for hospitalized patients.
This study had some limitations. Length of stay is an obvious mediator of number of generalist physicians seen. Therefore, the sickest patients are likely to have both a long length of stay and low continuity. We adjusted for this in the multivariable modeling. In addition, given that this study used a large database, certain details are not discernable. For example, we chose to operationalize discontinuity as visits from multiple generalists during a single hospital stay. That is not a perfect definition, but it does represent multiple physicians directing the care of a patient. Importantly, this does not appear to represent continuity with one physician with extra visits from another, as the total number of generalist visits per day did not change over time. It is also possible that patients in the non‐hospitalist group saw physicians only from a single practice, but those details are not included in the database. Finally, we cannot tell what type of hand‐offs were occurring for individual patients during each hospital stay. Despite these disadvantages, using a large database like this one allows for detection of fairly small differences that could still be clinically important.
In summary, hospitalized patients appear to experience less continuity now than 10 years ago. However, the hospitalist model does not appear to play a role in this discontinuity. It is worth exploring in more detail why patients would see both hospitalists and other generalists. This pattern is not surprising, but may have some repercussions in terms of increasing the number of hand‐offs experienced by patients. These could lead to problems with patient safety and quality of care. Future work should explore the reasons for this discontinuity and look at the relationship between inpatient discontinuity outcomes such as quality of care and the doctorpatient relationship.
Acknowledgements
The authors thank Sarah Toombs Smith, PhD, for help in preparation of the manuscript.
- .Defining and measuring interpersonal continuity of care.Ann Fam Med.2003;1(3):134–143.
- ,,.Good continuity of care may improve quality of life in Type 2 diabetes.Diabetes Res Clin Pract.2001;51(1):21–27.
- ,,,.Provider continuity in family medicine: Does it make a difference for total health care costs?Ann Fam Med.2003;1(3):144–148.
- ,,.The effect of continuity of care on emergency department use.Arch Fam Med.2000;9(4):333–338.
- ,,,,,.Physician attitudes toward and prevalence of the hospitalist model of care: Results of a national survey.Am J Med.2000;109(8):648–653.
- ,,.Physician views on caring for hospitalized patients and the hospitalist model of inpatient care.J Gen Intern Med.2001;16(2):116–119.
- ,,,,,.Systematic review: Effects of resident work hours on patient safety.Ann Intern Med.2004;141(11):851–857.
- ,,.Balancing continuity of care with residents' limited work hours: Defining the implications.Acad Med.2005;80(1):39–43.
- ,,.Understanding communication during hospitalist sevice changes: A mixed methods study.J Hosp Med.2009;4:535–540.
- ,,,Center for Safety in Emergency C. Profiles in patient safety: Emergency care transitions.Acad Emerg Med.2003;10(4):364–367.
- .Fumbled handoffs: One dropped ball after another.Ann Intern Med.2005;142(5):352–358.
- Agency for Healthcare Research and Quality. Fumbled handoff.2004. Available at: http://www.webmm.ahrq.gov/printview.aspx?caseID=55. Accessed December 27, 2005.
- ,,.Graduate medical education and patient safety: A busy—and occasionally hazardous—intersection.Ann Intern Med.2006;145(8):592–598.
- ,,,,.Does housestaff discontinuity of care increase the risk for preventable adverse events?Ann Intern Med.1994;121(11):866–872.
- ,,,.The impact of a regulation restricting medical house staff working hours on the quality of patient care.JAMA.1993;269(3):374–378.
- Centers for Medicare and Medicaid Services. Standard analytical files. Available at: http://www.cms.hhs.gov/IdentifiableDataFiles/02_Standard AnalyticalFiles.asp. Accessed March 1,2009.
- Centers for Medicare and Medicaid Services. Nonidentifiable data files: Provider of services files. Available at: http://www.cms.hhs.gov/NonIdentifiableDataFiles/04_ProviderofSerrvicesFile.asp. Accessed March 1,2009.
- Research Data Assistance Center. Medicare data file description. Available at: http://www.resdac.umn.edu/Medicare/file_descriptions.asp. Accessed March 1,2009.
- ,,,.Effect of comorbidity adjustment on CMS criteria for kidney transplant center performance.Am J Transplant.2009;9:506–516.
- ,,,,,.Continuity of outpatient and inpatient care by primary care physicians for hospitalized older adults.JAMA.2009;301:1671–1680.
- ,,,.Growth in the care of older patients by hospitalists in the United States.N Engl J Med. 2009;360:1102–1112.
- HCPro Inc.Medical Staff Leader blog.2010. Available at: http://blogs. hcpro.com/medicalstaff/2010/01/free‐form‐example‐seven‐day‐on‐seven‐day‐off‐hospitalist‐schedule/. Accessed November 20, 2010.
- ,,,.How physicians perceive hospitalist services after implementation: Anticipation vs reality.Arch Intern Med.2003;163(19):2330–2336.
Continuity of care is considered by many physicians to be of critical importance in providing high‐quality patient care. Most of the research to date has focused on continuity in outpatient primary care. Research on outpatient continuity of care has been facilitated by the fact that a number of measurement tools for outpatient continuity exist.1 Outpatient continuity of care has been linked to better quality of life scores,2 lower costs,3 and less emergency room use.4 As hospital medicine has taken on more and more of the responsibility of inpatient care, primary care doctors have voiced concerns about the impact of hospitalists on overall continuity of care5 and the quality of the doctorpatient relationship.6
Recently, continuity of care in the hospital setting has also received attention. When the Accreditation Council for Graduate Medical Education (ACGME) first proposed restrictions to resident duty hours, the importance of continuity of inpatient care began to be debated in earnest in large part because of the increase in hand‐offs which accompanies discontinuity.7, 8 A recent study of hospitalist communication documented that as many as 13% of hand‐offs at the time of service changes are judged as incomplete by the receiving physician. These incomplete hand‐offs were more likely to be associated with uncertainty regarding the plan of care, as well as perceived near misses or adverse events.9 In addition, several case reports and studies suggest that systems with less continuity may have poorer outcomes.7, 1015
Continuity in the hospital setting is likely to be important for several reasons. First, the acuity of a patient's problem during a hospitalization is likely greater than during an outpatient visit. Thus the complexity of information to be transferred between physicians during a hospital stay is correspondingly greater. Second, the diagnostic uncertainty surrounding many admissions leads to complex thought processes that may be difficult to recreate when handing off patient care to another physician. Finally, knowledge of a patient's hospital course and the likely trajectory of care is facilitated by firsthand knowledge of where the patient has been. All this information can be difficult to distill into a brief sign‐out to another physician who assumes care of the patient.
In the current study, we sought to examine the trends over time in continuity of inpatient care. We chose patients likely to be cared for by general internists: those hospitalized for chronic obstructive pulmonary disease (COPD), pneumonia, and congestive heart failure (CHF). The general internists caring for patients in the hospital could be the patient's primary care physician (PCP), a physician covering for the patient's PCP, a physician assigned at admission by the hospital, or a hospitalist. Our goals were to describe the current level of continuity of care in the hospital setting, to examine whether continuity has changed over time, and to determine factors affecting continuity of care.
Methods
We used a 5% national sample of claims data from Medicare beneficiaries for the years 19962006.16 This included Medicare enrollment files, Medicare Provider Analysis and Review (MEDPAR) files, Medicare Carrier files, and Provider of Services (POS) files.17, 18
Establishment of the Study Cohort
Hospital admissions for COPD (Diagnosis Related Group [DRG] 088), pneumonia (DRG 089, 090), and CHF (DRG 127) from 1996 to 2006 for patients older than 66 years in MEDPAR were selected (n = 781,348). We excluded admissions for patients enrolled in health maintenance organizations (HMOs) or who did not have Medicare Parts A and B for the entire year prior to admission (n = 57,558). Admissions with a length of stay >18 days (n = 10,688) were considered outliers (exceeding the 99th percentile) and were excluded. Only admissions cared for by a general internist, family physician, general practitioner, or geriatrician were included (n = 528,453).
Measures
We categorized patients by age, gender, and ethnicity using Medicare enrollment files. We used the Medicaid indicator in the Medicare file as a proxy of low socioeconomic status. We used MEDPAR files to determine the origin of the admission (via the emergency department vs other), weekend versus weekday admission, and DRG. A comorbidity score was generated using the Elixhauser comorbidity scale using inpatient and outpatient billing data.19 In analyses, we listed the total number of comorbidities identified. The specialty of each physician was determined from the codes in the Medicare Carrier files. The 2004 POS files provided hospital‐level information such as zip code, metropolitan size, state, total number of beds, type of hospital, and medical school affiliation. We divided metropolitan size and total number of hospital beds into quartiles. We categorized hospitals as nonprofit, for profit, or public; medical school affiliation was categorized as non, minor, or major.
Determination of Primary Care Physician (PCP)
We identified outpatient visits using American Medical AssociationCommon Procedure Terminology (CPT) evaluation and management codes 99201 to 99205 (new patient) and 99221 to 99215 (established patient encounters). Individual providers were differentiated by using their Unique Provider Identification Number (UPIN). We defined a PCP as a general practitioner, family physician, internist, or geriatrician. Patients had to make at least 3 visits on different days to the same PCP within a year prior to the hospitalization to be categorized as having a PCP.20
Identification of Hospitalists Versus Other Generalist Physicians
As previously described, we defined hospitalists as general internal medicine physicians who derive at least 90% of their Medicare claims for Evaluation and Management services from care provided to hospitalized patients.21 Non‐hospitalist generalist physicians were those generalists who met the criteria for generalists but did not derive at least 90% of their Medicare claims from inpatient medicine.
Definition of Inpatient Continuity of Care
We measured inpatient continuity of care by number of generalist physicians (including hospitalists) who provided care during a hospitalization, through all inpatient claims made during that hospitalization. We considered patients to have had inpatient continuity of care if all billing by generalist physicians was done by one physician during the entire hospitalization.
Statistical Analyses
We calculated the percentage of admissions that received care from 1, 2, or 3 or more generalist physicians during the hospitalization, and stratified by selected patient and hospital characteristics. These proportions were also stratified by whether the patients were cared for by their outpatient PCP or not, and whether they were cared for by hospitalists or not. Based on who cared for the patient during the hospitalization, all admissions were classified as receiving care from: 1) non‐hospitalist generalist physicians, 2) a combination of generalist physicians and hospitalists, and 3) hospitalists only. The effect of patient and hospital characteristics on whether a patient experienced inpatient continuity was evaluated using a hierarchical generalized linear model (HGLM) with a logistic link, adjusting for clustering of admissions within hospitals and all covariates. We repeated our analyses using HGLM with an ordinal logit link to explore the factors associated with number of generalists seen in the hospital. All analyses were performed with SAS version 9.1 (SAS Inc, Cary, NC). The SAS GLIMMIX procedure was used to conduct multilevel analyses.
Results
Between 1996 and 2006, 528,453 patients hospitalized for COPD, pneumonia, and CHF received care by a generalist physician during their hospital stay. Of these, 64.3% were seen by one generalist physician, 26.9% by two generalist physicians, and 8.8% by three or more generalist physicians during hospitalization.
Figure 1 shows the percentage of all patients seen by 1, 2, and 3 or more generalist physicians between 1996 and 2006. The percentage of patients receiving care from one generalist physician declined from 70.7% in 1996 to 59.4% in 2006 (P < 0.001). During the same period, the percentage of patients receiving care from 3 or more generalist physicians increased from 6.5% to 10.7% (P < 0.001). Similar trends were seen for each of the 3 conditions. There was a decrease in overall length of stay during this period, from a mean of 5.7 to 4.9 days (P < 0.001). The increase in the number of generalist physicians providing care during the hospital stay did not correspond to an increase in total number of visits during the hospitalization. The average number of daily visits from a generalist physician was 0.94 (0.30) in 1996 and 0.96 (0.35) in 2006.
Table 1 presents the percentage of patients receiving care from 1, 2, and 3 or more generalist physicians during hospitalization stratified by patient and hospital characteristics. Older adults, females, non‐Hispanic whites, those with higher socioeconomic status, and those with more comorbidities were more likely to receive care by multiple generalist physicians. There was also large variation by geographic region, metropolitan area size, and hospital characteristics. All of these differences were significant at the P < 0.0001 level.
| No. of Generalist Physicians Seen During Hospitalization | ||||
|---|---|---|---|---|
| Characteristic | N | 1 | 2 | 3 (Percentage of Patients) |
| ||||
| Age at admission | ||||
| 6674 | 152,488 | 66.4 | 25.6 | 8.0 |
| 7584 | 226,802 | 63.8 | 27.3 | 8.9 |
| 85+ | 149,163 | 63.0 | 27.7 | 9.3 |
| Gender | ||||
| Male | 216,602 | 65.3 | 26.4 | 8.3 |
| Female | 311,851 | 63.6 | 27.3 | 9.1 |
| Ethnicity | ||||
| White | 461,543 | 63.7 | 27.4 | 9.0 |
| Black | 46,960 | 68.6 | 23.8 | 7.6 |
| Other | 19,950 | 67.9 | 24.5 | 7.6 |
| Low socioeconomic status | ||||
| No | 366,392 | 63.4 | 27.5 | 9.1 |
| Yes | 162,061 | 66.3 | 25.7 | 8.0 |
| Emergency admission | ||||
| No | 188,354 | 66.8 | 25.6 | 7.6 |
| Yes | 340,099 | 62.9 | 27.7 | 9.4 |
| Weekend admission | ||||
| No | 392,150 | 65.7 | 25.8 | 8.5 |
| Yes | 136,303 | 60.1 | 30.3 | 9.6 |
| Diagnosis‐related groups | ||||
| CHF | 213,914 | 65.0 | 26.3 | 8.7 |
| Pneumonia | 195,430 | 62.5 | 28.0 | 9.5 |
| COPD | 119,109 | 66.1 | 26.2 | 7.7 |
| Had a PCP | ||||
| No | 201,016 | 66.5 | 25.4 | 8.0 |
| Yes | 327,437 | 62.9 | 27.9 | 9.2 |
| Seen hospitalist | ||||
| No | 431,784 | 67.8 | 25.1 | 7.0 |
| Yes | 96,669 | 48.5 | 34.9 | 16.6 |
| Charlson comorbidity score | ||||
| 0 | 127,385 | 64.0 | 27.2 | 8.8 |
| 1 | 131,402 | 65.1 | 26.8 | 8.1 |
| 2 | 105,831 | 64.9 | 26.6 | 8.5 |
| 3 | 163,835 | 63.4 | 27.1 | 9.5 |
| ICU use | ||||
| No | 431,462 | 65.3 | 26.5 | 8.2 |
| Yes | 96,991 | 60.1 | 28.7 | 11.2 |
| Length of stay (in days) | ||||
| Mean (SD) | 4.7 (2.9) | 5.8 (3.1) | 8.1 (3.7) | |
| Geographic region | ||||
| New England | 23,572 | 55.7 | 30.8 | 13.5 |
| Middle Atlantic | 78,181 | 60.8 | 27.8 | 11.4 |
| East North Central | 98,072 | 65.7 | 26.3 | 8.0 |
| West North Central | 44,785 | 59.6 | 30.5 | 9.9 |
| South Atlantic | 104,894 | 63.8 | 27.0 | 9.2 |
| East South Central | 51,450 | 67.8 | 24.6 | 7.6 |
| West South Central | 63,493 | 69.2 | 24.8 | 6.0 |
| Mountain | 20,310 | 61.9 | 29.4 | 8.7 |
| Pacific | 36,484 | 66.7 | 26.3 | 7.0 |
| Size of metropolitan area* | ||||
| 1,000,000 | 229,145 | 63.7 | 26.5 | 9.8 |
| 250,000999,999 | 114,448 | 61.0 | 29.2 | 9.8 |
| 100,000249,999 | 11,448 | 61.3 | 30.4 | 8.3 |
| <100,000 | 171,585 | 67.4 | 25.8 | 6.8 |
| Medical school affiliation* | ||||
| Major | 77,605 | 62.9 | 26.8 | 10.3 |
| Minor | 107,144 | 61.5 | 28.4 | 10.1 |
| Non | 341,874 | 65.5 | 26.5 | 8.0 |
| Type of hospital* | ||||
| Nonprofit | 375,888 | 62.7 | 27.8 | 9.5 |
| For profit | 63,898 | 67.5 | 25.5 | 7.0 |
| Public | 86,837 | 68.9 | 24.2 | 6.9 |
| Hospital size* | . | . | . | |
| <200 beds | 232,869 | 67.2 | 25.7 | 7.1 |
| 200349 beds | 135,954 | 62.6 | 27.9 | 9.5 |
| 350499 beds | 77,080 | 61.1 | 28.3 | 10.6 |
| 500 beds | 80,723 | 61.7 | 27.6 | 10.7 |
| Discharge location | ||||
| Home | 361,893 | 66.6 | 26.0 | 7.4 |
| SNF | 94,723 | 57.6 | 30.1 | 12.3 |
| Rehab | 3,030 | 45.7 | 34.2 | 20.1 |
| Death | 22,133 | 63.1 | 25.4 | 11.5 |
| Other | 46,674 | 61.8 | 28.1 | 10.1 |
Table 2 presents the results of a multivariable analysis of factors independently associated with experiencing continuity of care. In this analysis, continuity of care was defined as receiving inpatient care from one generalist physician (vs two or more). In the unadjusted models, the odds of experiencing continuity of care decreased by 5.5% per year from 1996 through 2006, and this decrease did not substantially change after adjusting for all other variables (4.8% yearly decrease). Younger patients, females, black patients, and those with low socioeconomic status were slightly more likely to experience continuity of care. As expected, patients admitted on weekends, emergency admissions, and those with intensive care unit (ICU) stays were less likely to experience continuity. There were marked geographic variations in continuity, with continuity approximately half as likely in New England as in the South. Continuity was greatest in smaller metropolitan areas versus rural and large metropolitan areas. Hospital size and teaching status produced only minor variation.
| Characteristic | Odds Ratio (95% CI) |
|---|---|
| |
| Admission year (increase by year) | 0.952 (0.9500.954) |
| Length of stay (increase by day) | 0.822 (0.8200.823) |
| Had a PCP | |
| No | 1.0 |
| Yes | 0.762 (0.7520.773) |
| Seen by a hospitalist | |
| No | 1.0 |
| Yes | 0.391 (0.3840.398) |
| Age | |
| 6674 | 1.0 |
| 7584 | 0.959 (0.9440.973) |
| 85+ | 0.946 (0.9300.962) |
| Gender | |
| Male | 1.0 |
| Female | 1.047 (1.0331.060) |
| Ethnicity | |
| White | 1.0 |
| Black | 1.126 (1.0971.155) |
| Other | 1.062 (1.0231.103) |
| Low socioeconomic status | |
| No | 1.0 |
| Yes | 1.036 (1.0201.051) |
| Emergency admission | |
| No | 1.0 |
| Yes | 0.864 (0.8510.878) |
| Weekend admission | |
| No | 1.0 |
| Yes | 0.778 (0.7680.789) |
| Diagnosis‐related group | |
| CHF | 1.0 |
| Pneumonia | 0.964 (0.9500.978) |
| COPD | 1.002 (0.9851.019) |
| Charlson comorbidity score | |
| 0 | 1.0 |
| 1 | 1.053 (1.0351.072) |
| 2 | 1.062 (1.0421.083) |
| 3 | 1.040 (1.0221.058) |
| ICU use | |
| No | 1.0 |
| Yes | 0.918 (0.9020.935) |
| Geographic region | |
| Middle Atlantic | 1.0 |
| New England | 0.714 (0.6210.822) |
| East North Central | 1.015 (0.9221.119) |
| West North Central | 0.791 (0.7110.879) |
| South Atlantic | 1.074 (0.9711.186) |
| East South Central | 1.250 (1.1131.403) |
| West South Central | 1.377 (1.2401.530) |
| Mountain | 0.839 (0.7400.951) |
| Pacific | 0.985 (0.8841.097) |
| Size of metropolitan area | |
| 1,000,000 | 1.0 |
| 250,000999,999 | 0.743 (0.6910.798) |
| 100,000249,999 | 0.651 (0.5380.789) |
| <100,000 | 1.062 (0.9911.138) |
| Medical school affiliation | |
| None | 1.0 |
| Minor | 0.889 (0.8270.956) |
| Major | 1.048 (0.9521.154) |
| Type of hospital | |
| Nonprofit | 1.0 |
| For profit | 1.194 (1.1061.289) |
| Public | 1.394 (1.3091.484) |
| Size of hospital | |
| <200 beds | 1.0 |
| 200349 beds | 0.918 (0.8550.986) |
| 350499 beds | 0.962 (0.8721.061) |
| 500 beds | 1.000 (0.8931.119) |
In Table 2 we also show that patients with an established PCP and those who received care from a hospitalist in the hospital were substantially less likely to experience continuity of care. There are several possible interpretations for that finding. For example, it might be that patients admitted to a hospitalist service were likely to see multiple hospitalists. Alternatively, the decreased continuity associated with hospitalists could reflect the fact that some patients cared for predominantly by non‐hospitalists may have seen a hospitalist on call for a sudden change in health status. To further explore these possible explanatory pathways, we constructed three new cohorts: 1) patients receiving all their care from non‐hospitalists, 2) patients receiving all their care from hospitalists, and 3) patients seen by both. As shown in Table 3, in patients seen by non‐hospitalists only, the mean number of generalist physicians seen during hospitalization was slightly greater than in patients cared for only by hospitalists.
| Received Care During Entire Hospitalization | No. of Admissions | Mean (SD) No. of Generalist Physicians Seen During Hospitalization |
|---|---|---|
| ||
| Non‐hospitalist physician | 431,784 | 1.41 (0.68)* |
| Hospitalist physician | 64,662 | 1.34 (0.62)* |
| Both | 32,007 | 2.55 (0.83)* |
We also tested for interactions in Table 2 between admission year and other factors. There was a significant interaction between admission year and having an identifiable PCP in the year prior to admission (Table 2). The odds of experiencing continuity of care decreased more rapidly for patients who did not have a PCP (5.5% per year; 95% CI: 5.2%5.8%) than for those who had one (4.3% per year; 95% CI: 4.1%4.6%).
Discussion
We conducted this study to better understand the degree to which hospitalized patients experience discontinuity of care within a hospital stay and to determine which patients are most likely to experience discontinuity. In our study, we specifically chose admission conditions that would likely be followed primarily by generalist physicians. We found that, over the past decade, discontinuity of care for hospitalized patients has increased substantially, as indicated by the proportion of patients taken care of by more than one generalist physician during a single hospital stay. This occurred even though overall length of stay was decreasing in this same period.
It is perhaps not surprising that inpatient continuity of care has been decreasing in the past 10 years. Outpatient practices are becoming busier, and more doctors are practicing in large group practices, which could lead to several different physicians in the same practice rounding on a hospitalized patient. We have previously demonstrated that hospitalists are caring for an increasing number of patients over this same time period,21 so another possibility is that hospitalist services are being used more often because of this heavy outpatient workload. Our analyses allowed us to test the hypothesis that having hospitalists involved in patient care increases discontinuity.
At first glance, it appears that being cared for by hospitalists may result in worse continuity of care. However, closer scrutiny of the data reveals that the discontinuity ascribed to the hospitalists in the multivariable model appears to be an artifact of defining the hospitalist variable as having been seen by any hospitalist during the hospital stay. This would include patients who saw a hospitalist in addition to their PCP or another non‐hospitalist generalist. When we compared hospitalist‐only care to other generalist care, we could not detect a difference in discontinuity. We know that generalist visits per day to patients has not substantially increased over time, so this discontinuity trend is not explained by having visits by both a hospitalist and the PCP. Therefore, this combination of findings suggests that the increased discontinuity associated with having a hospitalist involved in patient care is likely the result of system issues rather than hospitalist care per se. In fact, patients seem to experience slightly better continuity when they see only hospitalists as opposed to only non‐hospitalists.
What types of systems issues might lead to this finding? Generalists in most settings could choose to involve a hospitalist at any point in the patient's hospital stay. This could occur because of a change in patient acuity requiring the involvement of hospitalists who are present in the hospital more. It is also possible that hospitalists' schedules are created to maximize inpatient continuity of care with individual hospitalists. Even though hospitalists clearly work shifts, the 7 on, 7 off model22 likely results in patients seeing the same physician each day until the switch day. This is in contrast to outpatient primary care doctors whose concentration may be on maintaining continuity within their practice.
As the field of hospital medicine was emerging, many internal medicine physicians from various specialties were concerned about the impact of hospitalists on patient care. In one study, 73% of internal medicine physicians who were not hospitalists thought that hospitalists would worsen continuity of care.23 Primary care and subspecialist internal medicine physicians also expressed the concern that hospitalists could hurt their own relationships with patients,6 presumably because of lost continuity between the inpatient and outpatient settings. However, this fear seems to diminish once hospitalist programs are implemented and primary care doctors have experience with them.23 Our study suggests that the decrease in continuity that has occurred since these studies were published is not likely due to the emergence of hospital medicine, but rather due to other factors that influence who cares for hospitalized patients.
This study had some limitations. Length of stay is an obvious mediator of number of generalist physicians seen. Therefore, the sickest patients are likely to have both a long length of stay and low continuity. We adjusted for this in the multivariable modeling. In addition, given that this study used a large database, certain details are not discernable. For example, we chose to operationalize discontinuity as visits from multiple generalists during a single hospital stay. That is not a perfect definition, but it does represent multiple physicians directing the care of a patient. Importantly, this does not appear to represent continuity with one physician with extra visits from another, as the total number of generalist visits per day did not change over time. It is also possible that patients in the non‐hospitalist group saw physicians only from a single practice, but those details are not included in the database. Finally, we cannot tell what type of hand‐offs were occurring for individual patients during each hospital stay. Despite these disadvantages, using a large database like this one allows for detection of fairly small differences that could still be clinically important.
In summary, hospitalized patients appear to experience less continuity now than 10 years ago. However, the hospitalist model does not appear to play a role in this discontinuity. It is worth exploring in more detail why patients would see both hospitalists and other generalists. This pattern is not surprising, but may have some repercussions in terms of increasing the number of hand‐offs experienced by patients. These could lead to problems with patient safety and quality of care. Future work should explore the reasons for this discontinuity and look at the relationship between inpatient discontinuity outcomes such as quality of care and the doctorpatient relationship.
Acknowledgements
The authors thank Sarah Toombs Smith, PhD, for help in preparation of the manuscript.
- .Defining and measuring interpersonal continuity of care.Ann Fam Med.2003;1(3):134–143.
- ,,.Good continuity of care may improve quality of life in Type 2 diabetes.Diabetes Res Clin Pract.2001;51(1):21–27.
- ,,,.Provider continuity in family medicine: Does it make a difference for total health care costs?Ann Fam Med.2003;1(3):144–148.
- ,,.The effect of continuity of care on emergency department use.Arch Fam Med.2000;9(4):333–338.
- ,,,,,.Physician attitudes toward and prevalence of the hospitalist model of care: Results of a national survey.Am J Med.2000;109(8):648–653.
- ,,.Physician views on caring for hospitalized patients and the hospitalist model of inpatient care.J Gen Intern Med.2001;16(2):116–119.
- ,,,,,.Systematic review: Effects of resident work hours on patient safety.Ann Intern Med.2004;141(11):851–857.
- ,,.Balancing continuity of care with residents' limited work hours: Defining the implications.Acad Med.2005;80(1):39–43.
- ,,.Understanding communication during hospitalist sevice changes: A mixed methods study.J Hosp Med.2009;4:535–540.
- ,,,Center for Safety in Emergency C. Profiles in patient safety: Emergency care transitions.Acad Emerg Med.2003;10(4):364–367.
- .Fumbled handoffs: One dropped ball after another.Ann Intern Med.2005;142(5):352–358.
- Agency for Healthcare Research and Quality. Fumbled handoff.2004. Available at: http://www.webmm.ahrq.gov/printview.aspx?caseID=55. Accessed December 27, 2005.
- ,,.Graduate medical education and patient safety: A busy—and occasionally hazardous—intersection.Ann Intern Med.2006;145(8):592–598.
- ,,,,.Does housestaff discontinuity of care increase the risk for preventable adverse events?Ann Intern Med.1994;121(11):866–872.
- ,,,.The impact of a regulation restricting medical house staff working hours on the quality of patient care.JAMA.1993;269(3):374–378.
- Centers for Medicare and Medicaid Services. Standard analytical files. Available at: http://www.cms.hhs.gov/IdentifiableDataFiles/02_Standard AnalyticalFiles.asp. Accessed March 1,2009.
- Centers for Medicare and Medicaid Services. Nonidentifiable data files: Provider of services files. Available at: http://www.cms.hhs.gov/NonIdentifiableDataFiles/04_ProviderofSerrvicesFile.asp. Accessed March 1,2009.
- Research Data Assistance Center. Medicare data file description. Available at: http://www.resdac.umn.edu/Medicare/file_descriptions.asp. Accessed March 1,2009.
- ,,,.Effect of comorbidity adjustment on CMS criteria for kidney transplant center performance.Am J Transplant.2009;9:506–516.
- ,,,,,.Continuity of outpatient and inpatient care by primary care physicians for hospitalized older adults.JAMA.2009;301:1671–1680.
- ,,,.Growth in the care of older patients by hospitalists in the United States.N Engl J Med. 2009;360:1102–1112.
- HCPro Inc.Medical Staff Leader blog.2010. Available at: http://blogs. hcpro.com/medicalstaff/2010/01/free‐form‐example‐seven‐day‐on‐seven‐day‐off‐hospitalist‐schedule/. Accessed November 20, 2010.
- ,,,.How physicians perceive hospitalist services after implementation: Anticipation vs reality.Arch Intern Med.2003;163(19):2330–2336.
Copyright © 2011 Society of Hospital Medicine