User login
Impact on Length of Stay of a Hospital Medicine Emergency Department Boarder Service
Emergency department (ED) crowding and boarding of patients awaiting admission to the hospital (ED boarding) are growing problems with important clinical care and public safety implications.1-4 Increased ED boarding times have been associated with lower patient satisfaction, inadequate care of critically ill patients, adverse events, and increased mortality.3,5-7 Furthermore, ED boarding can diminish the ED’s ability to evaluate new patients.5,8,9 ED boarding is more severe in hospitals with high inpatient occupancy with resultant disproportionate burden on large urban institutions.2,4,5,10
Earlier studies suggest, but have not consistently shown, an association between longer ED length of stay (LOS) and longer overall hospital LOS.5 This association implies that the additional time spent in the ED waiting for a bed does not meaningfully contribute to advancing the required inpatient care. Thus, this waiting time is “dead time” that is added to the overall hospital duration.
The complexity and the volume of medical patients boarding in the ED can challenge the resources of an already overtaxed ED staff. Potential solutions to mitigate ED boarding of medicine patients generally focus on reducing barriers to timely movement of patients from the ED to an inpatient unit.1,3,11-13 Ultimately, these barriers are a function of inadequate hospital capacity (eg, hospital beds, staffing) and are difficult to overcome. Two primary strategies have been used to reduce these barriers. One strategy focuses on shifting inpatient discharge times earlier to better match inpatient bed supply with ED demand.14-19 Another common strategy is utilizing inpatient attendings to triage and better match bed needs to bed availability.20-22
A separate area of interest, and the focus of this study, is the deployment of inpatient teams to hasten delivery of inpatient care to patients waiting in the ED.8,23 One institution implemented an “ED hospitalist” model.23 Another created a hospital medicine team to provide inpatient medical care to ED boarder patients and to lend clinical input to bed management.8
At our large, urban academic medical center, the Department of Medicine in collaboration with the Department of Emergency Medicine created a full-time hospital medicine team dedicated to providing care in the ED for patients awaiting admission to a general medicine unit. We present our multiyear experience with this ED-based hospital medicine team. We hypothesized that this new team would expedite inpatient care delivery to medical boarder patients, thereby reducing the overall hospital LOS.
METHODS
Study Setting and Design
This retrospective cross-sectional study, approved by the Institutional Review Board, was conducted at a 1,011-bed academic medical center in the northeast United States. The study period was July 1, 2016 through June 30, 2018, which was divided into Academic Year 16 (AY) (July 1, 2016 to June 30, 2017) and AY17 (July 1, 2017 to June 30, 2018).
The Hospital Medicine Unit (HMU) was a 60 full-time equivalent hospital medicine group consisting of 80 physicians and 25 advanced practice providers (APPs). During the study, the general medical services cared for an average of 260 patients per day on inpatient units with a wide variety of diagnoses and comorbidities. The ED had 48 monitored bed spaces for adult patients, as well as two dedicated ED observation units with 32 beds. The observation units are separate units within the hospital, staffed by ED clinicians, and were not included in this study. In 2016, the ED had a total of 110,741 patient visits and 13,908 patients were admitted to a medical service.
In 2010, the Department of Public Health for the state in which the medical center resides defined an ED boarder (EDB) patient as “a patient who remains in the ED two hours after the decision to admit.”24 According to this definition, any patient waiting for an inpatient bed for more than two hours after a bed request was considered as an EDB. Operationally, further distinctions were made between patients who were “eligible” for care by an internal medicine team in the ED versus those who were actually “covered”. Before the intervention outlined in the current study, some care was provided by resident and hospitalist teams to eligible EDB patients from 2010 to 2015, although this was limited in scope. From July 1, 2015 to June 30, 2016, there was no coverage of medicine EDB patients.
Intervention
ED Boarder Service Staffing
On July 1, 2016, the HMU deployed a dedicated full-time team of clinicians to care for boarding patients, which was known as the EDB service. The service was created with the goal of seeing a maximum of 25 patients over 24 hours.
Inpatient medicine attending physicians (hospitalists) and APPs worked on the EDB service. During the day (7
There was a dedicated nursing team for the EDB service. For AY16, there were two daytime EDB nurses and one night nurse, all with a coverage ratio of three to four patients per nurse. For AY17, there were four to five daytime nurses and two to three nighttime nurses with the same coverage ratio as that for AY16. EDB nurses received special training on caring for boarder patients and followed the usual inpatient nursing protocols and assessments. During each shift, an EDB charge nurse worked in conjunction with the hospitalist, bed management, and inpatient units to determine patients requiring coverage by the EDB team.
Patient Eligibility
Similar to the workflow before the intervention, the ED team was responsible for determining a patient’s need for admission to a medical service. Patients were eligible for EDB service coverage if they waited in the ED for more than two hours after the request for an inpatient bed was made. The EDB charge nurse was responsible for identifying all eligible boarder patients based on time elapsed since bed request. Patients were not eligible for the hospital medicine EDB service if they were in the ED observation units or were being admitted to the intensive care unit, cardiology service, oncology service, or any service outside of the Department of Medicine.
The EDB service did not automatically assume care of all eligible patients. Instead, eligible patients were accepted based on several factors including EDB clinician census, anticipated availability of an inpatient bed, and clinical appropriateness as deemed by the physician. If the EDB physician census was fewer than 10 patients and an eligible patient was not expected to move to an inpatient unit within the next hour, the patient was accepted by the EDB service. Patients who were not accepted by the EDB service remained under the care of the ED team until either the patient received an inpatient bed or space became available on the EDB service census. Eligible EDB patients who received an inpatient bed before being picked up by the EDB service were considered as noncovered EDB patients. Alternatively, an eligible patient may initially be declined from EDB service coverage due to, for example, a high census but later accepted when capacity allowed—this patient would be considered a covered EDB patient.
Handoff and Coordination
When an eligible patient was accepted onto the EDB service, clinical handoff between the ED and EDB teams occurred. The EDB physician wrote admission orders, including the inpatient admission order. Once on the EDB service, when space allowed, the patient was physically moved to a dedicated geographic space (8 beds) within the ED designed for the EDB service. When the dedicated EDB area was full, new patients would remain in their original patient bay and receive care from the EDB service. Multidisciplinary rounds with nursing, inpatient clinicians, and case management that normally occur every weekday on inpatient units were adapted to occur on the EDB service to discuss patient care needs. The duration of the patient’s stay in the ED, including the time on the EDB service, was dictated by bed availability rather than by clinical discretion of the EDB clinician. When an EDB patient was assigned a ready inpatient bed, the EDB clinician immediately passed off clinical care to the inpatient medical team. There was no change in the process of assigning patients to inpatient beds during the intervention period.
Study Population
This study included patients who were admitted to the general medical services through the ED during the defined period. We excluded medicine patients who did not pass through the ED (eg, direct admissions or outside transfer) as well as patients admitted to a specialty service (cardiology, oncology) or the intensive care unit. Patients admitted to a nonmedical service were also excluded.
Two hours following a bed request, an ED patient was designated as an eligible EDB patient. Operationally, and for the purposes of this study, patients were separated into three groups: (1) an eligible EDB patient for whom the EDB service assumed care for any portion of their ED stay was considered as a “covered ED boarder,” (2) an eligible EDB patient who did not have any coverage by the EDB service at any point during their ED stay was considered as a “noncovered boarder,” and (3) a patient who received an inpatient bed within two hours of bed request was considered as a “nonboarder”. Patients admitted to a specialty service, intensive care unit, or nonmedical services were not included in any of the abovementioned three groups.
We defined metrics to quantify the extent of EDB team coverage. First, the number of covered EDB patients was divided by all medicine boarders (covered + noncovered) to determine the percentage of medicine EDBs covered. Second, the total patient hours spent under the care of the EDB service was divided by the total boarding hours for all medicine boarders to determine the percentage of boarder hours covered.
Data Sources and Collection
The Electronic Health Record (EHR; Epic Systems Corporation, Verona, Wisconsin) captured whether patients were eligible EDBs. For covered EDB patients, the time when care was assumed by the EDB service was captured electronically. Patient demographics, admitting diagnoses, time stamps throughout the hospitalization, admission volumes, LOS, and discharge disposition were extracted from the EHR.
Primary and Secondary Outcome Measures
The primary outcome of this study was hospital LOS defined as the time from ED arrival to hospital departure (Figure). Secondary outcomes included ED LOS (time from ED arrival to ED departure) and the rate of 30-day ED readmission to the study institution.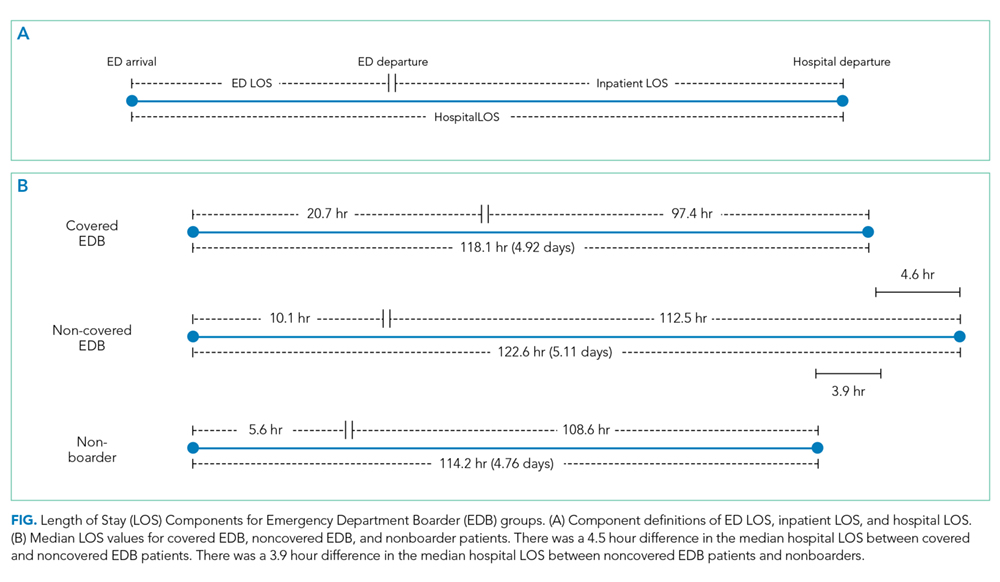
Statistical Analysis
SAS version 9.4 (SAS Institute, Cary, North Carolina) was used for all statistical analyses. Continuous outcomes were compared using the Mann–Whitney test and dichotomized outcomes were compared using chi-square tests. We further analyzed the differences in the primary and secondary outcomes between covered and noncovered EDB groups using a multivariable regression analysis adjusting for age, gender, race, academic year, hour of the day, and day of the week at the time of becoming an EDB. We used quantile regression and linear regression with log-transformed continuous outcomes and logistic regression for the dichotomized outcome. A P value of .05 was used as a threshold for statistical significance.
RESULTS
Study Population and Demographics
There were a total of 16,668 patients admitted from the ED to the general medical services during the study period (Table 1). There were 8,776 (53%) patients in the covered EDB group, 5,866 (35%) patients in the noncovered EDB group, and 2,026 (12%) patients in the nonboarder group. There were more patients admitted during AY17 compared with AY16 (8,934 vs 7,734 patients, respectively, Appendix 1). Patient demographics, including age, gender, race, insurance coverage, admitting diagnoses, and discharge disposition, were similar among all three patient groups (Table 1). A majority of patients in the covered EDB and nonboarder groups presented to the ED in the afternoon, whereas noncovered EDB patients presented more in the morning (Table 1). Consistent with this pattern, inpatient bed requests for covered EDB and nonboarder patients were more frequent between 7 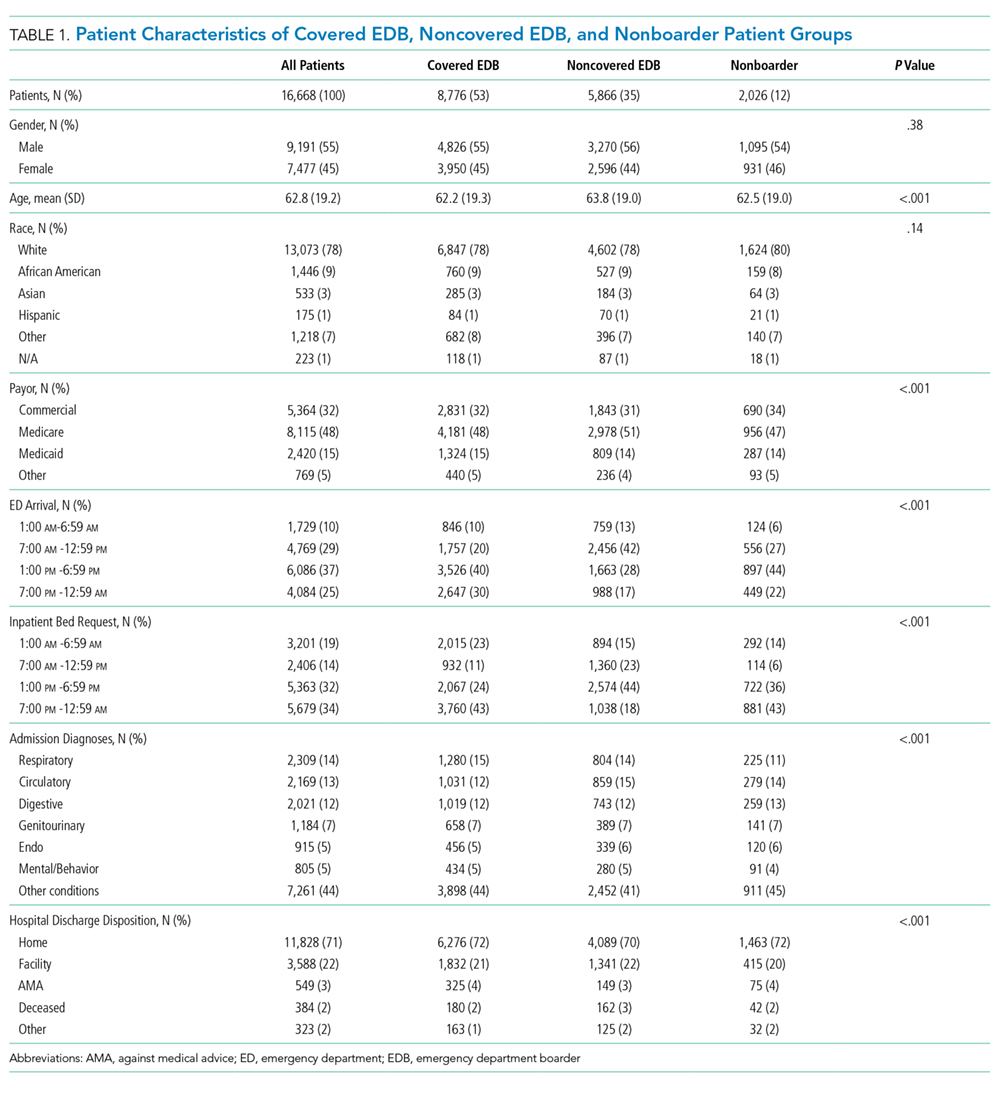
Hospital Length of Stay
Nonboarders had the shortest median hospital LOS (4.76; interquartile range [IQR] 2.90-7.22 days). Covered EDB patients had a median hospital LOS that was 4.6 hours (0.19 day) shorter compared with noncovered EDB patients (4.92 [IQR 3.00-8.03] days vs 5.11 [IQR 3.16-8.34 days]; Table 2). The differences among the three groups were all significant in the univariate comparison (P < .001). Multivariable regression controlling for patient age, gender, race, academic year, and hour and day of the week at the time of becoming an EDB demonstrated that the difference in hospital LOS between covered and noncovered EDB patients remained significant (P < .001).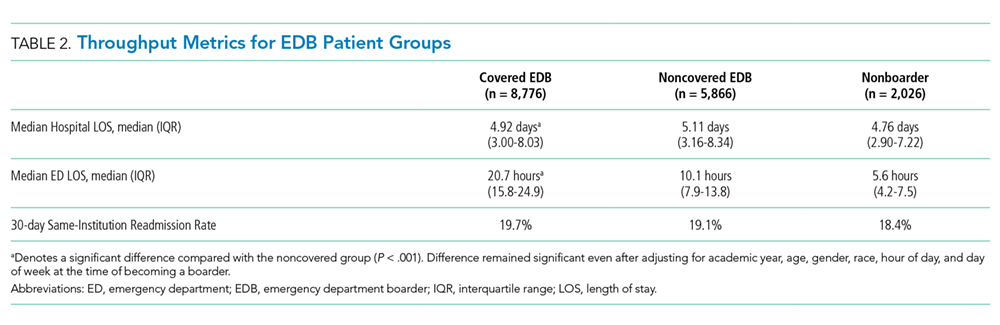
ED Length of Stay and 30-Day ED Readmission
Covered EDB patients had a longer median ED LOS compared with noncovered EDB patients and nonboarder patients (20.7 [IQR 15.8-24.9] hours vs 10.1 [IQR 7.9-13.8] hours vs 5.6 [IQR 4.2-7.5] hours, respectively, Table 2). These differences remained significant in the multivariable regression models (P < .001). Finally, the 30-day same-institution ED readmission rate was similar between covered and noncovered EDB patients.
DISCUSSION
We present two years of data describing a hospital medicine-led team designed to enhance the care of medical patients boarding in the ED. The period spent boarding in the ED is a vulnerable time for patients, and we created the EDB service with the goal of delivering inpatient medicine-led care to ED patients awaiting their inpatient bed.
When a bed request is made in an efficient ideal world, patients could be immediately transferred to an open inpatient bed to initiate care. In our study, patients who were not EDBs (ie, waited for less than two hours for their inpatient bed) had the most time-efficient care as they had the shortest ED and hospital LOS. However, nonboarders represented only 12% of patients and the majority of patients admitted to medicine were boarders. Patients covered by the EDB service had an overall hospital LOS that was 4.6 hours shorter compared with noncovered EDB patients despite having an ED LOS that was 15.1 hours longer. These LOS differences were observed without any difference to 30-day ED readmission rates.
Given that not all boarding patients were cared by the EDB service, the role of selection bias in our study warrants discussion. Similar to other studies, ED LOS for our patient cohort is heavily influenced by the availability of inpatient beds.10-12 The EDB service handed off patients they were covering as soon as an inpatient bed became available. Although there was discretion from the EDB charge nurse and the EDB physician about which patient to accept, this was primarily focused on choosing patients who did not have a pending inpatient bed (eg, a patient who was assigned a bed but was awaiting room cleaning). Importantly, there was no change in the bed assignment process as a part of the intervention. Our intervention’s design did not allow for elucidation of causation; however, we believe that the longer ED LOS for covered EDB patients compared with noncovered EDB patients reflects the fact that the team chose patients with a higher expected ED LOS rather than that the patients had a longer LOS due to being cared by the service. Consistent with this, patients covered by the EDB service tended to have bed requests placed during the night shift compared with noncovered EDB patients; patients with bed requests at night are more likely to wait longer for their inpatient bed given that inpatient beds are generally freed up in the afternoon. We acknowledge that it is impossible to completely rule out the possibility that patient factors (eg, infectious precautions) influence inpatient bed wait time and could be another factor influencing the probability of EDB service coverage.
The current study adds to the expanding literature on EDB care models. Briones et al. demonstrated that an “ED hospitalist” led to increased care delivery as measured by an increased follow-up on laboratory results and medication orders.23 However, their study was not structured to demonstrate LOS changes.23 In another study, Chadaga et al. reported about their experience with a hospital medicine team providing care for EDB patients, similar to our study.8 Their hospital medicine team consisted of a hospitalist and APP deployed in the ED during the day, with night coverage provided by existing ED clinicians. They demonstrated less ED diversion, more ED discharges, and positive perceptions among the ED team.8 However, there was no impact on ED or hospital LOS, although their results may have been limited by the short duration of postintervention data and the lack of nighttime coverage.8 Finally, a modeling study demonstrated a reduction in ED LOS by adding ED clinicians only for patients being discharged from the ED and not for those being admitted, although there was no explicit adjustment for LOS accounting for initiation of inpatient care in the ED.15 Extending the current literature, our study suggests that a hospitalist team providing continuous coverage to a large portion of EDB patients could shorten the overall hospital LOS for boarding patients, but even this was not enough to reduce LOS to the same level as that of patients who did not board.
Practically, there were challenges to creating the EDB service described in our study. Additional clinical staff (physician, APP, and nursing) were hired for the team, requiring a financial commitment from the institution. The new team required space within the ED footprint incurring construction costs. Before the existence of the EDB service, other ancillary services (eg, physical therapy) were unaccustomed to seeing ED patients, and thus new workflows were created. Another challenge was that internal medicine clinicians were not used to caring for patients for short durations of time before passing off clinical care to another team. This required a different approach, focusing on acute issues rather than conducting an exhaustive evaluation. Finally, the EDB service workflow introduced an additional handoff, increasing discontinuity of care. These challenges are factors to consider for institutions considering a similar EDB team and should be weighed against other interventions to alleviate ED boarding or improve throughput such as expanding inpatient capacity.
Ideal metrics to track the coverage and performance of an EDB service such as the one described in this study are undefined. It was difficult to know whether the goal should be complete coverage given the increase in handoffs, particularly for patients with short boarding times. This EDB service covered 59.9% of boarding patients and 62.9% of total boarding hours. Factors that contributed to covering less than 100% included physician staffing that was insufficient to meet demand and discretion to not accept patients expected to quickly get an inpatient bed. Therefore, the percentage of patients and boarding hours covered are crude metrics and further investigation is needed to develop optimal metrics for an EDB team.
Future studies on care models for EDB patients are warranted. Recognizing that EDB teams require additional resources, studies to define which patients receive the most benefit from EDB coverage will be helpful. Moreover, the EDB team composition may need to adapt to different environments (eg, academic, urban, nonacademic, rural). Diving deeper to study whether specific patient populations benefit more than others from care by the EDB service, as measured by hospital LOS or other outcomes, would be important. Clinical outcomes, in addition to throughput metrics such as LOS, must be analyzed to understand whether factors such as increased handoffs outweigh any benefits in throughput.
There were several limitations to this study. First, it was performed at a single academic institution, potentially limiting its generalizability. However, although some workflows and team coverage structures may be institution-specific, the concept of a hospital medicine-led EDB team providing earlier inpatient care can be adapted locally and may probably achieve similar benefits. Our study population included only patients destined for general medical admission; thus, it is uncertain whether the gains demonstrated in our study would be realized for patients boarding for nonmedical services. In addition, considering the observational nature of this study, it is difficult to prove the causation that a hospitalist EDB service solely led to reductions in hospital LOS. Finally, we did not adjust for nor measure whether ED clinicians provided different care to patients whom they felt were destined for the EDB service.
In summary, nonboarder patients had the shortest overall LOS; however, among those patients who boarded, coverage by a hospitalist-led team was associated with a shorter LOS. Given the limited inpatient capacity, eliminating ED boarding is often not possible. We present a model to expedite inpatient care and allow ED clinicians to focus on newly arriving ED patients. Additional studies are required to better understand how to optimally care for patients boarding in the ED.
1. Asplin BR, Magid DJ, Rhodes KV, Solberg LI, Lurie N, Camargo CA, Jr. A conceptual model of emergency department crowding. Ann Emerg Med. 2003;42(2):173-180. https://doi.org/10.1067/mem.2003.302.
2. Trzeciak S, Rivers EP. Emergency department overcrowding in the United States: an emerging threat to patient safety and public health. Emerg Med J. 2003;20(5):402-405. https://doi.org/10.1136/emj.20.5.402.
3. Olshaker JS. Managing emergency department overcrowding. Emerg Med Clin North Am. 2009;27(4):593-603. https://doi.org/10.1016/jemc.2009.07.004.
4. Richardson LD, Asplin BR, Lowe RA. Emergency department crowding as a health policy issue: past development, future directions. Ann Emerg Med. 2002;40(4):388-393. https://doi.org/10.1067/mem.2002.128012.
5. Bernstein SL, Aronsky D, Duseja R, et al. The effect of emergency department crowding on clinically oriented outcomes. Acad Emerg Med. 2009;16(1):1-10. https://doi.org/10.1111/j.1553-2712.2008.00295.x.
6. Singer AJ, Thode HC, Jr., Viccellio P, Pines JM. The association between length of emergency department boarding and mortality. Acad Emerg Med. 2011;18(12):1324-1329. https://doi.org/10.1111/j.1553-2712.2011.01236.x.
7. Silvester KM, Mohammed MA, Harriman P, Girolami A, Downes TW. Timely care for frail older people referred to hospital improves efficiency and reduces mortality without the need for extra resources. Age Ageing. 2014;43(4):472-477. https://doi.org/10.1093/ageing/aft170.
8. Chadaga SR, Shockley L, Keniston A, et al. Hospitalist-led medicine emergency department team: associations with throughput, timeliness of patient care, and satisfaction. J Hosp Med. 2012;7(7):562-566. https://doi.org/10.1002/jhm.1957.
9. Lucas R, Farley H, Twanmoh J, Urumov A, Evans B, Olsen N. Measuring the opportunity loss of time spent boarding admitted patients in the emergency department: a multihospital analysis. J Healthc Manag. 2009;54(2):117-124; discussion 124-115. https://doi.org/10.1097/00115514-200903000-00009.
10. Forster AJ, Stiell I, Wells G, Lee AJ, van Walraven C. The effect of hospital occupancy on emergency department length of stay and patient disposition. Acad Emerg Med. 2003;10(2):127-133. https://doi.org/10.1111/j.1553-2712.2003.tb00029.x.
11. Hoot NR, Aronsky D. Systematic review of emergency department crowding: causes, effects, and solutions. Ann Emerg Med. 2008;52(2):126-136. https://doi.org/10.1016/j.annemergmed.2008.03.014.
12. Asaro PV, Lewis LM, Boxerman SB. The impact of input and output factors on emergency department throughput. Acad Emerg Med. 2007;14(3):235-242. https://doi.org/10.1197/j.aem.2006.10.104.
13. Khare RK, Powell ES, Reinhardt G, Lucenti M. Adding more beds to the emergency department or reducing admitted patient boarding times: which has a more significant influence on emergency department congestion? Ann Emerg Med. 2009;53(5):575-585. https://doi.org/10.1016/j.annemergmed.2008.07.009.
14. Wertheimer B, Jacobs RE, Bailey M, et al. Discharge before noon: an achievable hospital goal. J Hosp Med. 2014;9(4):210-214. https://doi.org/10.1002/jhm.2154.
15. Paul JA, Lin L. Models for improving patient throughput and waiting at hospital emergency departments. J Emerg Med. 2012;43(6):1119-1126. https://doi.org/10.1016/j.jemermed.2012.01.063.
16. Wertheimer B, Jacobs RE, Iturrate E, Bailey M, Hochman K. Discharge before noon: effect on throughput and sustainability. J Hosp Med. 2015;10(10):664-669. https://doi.org/10.1002/jhm.2412.
17. Khanna S, Sier D, Boyle J, Zeitz K. Discharge timeliness and its impact on hospital crowding and emergency department flow performance. Emerg Med Australas. 2016;28(2):164-170. https://doi.org/10.1111/1742-6723.12543.
18. Patel H, Morduchowicz S, Mourad M. Using a systematic framework of interventions to improve early discharges. Jt Comm J Qual Patient Saf. 2017;43(4):189-196. https://doi.org/10.1016/j.jcjq.2016.12.003.
19. Powell ES, Khare RK, Venkatesh AK, Van Roo BD, Adams JG, Reinhardt G. The relationship between inpatient discharge timing and emergency department boarding. J Emerg Med. 2012;42(2):186-196. https://doi.org/10.1016/j.jemermed.2010.06.028.
20. Howell E, Bessman E, Kravet S, Kolodner K, Marshall R, Wright S. Active bed management by hospitalists and emergency department throughput. Ann Intern Med. 2008;149(11):804-811. https://doi.org/10.7326/0003-4819-149-11-200812020-00006.
21. Howell E, Bessman E, Marshall R, Wright S. Hospitalist bed management effecting throughput from the emergency department to the intensive care unit. J Crit Care. 2010;25(2):184-189. https://doi.org/10.1016/j.jcrc.2009.08.004.
22. Howell EE, Bessman ES, Rubin HR. Hospitalists and an innovative emergency department admission process. J Gen Intern Med. 2004;19(3):266-268. https://doi.org/10.1111/j.1525-1497.2004.30431.x.
23. Briones A, Markoff B, Kathuria N, et al. A model of a hospitalist role in the care of admitted patients in the emergency department. J Hosp Med. 2010;5(6):360-364. https://doi.org/10.1002/jhm.636.
24. Auerbach J. Reducing emergency department patient boarding and submitting code help policies to the Department of Public Health. In: Executive Office of Health and Human Services. Boston: Department of Public Health; 2010.
Emergency department (ED) crowding and boarding of patients awaiting admission to the hospital (ED boarding) are growing problems with important clinical care and public safety implications.1-4 Increased ED boarding times have been associated with lower patient satisfaction, inadequate care of critically ill patients, adverse events, and increased mortality.3,5-7 Furthermore, ED boarding can diminish the ED’s ability to evaluate new patients.5,8,9 ED boarding is more severe in hospitals with high inpatient occupancy with resultant disproportionate burden on large urban institutions.2,4,5,10
Earlier studies suggest, but have not consistently shown, an association between longer ED length of stay (LOS) and longer overall hospital LOS.5 This association implies that the additional time spent in the ED waiting for a bed does not meaningfully contribute to advancing the required inpatient care. Thus, this waiting time is “dead time” that is added to the overall hospital duration.
The complexity and the volume of medical patients boarding in the ED can challenge the resources of an already overtaxed ED staff. Potential solutions to mitigate ED boarding of medicine patients generally focus on reducing barriers to timely movement of patients from the ED to an inpatient unit.1,3,11-13 Ultimately, these barriers are a function of inadequate hospital capacity (eg, hospital beds, staffing) and are difficult to overcome. Two primary strategies have been used to reduce these barriers. One strategy focuses on shifting inpatient discharge times earlier to better match inpatient bed supply with ED demand.14-19 Another common strategy is utilizing inpatient attendings to triage and better match bed needs to bed availability.20-22
A separate area of interest, and the focus of this study, is the deployment of inpatient teams to hasten delivery of inpatient care to patients waiting in the ED.8,23 One institution implemented an “ED hospitalist” model.23 Another created a hospital medicine team to provide inpatient medical care to ED boarder patients and to lend clinical input to bed management.8
At our large, urban academic medical center, the Department of Medicine in collaboration with the Department of Emergency Medicine created a full-time hospital medicine team dedicated to providing care in the ED for patients awaiting admission to a general medicine unit. We present our multiyear experience with this ED-based hospital medicine team. We hypothesized that this new team would expedite inpatient care delivery to medical boarder patients, thereby reducing the overall hospital LOS.
METHODS
Study Setting and Design
This retrospective cross-sectional study, approved by the Institutional Review Board, was conducted at a 1,011-bed academic medical center in the northeast United States. The study period was July 1, 2016 through June 30, 2018, which was divided into Academic Year 16 (AY) (July 1, 2016 to June 30, 2017) and AY17 (July 1, 2017 to June 30, 2018).
The Hospital Medicine Unit (HMU) was a 60 full-time equivalent hospital medicine group consisting of 80 physicians and 25 advanced practice providers (APPs). During the study, the general medical services cared for an average of 260 patients per day on inpatient units with a wide variety of diagnoses and comorbidities. The ED had 48 monitored bed spaces for adult patients, as well as two dedicated ED observation units with 32 beds. The observation units are separate units within the hospital, staffed by ED clinicians, and were not included in this study. In 2016, the ED had a total of 110,741 patient visits and 13,908 patients were admitted to a medical service.
In 2010, the Department of Public Health for the state in which the medical center resides defined an ED boarder (EDB) patient as “a patient who remains in the ED two hours after the decision to admit.”24 According to this definition, any patient waiting for an inpatient bed for more than two hours after a bed request was considered as an EDB. Operationally, further distinctions were made between patients who were “eligible” for care by an internal medicine team in the ED versus those who were actually “covered”. Before the intervention outlined in the current study, some care was provided by resident and hospitalist teams to eligible EDB patients from 2010 to 2015, although this was limited in scope. From July 1, 2015 to June 30, 2016, there was no coverage of medicine EDB patients.
Intervention
ED Boarder Service Staffing
On July 1, 2016, the HMU deployed a dedicated full-time team of clinicians to care for boarding patients, which was known as the EDB service. The service was created with the goal of seeing a maximum of 25 patients over 24 hours.
Inpatient medicine attending physicians (hospitalists) and APPs worked on the EDB service. During the day (7
There was a dedicated nursing team for the EDB service. For AY16, there were two daytime EDB nurses and one night nurse, all with a coverage ratio of three to four patients per nurse. For AY17, there were four to five daytime nurses and two to three nighttime nurses with the same coverage ratio as that for AY16. EDB nurses received special training on caring for boarder patients and followed the usual inpatient nursing protocols and assessments. During each shift, an EDB charge nurse worked in conjunction with the hospitalist, bed management, and inpatient units to determine patients requiring coverage by the EDB team.
Patient Eligibility
Similar to the workflow before the intervention, the ED team was responsible for determining a patient’s need for admission to a medical service. Patients were eligible for EDB service coverage if they waited in the ED for more than two hours after the request for an inpatient bed was made. The EDB charge nurse was responsible for identifying all eligible boarder patients based on time elapsed since bed request. Patients were not eligible for the hospital medicine EDB service if they were in the ED observation units or were being admitted to the intensive care unit, cardiology service, oncology service, or any service outside of the Department of Medicine.
The EDB service did not automatically assume care of all eligible patients. Instead, eligible patients were accepted based on several factors including EDB clinician census, anticipated availability of an inpatient bed, and clinical appropriateness as deemed by the physician. If the EDB physician census was fewer than 10 patients and an eligible patient was not expected to move to an inpatient unit within the next hour, the patient was accepted by the EDB service. Patients who were not accepted by the EDB service remained under the care of the ED team until either the patient received an inpatient bed or space became available on the EDB service census. Eligible EDB patients who received an inpatient bed before being picked up by the EDB service were considered as noncovered EDB patients. Alternatively, an eligible patient may initially be declined from EDB service coverage due to, for example, a high census but later accepted when capacity allowed—this patient would be considered a covered EDB patient.
Handoff and Coordination
When an eligible patient was accepted onto the EDB service, clinical handoff between the ED and EDB teams occurred. The EDB physician wrote admission orders, including the inpatient admission order. Once on the EDB service, when space allowed, the patient was physically moved to a dedicated geographic space (8 beds) within the ED designed for the EDB service. When the dedicated EDB area was full, new patients would remain in their original patient bay and receive care from the EDB service. Multidisciplinary rounds with nursing, inpatient clinicians, and case management that normally occur every weekday on inpatient units were adapted to occur on the EDB service to discuss patient care needs. The duration of the patient’s stay in the ED, including the time on the EDB service, was dictated by bed availability rather than by clinical discretion of the EDB clinician. When an EDB patient was assigned a ready inpatient bed, the EDB clinician immediately passed off clinical care to the inpatient medical team. There was no change in the process of assigning patients to inpatient beds during the intervention period.
Study Population
This study included patients who were admitted to the general medical services through the ED during the defined period. We excluded medicine patients who did not pass through the ED (eg, direct admissions or outside transfer) as well as patients admitted to a specialty service (cardiology, oncology) or the intensive care unit. Patients admitted to a nonmedical service were also excluded.
Two hours following a bed request, an ED patient was designated as an eligible EDB patient. Operationally, and for the purposes of this study, patients were separated into three groups: (1) an eligible EDB patient for whom the EDB service assumed care for any portion of their ED stay was considered as a “covered ED boarder,” (2) an eligible EDB patient who did not have any coverage by the EDB service at any point during their ED stay was considered as a “noncovered boarder,” and (3) a patient who received an inpatient bed within two hours of bed request was considered as a “nonboarder”. Patients admitted to a specialty service, intensive care unit, or nonmedical services were not included in any of the abovementioned three groups.
We defined metrics to quantify the extent of EDB team coverage. First, the number of covered EDB patients was divided by all medicine boarders (covered + noncovered) to determine the percentage of medicine EDBs covered. Second, the total patient hours spent under the care of the EDB service was divided by the total boarding hours for all medicine boarders to determine the percentage of boarder hours covered.
Data Sources and Collection
The Electronic Health Record (EHR; Epic Systems Corporation, Verona, Wisconsin) captured whether patients were eligible EDBs. For covered EDB patients, the time when care was assumed by the EDB service was captured electronically. Patient demographics, admitting diagnoses, time stamps throughout the hospitalization, admission volumes, LOS, and discharge disposition were extracted from the EHR.
Primary and Secondary Outcome Measures
The primary outcome of this study was hospital LOS defined as the time from ED arrival to hospital departure (Figure). Secondary outcomes included ED LOS (time from ED arrival to ED departure) and the rate of 30-day ED readmission to the study institution.
Statistical Analysis
SAS version 9.4 (SAS Institute, Cary, North Carolina) was used for all statistical analyses. Continuous outcomes were compared using the Mann–Whitney test and dichotomized outcomes were compared using chi-square tests. We further analyzed the differences in the primary and secondary outcomes between covered and noncovered EDB groups using a multivariable regression analysis adjusting for age, gender, race, academic year, hour of the day, and day of the week at the time of becoming an EDB. We used quantile regression and linear regression with log-transformed continuous outcomes and logistic regression for the dichotomized outcome. A P value of .05 was used as a threshold for statistical significance.
RESULTS
Study Population and Demographics
There were a total of 16,668 patients admitted from the ED to the general medical services during the study period (Table 1). There were 8,776 (53%) patients in the covered EDB group, 5,866 (35%) patients in the noncovered EDB group, and 2,026 (12%) patients in the nonboarder group. There were more patients admitted during AY17 compared with AY16 (8,934 vs 7,734 patients, respectively, Appendix 1). Patient demographics, including age, gender, race, insurance coverage, admitting diagnoses, and discharge disposition, were similar among all three patient groups (Table 1). A majority of patients in the covered EDB and nonboarder groups presented to the ED in the afternoon, whereas noncovered EDB patients presented more in the morning (Table 1). Consistent with this pattern, inpatient bed requests for covered EDB and nonboarder patients were more frequent between 7
Hospital Length of Stay
Nonboarders had the shortest median hospital LOS (4.76; interquartile range [IQR] 2.90-7.22 days). Covered EDB patients had a median hospital LOS that was 4.6 hours (0.19 day) shorter compared with noncovered EDB patients (4.92 [IQR 3.00-8.03] days vs 5.11 [IQR 3.16-8.34 days]; Table 2). The differences among the three groups were all significant in the univariate comparison (P < .001). Multivariable regression controlling for patient age, gender, race, academic year, and hour and day of the week at the time of becoming an EDB demonstrated that the difference in hospital LOS between covered and noncovered EDB patients remained significant (P < .001).
ED Length of Stay and 30-Day ED Readmission
Covered EDB patients had a longer median ED LOS compared with noncovered EDB patients and nonboarder patients (20.7 [IQR 15.8-24.9] hours vs 10.1 [IQR 7.9-13.8] hours vs 5.6 [IQR 4.2-7.5] hours, respectively, Table 2). These differences remained significant in the multivariable regression models (P < .001). Finally, the 30-day same-institution ED readmission rate was similar between covered and noncovered EDB patients.
DISCUSSION
We present two years of data describing a hospital medicine-led team designed to enhance the care of medical patients boarding in the ED. The period spent boarding in the ED is a vulnerable time for patients, and we created the EDB service with the goal of delivering inpatient medicine-led care to ED patients awaiting their inpatient bed.
When a bed request is made in an efficient ideal world, patients could be immediately transferred to an open inpatient bed to initiate care. In our study, patients who were not EDBs (ie, waited for less than two hours for their inpatient bed) had the most time-efficient care as they had the shortest ED and hospital LOS. However, nonboarders represented only 12% of patients and the majority of patients admitted to medicine were boarders. Patients covered by the EDB service had an overall hospital LOS that was 4.6 hours shorter compared with noncovered EDB patients despite having an ED LOS that was 15.1 hours longer. These LOS differences were observed without any difference to 30-day ED readmission rates.
Given that not all boarding patients were cared by the EDB service, the role of selection bias in our study warrants discussion. Similar to other studies, ED LOS for our patient cohort is heavily influenced by the availability of inpatient beds.10-12 The EDB service handed off patients they were covering as soon as an inpatient bed became available. Although there was discretion from the EDB charge nurse and the EDB physician about which patient to accept, this was primarily focused on choosing patients who did not have a pending inpatient bed (eg, a patient who was assigned a bed but was awaiting room cleaning). Importantly, there was no change in the bed assignment process as a part of the intervention. Our intervention’s design did not allow for elucidation of causation; however, we believe that the longer ED LOS for covered EDB patients compared with noncovered EDB patients reflects the fact that the team chose patients with a higher expected ED LOS rather than that the patients had a longer LOS due to being cared by the service. Consistent with this, patients covered by the EDB service tended to have bed requests placed during the night shift compared with noncovered EDB patients; patients with bed requests at night are more likely to wait longer for their inpatient bed given that inpatient beds are generally freed up in the afternoon. We acknowledge that it is impossible to completely rule out the possibility that patient factors (eg, infectious precautions) influence inpatient bed wait time and could be another factor influencing the probability of EDB service coverage.
The current study adds to the expanding literature on EDB care models. Briones et al. demonstrated that an “ED hospitalist” led to increased care delivery as measured by an increased follow-up on laboratory results and medication orders.23 However, their study was not structured to demonstrate LOS changes.23 In another study, Chadaga et al. reported about their experience with a hospital medicine team providing care for EDB patients, similar to our study.8 Their hospital medicine team consisted of a hospitalist and APP deployed in the ED during the day, with night coverage provided by existing ED clinicians. They demonstrated less ED diversion, more ED discharges, and positive perceptions among the ED team.8 However, there was no impact on ED or hospital LOS, although their results may have been limited by the short duration of postintervention data and the lack of nighttime coverage.8 Finally, a modeling study demonstrated a reduction in ED LOS by adding ED clinicians only for patients being discharged from the ED and not for those being admitted, although there was no explicit adjustment for LOS accounting for initiation of inpatient care in the ED.15 Extending the current literature, our study suggests that a hospitalist team providing continuous coverage to a large portion of EDB patients could shorten the overall hospital LOS for boarding patients, but even this was not enough to reduce LOS to the same level as that of patients who did not board.
Practically, there were challenges to creating the EDB service described in our study. Additional clinical staff (physician, APP, and nursing) were hired for the team, requiring a financial commitment from the institution. The new team required space within the ED footprint incurring construction costs. Before the existence of the EDB service, other ancillary services (eg, physical therapy) were unaccustomed to seeing ED patients, and thus new workflows were created. Another challenge was that internal medicine clinicians were not used to caring for patients for short durations of time before passing off clinical care to another team. This required a different approach, focusing on acute issues rather than conducting an exhaustive evaluation. Finally, the EDB service workflow introduced an additional handoff, increasing discontinuity of care. These challenges are factors to consider for institutions considering a similar EDB team and should be weighed against other interventions to alleviate ED boarding or improve throughput such as expanding inpatient capacity.
Ideal metrics to track the coverage and performance of an EDB service such as the one described in this study are undefined. It was difficult to know whether the goal should be complete coverage given the increase in handoffs, particularly for patients with short boarding times. This EDB service covered 59.9% of boarding patients and 62.9% of total boarding hours. Factors that contributed to covering less than 100% included physician staffing that was insufficient to meet demand and discretion to not accept patients expected to quickly get an inpatient bed. Therefore, the percentage of patients and boarding hours covered are crude metrics and further investigation is needed to develop optimal metrics for an EDB team.
Future studies on care models for EDB patients are warranted. Recognizing that EDB teams require additional resources, studies to define which patients receive the most benefit from EDB coverage will be helpful. Moreover, the EDB team composition may need to adapt to different environments (eg, academic, urban, nonacademic, rural). Diving deeper to study whether specific patient populations benefit more than others from care by the EDB service, as measured by hospital LOS or other outcomes, would be important. Clinical outcomes, in addition to throughput metrics such as LOS, must be analyzed to understand whether factors such as increased handoffs outweigh any benefits in throughput.
There were several limitations to this study. First, it was performed at a single academic institution, potentially limiting its generalizability. However, although some workflows and team coverage structures may be institution-specific, the concept of a hospital medicine-led EDB team providing earlier inpatient care can be adapted locally and may probably achieve similar benefits. Our study population included only patients destined for general medical admission; thus, it is uncertain whether the gains demonstrated in our study would be realized for patients boarding for nonmedical services. In addition, considering the observational nature of this study, it is difficult to prove the causation that a hospitalist EDB service solely led to reductions in hospital LOS. Finally, we did not adjust for nor measure whether ED clinicians provided different care to patients whom they felt were destined for the EDB service.
In summary, nonboarder patients had the shortest overall LOS; however, among those patients who boarded, coverage by a hospitalist-led team was associated with a shorter LOS. Given the limited inpatient capacity, eliminating ED boarding is often not possible. We present a model to expedite inpatient care and allow ED clinicians to focus on newly arriving ED patients. Additional studies are required to better understand how to optimally care for patients boarding in the ED.
1. Asplin BR, Magid DJ, Rhodes KV, Solberg LI, Lurie N, Camargo CA, Jr. A conceptual model of emergency department crowding. Ann Emerg Med. 2003;42(2):173-180. https://doi.org/10.1067/mem.2003.302.
2. Trzeciak S, Rivers EP. Emergency department overcrowding in the United States: an emerging threat to patient safety and public health. Emerg Med J. 2003;20(5):402-405. https://doi.org/10.1136/emj.20.5.402.
3. Olshaker JS. Managing emergency department overcrowding. Emerg Med Clin North Am. 2009;27(4):593-603. https://doi.org/10.1016/jemc.2009.07.004.
4. Richardson LD, Asplin BR, Lowe RA. Emergency department crowding as a health policy issue: past development, future directions. Ann Emerg Med. 2002;40(4):388-393. https://doi.org/10.1067/mem.2002.128012.
5. Bernstein SL, Aronsky D, Duseja R, et al. The effect of emergency department crowding on clinically oriented outcomes. Acad Emerg Med. 2009;16(1):1-10. https://doi.org/10.1111/j.1553-2712.2008.00295.x.
6. Singer AJ, Thode HC, Jr., Viccellio P, Pines JM. The association between length of emergency department boarding and mortality. Acad Emerg Med. 2011;18(12):1324-1329. https://doi.org/10.1111/j.1553-2712.2011.01236.x.
7. Silvester KM, Mohammed MA, Harriman P, Girolami A, Downes TW. Timely care for frail older people referred to hospital improves efficiency and reduces mortality without the need for extra resources. Age Ageing. 2014;43(4):472-477. https://doi.org/10.1093/ageing/aft170.
8. Chadaga SR, Shockley L, Keniston A, et al. Hospitalist-led medicine emergency department team: associations with throughput, timeliness of patient care, and satisfaction. J Hosp Med. 2012;7(7):562-566. https://doi.org/10.1002/jhm.1957.
9. Lucas R, Farley H, Twanmoh J, Urumov A, Evans B, Olsen N. Measuring the opportunity loss of time spent boarding admitted patients in the emergency department: a multihospital analysis. J Healthc Manag. 2009;54(2):117-124; discussion 124-115. https://doi.org/10.1097/00115514-200903000-00009.
10. Forster AJ, Stiell I, Wells G, Lee AJ, van Walraven C. The effect of hospital occupancy on emergency department length of stay and patient disposition. Acad Emerg Med. 2003;10(2):127-133. https://doi.org/10.1111/j.1553-2712.2003.tb00029.x.
11. Hoot NR, Aronsky D. Systematic review of emergency department crowding: causes, effects, and solutions. Ann Emerg Med. 2008;52(2):126-136. https://doi.org/10.1016/j.annemergmed.2008.03.014.
12. Asaro PV, Lewis LM, Boxerman SB. The impact of input and output factors on emergency department throughput. Acad Emerg Med. 2007;14(3):235-242. https://doi.org/10.1197/j.aem.2006.10.104.
13. Khare RK, Powell ES, Reinhardt G, Lucenti M. Adding more beds to the emergency department or reducing admitted patient boarding times: which has a more significant influence on emergency department congestion? Ann Emerg Med. 2009;53(5):575-585. https://doi.org/10.1016/j.annemergmed.2008.07.009.
14. Wertheimer B, Jacobs RE, Bailey M, et al. Discharge before noon: an achievable hospital goal. J Hosp Med. 2014;9(4):210-214. https://doi.org/10.1002/jhm.2154.
15. Paul JA, Lin L. Models for improving patient throughput and waiting at hospital emergency departments. J Emerg Med. 2012;43(6):1119-1126. https://doi.org/10.1016/j.jemermed.2012.01.063.
16. Wertheimer B, Jacobs RE, Iturrate E, Bailey M, Hochman K. Discharge before noon: effect on throughput and sustainability. J Hosp Med. 2015;10(10):664-669. https://doi.org/10.1002/jhm.2412.
17. Khanna S, Sier D, Boyle J, Zeitz K. Discharge timeliness and its impact on hospital crowding and emergency department flow performance. Emerg Med Australas. 2016;28(2):164-170. https://doi.org/10.1111/1742-6723.12543.
18. Patel H, Morduchowicz S, Mourad M. Using a systematic framework of interventions to improve early discharges. Jt Comm J Qual Patient Saf. 2017;43(4):189-196. https://doi.org/10.1016/j.jcjq.2016.12.003.
19. Powell ES, Khare RK, Venkatesh AK, Van Roo BD, Adams JG, Reinhardt G. The relationship between inpatient discharge timing and emergency department boarding. J Emerg Med. 2012;42(2):186-196. https://doi.org/10.1016/j.jemermed.2010.06.028.
20. Howell E, Bessman E, Kravet S, Kolodner K, Marshall R, Wright S. Active bed management by hospitalists and emergency department throughput. Ann Intern Med. 2008;149(11):804-811. https://doi.org/10.7326/0003-4819-149-11-200812020-00006.
21. Howell E, Bessman E, Marshall R, Wright S. Hospitalist bed management effecting throughput from the emergency department to the intensive care unit. J Crit Care. 2010;25(2):184-189. https://doi.org/10.1016/j.jcrc.2009.08.004.
22. Howell EE, Bessman ES, Rubin HR. Hospitalists and an innovative emergency department admission process. J Gen Intern Med. 2004;19(3):266-268. https://doi.org/10.1111/j.1525-1497.2004.30431.x.
23. Briones A, Markoff B, Kathuria N, et al. A model of a hospitalist role in the care of admitted patients in the emergency department. J Hosp Med. 2010;5(6):360-364. https://doi.org/10.1002/jhm.636.
24. Auerbach J. Reducing emergency department patient boarding and submitting code help policies to the Department of Public Health. In: Executive Office of Health and Human Services. Boston: Department of Public Health; 2010.
© 2020 Society of Hospital Medicine
Internal Medicine Residents’ Exposure to and Confidence in Managing Hospital Acute Clinical Events
Internal Medicine (IM) residency graduates are expected to manage a wide range of acute clinical events.1 Urgent and emergent inpatient situations require a broad knowledge base for rapid bedside diagnosis, yet the essential clinical skills required to manage acute clinical events pose a unique training challenge given the rarity and high-stakes nature of several such emergencies. For example, in three years of residency, a trainee may never have the opportunity to manage anaphylaxis, yet IM graduates must be able to recognize and quickly initiate proper lifesaving treatment for this relatively rare event2 when it does occur.
In an era of work-hour limitations and heightened trainee supervision, residents perceive diminished familiarity with several clinical situations3-5 and may feel unprepared to handle crisis events such as cardiac arrest.6 Given the sporadic nature of clinical medicine, many residents may not be exposed to certain acute inpatient clinical scenarios by the end of their training, a potentially critical education gap. To our knowledge, IM residents’ level of exposure to acute clinical events has not previously been studied. The aims of this study were to develop an instrument aimed at assessing IM residents’ exposure to hospital acute clinical events at a large academic medical center and to investigate the relationship between exposure and confidence in managing these events.
METHODS
Survey Development
We reviewed the Massachusetts General Hospital (MGH) IM residency program curriculum (including simulation, conferences, and other didactics), the American Board of Internal Medicine certification requirements (primarily related to Advanced Cardiac Life Support [ACLS]), and the MGH inpatient rapid response events and gained input from the IM program leadership to develop a list of 50 acute clinical events that a graduating resident may be expected to manage independently (Box 1, Supplementary Appendix).7-9 We then developed a survey assessing residents’ exposure to and confidence in managing such events. To classify the level of exposure, residents were asked to distinguish whether they had managed these events during a simulation session, inpatient as a part of a team, or inpatient independently. At our institution, IM postgraduate year 1 (PGY-1) interns manage a floor of patients overnight under a senior resident’s supervision, PGY-2 residents manage a team of several interns often without attending presence on ward rounds,10 and senior PGY-3 or -4 residents are expected to lead the hospital’s rapid response and code team and triage decompensating patients to the intensive care unit. Therefore, there are ample opportunities for IM residents to manage conditions independently (ie, in a direct leadership role) with attending supervision. House officers’ role in medical management, including calling appropriate subspecialty consultation, depends on the clinical condition; for example, a graduating senior resident would be expected to evaluate comprehensively a hypotensive patient and diagnose tension pneumothorax (while calling interventional pulmonary support for needle decompression and chest tube placement) and independently run an ACLS algorithm in the case of an unstable arrhythmia or cardiac arrest.
Residents were also asked to rate their perceived confidence in managing each condition independently on a five-point scale (ranging from “definitely cannot manage this condition independently” to “definitely can manage this condition independently”). We refined the survey instrument through a collaborative, iterative review process, including cognitive interviews and piloting with IM subspecialty fellows.
Participants and Data Collection
All IM residents at the Massachusetts General Hospital were invited to participate in the study. The study was conducted in May 2015 to reflect training throughout the prior academic year(s) and allow us to evaluate graduating residents’ exposures across all prior years of training. The instrument was administered anonymously via a web-based survey tool, Qualtrics (Provo, Utah). The study was approved as exempt by the Partners Institutional Review Board.
Data Analysis
Residents’ self-reported exposure to hospital acute events was classified into the following six ordinal categories: (1) never seen (have never seen the condition under any circumstances); (2) simulation alone (have managed the condition only during a mannequin-simulated patient case); (3) team alone (have managed the condition inpatient as a part of a team of providers, not in a primary leadership role); (4) team plus simulation; (5) independently (have managed the condition inpatient alone or in a primary leadership role); and (6) independently plus simulation. Residents’ self-reported exposure was examined for each postgraduate year (PGY) class both in aggregate and for each individual acute event. We sought to identify events that the majority of residents had managed independently (85% of residents or greater) and less common events that at least 15% of residents had never experienced.
We also examined residents’ self-reported confidence for each PGY class in aggregate and for each clinical acute scenario. Confidence was investigated in a dichotomized manner with a “definitely can” rating indicating “Confident” and with “probably can,” “neutral,” “probably cannot,” or “definitely cannot” ratings indicating “Not Confident” to manage the condition independently. Dichotomization thus allowed us to set a high bar for confidence, reflecting the self-perceived ability of the residents to manage the conditions as future independent physicians.
We used logistic regression models with the generalized estimating equations (GEE) approach to take into account the repeated measures of 50 clinical acute clinical events assessed for each resident. We compared the distribution of self-reported exposure and confidence among different PGY classes and examined the relationship between confidence and self-reported exposure stratified by level of training. We also assessed the independent effect of exposure on confidence controlling for level of training in a multivariable logistic regression model.
RESULTS
A total of 140 of 170 IM residents completed the survey (82% overall response rate: 72% of all PGY-1 residents, 86% of PGY-2 residents, and 89% of PGY-3/4 residents). In total, 41 PGY-1 residents (29% of respondents), 50 PGY-2 residents (36%), and 49 PGY-3 or PGY-4 residents (35%) participated. The majority of residents were in the Categorical IM training track (106 residents, 76% of respondents), whereas the remainder of respondents were in various subspecialty training tracks within our IM residency program, including Primary Care (14 residents, 10%), and four-year tracks, including Global Health (six residents, 4%), and Medicine-Pediatrics (14 residents, 10%).
Assessment of Exposure
Residents reported increasingly independent exposures as they progressed through residency training. PGY-1 residents on average had never seen 16.3% of the 50 acute events, whereas PGY-3/4 residents had never seen only 4.0% of the events (P < .0001). PGY-1 residents had managed 31.3% of events independently (or both independently and in simulation) as opposed to 71.7% of events for PGY-3/4 residents (P < .0001). Simulation alone accounted for a substantial proportion of exposures (16.4%) for PGY-1 residents, but this was significantly lower for PGY-2 or PGY-3/4 residents (P < .0001), who reported a greater percentage of exposures in nonsimulation clinical scenarios either independently or as a part of an inpatient team. There were no outlier residents who reported lower exposure compared with their PGY peers.
There was a wide spectrum of resident-reported exposures when individual acute events were examined (Table, full data in Supplementary Appendix Table 1). Events with the highest levels of exposure, which >85% of PGY-1 residents had managed independently, included alcohol withdrawal, chronic obstructive pulmonary disease exacerbation, rapid atrial fibrillation, agitated delirium, hypertensive urgency, and hyperkalemia. Events with the lowest levels of exposure, which at least 15% of graduating residents had never encountered in the hospital, included the following eight of 50 events (16%): torsades de pointes (51% of PGY-3/4 residents), acute mechanical valve failure (49%), tension pneumothorax (38.8%), use of emergency transcutaneous pacing (38.8%), elevated intracranial pressure (ICP)/herniation (24.5%), aortic dissection (22.4%), cord compression (16.3%), and use of emergency cardioversion (16.3%). Several PGY-3/4 residents had managed several of these events only in mannequin simulations, including torsades de pointes (41%), transcutaneous pacing (33%), and tension pneumothorax (24%).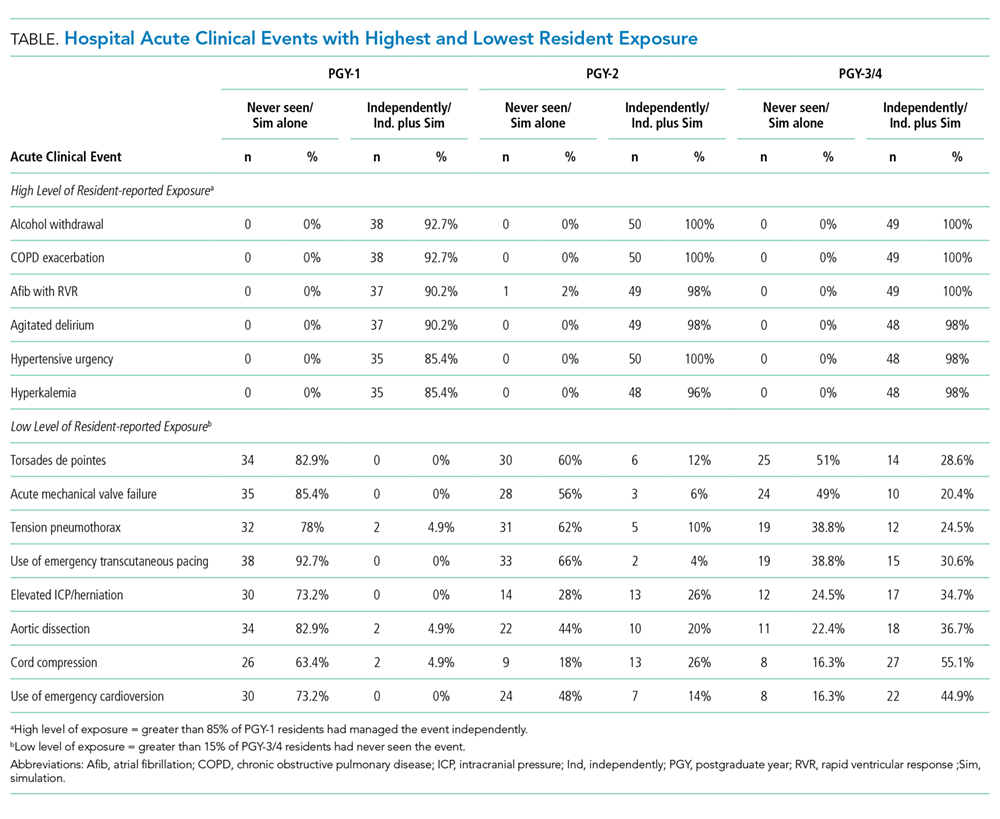
Assessment of Confidence
Both levels of training and exposure to acute events were associated with increased confidence in managing such events. PGY-1 residents felt confident in managing 24.9% of acute events independently, compared to 48.4% of events for PGY-2 residents and 72.5% of events for PGY-3/4 residents (P < .0001). There was considerable variation in confidence among the individual acute events (Supplementary Appendix Table 2). A majority of graduating PGY-3/4 residents did not feel confident in managing the following 10 of the 50 events (20%): use of emergency cardioversion, aortic dissection, thrombotic thrombocytopenic purpura/hemolytic uremic syndrome (TTP/HUS), torsades de pointes, posterior reversible encephalopathy syndrome (PRES), intracranial hemorrhage, use of emergency transcutaneous pacing, tension pneumothorax, elevated ICP/herniation, and acute mechanical valve failure.
Residents’ self-reported confidence also correlated with level of exposure. There was a significant increase in resident confidence with increasingly independent exposure stratified by level of training (Figure; all with P < .0001). In the multivariable logistic regression model, increasing exposure correlated with increased resident confidence (P < .0001) while controlling for PGY year (P = .001).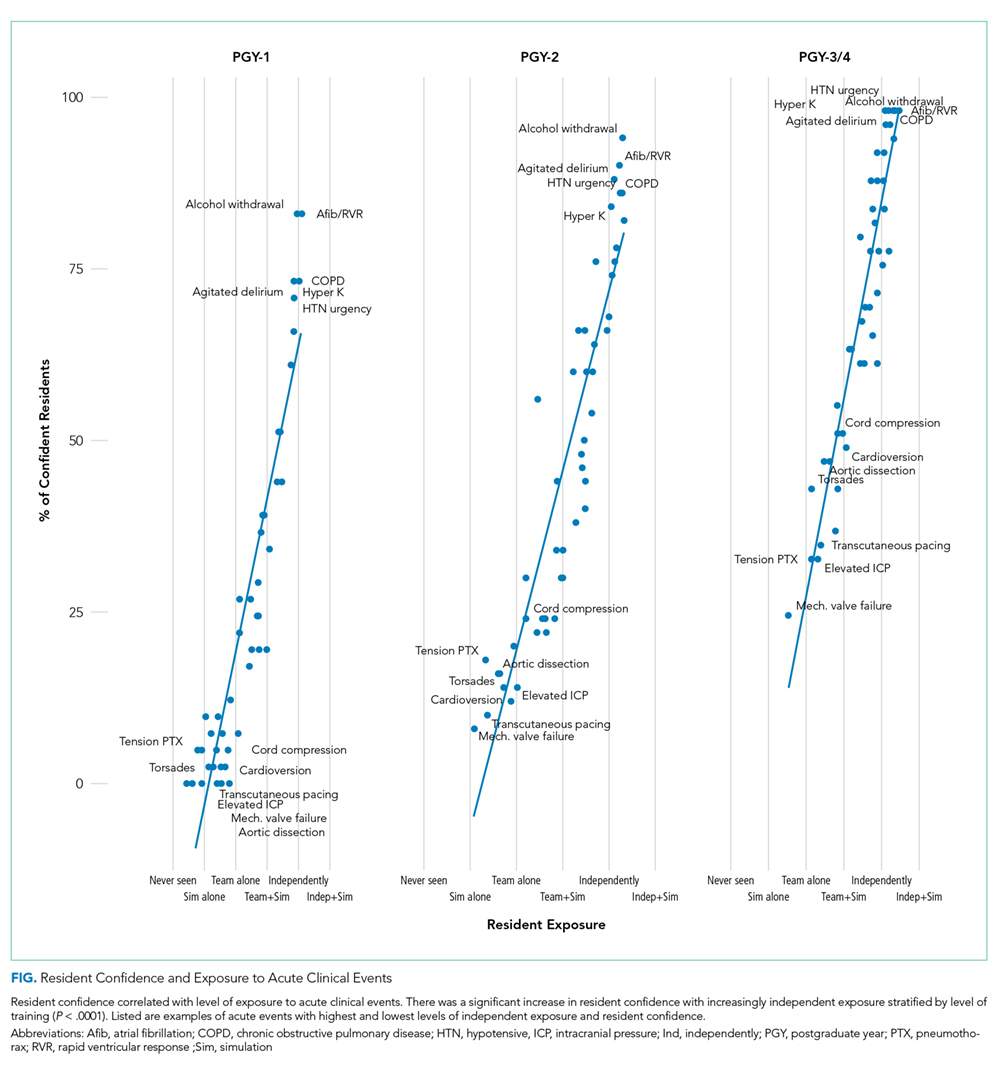
DISCUSSION
We developed an instrument to assess resident exposure to and confidence in managing 50 inpatient acute clinical events. Both exposure and level of training were associated with increasing resident confidence. We identified specific events with low levels of exposure and confidence that could be targeted for educational interventions.
To our knowledge, this is the first study to examine IM residents’ exposure to and confidence in managing a wide range of inpatient acute clinical events. A primary goal of residency is to provide physicians-in-training graduated responsibility to prepare them for eventual independent practice. Although our survey confirmed that IM residents’ exposure and confidence significantly increased as they advanced through training (a not unexpected finding), our data also show that even after controlling for year in training, independent exposures significantly correlated with increased confidence. This speaks to the importance of preserving opportunities for residents to manage critical events in a supported manner, an admittedly challenging prospect given the oft-competing calls for supervision of and mentored feedback for trainees.11
Despite identifying independent exposure as an important factor that impacts resident confidence, we found that there was still a substantial proportion of events (28.3%) that senior medical residents near the end of their training had not managed independently in a primary leadership role. Although our study was not designed to determine the reasons for this varied resident exposure, possible explanations may include the relative rarity of certain acute clinical events compared with others, or less likely the effect of duty hour limitations, attending supervision of trainees, or programmatic changes in resident leadership responsibilities. Whatever the cause, this finding uniquely identifies an area for improvement to prevent new attending physicians from feeling unprepared to manage potentially critical emergencies.
An important goal of our study was to develop an instrument that would enable training programs to identify their learning needs. Both program-wide and individual assessments of resident case exposure and confidence are essential for identifying such learning needs and areas for curricular development. Program-wide assessments can spur an important debate about program goals and requirements with respect to what scenarios residents must be able to manage competently by graduation.12 In addition, such assessments can help individualize learning exposures based on a specific learner’s needs and career goals. The administration of our survey instrument required minimal resources, and the high response rate in our study suggests that other programs can implement our instrument to accomplish these goals.
Alternative methods, such as electronic learning portfolios (efolios), can be utilized to assess resident case exposure. In comparison to our survey instrument, efolios limit recall bias by utilizing case logs and have additional capabilities such as compiling evaluations and enabling trainees to set learning goals. However, there are considerable barriers to the effective use of efolios, including software cost, learner attitudes, and time constraints.13 Tools such as our end-of-year assessment offer an alternative method that limits these barriers.
Once educational growth opportunities have been identified through survey-based or other methods, residency programs must determine how to optimize curricula for the needs and career goals of their trainees. We found considerable overlap among conditions that graduating residents had both limited exposure to and low confidence in managing (eg, torsades de pointes, tension pneumothorax, and emergency cardioversion), which are logical topics for future curriculum development. We also identified a few conditions (including PRES, TTP/HUS, and intracranial hemorrhage) that graduating residents did not feel confident in managing despite a relatively higher reported level of exposure. Whether to focus specific educational interventions on the most rare or most commonly encountered acute clinical events is likely to be a topic of debate among individual training programs, but the results of our survey indicate that there is likely to be educational benefit to both strategies.
Residency programs can employ a variety of modalities to enhance learner exposure and confidence in managing clinical scenarios that are deemed important by the program, including didactics, simulation, and changes in program structure. There is a substantial literature on the use of dedicated curricula for crisis management and the use of simulation as a training tool for responding to acute clinical events in multiple specialties14-24 and in nonmedical domains such as aviation.25-27 Simulation has been shown to improve residents’ clinical skills and comfort level with some acute events28-30 and may even be superior to traditional clinical medical education.31 In addition, programs can utilize targeted clinical experiences such as intensive care unit and subspecialty rotations32,33 in an effort to customize educational interventions to fill identified gaps in learner exposure or confidence.
Our study has several limitations. First, we investigated a single large IM residency program at a quaternary academic medical center, and therefore, our findings may not be externally generalizable to all IM residencies or other medical specialties. Our unique peer-led simulation curriculum, including 16 PGY-1 and 8 PGY-2 cases chosen based on clinical rotations at Massachusetts General Hospital,7 likely impacted residents’ exposure to simulation that is specific to our institution. However, although specific inpatient acute events may vary among other institutions, our finding that graduating residents still reported gaps in their clinical experience is likely generalizable to other programs given the varied and unpredictable nature of ward medicine training. In addition, our survey tool was simple to administer and could be tailored to reflect the acute events and training needs relevant to other residency programs, specialties, and institutions. Second, the retrospective nature of our study may be subject to participants’ recall bias. We did not restrict our survey questions to urgent conditions managed only on IM hospital wards and some may have been experienced in the emergency room or intensive care units; however, these exposures are still relevant as key components of IM training. Third, our list of 50 acute clinical events was intentionally broad and included several conditions that require multidisciplinary subspecialist consultation, which could have impacted residents’ self-report of “independent” exposures. However, these scenarios are ones that hospitalists may independently recognize and stabilize, engaging appropriate specialists. Fourth, we were not able to validate residents’ self-reported exposures against other measures of the frequency of housestaff management of acute events (such as billing data or patient logs) as this information is not routinely collected. We also did not attempt to identify the reasons underlying the variation seen in resident exposure and confidence for individual acute events, but as a needs assessment, this was beyond the scope of our study. Finally, our assessment of resident confidence was subjective and we were not able to assess competence, with prior studies demonstrating conflicting results regarding the relationship between self-reported proficiency and observed competence.34-36 Future studies are needed to investigate whether case exposure assessment leads to changes in residency curricula and whether such curricula increase resident confidence and competence in managing hospital acute clinical events.
CONCLUSION
We developed an easy-to-administer tool to assess IM residents’ exposure to and confidence in managing inpatient acute events. We found that both significantly increased as residents advanced through training, and self-reported confidence additionally correlated with level of exposure independent of PGY class. We identified several specific inpatient acute clinical events with low levels of resident exposure and confidence that can serve as targets for future IM residency curriculum development. Future studies assessing the impact of such curricula on resident confidence and competence are needed.
Disclosures
The authors declare no conflict of interest.
1. ACGME. The Internal Medicine Milestone Project. A joint initiative of the Accreditation Council for Graduate Medical Education and the American Board of Internal Medicine. http://www.acgme.org/Portals/0/PDFs/Milestones/InternalMedicineMilestones.pdf. Accessed July 14, 2018.
2. Neugut AI, Ghatak AT, Miller RL. Anaphylaxis in the United States: an investigation into its epidemiology. Arch Intern Med. 2001;161(1):15-21. PubMed
3. Lin GA, Beck DC, Stewart AL, Garbutt JM. Resident perceptions of the impact of work hour limitations. J Gen Intern Med. 2007;22(7):969-975. PubMed
4. Bolster L, Rourke L. The effect of restricting residents’ duty hours on patient safety, resident well-being, and resident education: an updated systematic review. J Grad Med Educ. 2015;7(3):349-363. PubMed
5. Wayne DB, Hauer KE. Counting quality, not hours: understanding the impact of duty hour reform on internal medicine residency education. J Gen Intern Med. 2012;27(11):1400-1401. PubMed
6. Hayes CW, Rhee A, Detsky ME, Leblanc VR, Wax RS. Residents feel unprepared and unsupervised as leaders of cardiac arrest teams in teaching hospitals: a survey of internal medicine residents. Crit Care Med. 2007;35(7):1668-1672. PubMed
7. Mathai SK, Miloslavsky EM, Contreras-Valdes FM, et al. How we implemented a resident-led medical simulation curriculum in a large internal medicine residency program. Med Teach. 2014;36(4):279-283. PubMed
8. The American Board of Internal Medicine. Internal Medicine Policies. http://www.abim.org/certification/policies/internal-medicine-subspecialty-policies/internal-medicine.aspx. Accessed January 24, 2018.
9. Sinz E, Navarro K, Soderberg ES. Advanced Cardiovascular Life Support. Dallas, TX: American Heart Association; 2011:1-183.
10. Finn KM, Metlay JP, Chang Y, et al. Effect of increased inpatient attending physician supervision on medical errors, patient safety, and resident education: a randomized clinical trial. JAMA Intern Med. 2018;178(7):952-959. PubMed
11. Happel JP, Ritter JB, Neubauer BE. Optimizing the balance between supervision and autonomy in training. JAMA Intern Med. 2018;178(7):959-960. PubMed
12. Fitzgibbons JP, Bordley DR, Berkowitz LR, Miller BW, Henderson MC. Redesigning residency education in internal medicine: a position paper from the association of program directors in internal medicine. Ann Intern Med. 2006;144(12):920. PubMed
13. Dekker H, Driessen E, Braak Ter E, et al. Mentoring portfolio use in undergraduate and postgraduate medical education. Med Teach. 2009;31(10):903-909. PubMed
14. Sica GT, Barron DM, Blum R, Frenna TH, Raemer DB. Computerized realistic simulation: a teaching module for crisis management in radiology. AJR Am J Roentgenol. 1999;172(2):301-304. PubMed
15. DeAnda A, Gaba DM. Role of experience in the response to simulated critical incidents. Anesth Analg. 1991;72(3):308-315. PubMed
16. Gaba DM, Maxwell M, DeAnda A. Anesthetic mishaps. Anesthesiology. 1987;66(5):670-676. PubMed
17. Arora S, Hull L, Fitzpatrick M, Sevdalis N, Birnbach DJ. Crisis management on surgical wards. Ann Surg. 2015;261(5):888-893. PubMed
18. Zirkle M, Blum R, Raemer DB, Healy G, Roberson DW. Teaching emergency airway management using medical simulation: a pilot program. Laryngoscope. 2005;115(3):495-500. PubMed
19. Volk MS, Ward J, Irias N, Navedo A, Pollart J, Weinstock PH. Using medical simulation to teach crisis resource management and decision-making skills to otolaryngology housestaff. Otolaryngol Head Neck Surg. 2011;145(1):35-42. PubMed
20. Bank I, Snell L, Bhanji F. Pediatric crisis resource management training improves emergency medicine trainees’ perceived ability to manage emergencies and ability to identify teamwork errors. Pediatr Emerg Care. 2014;30(12):879-883. PubMed
21. Blackwood J, Duff JP, Nettel-Aguirre A, Djogovic D, Joynt C. Does teaching crisis resource management skills improve resuscitation performance in pediatric residents?. Pediatr Crit Care Med. 2014;15(4):e168-e174. PubMed
22. Daniels K, Lipman S, Harney K, Arafeh J, Druzin M. Use of simulation based team training for obstetric crises in resident education. Simul Healthc. 2008;3(3):154-160. PubMed
23. Isaak RS, Stiegler MP. Review of crisis resource management (CRM) principles in the setting of intraoperative malignant hyperthermia. J Anesth. 2016;30(2):298-306. PubMed
24. Gaba D, DeAnda A. The response of anesthesia trainees to simulated critical incidents. Surv Anesth. 1989;33(6):349. PubMed
25. Ornato JP, Peberdy MA. Applying lessons from commercial aviation safety and operations to resuscitation. Resuscitation. 2014;85(2):173-176. PubMed
26. Hamman WR. Commentary: will simulation fly in medicine as it has in aviation? BMJ Qual Saf. 2004;13(5):397-399. PubMed
27. Littlepage GE, Hein MB, Richard G Moffett I, Craig PA, Georgiou AM. Team training for dynamic cross-functional teams in aviation: behavioral, cognitive, and performance outcomes. Hum Factors. 2016;58(8):1275-1288. PubMed
28. Wayne DB, Butter J, Siddall VJ, et al. Mastery learning of advanced cardiac life support skills by internal medicine residents using simulation technology and deliberate practice. J Gen Intern Med. 2006;21(3):251-256. PubMed
29. Heal
30. Kory PD, Eisen LA, Adachi M, Ribaudo VA, Rosenthal ME, Mayo PH. Initial airway management skills of senior residents. Chest. 2015;132(6):1927-1931. PubMed
31. McGaghie WC, Issenberg SB, Cohen ER, Barsuk JH, Wayne DB. Does simulation-based medical education with deliberate practice yield better results than traditional clinical education? A meta-analytic comparative review of the evidence. Acad Med. 2011;86(6):706-711. PubMed
32. Almoosa KF, Goldenhar LM, Puchalski J, Ying J, Panos RJ. Critical care education during internal medicine residency: a national survey. J Grad Med Educ. 2010;2(4):555-561. PubMed
33. Katz SJ, Oswald AE. How confident are internal medicine residents in rheumatology versus other common internal medicine clinical skills: an issue of training time or exposure? Clin Rheumatol. 2011;30(8):1081-1093. PubMed
34. Barnsley L, Lyon PM, Ralston SJ, et al. Clinical skills in junior medical officers: a comparison of self-reported confidence and observed competence. Med Educ. 2004;38(4):358-367. PubMed
35. Dehmer JJ, Amos KD, Farrell TM, Meyer AA, Newton WP, Meyers MO. Competence and confidence with basic procedural skills: the experience and opinions of fourth-year medical students at a single institution. Acad Med. 2013;88(5):682-687. PubMed
36. Wu EH, Elnicki DM, Alper EJ, et al. Procedural and interpretive skills of medical students: experiences and attitudes of fourth-year students. Acad Med. 2008;83(10):S63-S67. PubMed
Internal Medicine (IM) residency graduates are expected to manage a wide range of acute clinical events.1 Urgent and emergent inpatient situations require a broad knowledge base for rapid bedside diagnosis, yet the essential clinical skills required to manage acute clinical events pose a unique training challenge given the rarity and high-stakes nature of several such emergencies. For example, in three years of residency, a trainee may never have the opportunity to manage anaphylaxis, yet IM graduates must be able to recognize and quickly initiate proper lifesaving treatment for this relatively rare event2 when it does occur.
In an era of work-hour limitations and heightened trainee supervision, residents perceive diminished familiarity with several clinical situations3-5 and may feel unprepared to handle crisis events such as cardiac arrest.6 Given the sporadic nature of clinical medicine, many residents may not be exposed to certain acute inpatient clinical scenarios by the end of their training, a potentially critical education gap. To our knowledge, IM residents’ level of exposure to acute clinical events has not previously been studied. The aims of this study were to develop an instrument aimed at assessing IM residents’ exposure to hospital acute clinical events at a large academic medical center and to investigate the relationship between exposure and confidence in managing these events.
METHODS
Survey Development
We reviewed the Massachusetts General Hospital (MGH) IM residency program curriculum (including simulation, conferences, and other didactics), the American Board of Internal Medicine certification requirements (primarily related to Advanced Cardiac Life Support [ACLS]), and the MGH inpatient rapid response events and gained input from the IM program leadership to develop a list of 50 acute clinical events that a graduating resident may be expected to manage independently (Box 1, Supplementary Appendix).7-9 We then developed a survey assessing residents’ exposure to and confidence in managing such events. To classify the level of exposure, residents were asked to distinguish whether they had managed these events during a simulation session, inpatient as a part of a team, or inpatient independently. At our institution, IM postgraduate year 1 (PGY-1) interns manage a floor of patients overnight under a senior resident’s supervision, PGY-2 residents manage a team of several interns often without attending presence on ward rounds,10 and senior PGY-3 or -4 residents are expected to lead the hospital’s rapid response and code team and triage decompensating patients to the intensive care unit. Therefore, there are ample opportunities for IM residents to manage conditions independently (ie, in a direct leadership role) with attending supervision. House officers’ role in medical management, including calling appropriate subspecialty consultation, depends on the clinical condition; for example, a graduating senior resident would be expected to evaluate comprehensively a hypotensive patient and diagnose tension pneumothorax (while calling interventional pulmonary support for needle decompression and chest tube placement) and independently run an ACLS algorithm in the case of an unstable arrhythmia or cardiac arrest.
Residents were also asked to rate their perceived confidence in managing each condition independently on a five-point scale (ranging from “definitely cannot manage this condition independently” to “definitely can manage this condition independently”). We refined the survey instrument through a collaborative, iterative review process, including cognitive interviews and piloting with IM subspecialty fellows.
Participants and Data Collection
All IM residents at the Massachusetts General Hospital were invited to participate in the study. The study was conducted in May 2015 to reflect training throughout the prior academic year(s) and allow us to evaluate graduating residents’ exposures across all prior years of training. The instrument was administered anonymously via a web-based survey tool, Qualtrics (Provo, Utah). The study was approved as exempt by the Partners Institutional Review Board.
Data Analysis
Residents’ self-reported exposure to hospital acute events was classified into the following six ordinal categories: (1) never seen (have never seen the condition under any circumstances); (2) simulation alone (have managed the condition only during a mannequin-simulated patient case); (3) team alone (have managed the condition inpatient as a part of a team of providers, not in a primary leadership role); (4) team plus simulation; (5) independently (have managed the condition inpatient alone or in a primary leadership role); and (6) independently plus simulation. Residents’ self-reported exposure was examined for each postgraduate year (PGY) class both in aggregate and for each individual acute event. We sought to identify events that the majority of residents had managed independently (85% of residents or greater) and less common events that at least 15% of residents had never experienced.
We also examined residents’ self-reported confidence for each PGY class in aggregate and for each clinical acute scenario. Confidence was investigated in a dichotomized manner with a “definitely can” rating indicating “Confident” and with “probably can,” “neutral,” “probably cannot,” or “definitely cannot” ratings indicating “Not Confident” to manage the condition independently. Dichotomization thus allowed us to set a high bar for confidence, reflecting the self-perceived ability of the residents to manage the conditions as future independent physicians.
We used logistic regression models with the generalized estimating equations (GEE) approach to take into account the repeated measures of 50 clinical acute clinical events assessed for each resident. We compared the distribution of self-reported exposure and confidence among different PGY classes and examined the relationship between confidence and self-reported exposure stratified by level of training. We also assessed the independent effect of exposure on confidence controlling for level of training in a multivariable logistic regression model.
RESULTS
A total of 140 of 170 IM residents completed the survey (82% overall response rate: 72% of all PGY-1 residents, 86% of PGY-2 residents, and 89% of PGY-3/4 residents). In total, 41 PGY-1 residents (29% of respondents), 50 PGY-2 residents (36%), and 49 PGY-3 or PGY-4 residents (35%) participated. The majority of residents were in the Categorical IM training track (106 residents, 76% of respondents), whereas the remainder of respondents were in various subspecialty training tracks within our IM residency program, including Primary Care (14 residents, 10%), and four-year tracks, including Global Health (six residents, 4%), and Medicine-Pediatrics (14 residents, 10%).
Assessment of Exposure
Residents reported increasingly independent exposures as they progressed through residency training. PGY-1 residents on average had never seen 16.3% of the 50 acute events, whereas PGY-3/4 residents had never seen only 4.0% of the events (P < .0001). PGY-1 residents had managed 31.3% of events independently (or both independently and in simulation) as opposed to 71.7% of events for PGY-3/4 residents (P < .0001). Simulation alone accounted for a substantial proportion of exposures (16.4%) for PGY-1 residents, but this was significantly lower for PGY-2 or PGY-3/4 residents (P < .0001), who reported a greater percentage of exposures in nonsimulation clinical scenarios either independently or as a part of an inpatient team. There were no outlier residents who reported lower exposure compared with their PGY peers.
There was a wide spectrum of resident-reported exposures when individual acute events were examined (Table, full data in Supplementary Appendix Table 1). Events with the highest levels of exposure, which >85% of PGY-1 residents had managed independently, included alcohol withdrawal, chronic obstructive pulmonary disease exacerbation, rapid atrial fibrillation, agitated delirium, hypertensive urgency, and hyperkalemia. Events with the lowest levels of exposure, which at least 15% of graduating residents had never encountered in the hospital, included the following eight of 50 events (16%): torsades de pointes (51% of PGY-3/4 residents), acute mechanical valve failure (49%), tension pneumothorax (38.8%), use of emergency transcutaneous pacing (38.8%), elevated intracranial pressure (ICP)/herniation (24.5%), aortic dissection (22.4%), cord compression (16.3%), and use of emergency cardioversion (16.3%). Several PGY-3/4 residents had managed several of these events only in mannequin simulations, including torsades de pointes (41%), transcutaneous pacing (33%), and tension pneumothorax (24%).
Assessment of Confidence
Both levels of training and exposure to acute events were associated with increased confidence in managing such events. PGY-1 residents felt confident in managing 24.9% of acute events independently, compared to 48.4% of events for PGY-2 residents and 72.5% of events for PGY-3/4 residents (P < .0001). There was considerable variation in confidence among the individual acute events (Supplementary Appendix Table 2). A majority of graduating PGY-3/4 residents did not feel confident in managing the following 10 of the 50 events (20%): use of emergency cardioversion, aortic dissection, thrombotic thrombocytopenic purpura/hemolytic uremic syndrome (TTP/HUS), torsades de pointes, posterior reversible encephalopathy syndrome (PRES), intracranial hemorrhage, use of emergency transcutaneous pacing, tension pneumothorax, elevated ICP/herniation, and acute mechanical valve failure.
Residents’ self-reported confidence also correlated with level of exposure. There was a significant increase in resident confidence with increasingly independent exposure stratified by level of training (Figure; all with P < .0001). In the multivariable logistic regression model, increasing exposure correlated with increased resident confidence (P < .0001) while controlling for PGY year (P = .001).
DISCUSSION
We developed an instrument to assess resident exposure to and confidence in managing 50 inpatient acute clinical events. Both exposure and level of training were associated with increasing resident confidence. We identified specific events with low levels of exposure and confidence that could be targeted for educational interventions.
To our knowledge, this is the first study to examine IM residents’ exposure to and confidence in managing a wide range of inpatient acute clinical events. A primary goal of residency is to provide physicians-in-training graduated responsibility to prepare them for eventual independent practice. Although our survey confirmed that IM residents’ exposure and confidence significantly increased as they advanced through training (a not unexpected finding), our data also show that even after controlling for year in training, independent exposures significantly correlated with increased confidence. This speaks to the importance of preserving opportunities for residents to manage critical events in a supported manner, an admittedly challenging prospect given the oft-competing calls for supervision of and mentored feedback for trainees.11
Despite identifying independent exposure as an important factor that impacts resident confidence, we found that there was still a substantial proportion of events (28.3%) that senior medical residents near the end of their training had not managed independently in a primary leadership role. Although our study was not designed to determine the reasons for this varied resident exposure, possible explanations may include the relative rarity of certain acute clinical events compared with others, or less likely the effect of duty hour limitations, attending supervision of trainees, or programmatic changes in resident leadership responsibilities. Whatever the cause, this finding uniquely identifies an area for improvement to prevent new attending physicians from feeling unprepared to manage potentially critical emergencies.
An important goal of our study was to develop an instrument that would enable training programs to identify their learning needs. Both program-wide and individual assessments of resident case exposure and confidence are essential for identifying such learning needs and areas for curricular development. Program-wide assessments can spur an important debate about program goals and requirements with respect to what scenarios residents must be able to manage competently by graduation.12 In addition, such assessments can help individualize learning exposures based on a specific learner’s needs and career goals. The administration of our survey instrument required minimal resources, and the high response rate in our study suggests that other programs can implement our instrument to accomplish these goals.
Alternative methods, such as electronic learning portfolios (efolios), can be utilized to assess resident case exposure. In comparison to our survey instrument, efolios limit recall bias by utilizing case logs and have additional capabilities such as compiling evaluations and enabling trainees to set learning goals. However, there are considerable barriers to the effective use of efolios, including software cost, learner attitudes, and time constraints.13 Tools such as our end-of-year assessment offer an alternative method that limits these barriers.
Once educational growth opportunities have been identified through survey-based or other methods, residency programs must determine how to optimize curricula for the needs and career goals of their trainees. We found considerable overlap among conditions that graduating residents had both limited exposure to and low confidence in managing (eg, torsades de pointes, tension pneumothorax, and emergency cardioversion), which are logical topics for future curriculum development. We also identified a few conditions (including PRES, TTP/HUS, and intracranial hemorrhage) that graduating residents did not feel confident in managing despite a relatively higher reported level of exposure. Whether to focus specific educational interventions on the most rare or most commonly encountered acute clinical events is likely to be a topic of debate among individual training programs, but the results of our survey indicate that there is likely to be educational benefit to both strategies.
Residency programs can employ a variety of modalities to enhance learner exposure and confidence in managing clinical scenarios that are deemed important by the program, including didactics, simulation, and changes in program structure. There is a substantial literature on the use of dedicated curricula for crisis management and the use of simulation as a training tool for responding to acute clinical events in multiple specialties14-24 and in nonmedical domains such as aviation.25-27 Simulation has been shown to improve residents’ clinical skills and comfort level with some acute events28-30 and may even be superior to traditional clinical medical education.31 In addition, programs can utilize targeted clinical experiences such as intensive care unit and subspecialty rotations32,33 in an effort to customize educational interventions to fill identified gaps in learner exposure or confidence.
Our study has several limitations. First, we investigated a single large IM residency program at a quaternary academic medical center, and therefore, our findings may not be externally generalizable to all IM residencies or other medical specialties. Our unique peer-led simulation curriculum, including 16 PGY-1 and 8 PGY-2 cases chosen based on clinical rotations at Massachusetts General Hospital,7 likely impacted residents’ exposure to simulation that is specific to our institution. However, although specific inpatient acute events may vary among other institutions, our finding that graduating residents still reported gaps in their clinical experience is likely generalizable to other programs given the varied and unpredictable nature of ward medicine training. In addition, our survey tool was simple to administer and could be tailored to reflect the acute events and training needs relevant to other residency programs, specialties, and institutions. Second, the retrospective nature of our study may be subject to participants’ recall bias. We did not restrict our survey questions to urgent conditions managed only on IM hospital wards and some may have been experienced in the emergency room or intensive care units; however, these exposures are still relevant as key components of IM training. Third, our list of 50 acute clinical events was intentionally broad and included several conditions that require multidisciplinary subspecialist consultation, which could have impacted residents’ self-report of “independent” exposures. However, these scenarios are ones that hospitalists may independently recognize and stabilize, engaging appropriate specialists. Fourth, we were not able to validate residents’ self-reported exposures against other measures of the frequency of housestaff management of acute events (such as billing data or patient logs) as this information is not routinely collected. We also did not attempt to identify the reasons underlying the variation seen in resident exposure and confidence for individual acute events, but as a needs assessment, this was beyond the scope of our study. Finally, our assessment of resident confidence was subjective and we were not able to assess competence, with prior studies demonstrating conflicting results regarding the relationship between self-reported proficiency and observed competence.34-36 Future studies are needed to investigate whether case exposure assessment leads to changes in residency curricula and whether such curricula increase resident confidence and competence in managing hospital acute clinical events.
CONCLUSION
We developed an easy-to-administer tool to assess IM residents’ exposure to and confidence in managing inpatient acute events. We found that both significantly increased as residents advanced through training, and self-reported confidence additionally correlated with level of exposure independent of PGY class. We identified several specific inpatient acute clinical events with low levels of resident exposure and confidence that can serve as targets for future IM residency curriculum development. Future studies assessing the impact of such curricula on resident confidence and competence are needed.
Disclosures
The authors declare no conflict of interest.
1. ACGME. The Internal Medicine Milestone Project. A joint initiative of the Accreditation Council for Graduate Medical Education and the American Board of Internal Medicine. http://www.acgme.org/Portals/0/PDFs/Milestones/InternalMedicineMilestones.pdf. Accessed July 14, 2018.
2. Neugut AI, Ghatak AT, Miller RL. Anaphylaxis in the United States: an investigation into its epidemiology. Arch Intern Med. 2001;161(1):15-21. PubMed
3. Lin GA, Beck DC, Stewart AL, Garbutt JM. Resident perceptions of the impact of work hour limitations. J Gen Intern Med. 2007;22(7):969-975. PubMed
4. Bolster L, Rourke L. The effect of restricting residents’ duty hours on patient safety, resident well-being, and resident education: an updated systematic review. J Grad Med Educ. 2015;7(3):349-363. PubMed
5. Wayne DB, Hauer KE. Counting quality, not hours: understanding the impact of duty hour reform on internal medicine residency education. J Gen Intern Med. 2012;27(11):1400-1401. PubMed
6. Hayes CW, Rhee A, Detsky ME, Leblanc VR, Wax RS. Residents feel unprepared and unsupervised as leaders of cardiac arrest teams in teaching hospitals: a survey of internal medicine residents. Crit Care Med. 2007;35(7):1668-1672. PubMed
7. Mathai SK, Miloslavsky EM, Contreras-Valdes FM, et al. How we implemented a resident-led medical simulation curriculum in a large internal medicine residency program. Med Teach. 2014;36(4):279-283. PubMed
8. The American Board of Internal Medicine. Internal Medicine Policies. http://www.abim.org/certification/policies/internal-medicine-subspecialty-policies/internal-medicine.aspx. Accessed January 24, 2018.
9. Sinz E, Navarro K, Soderberg ES. Advanced Cardiovascular Life Support. Dallas, TX: American Heart Association; 2011:1-183.
10. Finn KM, Metlay JP, Chang Y, et al. Effect of increased inpatient attending physician supervision on medical errors, patient safety, and resident education: a randomized clinical trial. JAMA Intern Med. 2018;178(7):952-959. PubMed
11. Happel JP, Ritter JB, Neubauer BE. Optimizing the balance between supervision and autonomy in training. JAMA Intern Med. 2018;178(7):959-960. PubMed
12. Fitzgibbons JP, Bordley DR, Berkowitz LR, Miller BW, Henderson MC. Redesigning residency education in internal medicine: a position paper from the association of program directors in internal medicine. Ann Intern Med. 2006;144(12):920. PubMed
13. Dekker H, Driessen E, Braak Ter E, et al. Mentoring portfolio use in undergraduate and postgraduate medical education. Med Teach. 2009;31(10):903-909. PubMed
14. Sica GT, Barron DM, Blum R, Frenna TH, Raemer DB. Computerized realistic simulation: a teaching module for crisis management in radiology. AJR Am J Roentgenol. 1999;172(2):301-304. PubMed
15. DeAnda A, Gaba DM. Role of experience in the response to simulated critical incidents. Anesth Analg. 1991;72(3):308-315. PubMed
16. Gaba DM, Maxwell M, DeAnda A. Anesthetic mishaps. Anesthesiology. 1987;66(5):670-676. PubMed
17. Arora S, Hull L, Fitzpatrick M, Sevdalis N, Birnbach DJ. Crisis management on surgical wards. Ann Surg. 2015;261(5):888-893. PubMed
18. Zirkle M, Blum R, Raemer DB, Healy G, Roberson DW. Teaching emergency airway management using medical simulation: a pilot program. Laryngoscope. 2005;115(3):495-500. PubMed
19. Volk MS, Ward J, Irias N, Navedo A, Pollart J, Weinstock PH. Using medical simulation to teach crisis resource management and decision-making skills to otolaryngology housestaff. Otolaryngol Head Neck Surg. 2011;145(1):35-42. PubMed
20. Bank I, Snell L, Bhanji F. Pediatric crisis resource management training improves emergency medicine trainees’ perceived ability to manage emergencies and ability to identify teamwork errors. Pediatr Emerg Care. 2014;30(12):879-883. PubMed
21. Blackwood J, Duff JP, Nettel-Aguirre A, Djogovic D, Joynt C. Does teaching crisis resource management skills improve resuscitation performance in pediatric residents?. Pediatr Crit Care Med. 2014;15(4):e168-e174. PubMed
22. Daniels K, Lipman S, Harney K, Arafeh J, Druzin M. Use of simulation based team training for obstetric crises in resident education. Simul Healthc. 2008;3(3):154-160. PubMed
23. Isaak RS, Stiegler MP. Review of crisis resource management (CRM) principles in the setting of intraoperative malignant hyperthermia. J Anesth. 2016;30(2):298-306. PubMed
24. Gaba D, DeAnda A. The response of anesthesia trainees to simulated critical incidents. Surv Anesth. 1989;33(6):349. PubMed
25. Ornato JP, Peberdy MA. Applying lessons from commercial aviation safety and operations to resuscitation. Resuscitation. 2014;85(2):173-176. PubMed
26. Hamman WR. Commentary: will simulation fly in medicine as it has in aviation? BMJ Qual Saf. 2004;13(5):397-399. PubMed
27. Littlepage GE, Hein MB, Richard G Moffett I, Craig PA, Georgiou AM. Team training for dynamic cross-functional teams in aviation: behavioral, cognitive, and performance outcomes. Hum Factors. 2016;58(8):1275-1288. PubMed
28. Wayne DB, Butter J, Siddall VJ, et al. Mastery learning of advanced cardiac life support skills by internal medicine residents using simulation technology and deliberate practice. J Gen Intern Med. 2006;21(3):251-256. PubMed
29. Heal
30. Kory PD, Eisen LA, Adachi M, Ribaudo VA, Rosenthal ME, Mayo PH. Initial airway management skills of senior residents. Chest. 2015;132(6):1927-1931. PubMed
31. McGaghie WC, Issenberg SB, Cohen ER, Barsuk JH, Wayne DB. Does simulation-based medical education with deliberate practice yield better results than traditional clinical education? A meta-analytic comparative review of the evidence. Acad Med. 2011;86(6):706-711. PubMed
32. Almoosa KF, Goldenhar LM, Puchalski J, Ying J, Panos RJ. Critical care education during internal medicine residency: a national survey. J Grad Med Educ. 2010;2(4):555-561. PubMed
33. Katz SJ, Oswald AE. How confident are internal medicine residents in rheumatology versus other common internal medicine clinical skills: an issue of training time or exposure? Clin Rheumatol. 2011;30(8):1081-1093. PubMed
34. Barnsley L, Lyon PM, Ralston SJ, et al. Clinical skills in junior medical officers: a comparison of self-reported confidence and observed competence. Med Educ. 2004;38(4):358-367. PubMed
35. Dehmer JJ, Amos KD, Farrell TM, Meyer AA, Newton WP, Meyers MO. Competence and confidence with basic procedural skills: the experience and opinions of fourth-year medical students at a single institution. Acad Med. 2013;88(5):682-687. PubMed
36. Wu EH, Elnicki DM, Alper EJ, et al. Procedural and interpretive skills of medical students: experiences and attitudes of fourth-year students. Acad Med. 2008;83(10):S63-S67. PubMed
© 2019 Society of Hospital Medicine
Smoking Cessation after Hospital Discharge: Factors Associated with Abstinence
Cigarette smoking is the leading cause of preventable deaths in the United States.1 Smoking contributes to several health problems that require hospitalization. Hospitalization also offers smokers an opportunity to quit because hospital policies prohibit smoking indoors while a health threat increases the motivation to quit.2 Brief bedside smoking cessation counseling with follow-up contact after discharge increases postdischarge tobacco abstinence rates by 37%.2 Identifying the characteristics of patients who are most likely to stop smoking after hospital discharge could identify strategies for interventions to help more smokers to succeed. It could also guide hospital clinicians’ efforts to provide effective brief messages to promote cessation by inpatients under their care during this teachable moment.
Sociodemographic factors, tobacco use, and psychological and medical factors have been associated with successful quit attempts by smokers in the general population.3,4 Far less is known about the predictors of success in quitting smoking and maintaining abstinence after hospitalization. The characteristics associated with abstinence at postdischarge follow-up in prior studies of hospitalized smokers were male gender, greater confidence in quitting, greater readiness to quit, less nicotine dependence, and having a smoking-related illness.5-8 However, most of the prior studies were limited to 1 geographic region,5,6 focused only on a specific subgroup (eg, coronary patients9), or did not biochemically verify tobacco abstinence.8 In fact, to our knowledge, only one prior study has examined the predictors of quitting among a broad sample of hospital patients enrolled across multiple hospitals and biochemically verified abstinence.6 That study was conducted nearly two decades ago in one Midwestern state.
Thus, the present study aimed to identify factors independently associated with sustained postdischarge tobacco abstinence among hospitalized smokers who planned to quit smoking.10 Building on previous work, this study includes a large number of smokers with varied diagnoses admitted to one of three hospitals in two states, uses biochemically verified abstinence as the outcome measure, and examines multiple variables that were identified during the inpatient stay. We hypothesize that consistent with prior literature on this topic, factors independently associated with cessation in the present study will include confidence and intention to quit, degree of nicotine dependence, and a discharge diagnosis of a smoking-related disease.
METHODS
We analyzed data from the Helping HAND2 Trial (HH2; NCT01714323), a randomized clinical trial conducted at the following three hospitals: Massachusetts General Hospital (MGH) in Boston, MA; University of Pittsburgh Medical Center (UPMC) in Pittsburgh, PA; and North Shore Medical Center (NSMC) in Salem, MA. Enrollment occurred from December 2012 to July 2014. The study methodology has been reported elsewhere.11 This study was approved by the Institutional Review Boards of Partners HealthCare and University of Pittsburgh.
PARTICIPANTS
Hospital inpatients were eligible for enrollment if they were
- >18 years old, daily smokers, received smoking cessation counseling in the hospital (ie, standard of care for inpatient smokers), and planned to quit or try to quit smoking after discharge. Exclusion criteria included no access to a telephone, not speaking English, psychiatric or cognitive impairment, medical instability, or admission to obstetric or psychiatric units. All participants were offered nicotine replacement and one counseling session by a tobacco treatment specialist during hospitalization.
STUDY CONDITIONS
Participants were enrolled before discharge and randomly assigned to Sustained Care (Intervention) or Standard Care (Control) conditions.10,11 In the Standard Care condition, participants received advice to call a free telephone quit line and a tailored recommendation for postdischarge pharmacotherapy. Participants randomized to Sustained Care received a free 30-day supply of their choice of FDA-approved tobacco cessation pharmacotherapy at hospital discharge (refillable twice) and five automated interactive voice response calls over three months postdischarge to allow them to access counseling or refill medications.
MEASURES
Baseline Demographic and Smoking Characteristics
A baseline survey assessed demographic variables (age, gender, race/ethnicity, education), tobacco use (cigarettes smoked per day, time to first morning cigarette,12 other tobacco use, and prior quit attempts), intention to quit after discharge (ie,“What is your plan about smoking after you leave the hospital,” with the intent measured across four categorical response options), perceived importance of and confidence in quitting after discharge (five-point Likert scales ranging from “not at all” to “very”), and the presence of another smoker at home. Depression and anxiety symptoms were assessed using the Patient Health Questionnaire (PHQ-413). Alcohol use (AUDIT-C14) and past-year use of cocaine, stimulants, opioids, and marijuana were also measured. Health insurance, length of stay, and primary discharge diagnoses were abstracted from the medical record. Smoking-related disease categories were derived from the 2014 U.S. Surgeon General’s Report.1
Follow-up Assessment
Telephone surveys were administered by the research staff sixmonths after hospital discharge. Participants who reported past seven-day tobacco abstinence (ie, abstinence from tobacco for the past seven days reported at the 6-month call) were asked to provide a mailed saliva sample to assay for cotinine, a nicotine metabolite, to verify self-reported abstinence. Participants who reported nicotine replacement therapy use were asked to provide an in-person measurement of expired air carbon monoxide (CO) instead. Self-reported abstinence was biochemically verified if saliva cotinine was <10 ng/ml or if CO was <9 ppm.11
Outcomes
The dependent variable, consistent with the parent trial, was biochemically confirmed past seven-day tobacco abstinence at six-month follow-up. Nonrespondents and those failing to provide a sample for confirmation were considered as smokers. In addition, a sensitivity analysis used complete cases only, excluding cases with missing smoking status outcomes.
Analysis
Bivariate associations of baseline predictor variables and biochemically confirmed abstinence were examined using chi-square tests for categorical variables and t tests or Wilcoxon rank sum tests for continuous variables. Using multiple logistic regression analyses, we identified variables that were independently associated with confirmed abstinence. The final models included all factors that were associated with cessation in the bivariate analysis (P < .10), factors associated with abstinence in the literature regardless of statistical significance (gender, AUDIT-C score),4 study site, and study condition. A two-sided p value of <.05 was considered to be statistically significant. Analyses were conducted using SAS version 9.4 (SAS Institute, Cary, NC).
RESULTS
Baseline characteristics of the 1,357 smokers enrolled in the trial are reported in Table 1. One-third of participants had a smoking-related discharge diagnosis. The median self-reported confidence in quitting was three on a five-point scale, and nearly half of the participants reported planning to stay abstinent after discharge. At six-month follow-up, 75% of participants completed the assessment, and seven-day tobacco abstinence was reported by 389 participants (29%) and biochemically confirmed in 218 participants (16%).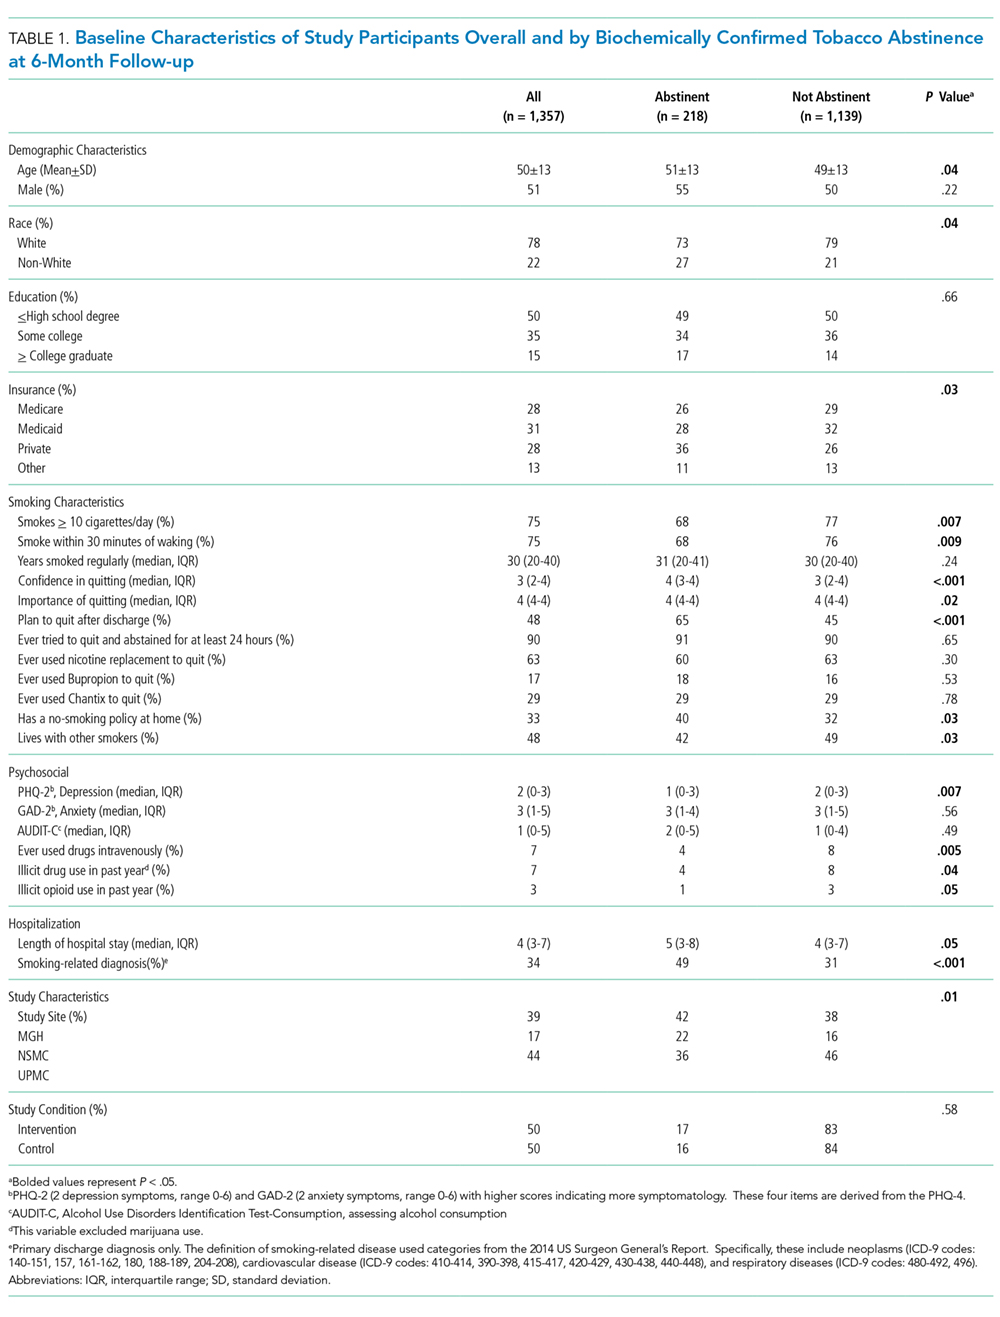
Results of the multiple logistic regression analysis predicting biochemically confirmed abstinence at six months are presented in Table 2. Factors independently associated with confirmed abstinence were a smoking-related primary discharge diagnosis (AOR = 1.98, 95% CI: 1.41-2.77), greater confidence in the ability to quit smoking (AOR = 1.31, 95% CI: 1.07-1.60), and stronger intention to quit (plan to stay abstinent after discharge vs. try to stay abstinent; AOR = 1.68, 95% CI: 1.19-2.38). Similar variables emerged as independent predictors of abstinence when the analysis was limited to complete cases, with an exception that one additional predictor, time to first cigarette after 30 minutes of waking, had statistical significance at the 0.05 level (Table 2).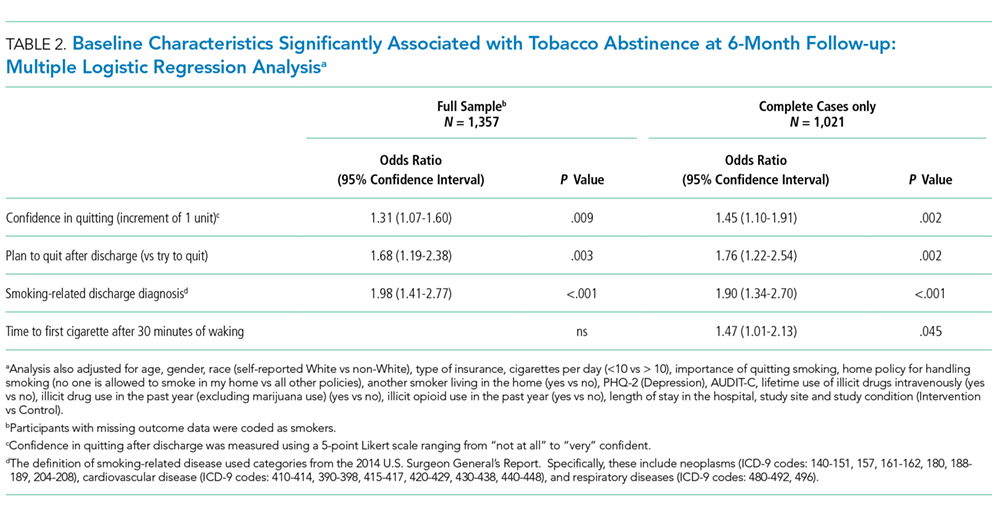
DISCUSSION
We examined the associations between factors that were identifiable in the hospital and postdischarge tobacco abstinence among a general sample of hospitalized patients enrolled in a smoking cessation trial. The odds of biochemically confirmed abstinence at six months were higher among participants who reported higher levels of confidence in quitting smoking, those reporting having a definite plan to quit (vs. try to) after discharge, and those with a smoking-related primary discharge diagnosis.
Our findings are largely consistent with the prior literature on this topic, which has demonstrated that increased confidence in quitting, having a plan to quit smoking, and the presence of a smoking-related disease are associated with quit success at follow-up among hospital patients as well as in the general adult population.3-7 Our finding that nicotine dependence predicted quit success in the complete case analysis, but not when imputing smoking status, aligns with prior studies of hospitalized smokers, which have shown an inconclusive relationship between nicotine dependence and quit success.6,8 Despite a clear relationship of dependence to quit success among adult smokers, evidence in the hospital literature has been inconsistent. This inconsistency is likely due to the differing interventions across studies (eg, counseling vs. pharmacotherapy), the differing outcome variables (eg, self-report vs. biochemically verified), as well as the different patient populations selected to participate.
Unfortunately, smoking cessation is infrequently addressed in routine health care settings,15,16 highlighting a gap in care. For example, one survey study16 found that while many health care professionals report asking about smoking status and advising smokers to quit, fewer clinicians assess smokers’ interest or intention to stop smoking, assist with cessation, or arrange follow-up. Our results indicate that assessing an inpatient smoker’s intentions, motivation, and confidence for cessation and attempting to improve low levels of these factors could enhance cessation success. Because motivation is a malleable construct, repeated assessment by hospital clinicians of a patient’s motivation and confidence to quit is needed.
Our results also confirm that inpatient efforts to improve smoking cessation postdischarge should target smokers’ resolve to quit and confidence in the ability to succeed. Motivational interventions and cognitive-behavioral therapy are effective strategies that can resolve ambivalence and increase confidence to quit and should be components of brief interventions delivered in inpatient settings.17,18 Although individuals with a smoking-related illness may already possess some resolve to quit based on their illness, they may be candidates for interventions focused primarily on developing self-efficacy. Indeed, supporting self-efficacy is a major goal of effective bedside counseling and can be bolstered via problem-solving, motivational techniques, and education about pharmacotherapy during a tobacco-specific consult such as the one that these participants experienced. Armed with these resources, smokers with and without a smoking-related disease may be more likely to execute a plan to quit after discharge.
A study limitation is that our results can be generalized only to hospital inpatients who were willing to try to quit smoking after discharge, because the parent trial excluded smokers with lower levels of motivation. Similarly, these results may not be generalizable to obstetric or psychiatric inpatients, who were excluded from this trial.
In conclusion, our results underscore the importance of assessing motivation and self-efficacy in hospitalized smokers and targeting these factors in intervention efforts. Although future research should aim to identify better methods to alter these factors, in the short run, hospital clinicians could target these factors when discussing tobacco use with inpatient smokers.
Acknowledgments
The authors are grateful for the hard work of MGH, NSMC, and UPMC’s tobacco treatment services, the hospital providers, and study research staff.
Disclosures
Drs. Rigotti and Park received royalties from UpToDate and have received a research grant from Pfizer regarding smoking cessation. Dr. Rigotti has consulted (without pay) for Pfizer. Dr. Singer has served as a consultant to Pfizer but on a topic separate from smoking cessation. No other authors have conflicts of interest to disclose.
Role of Funding Source: The study was funded by NIH/NHLBI [grant #R01-HL11821]. The funding organization had no role in the study design, collection, analysis, and interpretation of the data, preparation of the manuscript, or decision to submit the manuscript for publication.
Clinical Trial Registration: NCT01714323
1. U.S. Department of Health and Human Services. The Health Consequences of Smoking—50 Years of Progress: A Report of the Surgeon General, 2014 | SurgeonGeneral.Gov. Office on Smoking and Health: Centers for Disease Control and Prevention; 2014:944. http://www.surgeongeneral.gov/library/reports/50-years-of-progress/index.html. Accessed May 22, 2016.
2. Rigotti NA, Clair C, Munafò MR, Stead LF. Interventions for smoking cessation in hospitalised patients. Cochrane Database Syst Rev. 2012;(5):CD001837. 10.1002/14651858.CD001837.pub3 PubMed
3. Vangeli E, Stapleton J, Smit ES, Borland R, West R. Predictors of attempts to stop smoking and their success in adult general population samples: a systematic review. Addict Abingdon Engl. 2011;106(12):2110-2121. 10.1111/j.1360-0443.2011.03565.x PubMed
4. Ockene JK, Emmons KM, Mermelstein RJ, et al. Relapse and maintenance issues for smoking cessation. Health Psychol. 2000;19(1S):17-31. 10.1037/0278-6133.19.Suppl1.17 PubMed
5. Harrington K, Young-Il K, Meifang C, et al. Web-based intervention for transitioning smokers from inpatient to outpatient care: an RCT. Am J Prev Med. 2016;51(4):620-629. 10.1016/j.amepre.2016.04.008 PubMed
6. Lando H, Hennrikus D, McCarty M, Vessey J. Predictors of quitting in hospitalized smokers. Nicotine Tob Res. 2003;5(2):215-222. 10.1080/0955300031000083436 PubMed
7. Hennrikus DJ, Lando HA, McCarty MC, et al. The TEAM project: the effectiveness of smoking cessation intervention with hospital patients. Prev Med. 2005;40(3):249-258. 10.1016/j.ypmed.2004.05.030 PubMed
8. MacKenzie TD, Pereira RI, Mehler PS. Smoking abstinence after hospitalization: predictors of success. Prev Med. 2004;39(6):1087-1092. 10.1016/j.ypmed.2004.04.054 PubMed
9. Holtrop JS, Stommel M, Corser W, Holmes-Rovner M. Predictors of smoking cessation and relapse after hospitalization for acute coronary syndrome. J Hosp Med. 2009;4(3):E3-E9. 10.1002/jhm.415 PubMed
10. Rigotti NA, Tindle HA, Regan S, et al. A post-discharge smoking-cessation intervention for hospital patients: helping Hand 2 randomized clinical trial. Am J Prev Med. 2016;51(4):597-608. 10.1016/j.amepre.2016.04.005 PubMed
11. Reid ZZ, Regan S, Kelley JHK, et al. Comparative effectiveness of post-discharge strategies for hospitalized smokers: study protocol for the helping HAND 2 randomized controlled trial. BMC Public Health. 2015;15:109. 10.1186/s12889-015-1484-0 PubMed
12. Heatherton TF, Kozlowski LT, Frecker RC, Rickert W, Robinson J. Measuring the heaviness of smoking: using self-reported time to the first cigarette of the day and number of cigarettes smoked per day. Br J Addict. 1989;84(7):791-799. http://dx.doi.org/10.1111/j.1360-0443.1989.tb03059.x PubMed
13. Melchior LA, Huba GJ, Brown VB, Reback CJ. A short depression index for women. Educ Psychol Meas. 1993;53(4):1117-1125. 10.1177/0013164493053004024
14. Bush K, Kivlahan DR, McDonell MB, Fihn SD, Bradley KA. The AUDIT alcohol consumption questions (AUDIT-C): an effective brief screening test for problem drinking. Ambulatory Care Quality Improvement Project (ACQUIP). Alcohol Use Disorders Identification Test. Arch Intern Med. 1998;158(16):1789-1795. 10.1001/archinte.158.16.1789 PubMed
15. Kruger J, Shaw L, Kahende J, Frank E. Health care providers’ advice to quit smoking, National Health Interview Survey, 2000, 2005, and 2010. Prev Chronic Dis. 2012;9:E130. 10.5888/pcd9.110340 PubMed
16. Tong EK, Strouse R, Hall J, Kovac M, Schroeder SA. National survey of U.S. health professionals’ smoking prevalence, cessation practices, and beliefs. Nicotine Tob Res. 2010;12(7):724-733. 10.1093/ntr/ntq071 PubMed
17. Lindson-Hawley N, Thompson TP, Begh R. Motivational interviewing for smoking cessation. Cochrane Database Syst Rev. 2015;(3):CD006936. 10.1002/14651858.CD006936.pub3 PubMed
18. Hendricks PS, Delucchi KL, Hall SM. Mechanisms of change in extended cognitive behavioral treatment for tobacco dependence. Drug Alcohol Depend. 2010;109(1-3):114-119. 10.1016/j.drugalcdep.2009.12.021 PubMed
Cigarette smoking is the leading cause of preventable deaths in the United States.1 Smoking contributes to several health problems that require hospitalization. Hospitalization also offers smokers an opportunity to quit because hospital policies prohibit smoking indoors while a health threat increases the motivation to quit.2 Brief bedside smoking cessation counseling with follow-up contact after discharge increases postdischarge tobacco abstinence rates by 37%.2 Identifying the characteristics of patients who are most likely to stop smoking after hospital discharge could identify strategies for interventions to help more smokers to succeed. It could also guide hospital clinicians’ efforts to provide effective brief messages to promote cessation by inpatients under their care during this teachable moment.
Sociodemographic factors, tobacco use, and psychological and medical factors have been associated with successful quit attempts by smokers in the general population.3,4 Far less is known about the predictors of success in quitting smoking and maintaining abstinence after hospitalization. The characteristics associated with abstinence at postdischarge follow-up in prior studies of hospitalized smokers were male gender, greater confidence in quitting, greater readiness to quit, less nicotine dependence, and having a smoking-related illness.5-8 However, most of the prior studies were limited to 1 geographic region,5,6 focused only on a specific subgroup (eg, coronary patients9), or did not biochemically verify tobacco abstinence.8 In fact, to our knowledge, only one prior study has examined the predictors of quitting among a broad sample of hospital patients enrolled across multiple hospitals and biochemically verified abstinence.6 That study was conducted nearly two decades ago in one Midwestern state.
Thus, the present study aimed to identify factors independently associated with sustained postdischarge tobacco abstinence among hospitalized smokers who planned to quit smoking.10 Building on previous work, this study includes a large number of smokers with varied diagnoses admitted to one of three hospitals in two states, uses biochemically verified abstinence as the outcome measure, and examines multiple variables that were identified during the inpatient stay. We hypothesize that consistent with prior literature on this topic, factors independently associated with cessation in the present study will include confidence and intention to quit, degree of nicotine dependence, and a discharge diagnosis of a smoking-related disease.
METHODS
We analyzed data from the Helping HAND2 Trial (HH2; NCT01714323), a randomized clinical trial conducted at the following three hospitals: Massachusetts General Hospital (MGH) in Boston, MA; University of Pittsburgh Medical Center (UPMC) in Pittsburgh, PA; and North Shore Medical Center (NSMC) in Salem, MA. Enrollment occurred from December 2012 to July 2014. The study methodology has been reported elsewhere.11 This study was approved by the Institutional Review Boards of Partners HealthCare and University of Pittsburgh.
PARTICIPANTS
Hospital inpatients were eligible for enrollment if they were
- >18 years old, daily smokers, received smoking cessation counseling in the hospital (ie, standard of care for inpatient smokers), and planned to quit or try to quit smoking after discharge. Exclusion criteria included no access to a telephone, not speaking English, psychiatric or cognitive impairment, medical instability, or admission to obstetric or psychiatric units. All participants were offered nicotine replacement and one counseling session by a tobacco treatment specialist during hospitalization.
STUDY CONDITIONS
Participants were enrolled before discharge and randomly assigned to Sustained Care (Intervention) or Standard Care (Control) conditions.10,11 In the Standard Care condition, participants received advice to call a free telephone quit line and a tailored recommendation for postdischarge pharmacotherapy. Participants randomized to Sustained Care received a free 30-day supply of their choice of FDA-approved tobacco cessation pharmacotherapy at hospital discharge (refillable twice) and five automated interactive voice response calls over three months postdischarge to allow them to access counseling or refill medications.
MEASURES
Baseline Demographic and Smoking Characteristics
A baseline survey assessed demographic variables (age, gender, race/ethnicity, education), tobacco use (cigarettes smoked per day, time to first morning cigarette,12 other tobacco use, and prior quit attempts), intention to quit after discharge (ie,“What is your plan about smoking after you leave the hospital,” with the intent measured across four categorical response options), perceived importance of and confidence in quitting after discharge (five-point Likert scales ranging from “not at all” to “very”), and the presence of another smoker at home. Depression and anxiety symptoms were assessed using the Patient Health Questionnaire (PHQ-413). Alcohol use (AUDIT-C14) and past-year use of cocaine, stimulants, opioids, and marijuana were also measured. Health insurance, length of stay, and primary discharge diagnoses were abstracted from the medical record. Smoking-related disease categories were derived from the 2014 U.S. Surgeon General’s Report.1
Follow-up Assessment
Telephone surveys were administered by the research staff sixmonths after hospital discharge. Participants who reported past seven-day tobacco abstinence (ie, abstinence from tobacco for the past seven days reported at the 6-month call) were asked to provide a mailed saliva sample to assay for cotinine, a nicotine metabolite, to verify self-reported abstinence. Participants who reported nicotine replacement therapy use were asked to provide an in-person measurement of expired air carbon monoxide (CO) instead. Self-reported abstinence was biochemically verified if saliva cotinine was <10 ng/ml or if CO was <9 ppm.11
Outcomes
The dependent variable, consistent with the parent trial, was biochemically confirmed past seven-day tobacco abstinence at six-month follow-up. Nonrespondents and those failing to provide a sample for confirmation were considered as smokers. In addition, a sensitivity analysis used complete cases only, excluding cases with missing smoking status outcomes.
Analysis
Bivariate associations of baseline predictor variables and biochemically confirmed abstinence were examined using chi-square tests for categorical variables and t tests or Wilcoxon rank sum tests for continuous variables. Using multiple logistic regression analyses, we identified variables that were independently associated with confirmed abstinence. The final models included all factors that were associated with cessation in the bivariate analysis (P < .10), factors associated with abstinence in the literature regardless of statistical significance (gender, AUDIT-C score),4 study site, and study condition. A two-sided p value of <.05 was considered to be statistically significant. Analyses were conducted using SAS version 9.4 (SAS Institute, Cary, NC).
RESULTS
Baseline characteristics of the 1,357 smokers enrolled in the trial are reported in Table 1. One-third of participants had a smoking-related discharge diagnosis. The median self-reported confidence in quitting was three on a five-point scale, and nearly half of the participants reported planning to stay abstinent after discharge. At six-month follow-up, 75% of participants completed the assessment, and seven-day tobacco abstinence was reported by 389 participants (29%) and biochemically confirmed in 218 participants (16%).
Results of the multiple logistic regression analysis predicting biochemically confirmed abstinence at six months are presented in Table 2. Factors independently associated with confirmed abstinence were a smoking-related primary discharge diagnosis (AOR = 1.98, 95% CI: 1.41-2.77), greater confidence in the ability to quit smoking (AOR = 1.31, 95% CI: 1.07-1.60), and stronger intention to quit (plan to stay abstinent after discharge vs. try to stay abstinent; AOR = 1.68, 95% CI: 1.19-2.38). Similar variables emerged as independent predictors of abstinence when the analysis was limited to complete cases, with an exception that one additional predictor, time to first cigarette after 30 minutes of waking, had statistical significance at the 0.05 level (Table 2).
DISCUSSION
We examined the associations between factors that were identifiable in the hospital and postdischarge tobacco abstinence among a general sample of hospitalized patients enrolled in a smoking cessation trial. The odds of biochemically confirmed abstinence at six months were higher among participants who reported higher levels of confidence in quitting smoking, those reporting having a definite plan to quit (vs. try to) after discharge, and those with a smoking-related primary discharge diagnosis.
Our findings are largely consistent with the prior literature on this topic, which has demonstrated that increased confidence in quitting, having a plan to quit smoking, and the presence of a smoking-related disease are associated with quit success at follow-up among hospital patients as well as in the general adult population.3-7 Our finding that nicotine dependence predicted quit success in the complete case analysis, but not when imputing smoking status, aligns with prior studies of hospitalized smokers, which have shown an inconclusive relationship between nicotine dependence and quit success.6,8 Despite a clear relationship of dependence to quit success among adult smokers, evidence in the hospital literature has been inconsistent. This inconsistency is likely due to the differing interventions across studies (eg, counseling vs. pharmacotherapy), the differing outcome variables (eg, self-report vs. biochemically verified), as well as the different patient populations selected to participate.
Unfortunately, smoking cessation is infrequently addressed in routine health care settings,15,16 highlighting a gap in care. For example, one survey study16 found that while many health care professionals report asking about smoking status and advising smokers to quit, fewer clinicians assess smokers’ interest or intention to stop smoking, assist with cessation, or arrange follow-up. Our results indicate that assessing an inpatient smoker’s intentions, motivation, and confidence for cessation and attempting to improve low levels of these factors could enhance cessation success. Because motivation is a malleable construct, repeated assessment by hospital clinicians of a patient’s motivation and confidence to quit is needed.
Our results also confirm that inpatient efforts to improve smoking cessation postdischarge should target smokers’ resolve to quit and confidence in the ability to succeed. Motivational interventions and cognitive-behavioral therapy are effective strategies that can resolve ambivalence and increase confidence to quit and should be components of brief interventions delivered in inpatient settings.17,18 Although individuals with a smoking-related illness may already possess some resolve to quit based on their illness, they may be candidates for interventions focused primarily on developing self-efficacy. Indeed, supporting self-efficacy is a major goal of effective bedside counseling and can be bolstered via problem-solving, motivational techniques, and education about pharmacotherapy during a tobacco-specific consult such as the one that these participants experienced. Armed with these resources, smokers with and without a smoking-related disease may be more likely to execute a plan to quit after discharge.
A study limitation is that our results can be generalized only to hospital inpatients who were willing to try to quit smoking after discharge, because the parent trial excluded smokers with lower levels of motivation. Similarly, these results may not be generalizable to obstetric or psychiatric inpatients, who were excluded from this trial.
In conclusion, our results underscore the importance of assessing motivation and self-efficacy in hospitalized smokers and targeting these factors in intervention efforts. Although future research should aim to identify better methods to alter these factors, in the short run, hospital clinicians could target these factors when discussing tobacco use with inpatient smokers.
Acknowledgments
The authors are grateful for the hard work of MGH, NSMC, and UPMC’s tobacco treatment services, the hospital providers, and study research staff.
Disclosures
Drs. Rigotti and Park received royalties from UpToDate and have received a research grant from Pfizer regarding smoking cessation. Dr. Rigotti has consulted (without pay) for Pfizer. Dr. Singer has served as a consultant to Pfizer but on a topic separate from smoking cessation. No other authors have conflicts of interest to disclose.
Role of Funding Source: The study was funded by NIH/NHLBI [grant #R01-HL11821]. The funding organization had no role in the study design, collection, analysis, and interpretation of the data, preparation of the manuscript, or decision to submit the manuscript for publication.
Clinical Trial Registration: NCT01714323
1. U.S. Department of Health and Human Services. The Health Consequences of Smoking—50 Years of Progress: A Report of the Surgeon General, 2014 | SurgeonGeneral.Gov. Office on Smoking and Health: Centers for Disease Control and Prevention; 2014:944. http://www.surgeongeneral.gov/library/reports/50-years-of-progress/index.html. Accessed May 22, 2016.
2. Rigotti NA, Clair C, Munafò MR, Stead LF. Interventions for smoking cessation in hospitalised patients. Cochrane Database Syst Rev. 2012;(5):CD001837. 10.1002/14651858.CD001837.pub3 PubMed
3. Vangeli E, Stapleton J, Smit ES, Borland R, West R. Predictors of attempts to stop smoking and their success in adult general population samples: a systematic review. Addict Abingdon Engl. 2011;106(12):2110-2121. 10.1111/j.1360-0443.2011.03565.x PubMed
4. Ockene JK, Emmons KM, Mermelstein RJ, et al. Relapse and maintenance issues for smoking cessation. Health Psychol. 2000;19(1S):17-31. 10.1037/0278-6133.19.Suppl1.17 PubMed
5. Harrington K, Young-Il K, Meifang C, et al. Web-based intervention for transitioning smokers from inpatient to outpatient care: an RCT. Am J Prev Med. 2016;51(4):620-629. 10.1016/j.amepre.2016.04.008 PubMed
6. Lando H, Hennrikus D, McCarty M, Vessey J. Predictors of quitting in hospitalized smokers. Nicotine Tob Res. 2003;5(2):215-222. 10.1080/0955300031000083436 PubMed
7. Hennrikus DJ, Lando HA, McCarty MC, et al. The TEAM project: the effectiveness of smoking cessation intervention with hospital patients. Prev Med. 2005;40(3):249-258. 10.1016/j.ypmed.2004.05.030 PubMed
8. MacKenzie TD, Pereira RI, Mehler PS. Smoking abstinence after hospitalization: predictors of success. Prev Med. 2004;39(6):1087-1092. 10.1016/j.ypmed.2004.04.054 PubMed
9. Holtrop JS, Stommel M, Corser W, Holmes-Rovner M. Predictors of smoking cessation and relapse after hospitalization for acute coronary syndrome. J Hosp Med. 2009;4(3):E3-E9. 10.1002/jhm.415 PubMed
10. Rigotti NA, Tindle HA, Regan S, et al. A post-discharge smoking-cessation intervention for hospital patients: helping Hand 2 randomized clinical trial. Am J Prev Med. 2016;51(4):597-608. 10.1016/j.amepre.2016.04.005 PubMed
11. Reid ZZ, Regan S, Kelley JHK, et al. Comparative effectiveness of post-discharge strategies for hospitalized smokers: study protocol for the helping HAND 2 randomized controlled trial. BMC Public Health. 2015;15:109. 10.1186/s12889-015-1484-0 PubMed
12. Heatherton TF, Kozlowski LT, Frecker RC, Rickert W, Robinson J. Measuring the heaviness of smoking: using self-reported time to the first cigarette of the day and number of cigarettes smoked per day. Br J Addict. 1989;84(7):791-799. http://dx.doi.org/10.1111/j.1360-0443.1989.tb03059.x PubMed
13. Melchior LA, Huba GJ, Brown VB, Reback CJ. A short depression index for women. Educ Psychol Meas. 1993;53(4):1117-1125. 10.1177/0013164493053004024
14. Bush K, Kivlahan DR, McDonell MB, Fihn SD, Bradley KA. The AUDIT alcohol consumption questions (AUDIT-C): an effective brief screening test for problem drinking. Ambulatory Care Quality Improvement Project (ACQUIP). Alcohol Use Disorders Identification Test. Arch Intern Med. 1998;158(16):1789-1795. 10.1001/archinte.158.16.1789 PubMed
15. Kruger J, Shaw L, Kahende J, Frank E. Health care providers’ advice to quit smoking, National Health Interview Survey, 2000, 2005, and 2010. Prev Chronic Dis. 2012;9:E130. 10.5888/pcd9.110340 PubMed
16. Tong EK, Strouse R, Hall J, Kovac M, Schroeder SA. National survey of U.S. health professionals’ smoking prevalence, cessation practices, and beliefs. Nicotine Tob Res. 2010;12(7):724-733. 10.1093/ntr/ntq071 PubMed
17. Lindson-Hawley N, Thompson TP, Begh R. Motivational interviewing for smoking cessation. Cochrane Database Syst Rev. 2015;(3):CD006936. 10.1002/14651858.CD006936.pub3 PubMed
18. Hendricks PS, Delucchi KL, Hall SM. Mechanisms of change in extended cognitive behavioral treatment for tobacco dependence. Drug Alcohol Depend. 2010;109(1-3):114-119. 10.1016/j.drugalcdep.2009.12.021 PubMed
© 2018 Society of Hospital Medicine
Embedding a Discharge Facilitator
Recent studies have shown that a patient's discharge from the hospital is a vulnerable period for patient safety.14 With the reduction in length of stay (LOS) and the increase in patient acuity over the past decade, patients are discharged from acute care settings quicker and sicker, resulting in management of ongoing illness in a less‐monitored environment.5, 6 In addition, in teaching hospitals, residents are supervised by hospital‐based physicians who are rarely the primary care physician (PCP) for the residents' patients, which creates discontinuity of care.
One in 5 medical discharges is complicated by an adverse event believed, in part, to be due to poor communication between caregivers during this transition time.2 Discharge summaries, a key form of that communication, are not always done in a timely fashion and may lack key pieces of information.7, 8 For approximately 68% of patient discharges, the PCP will not have a discharge summary available for the patient's first follow‐up visit.911 In a survey of PCPs whose patients were in the hospital, only 23% reported direct communication with the hospital care team.12 This leaves PCPs unaware of pending test results or recommended follow‐up evaluations.10, 11, 13, 14 All of these factors are believed to contribute to adverse events, emergency department (ED) visits, and readmissions.
A recently published consensus statement on transitions of care by 6 major medical societies emphasizes the need for timely communication and transfer of information.15 These important processes are especially challenging to meet at academic medical centers, where discharge summaries and transition communication are done by residents in a hectic and challenging work environment, with multiple simultaneous and competing demands including outpatient clinic and required conferences.12 Residents have little formal training in how to write an effective discharge summary or how to systematically approach discharge planning. One study found higher error rates in discharge summaries written by residents compared with attending physicians.16 While the Accreditation Council for Graduate Medical Education (ACGME) limits the number of admissions per intern for both patient safety and educational reasons, the number of discharges per day is not limited despite the considerable amount of time required for appropriate discharge planning and communication.
Many interventions have been tried to improve the discharge process and reduce patient adverse events.17 Arranging early follow‐up appointments to reduce emergency department visits and readmissions has shown mixed results.13, 1820 Interventions that focus on specific populations, such as the elderly or patients with congestive heart failure, have been more successful.2123 Some interventions employed additional resources, such as a discharge form, transition coach, or discharge advocate, again with varying impact on results.18, 2427 A recent study by Jack et al. used nurse discharge advocates (DAs) to help with discharge planning and communication at an academic medical center.25 These DAs were independent of the care team, and focused on patient education and follow‐up plans, and reduced hospital reutilization in a selected population.
No studies have assessed the potential benefit of helping residents with the physician components of the discharge process. Prior studies have mainly focused on patient communication and follow‐up appointments, yet safe transitions also involve timely discharge summaries, physician‐to‐physician communication, physician‐to‐nurse communication, and medication reconciliation. Without support and time, these tasks can be very challenging for resident physicians with work‐hour limitations. We undertook a randomized, controlled trial to evaluate the impact on the discharge process of embedding a discharge facilitator in a resident medical team to help with the physician discharge process. We studied the effect for all the patients discharged from the resident team, rather than focusing on a select group or patients with a single diagnosis.
METHODS
Study Setting and Participants
This study was conducted on 2 of the 5 resident general medical teams on the inpatient teaching service at Massachusetts General Hospital (MGH), Boston, Massachusettsa large, 907‐bed, urban hospital. The residents' teams are regionalized and each care for approximately 20 patients on a single floor. Each of the study teams consists of a junior resident, 4 interns, and 1 to 2 attendings who rotate on the floor for 2‐week or 4‐week blocks. Attending rounds, which occur 10 AM to 12 PM weekdays, are for new patient presentations and discussion of plans. Interdisciplinary rounds occur 9:30 AM to 10 AM. Sign‐out rounds occur in the afternoon whenever all work is complete. The junior resident is responsible for all the discharge orders and communication with PCPs, and the discharge summaries for patients going to facilities. The interns are responsible for discharge summaries for patients discharged home; these summaries are not mandatory at the time of discharge. The majority of patients were admitted under the team attending(s). Patients were assigned to the teams by the admitting office, based on bed availability. All patients discharged from both resident medical teams over a 5‐month period were included in this study. Those who were not discharged from the hospital by the study teams (ie, transfers to intensive care units or deaths) were excluded. These exclusions accounted for less than 12% of all team patients. Partners Healthcare System Institutional Review Board approved all study activities.
Intervention
We randomly assigned a discharge facilitator (DF), a master's level nurse practitioner with prior inpatient medicine experience, to 1 of the 5 resident medical teams. She had no prior experience on this specific floor. A similar resident team, on a different floor, served as the control. For the intervention team, the DF attended daily resident work rounds and interdisciplinary discharge rounds. The resident and DF collaborated in identifying patients being discharged in the next 1 to 3 days, and the DF scheduled all follow‐up appointments and tests. The DF performed medication reconciliation, wrote prescriptions and faxed them to pharmacies, and arranged all anticoagulation services. In collaboration with the resident, the DF called PCPs' offices with discharge information and faxed discharge summaries to PCPs' offices outside the Partners Healthcare System. The DF wrote part or all of the computer discharge orders and discharge summaries at the request of the resident and interns. All discharge summaries still needed to be reviewed, edited, and signed by the resident or interns. The DF also noted pending tests and studies at time of discharge, and followed up on these tests for the team. The DF met with all patients to answer any questions about their discharge plan, medications, and appointments; while residents are encouraged to do this, it is not done as consistently. She provided her business card for any questions after their discharge. Follow‐up patient calls to the DF were either answered by her or triaged to the appropriate person. The DF also communicated with the patient's nurse about the discharge plans. For all patients discharged over a weekend, the DF would arrange the follow‐up appointments on Mondays and call the patients at home.
For both teams, residents received letters at the start of their rotation notifying them of the study and asking them to complete discharge summaries within 24 hours. All residents in the program were expected to do an online discharge tutorial and attend a didactic lecture on discharge summaries. The residents on the intervention team received a 5‐minute orientation on how best to work with the DF. Residents were given the autonomy to decide how much to use the DF's services. The scheduling of follow‐up appointments on the control team was the responsibility of the team resident as per usual care. The nursing component of the discharge process, including patient discharge education, was the same on both teams. Nurses on both floors are identically trained on these aspects of care. The nurses on both teams were surveyed about perception of the discharge process prior to the intervention and after the intervention. A research assistant (RA) called patients discharged home on both teams, 1 week after discharge, to ask about satisfaction with the discharge process, to determine if the patients had any questions, and to verify patient knowledge regarding whom they should contact for problems. The RA also noted the end time of attending rounds each day and the start time of resident sign‐out.
Outcome Measures and Follow‐Up
At the time of discharge, the RA collected baseline data on all patients discharged from both teams, including the number of follow‐up appointments scheduled. Patients were tracked through electronic medical records to see if and when they attended their follow‐up appointments, whether they changed the appointment, and whether patients returned to a hospital emergency department or were readmitted to MGH or an affiliated Partners hospital within 30 days. For patients outside the MGHPartners system, the research assistant contacted primary care physician offices to document follow‐up. The remaining patient data was obtained through the MGHPartners computerized information system.
The primary outcomes of the study were length of stay, time of discharge, number of emergency department visits, hospital readmissions, numbers of discharge summaries completed in 24 hours, time from discharge to discharge summary completion, and whether the discharge summary was completed before follow‐up. Secondary outcomes were number of follow‐up PCP appointments made at time of discharge, percentage of follow‐up appointments attended and time from discharge to attending a follow‐up appointment, patient phone survey results, and nursing perception of the discharge process, as well as the percentage of attending rounds that ended on time and the time of resident sign‐out.
Statistical Analyses
Patient characteristics were compared between intervention and control teams using 2‐sample t tests or Wilcoxon rank sum tests for continuous variables, and chi‐square tests for categorical variables. Hours to discharge summary completion and hospital length of stay were summarized using median and interquartiles (IQR), and compared between the 2 teams using Wilcoxon rank sum tests. Categorical outcomes were compared using chi‐square tests. Two‐sided P values 0.05 were considered statistically significant. SAS version 9.2 (SAS Institute Inc, Cary, NC) was used for all statistical analyses.
RESULTS
Study Sample
During the 5‐month intervention (November 12, 2008 to April 14, 2009), a combined total of 999 patients were admitted to the intervention and control general medical teams. We excluded 96 patients who were not discharged but transferred to another service or intensive care units, and 24 patients who died. We also excluded 7 patients who were discharged from both teams the first day of the study, because the DF was not involved with the patients' discharge planning. That left 872 patients discharged to either home, a facility, or having left against medical advice (AMA) included in the study: 440 patients on the intervention team and 432 patients on the control team (Figure 1). Baseline patient demographic and clinical characteristics were similar across both teams with only gender being significantly different (Table 1). The mean age was 63 years (range, 1896) and the mean comorbidity score was 2.3 (range, 012). Of note, about a quarter of patients were discharged to facilities, about half were Medicare recipients, and approximately 80% had a PCP. The DF participated in the discharge process for nearly all of the intervention patients; she reported contributing approximately 50% of the content to the discharge summaries.
| Characteristics | Intervention Team | Control Team |
|---|---|---|
| n = 440 | n = 432 | |
| ||
| Mean age (SD), year | 63 (18) | 63 (18) |
| Women, n (%)* | 181 (41) | 207 (48) |
| Race, n (%) | ||
| White non‐Hispanic | 267 (61) | 243 (56) |
| Black non‐Hispanic | 24 (5) | 33 (8) |
| Hispanic | 21 (5) | 17 (4) |
| Unknown/other | 128 (29) | 139 (32) |
| Health insurance, n (%) | ||
| Medicare | 213 (48) | 226 (52) |
| Medicaid | 85 (19) | 81 (19) |
| Private | 110 (25) | 91 (21) |
| Other | 32 (7) | 34 (8) |
| PCP on admission, n (%) | 370 (84) | 356 (82) |
| Discharge disposition, n (%) | ||
| AMA | 12 (3) | 14 (3) |
| Home | 305 (69) | 315 (73) |
| Facility | 123 (28) | 103 (24) |
| Mean comorbidity index score (SD) | 2.3 (2.4) | 2.3 (2.4) |
| Diagnoses | ||
| Congestive heart failure | 30 (6%) | 27 (5%) |
| COPD/asthma | 34 (7%) | 47 (9%) |
| Cardiovascular disease | 54 (11%) | 50 (8%) |
| Alcohol/substance abuse | 29 (6%) | 34 (7%) |
| Gastrointestinal bleeds/ulcers | 38 (8%) | 41 (8%) |
| Hepatobiliary disease | 30 (6%) | 36 (7%) |
| Renal failure/kidney disease | 33 (7%) | 37 (7%) |
| Pneumonia | 36 (7%) | 22 (4%) |
| Musculoskeletal disease | 26 (5%) | 23 (5%) |
| Neurologic disease | 22 (4%) | 25 (5%) |
| Other | 163 (33%) | 172 (35%) |
Primary Outcomes
Primary outcomes from the 2 medical teams are listed in Table 2. In the intervention group, significantly more discharge summaries were completed within 24 hours compared to the control group (293 [67%] vs 207 [48%]; P < 0.0001). Since nearly all patients discharged to facilities must have a discharge summary at the time of discharge, the overall difference in completion rates came mainly from patients discharged home or having left AMA from the intervention team (177 [56%] vs 112 [34%]; P < 0.0001). For all discharge summaries, the median time to completion on the intervention team was 18.9 hours compared with 73.1 hours on the control team (P < 0.0001). More discharge summaries were completed before the first follow‐up appointment on the intervention team (393 [89%] vs 330 [76%]; P < 0.001). The DF intervention had no effect on 30‐day readmission or emergency department visits. For patients on the DF team, 88 (20%) were readmitted within 30 days of discharge, as compared with 79 (18%) on the control team (P = 0.55). Similarly, 40 (9%) of the intervention team patients, as compared with 39 (9%) of the control team patients, visited the emergency department at least once within 30 days (P = 1.0). There was no difference in length of stay (LOS) between the 2 teams (median 4.0 days for both teams, P = 0.84).
| Intervention Team | Control Team | ||
|---|---|---|---|
| Variables | n = 440 | n = 432 | P Value |
| |||
| Discharge summaries completed 24 hr, n (%) | 293 (67) | 207 (48) | <0.0001 |
| Discharges to facilities | 116 (94) | 95 (92) | 0.60 |
| Discharges to home/AMA | 177 (56) | 112 (34) | <0.0001 |
| Median hours to discharge summary completion for discharges to home/AMA (IQR) | 18.9 (0138) | 73.1 (4.3286) | <0.0001 |
| Discharge summary complete before time of follow‐up appointment. | 393 (89) | 330 (76) | <0.0001 |
| Emergency department visits in 30 days, n (%) | 40 (9) | 39 (9) | 1.0 |
| Readmissions in 30 days, n (%) | 88 (20) | 79 (18) | 0.55 |
| Median length of stay, days (IQR) | 4.0 (37) | 4.0 (28) | 0.84 |
| Discharges to facilities | 6.0 (511) | 8.0 (513) | 0.17 |
| Discharges to home/AMA | 4.0 (26) | 3.0 (26) | 0.61 |
| Discharged by noon, n (%) | 38 (9) | 42 (10) | 0.64 |
Secondary Outcomes
Table 3 shows secondary outcomes from the 2 medical teams. Among the patients discharged from the DF team, 264 (62%) had scheduled follow‐up appointments with PCPs compared to the control team 151 (36%) (P < 0.0001). (Many patients going to rehabilitation hospitals are not given PCP appointments at the time of discharge.) Despite having more scheduled appointments, patients' actual follow‐up with PCPs was similar during the 5‐month study period among both intervention and control group (234 [65%] vs 223 [63%]; P = 0.58). However, there was earlier follow‐up with the primary provider in the first 2 or 4 weeks in the intervention group. At 2 weeks, 129 (36%) patients in the intervention group saw their provider compared to 81 (23%) patients in the control group (P < 0.0002), and at 4 weeks, 159 (44%) of the intervention group was seen compared to 99 (28%) of the control group (P < 0.0001). Of note, among the 415 patients on both teams discharged with scheduled appointments, only 53 (13%) of patients did not show up for the scheduled appointment and this no‐show rate was the same on both teams.
| Variables | Intervention Team | Control Team | P Value |
|---|---|---|---|
| |||
| No. of eligible patients* | 428 | 418 | |
| Patients with follow‐up appointments to primary providers, n (%) | 264 (62) | 151 (36) | <0.0001 |
| No. of eligible patients | 359 | 354 | |
| Attended follow‐up appointment with primary provider during study, n (%) | 234 (65) | 223 (63) | 0.58 |
| Within 2 weeks of discharge | 129 (36) | 81 (23) | 0.0002 |
| Within 4 weeks of discharge | 159 (44) | 99 (28) | <0.0001 |
| No. of days round times were recorded | 100 | 99 | |
| No. of attending rounds ending by 12 PM | 45 (45%) | 31 (31%) | 0.058 |
| Mean start time of sign‐out rounds | 16:38 | 17:24 | 0.0007 |
Attending rounds ended on time (12 PM) 45% of the time in the intervention group compared to 31% in the control group (P = 0.058). Mean start time of resident sign‐out rounds was 1638 hours on the intervention team and 1724 hours on the control team (P = 0.0007).
We obtained patient reported outcome data by telephone within 2 to 4 weeks of discharge. Of the 620 patients discharged to home, 6 died or were readmitted to the hospital before being reached by phone. For the remaining 614 patients, we were able to contact 444 (72%). Of those, 321 (52%) agreed to participate in the phone interview. We surveyed similar proportions of intervention and control group patients (158 [52%] vs 163 [52%]) (Table 4). Both groups reported similar rates of having questions about their hospital stay after discharge (43 [27%] vs 49 [30%]; P = 0.62). The intervention group could better identify whom to call with questions (150 [95%] vs 138 [85%]; P = 0.003). The intervention group reported better understanding of their follow‐up plans (157 [99%] vs 141 [87%]; P = 0.001) and better understanding of their discharge medications (152 [96%] vs 142 [87%]; P = 0.001). More patients in the intervention group were satisfied with the discharge process (153 [97%] vs 124 [76%]; P < 0.0001).
| Intervention Team | Control Team | P Value | |
|---|---|---|---|
| |||
| Patients discharged home* | 304 | 310 | |
| Patients contacted by phone after discharge, n (%) | 213 (70) | 231 (75) | 0.24 |
| Agreed to participate in phone interview, n (%) | 158 (52) | 163 (53) | 0.94 |
| Among those agreed to participate, n (%) | |||
| Did you have questions about your hospital stay? | 43 (27) | 49 (30) | 0.62 |
| Would you know who to call if you had questions after discharge? | 150 (95) | 138 (85) | 0.003 |
| Satisfied with the discharge process? | 153 (97) | 124 (76) | <0.0001 |
| Did you understand your follow‐up plans? | 157 (99) | 141 (87) | <0.0001 |
| Did you understand your medications? | 152 (96) | 142 (87) | 0.001 |
| Did you feel safe going home? | 153 (97) | 151 (92) | 0.07 |
Compared with nurses on the control team, nurses on the intervention team more often reported paperwork being completed in a timely fashion (56% vs 29%; P = 0.041) and being less worried about the discharge plan (44% vs 57%; P = 0.027). The intervention team nurses also reported fewer issues with medications/prescriptions (61% vs 82%) and being included more often in the discharge planning (50% vs 38%). However, neither of these results reached statistical significance (P = 0.81 and 0.50, respectively).
DISCUSSION
Our study embedded a nurse practitioner on a busy resident general medical team to help with all aspects of the discharge process for which physicians are responsible. Previous studies have been limited to patients with specific diagnoses, age, or disposition plans.1825 In this study, we included all general medical patients. Our intervention improved several important quality of care elements: the timeliness of completion of discharge summaries; and increased number of early follow‐up appointments, with more patients seen within 2 and 4 weeks after discharge. Patients reported better understanding of their follow‐up plans and more satisfaction with the discharge process. While not statistically significant, there was a trend towards better communication with nurses. For residents with work‐hour limitations, there was time savings with a trend towards finishing attending rounds on time and statistically significant earlier sign‐out rounds (46 minutes earlier). This intervention had no effect on patient length of stay, readmissions, or emergency department visits in the 30 days after discharge.
Despite improving many aspects of the discharge process and communication that have previously been raised as areas of concern for patient safety, there was no improvement in readmissions rates and ED utilization which are often used as the quality indicators for effective discharge planning. Similar types of interventions on general medical patients have generally also failed to show improvement in readmission rates.1820, 25 Weinberger et al. arranged follow‐up appointments within 1 week for patients discharged from a Veterans Administrative hospital; while patients were seen more often, the intervention actually increased readmission rates.20 Fitzgerald et al. had a case manager contact patients at home and encourage follow‐up, which increased follow‐up visits, but again had no effect on readmission.19 Einstadter et al. had a nurse case manager coordinate outpatient follow‐up on a resident team and also did not effect readmission rates or ED visits.18 Jack et al. in project reengineered discharge (RED) did show a significant reduction in combined hospital utilization measures. However, their study focused on a more limited patient population, and employed both a discharge advocate to arrange follow‐up and improve patient education, and a pharmacist to make postdischarge phone calls.25
So why did readmissions rates and ED visits not change in our study? It would be reasonable to think that having earlier follow‐up appointments, better and timely physician‐to‐physician communication, and a facilitator for patient questions should improve the quality of the discharge process. In a recent study, Jha et al. found there was no association between chart‐based measures of discharge quality and readmissions rates, and only a modest association for patient‐reported measures of discharge quality and readmission rates.28 The authors suggest readmission rates are driven by many factors beyond just improved discharge safety. Perhaps readmission rates are too complex a measure to use to assess discharge process improvement. For fiscal reasons, it is understandable that hospitals, insurance companies, and the Centers for Medicare and Medicaid want to reduce readmission rates and ED utilization. Jencks et al. noted the cost of readmissions in 2004 was 17.4 billion dollars.29 However, sweeping efforts to improve the discharge process for all general medical patients may not yield significant reductions in readmissions, as this study suggests. We may need to focus aggressive intervention on smaller target populations, as prior studies on focused groups suggest.2123
There are no evidence‐based studies to suggest when optimal follow‐up should occur after discharge.26 Several medical society guidelines recommend 2 weeks. More patients on the intervention team were seen within 2 weeks, but readmission rates were not affected. The University Health System Consortium recently reported that the majority of readmissions occurred within 6 days, with the average being about 2 to 3 days.30 In this study, the median days to readmit were 12 for the intervention team and 10 for the control. It is possible that even with our improved 2‐week follow‐up, this was not early enough to reduce readmissions. Follow‐up may need to be within 13 days of discharge for highly vulnerable patients, to significantly change readmission rates. Further studies focusing on this question would be helpful.
Finally, with ACGME limitation of work hours, many residency programs are looking for ways to reduce residents' workload and increase time for education. With a significant trend towards finishing attending rounds on time, it is likely that more residents on the intervention team were able to attend the noon‐time educational conferences. We speculate that this was due to fewer interruptions during rounds because the DF was available for nurses' questions. Sign‐out rounds occurred significantly earlier, possibly because of improved resident efficiency due to the DF's help with the discharge process. While residents may lose some educational experience from not performing all discharge tasks, they gain experience working in interdisciplinary teams, have increased time for education, and reduced work hours. Since the ACGME limits the number of residents per program and increasing the residency size is not an option, a DF should be considered as a possible solution to ACGME work‐hour restrictions.
This study had several limitations. First, the intervention team had 1 specific person embedded, and therefore the results of this study may have limited generalizability. Second, the limited number of residents working with the DF could have biased the intervention, as not all residents worked equally well with the DF. However, this may represent the real‐world experience on any teaching service, given variation in working styles and learning curves of residents over their training. Third, this study was done at 1 university‐affiliated urban Academic Medical Center, making it potentially less generalizable to resident teams in community hospitals. Fourth, we were not able to capture readmissions and ED visits at institutions outside the MGHPartners Healthcare System. However, given that patients were assigned at random to either team, this factor should have impacted both teams equally. Fifth, the study occurred during Massachusetts healthcare reform which requires everyone to have health insurance. This may have affected the rates of ED visits and readmission rates, especially with a shortage of primary care physicians and office visits. Finally, this intervention was not cost‐neutral. Paying for a nurse practitioner to help residents with the work of discharge and providing patients with additional services had many advantages, but this quality improvement project did not pay for itself through shorter LOS, or decreases in ED visits or readmissions.
While readmission rates and ED utilization are important patient outcomes, especially in the current healthcare climate, what determines readmissions and ED visits is likely complex and multifactorial. This study suggests that, in the nationwide effort to reduce readmissions, solely improving the discharge process for all general medical patients may not produce the hoped‐for financial savings. Improving the discharge process, however, is something valuable in its own right. Adding a DF to a resident team does improve some quality markers of the discharge process and decreases work hours for residents.
Acknowledgements
Sara Macchiano, RN for her help with the data gathering of this study.
- ,,,,.Adverse drug events occurring following hospital discharge.J Gen Intern Med.2005;20(4):317–323.
- ,,,,.The incidence and severity of adverse events affecting patients after discharge from the hospital.Ann Intern Med.2003;138(3):161–167.
- ,,,.Medical errors related to discontinuity of care from an inpatient to an outpatient setting.J Gen Intern Med.2003;18(8):646–651.
- ,,,.Posthospital medication discrepancies: Prevalence and contributing factors.Arch Intern Med.2005;165(16):1842–1847.
- ,,, et al.Prospective payment system and impairment at discharge. The ‘quicker‐and‐sicker’ story revisited.JAMA.1990;264(15):1980–1983.
- .The incidence of adverse medical outcomes under prospective payment.Econometrica. 1995;63:29–50.
- ,,.Content of a discharge summary from a medical ward: Views of general practitioners and hospital doctors.J R Coll Physicians Lond.1995;29(4):307–310.
- ,.Quality assessment of a discharge summary system.Can Med Assoc J.1995;152(9):1437–1442.
- ,,.Dissemination of discharge summaries. Not reaching follow‐up physicians.Can Fam Physician.2002;48:737–742.
- ,,,.Effect of discharge summary availability during post‐discharge visits on hospital readmission.J Gen Intern Med.2002;17(3):186–192.
- ,,,,,.Deficits in communication and information transfer between hospital‐based and primary care physicians: Implications for patient safety and continuity of care.JAMA.2007;297(8):831–841.
- ,,, et al.Association of communication between hospital‐based physicians and primary care providers with patient outcomes.J Gen Intern Med.2009;24(3):381–386.
- ,,.Tying up loose ends: Discharging patients with unresolved medical issues.Arch Intern Med.2007;167(12):1305–1311.
- ,,, et al.Patient safety concerns arising from test results that return after hospital discharge.Ann Intern Med.2005;143(2):121–128.
- ,,, et al.Transitions of care consensus policy statement: American College of Physicians, Society of General Internal Medicine, Society of Hospital Medicine, American Geriatrics Society, American College of Emergency Physicians, and Society for Academic Emergency Medicine.J Hosp Med.2009;4(6):364–370.
- ,,,.Prospective audit of discharge summary errors.Br J Surg.1996;83(6):788–790.
- ,.Lost in transition: Challenges and opportunities for improving the quality of transitional care.Ann Intern Med.2004;141(7):533–536.
- ,,.Effect of a nurse case manager on postdischarge follow‐up.J Gen Intern Med.1996;11(11):684–688.
- ,,,,.A case manager intervention to reduce readmissions.Arch Intern Med.1994;154(15):1721–1729.
- ,,.Does increased access to primary care reduce hospital readmissions? Veterans Affairs Cooperative Study Group on Primary Care and Hospital Readmission.N Engl J Med.1996;334(22):1441–1447.
- ,,,,,.Comprehensive discharge planning with postdischarge support for older patients with congestive heart failure: A meta‐analysis.JAMA.2004;291(11):1358–1367.
- ,,,,,.Transitional care of older adults hospitalized with heart failure: A randomized, controlled trial.J Am Geriatr Soc.2004;52(5):675–684.
- ,,,,,.Preparing patients and caregivers to participate in care delivered across settings: The Care Transitions Intervention.J Am Geriatr Soc.2004;52(11):1817–1825.
- ,,,.The care transitions intervention: Results of a randomized controlled trial.Arch Intern Med.2006;166(17):1822–1828.
- ,,, et al.A reengineered hospital discharge program to decrease rehospitalization: A randomized trial.Ann Intern Med.2009;150(3):178–187.
- ,,,.Redefining and redesigning hospital discharge to enhance patient care: A randomized controlled study.J Gen Intern Med.2008;23(8):1228–1233.
- ,,, et al.Effect of a nurse team coordinator on outcomes for hospitalized medicine patients.Am J Med.2005;118(10):1148–1153.
- ,,.Public reporting of discharge planning and rates of readmissions.N Engl J Med.2009;361(27):2637–2645.
- ,,.Rehospitalizations among patients in the Medicare fee‐for‐service program.N Engl J Med.2009;360(14):1418–1428.
- Consortium UHS. Reducing Readmissions SC22009. Available at: https://www.uhc.edu/1244.htm
Recent studies have shown that a patient's discharge from the hospital is a vulnerable period for patient safety.14 With the reduction in length of stay (LOS) and the increase in patient acuity over the past decade, patients are discharged from acute care settings quicker and sicker, resulting in management of ongoing illness in a less‐monitored environment.5, 6 In addition, in teaching hospitals, residents are supervised by hospital‐based physicians who are rarely the primary care physician (PCP) for the residents' patients, which creates discontinuity of care.
One in 5 medical discharges is complicated by an adverse event believed, in part, to be due to poor communication between caregivers during this transition time.2 Discharge summaries, a key form of that communication, are not always done in a timely fashion and may lack key pieces of information.7, 8 For approximately 68% of patient discharges, the PCP will not have a discharge summary available for the patient's first follow‐up visit.911 In a survey of PCPs whose patients were in the hospital, only 23% reported direct communication with the hospital care team.12 This leaves PCPs unaware of pending test results or recommended follow‐up evaluations.10, 11, 13, 14 All of these factors are believed to contribute to adverse events, emergency department (ED) visits, and readmissions.
A recently published consensus statement on transitions of care by 6 major medical societies emphasizes the need for timely communication and transfer of information.15 These important processes are especially challenging to meet at academic medical centers, where discharge summaries and transition communication are done by residents in a hectic and challenging work environment, with multiple simultaneous and competing demands including outpatient clinic and required conferences.12 Residents have little formal training in how to write an effective discharge summary or how to systematically approach discharge planning. One study found higher error rates in discharge summaries written by residents compared with attending physicians.16 While the Accreditation Council for Graduate Medical Education (ACGME) limits the number of admissions per intern for both patient safety and educational reasons, the number of discharges per day is not limited despite the considerable amount of time required for appropriate discharge planning and communication.
Many interventions have been tried to improve the discharge process and reduce patient adverse events.17 Arranging early follow‐up appointments to reduce emergency department visits and readmissions has shown mixed results.13, 1820 Interventions that focus on specific populations, such as the elderly or patients with congestive heart failure, have been more successful.2123 Some interventions employed additional resources, such as a discharge form, transition coach, or discharge advocate, again with varying impact on results.18, 2427 A recent study by Jack et al. used nurse discharge advocates (DAs) to help with discharge planning and communication at an academic medical center.25 These DAs were independent of the care team, and focused on patient education and follow‐up plans, and reduced hospital reutilization in a selected population.
No studies have assessed the potential benefit of helping residents with the physician components of the discharge process. Prior studies have mainly focused on patient communication and follow‐up appointments, yet safe transitions also involve timely discharge summaries, physician‐to‐physician communication, physician‐to‐nurse communication, and medication reconciliation. Without support and time, these tasks can be very challenging for resident physicians with work‐hour limitations. We undertook a randomized, controlled trial to evaluate the impact on the discharge process of embedding a discharge facilitator in a resident medical team to help with the physician discharge process. We studied the effect for all the patients discharged from the resident team, rather than focusing on a select group or patients with a single diagnosis.
METHODS
Study Setting and Participants
This study was conducted on 2 of the 5 resident general medical teams on the inpatient teaching service at Massachusetts General Hospital (MGH), Boston, Massachusettsa large, 907‐bed, urban hospital. The residents' teams are regionalized and each care for approximately 20 patients on a single floor. Each of the study teams consists of a junior resident, 4 interns, and 1 to 2 attendings who rotate on the floor for 2‐week or 4‐week blocks. Attending rounds, which occur 10 AM to 12 PM weekdays, are for new patient presentations and discussion of plans. Interdisciplinary rounds occur 9:30 AM to 10 AM. Sign‐out rounds occur in the afternoon whenever all work is complete. The junior resident is responsible for all the discharge orders and communication with PCPs, and the discharge summaries for patients going to facilities. The interns are responsible for discharge summaries for patients discharged home; these summaries are not mandatory at the time of discharge. The majority of patients were admitted under the team attending(s). Patients were assigned to the teams by the admitting office, based on bed availability. All patients discharged from both resident medical teams over a 5‐month period were included in this study. Those who were not discharged from the hospital by the study teams (ie, transfers to intensive care units or deaths) were excluded. These exclusions accounted for less than 12% of all team patients. Partners Healthcare System Institutional Review Board approved all study activities.
Intervention
We randomly assigned a discharge facilitator (DF), a master's level nurse practitioner with prior inpatient medicine experience, to 1 of the 5 resident medical teams. She had no prior experience on this specific floor. A similar resident team, on a different floor, served as the control. For the intervention team, the DF attended daily resident work rounds and interdisciplinary discharge rounds. The resident and DF collaborated in identifying patients being discharged in the next 1 to 3 days, and the DF scheduled all follow‐up appointments and tests. The DF performed medication reconciliation, wrote prescriptions and faxed them to pharmacies, and arranged all anticoagulation services. In collaboration with the resident, the DF called PCPs' offices with discharge information and faxed discharge summaries to PCPs' offices outside the Partners Healthcare System. The DF wrote part or all of the computer discharge orders and discharge summaries at the request of the resident and interns. All discharge summaries still needed to be reviewed, edited, and signed by the resident or interns. The DF also noted pending tests and studies at time of discharge, and followed up on these tests for the team. The DF met with all patients to answer any questions about their discharge plan, medications, and appointments; while residents are encouraged to do this, it is not done as consistently. She provided her business card for any questions after their discharge. Follow‐up patient calls to the DF were either answered by her or triaged to the appropriate person. The DF also communicated with the patient's nurse about the discharge plans. For all patients discharged over a weekend, the DF would arrange the follow‐up appointments on Mondays and call the patients at home.
For both teams, residents received letters at the start of their rotation notifying them of the study and asking them to complete discharge summaries within 24 hours. All residents in the program were expected to do an online discharge tutorial and attend a didactic lecture on discharge summaries. The residents on the intervention team received a 5‐minute orientation on how best to work with the DF. Residents were given the autonomy to decide how much to use the DF's services. The scheduling of follow‐up appointments on the control team was the responsibility of the team resident as per usual care. The nursing component of the discharge process, including patient discharge education, was the same on both teams. Nurses on both floors are identically trained on these aspects of care. The nurses on both teams were surveyed about perception of the discharge process prior to the intervention and after the intervention. A research assistant (RA) called patients discharged home on both teams, 1 week after discharge, to ask about satisfaction with the discharge process, to determine if the patients had any questions, and to verify patient knowledge regarding whom they should contact for problems. The RA also noted the end time of attending rounds each day and the start time of resident sign‐out.
Outcome Measures and Follow‐Up
At the time of discharge, the RA collected baseline data on all patients discharged from both teams, including the number of follow‐up appointments scheduled. Patients were tracked through electronic medical records to see if and when they attended their follow‐up appointments, whether they changed the appointment, and whether patients returned to a hospital emergency department or were readmitted to MGH or an affiliated Partners hospital within 30 days. For patients outside the MGHPartners system, the research assistant contacted primary care physician offices to document follow‐up. The remaining patient data was obtained through the MGHPartners computerized information system.
The primary outcomes of the study were length of stay, time of discharge, number of emergency department visits, hospital readmissions, numbers of discharge summaries completed in 24 hours, time from discharge to discharge summary completion, and whether the discharge summary was completed before follow‐up. Secondary outcomes were number of follow‐up PCP appointments made at time of discharge, percentage of follow‐up appointments attended and time from discharge to attending a follow‐up appointment, patient phone survey results, and nursing perception of the discharge process, as well as the percentage of attending rounds that ended on time and the time of resident sign‐out.
Statistical Analyses
Patient characteristics were compared between intervention and control teams using 2‐sample t tests or Wilcoxon rank sum tests for continuous variables, and chi‐square tests for categorical variables. Hours to discharge summary completion and hospital length of stay were summarized using median and interquartiles (IQR), and compared between the 2 teams using Wilcoxon rank sum tests. Categorical outcomes were compared using chi‐square tests. Two‐sided P values 0.05 were considered statistically significant. SAS version 9.2 (SAS Institute Inc, Cary, NC) was used for all statistical analyses.
RESULTS
Study Sample
During the 5‐month intervention (November 12, 2008 to April 14, 2009), a combined total of 999 patients were admitted to the intervention and control general medical teams. We excluded 96 patients who were not discharged but transferred to another service or intensive care units, and 24 patients who died. We also excluded 7 patients who were discharged from both teams the first day of the study, because the DF was not involved with the patients' discharge planning. That left 872 patients discharged to either home, a facility, or having left against medical advice (AMA) included in the study: 440 patients on the intervention team and 432 patients on the control team (Figure 1). Baseline patient demographic and clinical characteristics were similar across both teams with only gender being significantly different (Table 1). The mean age was 63 years (range, 1896) and the mean comorbidity score was 2.3 (range, 012). Of note, about a quarter of patients were discharged to facilities, about half were Medicare recipients, and approximately 80% had a PCP. The DF participated in the discharge process for nearly all of the intervention patients; she reported contributing approximately 50% of the content to the discharge summaries.
| Characteristics | Intervention Team | Control Team |
|---|---|---|
| n = 440 | n = 432 | |
| ||
| Mean age (SD), year | 63 (18) | 63 (18) |
| Women, n (%)* | 181 (41) | 207 (48) |
| Race, n (%) | ||
| White non‐Hispanic | 267 (61) | 243 (56) |
| Black non‐Hispanic | 24 (5) | 33 (8) |
| Hispanic | 21 (5) | 17 (4) |
| Unknown/other | 128 (29) | 139 (32) |
| Health insurance, n (%) | ||
| Medicare | 213 (48) | 226 (52) |
| Medicaid | 85 (19) | 81 (19) |
| Private | 110 (25) | 91 (21) |
| Other | 32 (7) | 34 (8) |
| PCP on admission, n (%) | 370 (84) | 356 (82) |
| Discharge disposition, n (%) | ||
| AMA | 12 (3) | 14 (3) |
| Home | 305 (69) | 315 (73) |
| Facility | 123 (28) | 103 (24) |
| Mean comorbidity index score (SD) | 2.3 (2.4) | 2.3 (2.4) |
| Diagnoses | ||
| Congestive heart failure | 30 (6%) | 27 (5%) |
| COPD/asthma | 34 (7%) | 47 (9%) |
| Cardiovascular disease | 54 (11%) | 50 (8%) |
| Alcohol/substance abuse | 29 (6%) | 34 (7%) |
| Gastrointestinal bleeds/ulcers | 38 (8%) | 41 (8%) |
| Hepatobiliary disease | 30 (6%) | 36 (7%) |
| Renal failure/kidney disease | 33 (7%) | 37 (7%) |
| Pneumonia | 36 (7%) | 22 (4%) |
| Musculoskeletal disease | 26 (5%) | 23 (5%) |
| Neurologic disease | 22 (4%) | 25 (5%) |
| Other | 163 (33%) | 172 (35%) |
Primary Outcomes
Primary outcomes from the 2 medical teams are listed in Table 2. In the intervention group, significantly more discharge summaries were completed within 24 hours compared to the control group (293 [67%] vs 207 [48%]; P < 0.0001). Since nearly all patients discharged to facilities must have a discharge summary at the time of discharge, the overall difference in completion rates came mainly from patients discharged home or having left AMA from the intervention team (177 [56%] vs 112 [34%]; P < 0.0001). For all discharge summaries, the median time to completion on the intervention team was 18.9 hours compared with 73.1 hours on the control team (P < 0.0001). More discharge summaries were completed before the first follow‐up appointment on the intervention team (393 [89%] vs 330 [76%]; P < 0.001). The DF intervention had no effect on 30‐day readmission or emergency department visits. For patients on the DF team, 88 (20%) were readmitted within 30 days of discharge, as compared with 79 (18%) on the control team (P = 0.55). Similarly, 40 (9%) of the intervention team patients, as compared with 39 (9%) of the control team patients, visited the emergency department at least once within 30 days (P = 1.0). There was no difference in length of stay (LOS) between the 2 teams (median 4.0 days for both teams, P = 0.84).
| Intervention Team | Control Team | ||
|---|---|---|---|
| Variables | n = 440 | n = 432 | P Value |
| |||
| Discharge summaries completed 24 hr, n (%) | 293 (67) | 207 (48) | <0.0001 |
| Discharges to facilities | 116 (94) | 95 (92) | 0.60 |
| Discharges to home/AMA | 177 (56) | 112 (34) | <0.0001 |
| Median hours to discharge summary completion for discharges to home/AMA (IQR) | 18.9 (0138) | 73.1 (4.3286) | <0.0001 |
| Discharge summary complete before time of follow‐up appointment. | 393 (89) | 330 (76) | <0.0001 |
| Emergency department visits in 30 days, n (%) | 40 (9) | 39 (9) | 1.0 |
| Readmissions in 30 days, n (%) | 88 (20) | 79 (18) | 0.55 |
| Median length of stay, days (IQR) | 4.0 (37) | 4.0 (28) | 0.84 |
| Discharges to facilities | 6.0 (511) | 8.0 (513) | 0.17 |
| Discharges to home/AMA | 4.0 (26) | 3.0 (26) | 0.61 |
| Discharged by noon, n (%) | 38 (9) | 42 (10) | 0.64 |
Secondary Outcomes
Table 3 shows secondary outcomes from the 2 medical teams. Among the patients discharged from the DF team, 264 (62%) had scheduled follow‐up appointments with PCPs compared to the control team 151 (36%) (P < 0.0001). (Many patients going to rehabilitation hospitals are not given PCP appointments at the time of discharge.) Despite having more scheduled appointments, patients' actual follow‐up with PCPs was similar during the 5‐month study period among both intervention and control group (234 [65%] vs 223 [63%]; P = 0.58). However, there was earlier follow‐up with the primary provider in the first 2 or 4 weeks in the intervention group. At 2 weeks, 129 (36%) patients in the intervention group saw their provider compared to 81 (23%) patients in the control group (P < 0.0002), and at 4 weeks, 159 (44%) of the intervention group was seen compared to 99 (28%) of the control group (P < 0.0001). Of note, among the 415 patients on both teams discharged with scheduled appointments, only 53 (13%) of patients did not show up for the scheduled appointment and this no‐show rate was the same on both teams.
| Variables | Intervention Team | Control Team | P Value |
|---|---|---|---|
| |||
| No. of eligible patients* | 428 | 418 | |
| Patients with follow‐up appointments to primary providers, n (%) | 264 (62) | 151 (36) | <0.0001 |
| No. of eligible patients | 359 | 354 | |
| Attended follow‐up appointment with primary provider during study, n (%) | 234 (65) | 223 (63) | 0.58 |
| Within 2 weeks of discharge | 129 (36) | 81 (23) | 0.0002 |
| Within 4 weeks of discharge | 159 (44) | 99 (28) | <0.0001 |
| No. of days round times were recorded | 100 | 99 | |
| No. of attending rounds ending by 12 PM | 45 (45%) | 31 (31%) | 0.058 |
| Mean start time of sign‐out rounds | 16:38 | 17:24 | 0.0007 |
Attending rounds ended on time (12 PM) 45% of the time in the intervention group compared to 31% in the control group (P = 0.058). Mean start time of resident sign‐out rounds was 1638 hours on the intervention team and 1724 hours on the control team (P = 0.0007).
We obtained patient reported outcome data by telephone within 2 to 4 weeks of discharge. Of the 620 patients discharged to home, 6 died or were readmitted to the hospital before being reached by phone. For the remaining 614 patients, we were able to contact 444 (72%). Of those, 321 (52%) agreed to participate in the phone interview. We surveyed similar proportions of intervention and control group patients (158 [52%] vs 163 [52%]) (Table 4). Both groups reported similar rates of having questions about their hospital stay after discharge (43 [27%] vs 49 [30%]; P = 0.62). The intervention group could better identify whom to call with questions (150 [95%] vs 138 [85%]; P = 0.003). The intervention group reported better understanding of their follow‐up plans (157 [99%] vs 141 [87%]; P = 0.001) and better understanding of their discharge medications (152 [96%] vs 142 [87%]; P = 0.001). More patients in the intervention group were satisfied with the discharge process (153 [97%] vs 124 [76%]; P < 0.0001).
| Intervention Team | Control Team | P Value | |
|---|---|---|---|
| |||
| Patients discharged home* | 304 | 310 | |
| Patients contacted by phone after discharge, n (%) | 213 (70) | 231 (75) | 0.24 |
| Agreed to participate in phone interview, n (%) | 158 (52) | 163 (53) | 0.94 |
| Among those agreed to participate, n (%) | |||
| Did you have questions about your hospital stay? | 43 (27) | 49 (30) | 0.62 |
| Would you know who to call if you had questions after discharge? | 150 (95) | 138 (85) | 0.003 |
| Satisfied with the discharge process? | 153 (97) | 124 (76) | <0.0001 |
| Did you understand your follow‐up plans? | 157 (99) | 141 (87) | <0.0001 |
| Did you understand your medications? | 152 (96) | 142 (87) | 0.001 |
| Did you feel safe going home? | 153 (97) | 151 (92) | 0.07 |
Compared with nurses on the control team, nurses on the intervention team more often reported paperwork being completed in a timely fashion (56% vs 29%; P = 0.041) and being less worried about the discharge plan (44% vs 57%; P = 0.027). The intervention team nurses also reported fewer issues with medications/prescriptions (61% vs 82%) and being included more often in the discharge planning (50% vs 38%). However, neither of these results reached statistical significance (P = 0.81 and 0.50, respectively).
DISCUSSION
Our study embedded a nurse practitioner on a busy resident general medical team to help with all aspects of the discharge process for which physicians are responsible. Previous studies have been limited to patients with specific diagnoses, age, or disposition plans.1825 In this study, we included all general medical patients. Our intervention improved several important quality of care elements: the timeliness of completion of discharge summaries; and increased number of early follow‐up appointments, with more patients seen within 2 and 4 weeks after discharge. Patients reported better understanding of their follow‐up plans and more satisfaction with the discharge process. While not statistically significant, there was a trend towards better communication with nurses. For residents with work‐hour limitations, there was time savings with a trend towards finishing attending rounds on time and statistically significant earlier sign‐out rounds (46 minutes earlier). This intervention had no effect on patient length of stay, readmissions, or emergency department visits in the 30 days after discharge.
Despite improving many aspects of the discharge process and communication that have previously been raised as areas of concern for patient safety, there was no improvement in readmissions rates and ED utilization which are often used as the quality indicators for effective discharge planning. Similar types of interventions on general medical patients have generally also failed to show improvement in readmission rates.1820, 25 Weinberger et al. arranged follow‐up appointments within 1 week for patients discharged from a Veterans Administrative hospital; while patients were seen more often, the intervention actually increased readmission rates.20 Fitzgerald et al. had a case manager contact patients at home and encourage follow‐up, which increased follow‐up visits, but again had no effect on readmission.19 Einstadter et al. had a nurse case manager coordinate outpatient follow‐up on a resident team and also did not effect readmission rates or ED visits.18 Jack et al. in project reengineered discharge (RED) did show a significant reduction in combined hospital utilization measures. However, their study focused on a more limited patient population, and employed both a discharge advocate to arrange follow‐up and improve patient education, and a pharmacist to make postdischarge phone calls.25
So why did readmissions rates and ED visits not change in our study? It would be reasonable to think that having earlier follow‐up appointments, better and timely physician‐to‐physician communication, and a facilitator for patient questions should improve the quality of the discharge process. In a recent study, Jha et al. found there was no association between chart‐based measures of discharge quality and readmissions rates, and only a modest association for patient‐reported measures of discharge quality and readmission rates.28 The authors suggest readmission rates are driven by many factors beyond just improved discharge safety. Perhaps readmission rates are too complex a measure to use to assess discharge process improvement. For fiscal reasons, it is understandable that hospitals, insurance companies, and the Centers for Medicare and Medicaid want to reduce readmission rates and ED utilization. Jencks et al. noted the cost of readmissions in 2004 was 17.4 billion dollars.29 However, sweeping efforts to improve the discharge process for all general medical patients may not yield significant reductions in readmissions, as this study suggests. We may need to focus aggressive intervention on smaller target populations, as prior studies on focused groups suggest.2123
There are no evidence‐based studies to suggest when optimal follow‐up should occur after discharge.26 Several medical society guidelines recommend 2 weeks. More patients on the intervention team were seen within 2 weeks, but readmission rates were not affected. The University Health System Consortium recently reported that the majority of readmissions occurred within 6 days, with the average being about 2 to 3 days.30 In this study, the median days to readmit were 12 for the intervention team and 10 for the control. It is possible that even with our improved 2‐week follow‐up, this was not early enough to reduce readmissions. Follow‐up may need to be within 13 days of discharge for highly vulnerable patients, to significantly change readmission rates. Further studies focusing on this question would be helpful.
Finally, with ACGME limitation of work hours, many residency programs are looking for ways to reduce residents' workload and increase time for education. With a significant trend towards finishing attending rounds on time, it is likely that more residents on the intervention team were able to attend the noon‐time educational conferences. We speculate that this was due to fewer interruptions during rounds because the DF was available for nurses' questions. Sign‐out rounds occurred significantly earlier, possibly because of improved resident efficiency due to the DF's help with the discharge process. While residents may lose some educational experience from not performing all discharge tasks, they gain experience working in interdisciplinary teams, have increased time for education, and reduced work hours. Since the ACGME limits the number of residents per program and increasing the residency size is not an option, a DF should be considered as a possible solution to ACGME work‐hour restrictions.
This study had several limitations. First, the intervention team had 1 specific person embedded, and therefore the results of this study may have limited generalizability. Second, the limited number of residents working with the DF could have biased the intervention, as not all residents worked equally well with the DF. However, this may represent the real‐world experience on any teaching service, given variation in working styles and learning curves of residents over their training. Third, this study was done at 1 university‐affiliated urban Academic Medical Center, making it potentially less generalizable to resident teams in community hospitals. Fourth, we were not able to capture readmissions and ED visits at institutions outside the MGHPartners Healthcare System. However, given that patients were assigned at random to either team, this factor should have impacted both teams equally. Fifth, the study occurred during Massachusetts healthcare reform which requires everyone to have health insurance. This may have affected the rates of ED visits and readmission rates, especially with a shortage of primary care physicians and office visits. Finally, this intervention was not cost‐neutral. Paying for a nurse practitioner to help residents with the work of discharge and providing patients with additional services had many advantages, but this quality improvement project did not pay for itself through shorter LOS, or decreases in ED visits or readmissions.
While readmission rates and ED utilization are important patient outcomes, especially in the current healthcare climate, what determines readmissions and ED visits is likely complex and multifactorial. This study suggests that, in the nationwide effort to reduce readmissions, solely improving the discharge process for all general medical patients may not produce the hoped‐for financial savings. Improving the discharge process, however, is something valuable in its own right. Adding a DF to a resident team does improve some quality markers of the discharge process and decreases work hours for residents.
Acknowledgements
Sara Macchiano, RN for her help with the data gathering of this study.
- ,,,,.Adverse drug events occurring following hospital discharge.J Gen Intern Med.2005;20(4):317–323.
- ,,,,.The incidence and severity of adverse events affecting patients after discharge from the hospital.Ann Intern Med.2003;138(3):161–167.
- ,,,.Medical errors related to discontinuity of care from an inpatient to an outpatient setting.J Gen Intern Med.2003;18(8):646–651.
- ,,,.Posthospital medication discrepancies: Prevalence and contributing factors.Arch Intern Med.2005;165(16):1842–1847.
- ,,, et al.Prospective payment system and impairment at discharge. The ‘quicker‐and‐sicker’ story revisited.JAMA.1990;264(15):1980–1983.
- .The incidence of adverse medical outcomes under prospective payment.Econometrica. 1995;63:29–50.
- ,,.Content of a discharge summary from a medical ward: Views of general practitioners and hospital doctors.J R Coll Physicians Lond.1995;29(4):307–310.
- ,.Quality assessment of a discharge summary system.Can Med Assoc J.1995;152(9):1437–1442.
- ,,.Dissemination of discharge summaries. Not reaching follow‐up physicians.Can Fam Physician.2002;48:737–742.
- ,,,.Effect of discharge summary availability during post‐discharge visits on hospital readmission.J Gen Intern Med.2002;17(3):186–192.
- ,,,,,.Deficits in communication and information transfer between hospital‐based and primary care physicians: Implications for patient safety and continuity of care.JAMA.2007;297(8):831–841.
- ,,, et al.Association of communication between hospital‐based physicians and primary care providers with patient outcomes.J Gen Intern Med.2009;24(3):381–386.
- ,,.Tying up loose ends: Discharging patients with unresolved medical issues.Arch Intern Med.2007;167(12):1305–1311.
- ,,, et al.Patient safety concerns arising from test results that return after hospital discharge.Ann Intern Med.2005;143(2):121–128.
- ,,, et al.Transitions of care consensus policy statement: American College of Physicians, Society of General Internal Medicine, Society of Hospital Medicine, American Geriatrics Society, American College of Emergency Physicians, and Society for Academic Emergency Medicine.J Hosp Med.2009;4(6):364–370.
- ,,,.Prospective audit of discharge summary errors.Br J Surg.1996;83(6):788–790.
- ,.Lost in transition: Challenges and opportunities for improving the quality of transitional care.Ann Intern Med.2004;141(7):533–536.
- ,,.Effect of a nurse case manager on postdischarge follow‐up.J Gen Intern Med.1996;11(11):684–688.
- ,,,,.A case manager intervention to reduce readmissions.Arch Intern Med.1994;154(15):1721–1729.
- ,,.Does increased access to primary care reduce hospital readmissions? Veterans Affairs Cooperative Study Group on Primary Care and Hospital Readmission.N Engl J Med.1996;334(22):1441–1447.
- ,,,,,.Comprehensive discharge planning with postdischarge support for older patients with congestive heart failure: A meta‐analysis.JAMA.2004;291(11):1358–1367.
- ,,,,,.Transitional care of older adults hospitalized with heart failure: A randomized, controlled trial.J Am Geriatr Soc.2004;52(5):675–684.
- ,,,,,.Preparing patients and caregivers to participate in care delivered across settings: The Care Transitions Intervention.J Am Geriatr Soc.2004;52(11):1817–1825.
- ,,,.The care transitions intervention: Results of a randomized controlled trial.Arch Intern Med.2006;166(17):1822–1828.
- ,,, et al.A reengineered hospital discharge program to decrease rehospitalization: A randomized trial.Ann Intern Med.2009;150(3):178–187.
- ,,,.Redefining and redesigning hospital discharge to enhance patient care: A randomized controlled study.J Gen Intern Med.2008;23(8):1228–1233.
- ,,, et al.Effect of a nurse team coordinator on outcomes for hospitalized medicine patients.Am J Med.2005;118(10):1148–1153.
- ,,.Public reporting of discharge planning and rates of readmissions.N Engl J Med.2009;361(27):2637–2645.
- ,,.Rehospitalizations among patients in the Medicare fee‐for‐service program.N Engl J Med.2009;360(14):1418–1428.
- Consortium UHS. Reducing Readmissions SC22009. Available at: https://www.uhc.edu/1244.htm
Copyright © 2011 Society of Hospital Medicine
