User login
Depressive Symptoms and Readmission
Unplanned hospital readmission within 30 days is an important marker of the quality of care provided in the hospital and in the immediate posthospital setting.[1] In the United States, 1 in 5 Medicare patients is readmitted within 30 days, and related Medicare costs are estimated to be $17 billion annually.[2] Public policy is attempting to drive down healthcare costs in the United States via the Affordable Care Act by reducing payments to hospitals that have high 30‐day readmission rates.[3]
The prevalence of depression is 6.7% of adults,[4] and depressive symptomatology has been linked to hospital readmission.[5, 6] Depressive symptoms are associated with poor health outcomes and increased utilization. Patients with cardiac disease and depressive symptoms have worse outcomes.[7] Mild symptoms are associated with increased primary care and mental health care visits.[8] Both mild and moderate‐to‐severe depressive symptomatology are associated with symptom burden, physical limitation, quality of life, and overall health.[9] Importantly, many hospitalized patients, who do not have a diagnosis of depression, display depressive symptomatology.[10] A gap in knowledge exists as to the utility of stratifying depressive symptomatology between mild and moderate to severe in determining risk for hospital readmission.
Although the causal pathway to worse outcomes in patients with a diagnosis of depression has been studied,[11] the reasons for poor outcomes of patients with depressive symptomatology have not been well described, particularly in hospitalized general medical patients. Nonadherence to physician recommendations, decreased cognitive function, and poor adherence to self‐care recommendations[12, 13, 14] may explain increased healthcare utilization. Physiological models hypothesize heightened levels of proinflammatory markers[15, 16] and vascular depression[17] may play a role. There remains a gap in knowledge as to the postdischarge utilization of hospitalized patients with depressive symptomatology.
We studied the rate of hospital readmission among hospitalized adult patients with mild and moderate‐to‐severe depressive symptoms as defined by the 9‐Item Patient Health Questionnaire (PHQ‐9) depression screening tool.[18]
METHODS
Setting, Data, and Participants
Data from 2 Project Re‐Engineered Discharge (RED) clinical trials were included in a secondary analysis.[19, 20, 21] Depressive symptom screening data were available for 1418 participants originally randomized to the control and experimental groups in each trial.
The Project RED trials were a set of 2‐armed randomized controlled trials studying hospital utilization following a standardized hospital‐based discharge process. Inclusion criteria included English‐speaking patients who were 18 years or older and admitted to the adult medical service at Boston Medical Center, a large urban safety‐net hospital with an ethnically diverse patient population. Patients were required to have a telephone and have plans to return home after discharge. Patients were excluded if admitted from a skilled nursing facility or other hospital, transferred to a different hospital service before enrollment, admitted for a planned hospitalization, on hospital precautions, on suicide watch, or were deaf or blind. A full description of the methods has been described.[19] The second RED trial differed in that a health information technology system was used to teach the discharge plan to subjects at the time of discharge rather than a nurse.[20, 21]
The institutional review board of Boston University approved all study activities.
Outcome Variables
The primary end point for this analysis was the hospital readmission rate, defined as the total number of readmissions per subject within 30 days of the index discharge. Data were collected by hospital electronic medical record (EMR) review and by contacting subjects by telephone 30 days after discharge. Research staff collected data and were blinded to study group assignment. We examined emergency department (ED) utilization and primary care physician (PCP) follow‐up visit attendance rates within 30 days of discharge. Any ED or ambulatory visit resulting in hospital admission within 30 days of the index discharge date was counted as 1 readmission. Readmission and ED utilization dates occurring at Boston Medical Center were obtained from its EMR, whereas those at other hospitals were collected through subject report.
Primary Independent Variable
The primary independent variable was the PHQ‐9 screening questionnaire score, designed to identify patients with depressive symptoms. Data were collected at the time of enrollment during the index admission. Symptoms were categorized into 3 groups: no depression (PHQ‐9 score of 04, or less than a score of 2 on the first 2 questions of the PHQ‐9), mild depressive symptoms (PHQ‐9 score of 59), and moderate‐to‐severe symptoms (PHQ‐9 score of 1027).[18]
Statistical Analysis
Potential confounders were identified a priori from available literature on factors associated with hospital readmission. These included age,[22] race, gender,[23] marital status, health literacy (using the Rapid Estimate of Health Literacy in Adult Medicine [REALM] tool),[24] insurance type, employment status, income level,[25] Charlson Comorbidity Index,[26] homelessness within the past 3 months, hospital utilization within the 6 months before the index hospitalization,[27] educational attainment, length of hospital stay,[28] and study group assignment.
Demographic and other characteristics were compared by dichotomized healthcare reutilization outcomes using bivariate analysis to identify potential confounders of the relationship between depressive symptom severity and hospital readmission. [2] tests were used for categorical variables and t tests for continuous variables. Age (years) and length of stay (days) were used as continuous variables. Gender (male/female), frequent hospital admission within 6 months (01 vs 2 or more), homelessness, and presence of substance use disorder diagnosis (defined by the International Statistical Classification of Disease, 9th Revision [ICD‐9] diagnosis codes, which included 303.0 [alcohol dependence], 305.0 [alcohol abuse], 291.0 [alcohol‐induced mental disorders], 304.0 [drug dependence], 305.2305.7, 305.9 [drug abuse] and 292.0 [drug‐induced mental disorders]) were treated as dichotomous variables. Categorical variables were created for marital status (single, married, divorced/widowed), educational attainment (less than or incomplete high school, high school graduate, some college, college graduate), insurance type (Medicare, Medicaid, private insurance, or Free Care), income level (<$19,999 per year, $20,00039,000, $40,00074,999, >$75,000, or unknown/refused to answer), employment status (working full time, working part time, not working, or no answer), and health literacy level according to REALM score (044 [grade 6 or below], 4560 [grade 78], or 6166 [grade 9 or above]).
The readmission rate reflects the number of hospital readmission events per subject within 30 days of discharge. The PCP follow‐up rate reflects the number of subjects attending a posthospital PCP visit within 30 days of discharge. The incidence rate ratio (IRR) was calculated to compare the rates of readmission between those with mild, moderate to severe, and no depressive symptoms. Readmission data at 30 days are cumulative. Poisson models were used to test for significant differences between the predicted and observed number of events at 30 days. A stepwise selection process (with =0.2 as entry and exit criteria) was conducted to identify relevant confounders and to construct the final model for the association between depressive symptom screen severity and readmission. Using sensitivity analysis, we tested a model including substance abuse as a variable. This did not substantially change our final model, and therefore we did not include this variable in the final model.
A Kaplan‐Meier hazard curve was generated for time from the index discharge to the first hospital readmission within 30 days. The hazard of readmission was compared among the 3 depressive symptom screen categories using Cox proportional hazards. Two‐sided significance tests were used. P values <0.05 were considered to indicate statistical significance. All data were analyzed with SAS 9.3 (SAS Institute, Cary, NC).
Adjusted Poisson regression results identified individuals with readmission and/or ED utilization rates much higher than the sample mean. Data points with 5 or more hospital readmissions or 7 or more combined readmissions and ED utilizations were removed from analysis.
RESULTS
Of the total study population, 15.9% (225/1418) demonstrated mild depressive symptoms, and 23.7% (336/1418) demonstrated moderate‐to‐severe symptoms. Of those in our study, 38.9% (551/1418) self‐reported being told by a healthcare professional that they had depression. Of those self‐reporting depression, 27.9% (273/540) were currently taking antidepressant medication at the time of the index hospitalization. Table 1 shows baseline characteristics by dichotomized utilization outcome. Mean age, marital status, health insurance, employment status, mean length of stay, admissions in the previous 6 months, mean Charlson score, and substance abuse were significantly associated with hospital readmission. Of these characteristics, all but mean length of stay and previous history of substance abuse were significantly associated with ED utilization.
| Hospital Readmission | ED Utilization | |||
|---|---|---|---|---|
| No, n=1,240 | Yes, n=193 | No, n=1,231 | Yes, n=202 | |
| ||||
| Male, n (%) | 602 (48.6) | 105 (54.4) | 606 (49.3) | 101 (50.0) |
| Mean age, y (SD) | 49.14 (14.21)a | 52.24 (14.69)a | 50.06 (14.57)a | 46.45 (12.19)a |
| Race, n (%) | ||||
| White non‐Hispanic | 332 (26.8) | 73 (37.8) | 357 (29.0) | 48 (23.8) |
| Black non‐Hispanic | 666 (53.7) | 89 (46.1) | 646 (52.5) | 109 (54.0) |
| Hispanic | 135 (10.9) | 19 (9.8) | 124 (10.1) | 30 (14.9) |
| Other or mixed race | 59 (4.8) | 7 (3.6) | 56 (4.6) | 10 (5.0) |
| Unknown | 48 (3.9) | 5 (2.6) | 48 (3.9) | 5 (2.5) |
| Marital status, n (%) | ||||
| Single | 593 (47.8)a | 74 (38.3)a | 552 (44.8)a | 115 (56.9)a |
| Married | 286 (23.1)a | 42 (21.8)a | 296 (24.1)a | 32 (15.8)a |
| Divorced/widowed | 346 (27.9)a | 74 (38.3)a | 369 (20.0)a | 51 (25.3)a |
| Unknown | 15 (1.2)a | 3 (1.6)a | 14 (1.1)a | 4 (2.0)a |
| Annual personal income, n (%) | ||||
| <$19,999 | 511 (41.2) | 88 (45.6) | 509 (41.4) | 90 (44.6) |
| $20,000$39,999 | 184 (14.8) | 22 (11.4) | 175 (14.2) | 31 (15.4) |
| $40,000$74,999 | 107 (8.6) | 14 (7.3) | 111 (9.0) | 10 (5.0) |
| >$75,000 | 41 (3.3) | 8 (4.2) | 44 (3.6) | 5 (2.5) |
| Unknown/refused | 397 (32.0) | 61 (31.6) | 392 (31.8) | 66 (32.7) |
| Health insurance, n (%) | ||||
| Private | 321 (25.9)a | 34 (17.6)a | 316 (25.7)a | 39 (19.3)a |
| Medicaid | 510 (41.1)a | 90 (46.6)a | 485 (39.4)a | 115 (56.9)a |
| Medicare | 138 (11.1)a | 43 (22.3)a | 170 (13.8)a | 11 (5.5)a |
| Free Care | 207 (16.7)a | 14 (7.3)a | 190 (15.4)a | 31 (15.4)a |
| Other/unknown | 64 (5.2)a | 12 (6.2)a | 70 (5.7)a | 6 (3.0)a |
| Education level, n (%) | ||||
| Incomplete high school | 290 (23.4) | 45 (23.3) | 288 (23.4) | 47 (23.3) |
| High school graduate/GED | 492 (39.7) | 87 (45.1) | 489 (39.7) | 90 (44.6) |
| Some college | 257 (20.7) | 34 (17.6) | 255 (20.7) | 36 (17.8) |
| College degree | 183 (14.8) | 25 (13.0) | 183 (14.9) | 25 (12.4) |
| Unknown | 18 (1.5) | 2 (1.0) | 16 (1.3) | 4 (2.0) |
| Employment status, n (%) | ||||
| Full time | 322 (26.4)a | 31 (16.6)a | 316 (26.2)a | 37 (18.7)a |
| Part time | 136 (11.2)a | 11 (5.9)a | 124 (10.3)a | 23 (11.6)a |
| Retired | 172 (14.1)a | 37 (19.8)a | 196 (16.2)a | 13 (6.6)a |
| Disabled | 278 (22.8)a | 72 (38.5)a | 287 (23.8)a | 63 (31.8)a |
| Unemployed | 286 (23.5)a | 31 (16.6)a | 258 (21.4)a | 59 (29.8)a |
| Student | 24 (2.0)a | 5 (2.7)a | 26 (2.2)a | 3 (1.5)a |
| Homeless in past 6 months, n (%) | 143 (11.6) | 24 (12.5) | 126 (10.3) | 41 (20.4) |
| Health literacy, n (%)b | ||||
| 6th‐grade level | 230 (19.2) | 41 (22.4) | 228 (19.2) | 43 (22.4) |
| 7th8th‐grade level | 342 (28.5) | 60 (32.8) | 342 (28.7) | 60 (31.3) |
| 9th‐grade level | 627 (52.3) | 82 (44.8) | 620 (52.1) | 89 (46.4) |
| Mean length of stay, d (SD) | 2.69 (2.60)a | 3.57 (3.50)a | 2.81 (2.80) | 2.84 (2.18) |
| PCP at enrollment, n (%)c | 1,005 (81.1) | 166 (86.0) | 1,005 (81.7) | 166 (82.2) |
| 2 Admissions in past 6 months, n (%) | 300 (24.2)a | 81 (42.0)a | 292 (23.7)a | 89 (44.1)a |
| Mean Charlson score (SD)d | 2.19 (2.53)a | 2.85 (2.78)a | 2.34 (2.60)a | 1.92 (2.18)a |
| Substance abuse, n (%)e | 138 (12.0)a | 36 (19.7)a | 151 (13.1) | 23 (12.6) |
Table 2 shows the unadjusted 30 day hospital readmission, ED utilization, and PCP follow‐up rates. Participants with mild symptoms had higher readmission rates than those without symptoms (0.20 vs 0.13). In other words, 20 readmissions occurred per 100 subjects with mild symptoms, compared with 13 readmissions per 100 subjects without symptoms (P<0.001). The readmission rate was 0.21 for subjects with moderate‐to‐severe depression. The rate of ED utilization for subjects with mild symptoms was 0.18. This was significantly different from ED utilization rates of those with no depression and those with moderate‐to‐severe symptoms, which were 0.16 and 0.28, respectively (P<0.001). The postdischarge follow‐up rates were different for those without depression compared to those with mild and moderate‐to‐severe symptoms (58.7, 49.5, and 51.1, respectively), but this did not reach statistical significance (P=0.06).
| Depressive Symptom Severity Based on PHQ‐9 Score, N=1,418 | P Value | |||
|---|---|---|---|---|
| No Depression, n=857 | Mild Depressive Symptoms, n=225 | Moderate‐to‐Severe Depressive Symptoms, n=336 | ||
| ||||
| Hospital readmission, n (rate per 100) | 108 (12.6) | 44 (19.6) | 71 (21.1) | <0.001 |
| ED utilization, n (rate per 100) | 133 (15.5) | 41 (18.2) | 94 (28.0) | <0.001 |
| PCP follow‐up, n (rate per 100) | 420 (58.7) | 103 (49.5) | 157 (51.1) | 0.06 |
Poisson analyses were conducted to control for potential confounding in the relationship between symptom severity and readmission or ED utilization (Table 3). Compared to subjects with no depression, the association between mild symptoms and readmission remained significant (adjusted IRR: 1.49; 95% confidence interval [CI]: 1.11‐2.00) after controlling for relevant confounders. For those with moderate‐to‐severe symptoms, the adjusted IRR was 1.96 (95% CI: 1.51‐2.49). When compared to those without depression, the adjusted IRR for ED reutilization was not found to be significant for those with mild symptoms (1.30; 95% CI: 0.96‐1.76) and significant for those participants with moderate‐to‐severe symptoms (1.48; 95% CI: 1.16‐1.89).
| Depressive Symptom Severity Based on PHQ‐9 Score, N=1418 | P Value | |||
|---|---|---|---|---|
| No Depression, n=857 | Mild Depressive Symptoms, n=225 | Moderate‐to‐Severe Depressive Symptoms, n=336 | ||
| ||||
| Hospital readmission, n (rate per 100) | 96 (11.9) | 36 (17.1) | 67 (21.1) | <0.001 |
| Hospital readmission IRR (95% CI) | Ref | 1.49 (1.11‐2.00) | 1.96 (1.51‐2.49) | |
| ED utilization, n (rate per 100) | 124 (15.2) | 40 (19.0) | 85 (26.7) | 0.007 |
| ED utilization IRR (95% CI) | Ref | 1.30 (0.96‐1.76) | 1.48 (1.16‐1.89) | |
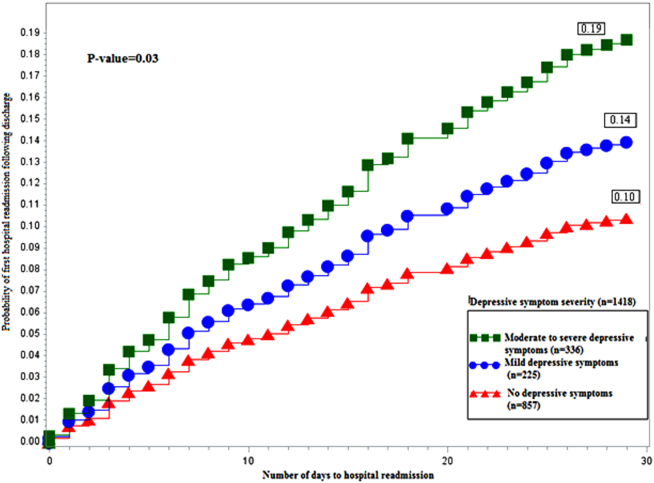
Figure 1 depicts the hazard curve generated for the time to first hospital readmission, stratified by depressive symptom severity. A readmission within 30 days following an index discharge date occurred in 10% of participants without depression, 14% of those with mild symptoms, and 19% of those with moderate‐to‐severe symptoms (P=0.03).
DISCUSSION
Our study shows hospitalized medical patients at an urban academic hospital with a positive screen for depressive symptoms are significantly more likely to be readmitted within 30 days of discharge as compared to those who do not screen positive. The significant association of depressive symptoms and readmission remains even after stratifying by severity and controlling for relevant confounders. Further, there appears to be a dose‐response relationship between depressive symptom severity and readmission. This graded effect makes the distinction between mild and moderate‐to‐severe depressive symptoms a better instrument at predicting rehospitalization than a diagnostic code for depression. Few studies have analyzed the readmission of general medical patients stratified by depressive symptomatology, and even fewer have addressed the presence of mild depressive symptomatology as it relates to readmission. A diagnosis of mild depression is associated with similar though less severe outcomes as compared to major depression, including negative effects on quality of life, functional disability, health status, and mortality.[29] Patients with heart failure and mild depressive symptoms have higher rates of readmission at 3 months and 1 year as compared with those without depressive symptoms, but these findings were not found to be significant.[30] Mild depressive symptoms may contribute to readmission, accrued medical cost, and burden of disease.
We extend previous research[5, 31, 32] by showing that, compared to those without and those with mild symptoms, the readmission risk is even greater for those who screen positive for moderate‐to‐severe symptoms. The mechanism linking depressive symptoms and readmission is not well understood. Behavioral mechanisms such as physical symptom amplification or anxiety about symptoms link depressive symptoms to healthcare utilization after discharge.[33] Depressive symptoms among patients with diabetes, asthma, hypertension, or human immunodeficiency virus (HIV) impairs medication adherence and self‐care behavior.[14, 34, 35, 36] Depressed patients might have reduced social support leading to increased stress, worsened symptoms, and prolonged recovery.[37] These mechanisms may prompt patients to present to hospitals for reevaluation. The direct physiologic consequences of depressive symptoms may be similar to that of the diagnosis of depression. Patients with cardiovascular disease and depression have poor outcomes, which may be related to decreased heart rate variability, hypercoagulability, high burden of inflammatory markers, and severity of left ventricular dysfunction.[38, 39] Among patients with HIV/acquired immunodeficiency syndrome and coronary artery disease, depression is linked to increased proinflammatory marker levels and less favorable outcomes, which may signal a more severe form of the disease or an impaired response to treatment.[15, 16]
Our data have several implications. Though disease burden may play a role in the presence of depressive symptomatology in hospitalized patients, screen‐positive patients still experienced more readmission events as compared to those without depressive symptoms after controlling for relevant confounders. Further, there appears to be a dose‐dependent relationship between depressive symptom severity and rate of readmission. Use of a categorical ICD‐9 code often implies that the diagnosis of depression has been confirmed. Rather than using administrative ICD‐9 codes to account for readmission risk, hospitals may consider screening patients for depressive symptoms during hospitalizations to both identify and risk‐stratify patients at high risk for readmission. Procedures should be implemented to address barriers to safe transitions in care in the screen‐positive population. The relationship between symptom severity and readmission rate may aid in the decision to devote resources to those at highest risk of readmission. Lastly, though research on the treatment of depressive symptoms in medical inpatients has been inconclusive in determining whether this approach is better than usual care or structured pharmacotherapies,[40] further study is needed to determine whether treatment of mild and moderate‐to‐severe depressive symptoms during an acute medical hospitalization will decrease readmission.
Strengths of the current study include the large dataset, the broad range of covariates available for analyses, and the inclusive nature of the sample, which was not restricted to factors such as age or medical condition.
Several limitations should be noted. We did not conduct a psychiatric evaluation to evaluate screen‐positive patients who met diagnostic criteria for minor or major depressive disorder, nor did we reconfirm the presence of symptoms at the time of or following hospital discharge. Our data, then, may not reflect patients' depressive symptomatology prior to the index hospitalization or at the time of discharge. Although such data might further refine the use of depressive symptomatology in identifying patients at high risk for readmission, our findings demonstrate that simply screening positive for depressive symptomatology at time of admission is associated with increased risk of readmission. We do not know the direction of the reported associations. If depressive symptoms are the consequence of higher disease burden, treatment of the underlying disease may be the most important intervention. Although this is possible, our model does include variables (eg, length of stay, Charlson Comorbidity Index), which are likely to adjust for disease severity, pointing to the likelihood that depressive symptoms truly predict hospital readmission independent of disease severity. Data on utilization outside Boston Medical Center (about 9% of outcomes) were determined by patient self‐report and not confirmed by document review. Our results may not be generalizable to populations other than those served by an urban safety‐net hospital or other populations excluded from analysis (eg, nonEnglish‐speaking patients, patients from nursing homes). Finally, social factors such as social support may residually confound the relationship between depressive symptom severity and readmission.
Our finding linking both mild and moderate‐to‐severe depressive symptoms to increased readmission when compared to those without depressive symptoms is significant for future policy. If future studies demonstrate that the initiation of treatment of patients who screen positive for depressive symptoms during an acute hospitalization leads to reduced readmission, policymakers should increase support for mental health screening and programming as an integral portion of general medical patient management.
In conclusion, screening positive for mild or moderate‐to‐severe depressive symptoms is associated with an increased rate of early hospital readmission as compared to those without depressive symptoms, even after controlling for relevant confounders. The rate and hazard of hospital readmission increase with symptom severity. This finding has important implications for future research for hospital screening programming and interventions for patients who screen positive for depressive symptoms.
Disclosures: This research was funded in part by grants from the Agency for Healthcare Research and Quality (NCT00252057) and the National Heart, Lung, and Blood Institute (NCT00217867). Dr. Cancino has been paid for consulting work for PracticeUpdate, a subsidiary of Elsevier. Dr. Culpepper has been paid for participation in advisory boards by AstraZeneca, Eli Lilly and Co., Boehringer Ingelheim Pharmaceuticals Inc., Forest Labs, Janssen Pharmaceuticals, Inc., Jazz Pharmaceuticals plc, H. Lundbeck A/S, Merck & Co., Pfizer Inc., Reckitt Benckiser Pharmaceuticals Inc., Sunovion Pharmaceuticals Inc., and Takeda Pharmaceuticals Inc. He has received payment for educational presentations regarding hospital readmission without mention of any pharmaceutical or other products from Merck. Dr. Mitchell has received honoraria from Merck for lectures on health behavior counseling. Trial registration: NCT00252057, NCT00217867.
- , , , , . The association between the quality of inpatient care and early readmission: a meta‐analysis of the evidence. Med Care. 1997;35(10):1044–1059.
- , , . Rehospitalizations among patients in the Medicare fee‐for‐service program. N Engl J Med. 2009;360(14):1418–1428.
- Medicare program. Final rule. Fed Regist. 2012;77(170):53257–53750.
- , , , , . Prevalence, severity, and comorbidity of 12‐month DSM‐IV disorders in the National Comorbidity Survey Replication. Arch Gen Psychiatry. 2005;62(6):617–627.
- , , , et al. Post‐discharge hospital utilization among adult medical inpatients with depressive symptoms. J Hosp Med. 2010;5(7):378–384.
- , , , , . The association between depressive symptoms and non‐psychiatric hospitalisation in older adults. PLoS One. 2012;7(4):e34821.
- , , , . Depressive symptoms and risk of functional decline and death in patients with heart failure. J Am Coll Cardiol. 2001;38(1):199–205.
- , , , . Mental health conditions are associated with increased health care utilization among urban family medicine patients. J Am Board Fam Med. 2008;21(5):398–407.
- , , , , , . Depressive symptoms and health‐related quality of life: the heart and soul study. JAMA. 2003;290(2):215–221.
- , , , , , . Major depressive disorder in hospitalized medically ill patients: an examination of young and elderly male veterans. J Am Geriatr Soc. 1991;39(9):881–890.
- , . Single item on positive affect is associated with 1‐year survival in consecutive medical inpatients. Gen Hosp Psychiatry. 2009;31(1):8–13.
- , , . The effect of depression on self‐care behaviors and quality of care in a national sample of adults with diabetes. Gen Hosp Psychiatry. 2009;31(5):422–427.
- , , , et al. The prevalence and correlates of major and minor depression in older medical inpatients. J Am Geriatr Soc. 2005;53(8):1344–1353.
- , , , , . Depression is an important contributor to low medication adherence in hemodialyzed patients and transplant recipients. Kidney Int. 2009;75(11):1223–1229.
- , . Depression and immunity: inflammation and depressive symptoms in multiple sclerosis. Neurol Clin. 2006;24(3):507–519.
- , , , et al. Synergistic effects of psychological and immune stressors on inflammatory cytokine and sickness responses in humans. Brain Behav Immun. 2009;23(2):217–224.
- , , , et al. Relationship between baseline white‐matter changes and development of late‐life depressive symptoms: 3‐year results from the LADIS study. Psychol Med. 2010;40(4):603–610.
- , , . The PHQ‐9: validity of a brief depression severity measure. J Gen Intern Med. 2001;16(9):606–613.
- , , , et al. A reengineered hospital discharge program to decrease rehospitalization: a randomized trial. Ann Intern Med. 2009;150(3):178–187.
- , , . Taking the time to care: empowering low health literacy hospital patients with virtual nurse agents. In: Proceedings of the SIGCHI Conference on Human Factors in Computing Systems. New York, NY: Association for Computing Machinery; 2009:1265–1274.
- , , , et al. Usability of conversational agents by patients with inadequate health literacy: evidence from two clinical trials. J Health Commun. 2010;15(suppl 2):197–210.
- , , , , , . Factors associated with unplanned hospital readmission among patients 65 years of age and older in a Medicare managed care plan. Am J Med. 1999;107(1):13–17.
- , , , et al. Gender as risk factor for 30 days post‐discharge hospital utilisation: a secondary data analysis. BMJ Open. 2012;2(2):e000428.
- , , , et al. Rapid estimate of adult literacy in medicine: a shortened screening instrument. Fam Med. 1993;25(6):391–395.
- , , . The impact of patient socioeconomic status and other social factors on readmission: a prospective study in four Massachusetts hospitals. Inquiry. 1994;31(2):163–172.
- , , , . A new method of classifying prognostic comorbidity in longitudinal studies: development and validation. J Chronic Dis. 1987;40(5):373–383.
- , , , . Continuity of care and patient outcomes after hospital discharge. J Gen Intern Med. 2004;19(6):624–631.
- , , , et al. Readmission after hospitalization for congestive heart failure among Medicare beneficiaries. Arch Intern Med. 1997;157(1):99–104.
- , , . Minor depression: risk profiles, functional disability, health care use and risk of developing major depression. J Affect Disord. 2004;79(1‐3):71–79.
- , , , et al. Relationship of depression to increased risk of mortality and rehospitalization in patients with congestive heart failure. Arch Intern Med. 2001;161(15):1849–1856.
- , , , et al. Antidepressant drug effects and depression severity: a patient‐level meta‐analysis. JAMA. 2010;303(1):47–53.
- , , , et al. Depression is a risk factor for rehospitalization in medical inpatients. Prim Care Companion J Clin Psychiatry. 2007;9(4):256–262.
- , , , et al. Adverse drug reactions as cause of admission to hospital: prospective analysis of 18 820 patients. BMJ. 2004;329(7456):15–19.
- , , , et al. The effect of adherence on the association between depressive symptoms and mortality among HIV‐infected individuals first initiating HAART. AIDS. 2007;21(9):1175–1183.
- , , , et al. Symptoms of depression prospectively predict poorer self‐care in patients with Type 2 diabetes. Diabet Med. 2008;25(9):1102–1107.
- , , . Self‐efficacy mediates the relationship between depressive symptoms and medication adherence among hypertensive African Americans. Health Educ Behav. 2009;36(1):127–137.
- , . The impact of depression on social skills. J Nerv Ment Dis. 2004;192(4):260–268.
- , , , et al. Relationship between left ventricular dysfunction and depression following myocardial infarction: data from the MIND‐IT. Eur Heart J. 2005;26(24):2650–2656.
- , , , et al. Platelet/endothelial biomarkers in depressed patients treated with the selective serotonin reuptake inhibitor sertraline after acute coronary events: the Sertraline AntiDepressant Heart Attack Randomized Trial (SADHART) Platelet Substudy. Circulation. 2003;108(8):939–944.
- , , , , , . Psychological treatment of depression in inpatients: a systematic review and meta‐analysis. Clin Psychol Rev. 2011;31(3):353–360.
Unplanned hospital readmission within 30 days is an important marker of the quality of care provided in the hospital and in the immediate posthospital setting.[1] In the United States, 1 in 5 Medicare patients is readmitted within 30 days, and related Medicare costs are estimated to be $17 billion annually.[2] Public policy is attempting to drive down healthcare costs in the United States via the Affordable Care Act by reducing payments to hospitals that have high 30‐day readmission rates.[3]
The prevalence of depression is 6.7% of adults,[4] and depressive symptomatology has been linked to hospital readmission.[5, 6] Depressive symptoms are associated with poor health outcomes and increased utilization. Patients with cardiac disease and depressive symptoms have worse outcomes.[7] Mild symptoms are associated with increased primary care and mental health care visits.[8] Both mild and moderate‐to‐severe depressive symptomatology are associated with symptom burden, physical limitation, quality of life, and overall health.[9] Importantly, many hospitalized patients, who do not have a diagnosis of depression, display depressive symptomatology.[10] A gap in knowledge exists as to the utility of stratifying depressive symptomatology between mild and moderate to severe in determining risk for hospital readmission.
Although the causal pathway to worse outcomes in patients with a diagnosis of depression has been studied,[11] the reasons for poor outcomes of patients with depressive symptomatology have not been well described, particularly in hospitalized general medical patients. Nonadherence to physician recommendations, decreased cognitive function, and poor adherence to self‐care recommendations[12, 13, 14] may explain increased healthcare utilization. Physiological models hypothesize heightened levels of proinflammatory markers[15, 16] and vascular depression[17] may play a role. There remains a gap in knowledge as to the postdischarge utilization of hospitalized patients with depressive symptomatology.
We studied the rate of hospital readmission among hospitalized adult patients with mild and moderate‐to‐severe depressive symptoms as defined by the 9‐Item Patient Health Questionnaire (PHQ‐9) depression screening tool.[18]
METHODS
Setting, Data, and Participants
Data from 2 Project Re‐Engineered Discharge (RED) clinical trials were included in a secondary analysis.[19, 20, 21] Depressive symptom screening data were available for 1418 participants originally randomized to the control and experimental groups in each trial.
The Project RED trials were a set of 2‐armed randomized controlled trials studying hospital utilization following a standardized hospital‐based discharge process. Inclusion criteria included English‐speaking patients who were 18 years or older and admitted to the adult medical service at Boston Medical Center, a large urban safety‐net hospital with an ethnically diverse patient population. Patients were required to have a telephone and have plans to return home after discharge. Patients were excluded if admitted from a skilled nursing facility or other hospital, transferred to a different hospital service before enrollment, admitted for a planned hospitalization, on hospital precautions, on suicide watch, or were deaf or blind. A full description of the methods has been described.[19] The second RED trial differed in that a health information technology system was used to teach the discharge plan to subjects at the time of discharge rather than a nurse.[20, 21]
The institutional review board of Boston University approved all study activities.
Outcome Variables
The primary end point for this analysis was the hospital readmission rate, defined as the total number of readmissions per subject within 30 days of the index discharge. Data were collected by hospital electronic medical record (EMR) review and by contacting subjects by telephone 30 days after discharge. Research staff collected data and were blinded to study group assignment. We examined emergency department (ED) utilization and primary care physician (PCP) follow‐up visit attendance rates within 30 days of discharge. Any ED or ambulatory visit resulting in hospital admission within 30 days of the index discharge date was counted as 1 readmission. Readmission and ED utilization dates occurring at Boston Medical Center were obtained from its EMR, whereas those at other hospitals were collected through subject report.
Primary Independent Variable
The primary independent variable was the PHQ‐9 screening questionnaire score, designed to identify patients with depressive symptoms. Data were collected at the time of enrollment during the index admission. Symptoms were categorized into 3 groups: no depression (PHQ‐9 score of 04, or less than a score of 2 on the first 2 questions of the PHQ‐9), mild depressive symptoms (PHQ‐9 score of 59), and moderate‐to‐severe symptoms (PHQ‐9 score of 1027).[18]
Statistical Analysis
Potential confounders were identified a priori from available literature on factors associated with hospital readmission. These included age,[22] race, gender,[23] marital status, health literacy (using the Rapid Estimate of Health Literacy in Adult Medicine [REALM] tool),[24] insurance type, employment status, income level,[25] Charlson Comorbidity Index,[26] homelessness within the past 3 months, hospital utilization within the 6 months before the index hospitalization,[27] educational attainment, length of hospital stay,[28] and study group assignment.
Demographic and other characteristics were compared by dichotomized healthcare reutilization outcomes using bivariate analysis to identify potential confounders of the relationship between depressive symptom severity and hospital readmission. [2] tests were used for categorical variables and t tests for continuous variables. Age (years) and length of stay (days) were used as continuous variables. Gender (male/female), frequent hospital admission within 6 months (01 vs 2 or more), homelessness, and presence of substance use disorder diagnosis (defined by the International Statistical Classification of Disease, 9th Revision [ICD‐9] diagnosis codes, which included 303.0 [alcohol dependence], 305.0 [alcohol abuse], 291.0 [alcohol‐induced mental disorders], 304.0 [drug dependence], 305.2305.7, 305.9 [drug abuse] and 292.0 [drug‐induced mental disorders]) were treated as dichotomous variables. Categorical variables were created for marital status (single, married, divorced/widowed), educational attainment (less than or incomplete high school, high school graduate, some college, college graduate), insurance type (Medicare, Medicaid, private insurance, or Free Care), income level (<$19,999 per year, $20,00039,000, $40,00074,999, >$75,000, or unknown/refused to answer), employment status (working full time, working part time, not working, or no answer), and health literacy level according to REALM score (044 [grade 6 or below], 4560 [grade 78], or 6166 [grade 9 or above]).
The readmission rate reflects the number of hospital readmission events per subject within 30 days of discharge. The PCP follow‐up rate reflects the number of subjects attending a posthospital PCP visit within 30 days of discharge. The incidence rate ratio (IRR) was calculated to compare the rates of readmission between those with mild, moderate to severe, and no depressive symptoms. Readmission data at 30 days are cumulative. Poisson models were used to test for significant differences between the predicted and observed number of events at 30 days. A stepwise selection process (with =0.2 as entry and exit criteria) was conducted to identify relevant confounders and to construct the final model for the association between depressive symptom screen severity and readmission. Using sensitivity analysis, we tested a model including substance abuse as a variable. This did not substantially change our final model, and therefore we did not include this variable in the final model.
A Kaplan‐Meier hazard curve was generated for time from the index discharge to the first hospital readmission within 30 days. The hazard of readmission was compared among the 3 depressive symptom screen categories using Cox proportional hazards. Two‐sided significance tests were used. P values <0.05 were considered to indicate statistical significance. All data were analyzed with SAS 9.3 (SAS Institute, Cary, NC).
Adjusted Poisson regression results identified individuals with readmission and/or ED utilization rates much higher than the sample mean. Data points with 5 or more hospital readmissions or 7 or more combined readmissions and ED utilizations were removed from analysis.
RESULTS
Of the total study population, 15.9% (225/1418) demonstrated mild depressive symptoms, and 23.7% (336/1418) demonstrated moderate‐to‐severe symptoms. Of those in our study, 38.9% (551/1418) self‐reported being told by a healthcare professional that they had depression. Of those self‐reporting depression, 27.9% (273/540) were currently taking antidepressant medication at the time of the index hospitalization. Table 1 shows baseline characteristics by dichotomized utilization outcome. Mean age, marital status, health insurance, employment status, mean length of stay, admissions in the previous 6 months, mean Charlson score, and substance abuse were significantly associated with hospital readmission. Of these characteristics, all but mean length of stay and previous history of substance abuse were significantly associated with ED utilization.
| Hospital Readmission | ED Utilization | |||
|---|---|---|---|---|
| No, n=1,240 | Yes, n=193 | No, n=1,231 | Yes, n=202 | |
| ||||
| Male, n (%) | 602 (48.6) | 105 (54.4) | 606 (49.3) | 101 (50.0) |
| Mean age, y (SD) | 49.14 (14.21)a | 52.24 (14.69)a | 50.06 (14.57)a | 46.45 (12.19)a |
| Race, n (%) | ||||
| White non‐Hispanic | 332 (26.8) | 73 (37.8) | 357 (29.0) | 48 (23.8) |
| Black non‐Hispanic | 666 (53.7) | 89 (46.1) | 646 (52.5) | 109 (54.0) |
| Hispanic | 135 (10.9) | 19 (9.8) | 124 (10.1) | 30 (14.9) |
| Other or mixed race | 59 (4.8) | 7 (3.6) | 56 (4.6) | 10 (5.0) |
| Unknown | 48 (3.9) | 5 (2.6) | 48 (3.9) | 5 (2.5) |
| Marital status, n (%) | ||||
| Single | 593 (47.8)a | 74 (38.3)a | 552 (44.8)a | 115 (56.9)a |
| Married | 286 (23.1)a | 42 (21.8)a | 296 (24.1)a | 32 (15.8)a |
| Divorced/widowed | 346 (27.9)a | 74 (38.3)a | 369 (20.0)a | 51 (25.3)a |
| Unknown | 15 (1.2)a | 3 (1.6)a | 14 (1.1)a | 4 (2.0)a |
| Annual personal income, n (%) | ||||
| <$19,999 | 511 (41.2) | 88 (45.6) | 509 (41.4) | 90 (44.6) |
| $20,000$39,999 | 184 (14.8) | 22 (11.4) | 175 (14.2) | 31 (15.4) |
| $40,000$74,999 | 107 (8.6) | 14 (7.3) | 111 (9.0) | 10 (5.0) |
| >$75,000 | 41 (3.3) | 8 (4.2) | 44 (3.6) | 5 (2.5) |
| Unknown/refused | 397 (32.0) | 61 (31.6) | 392 (31.8) | 66 (32.7) |
| Health insurance, n (%) | ||||
| Private | 321 (25.9)a | 34 (17.6)a | 316 (25.7)a | 39 (19.3)a |
| Medicaid | 510 (41.1)a | 90 (46.6)a | 485 (39.4)a | 115 (56.9)a |
| Medicare | 138 (11.1)a | 43 (22.3)a | 170 (13.8)a | 11 (5.5)a |
| Free Care | 207 (16.7)a | 14 (7.3)a | 190 (15.4)a | 31 (15.4)a |
| Other/unknown | 64 (5.2)a | 12 (6.2)a | 70 (5.7)a | 6 (3.0)a |
| Education level, n (%) | ||||
| Incomplete high school | 290 (23.4) | 45 (23.3) | 288 (23.4) | 47 (23.3) |
| High school graduate/GED | 492 (39.7) | 87 (45.1) | 489 (39.7) | 90 (44.6) |
| Some college | 257 (20.7) | 34 (17.6) | 255 (20.7) | 36 (17.8) |
| College degree | 183 (14.8) | 25 (13.0) | 183 (14.9) | 25 (12.4) |
| Unknown | 18 (1.5) | 2 (1.0) | 16 (1.3) | 4 (2.0) |
| Employment status, n (%) | ||||
| Full time | 322 (26.4)a | 31 (16.6)a | 316 (26.2)a | 37 (18.7)a |
| Part time | 136 (11.2)a | 11 (5.9)a | 124 (10.3)a | 23 (11.6)a |
| Retired | 172 (14.1)a | 37 (19.8)a | 196 (16.2)a | 13 (6.6)a |
| Disabled | 278 (22.8)a | 72 (38.5)a | 287 (23.8)a | 63 (31.8)a |
| Unemployed | 286 (23.5)a | 31 (16.6)a | 258 (21.4)a | 59 (29.8)a |
| Student | 24 (2.0)a | 5 (2.7)a | 26 (2.2)a | 3 (1.5)a |
| Homeless in past 6 months, n (%) | 143 (11.6) | 24 (12.5) | 126 (10.3) | 41 (20.4) |
| Health literacy, n (%)b | ||||
| 6th‐grade level | 230 (19.2) | 41 (22.4) | 228 (19.2) | 43 (22.4) |
| 7th8th‐grade level | 342 (28.5) | 60 (32.8) | 342 (28.7) | 60 (31.3) |
| 9th‐grade level | 627 (52.3) | 82 (44.8) | 620 (52.1) | 89 (46.4) |
| Mean length of stay, d (SD) | 2.69 (2.60)a | 3.57 (3.50)a | 2.81 (2.80) | 2.84 (2.18) |
| PCP at enrollment, n (%)c | 1,005 (81.1) | 166 (86.0) | 1,005 (81.7) | 166 (82.2) |
| 2 Admissions in past 6 months, n (%) | 300 (24.2)a | 81 (42.0)a | 292 (23.7)a | 89 (44.1)a |
| Mean Charlson score (SD)d | 2.19 (2.53)a | 2.85 (2.78)a | 2.34 (2.60)a | 1.92 (2.18)a |
| Substance abuse, n (%)e | 138 (12.0)a | 36 (19.7)a | 151 (13.1) | 23 (12.6) |
Table 2 shows the unadjusted 30 day hospital readmission, ED utilization, and PCP follow‐up rates. Participants with mild symptoms had higher readmission rates than those without symptoms (0.20 vs 0.13). In other words, 20 readmissions occurred per 100 subjects with mild symptoms, compared with 13 readmissions per 100 subjects without symptoms (P<0.001). The readmission rate was 0.21 for subjects with moderate‐to‐severe depression. The rate of ED utilization for subjects with mild symptoms was 0.18. This was significantly different from ED utilization rates of those with no depression and those with moderate‐to‐severe symptoms, which were 0.16 and 0.28, respectively (P<0.001). The postdischarge follow‐up rates were different for those without depression compared to those with mild and moderate‐to‐severe symptoms (58.7, 49.5, and 51.1, respectively), but this did not reach statistical significance (P=0.06).
| Depressive Symptom Severity Based on PHQ‐9 Score, N=1,418 | P Value | |||
|---|---|---|---|---|
| No Depression, n=857 | Mild Depressive Symptoms, n=225 | Moderate‐to‐Severe Depressive Symptoms, n=336 | ||
| ||||
| Hospital readmission, n (rate per 100) | 108 (12.6) | 44 (19.6) | 71 (21.1) | <0.001 |
| ED utilization, n (rate per 100) | 133 (15.5) | 41 (18.2) | 94 (28.0) | <0.001 |
| PCP follow‐up, n (rate per 100) | 420 (58.7) | 103 (49.5) | 157 (51.1) | 0.06 |
Poisson analyses were conducted to control for potential confounding in the relationship between symptom severity and readmission or ED utilization (Table 3). Compared to subjects with no depression, the association between mild symptoms and readmission remained significant (adjusted IRR: 1.49; 95% confidence interval [CI]: 1.11‐2.00) after controlling for relevant confounders. For those with moderate‐to‐severe symptoms, the adjusted IRR was 1.96 (95% CI: 1.51‐2.49). When compared to those without depression, the adjusted IRR for ED reutilization was not found to be significant for those with mild symptoms (1.30; 95% CI: 0.96‐1.76) and significant for those participants with moderate‐to‐severe symptoms (1.48; 95% CI: 1.16‐1.89).
| Depressive Symptom Severity Based on PHQ‐9 Score, N=1418 | P Value | |||
|---|---|---|---|---|
| No Depression, n=857 | Mild Depressive Symptoms, n=225 | Moderate‐to‐Severe Depressive Symptoms, n=336 | ||
| ||||
| Hospital readmission, n (rate per 100) | 96 (11.9) | 36 (17.1) | 67 (21.1) | <0.001 |
| Hospital readmission IRR (95% CI) | Ref | 1.49 (1.11‐2.00) | 1.96 (1.51‐2.49) | |
| ED utilization, n (rate per 100) | 124 (15.2) | 40 (19.0) | 85 (26.7) | 0.007 |
| ED utilization IRR (95% CI) | Ref | 1.30 (0.96‐1.76) | 1.48 (1.16‐1.89) | |
Figure 1 depicts the hazard curve generated for the time to first hospital readmission, stratified by depressive symptom severity. A readmission within 30 days following an index discharge date occurred in 10% of participants without depression, 14% of those with mild symptoms, and 19% of those with moderate‐to‐severe symptoms (P=0.03).
DISCUSSION
Our study shows hospitalized medical patients at an urban academic hospital with a positive screen for depressive symptoms are significantly more likely to be readmitted within 30 days of discharge as compared to those who do not screen positive. The significant association of depressive symptoms and readmission remains even after stratifying by severity and controlling for relevant confounders. Further, there appears to be a dose‐response relationship between depressive symptom severity and readmission. This graded effect makes the distinction between mild and moderate‐to‐severe depressive symptoms a better instrument at predicting rehospitalization than a diagnostic code for depression. Few studies have analyzed the readmission of general medical patients stratified by depressive symptomatology, and even fewer have addressed the presence of mild depressive symptomatology as it relates to readmission. A diagnosis of mild depression is associated with similar though less severe outcomes as compared to major depression, including negative effects on quality of life, functional disability, health status, and mortality.[29] Patients with heart failure and mild depressive symptoms have higher rates of readmission at 3 months and 1 year as compared with those without depressive symptoms, but these findings were not found to be significant.[30] Mild depressive symptoms may contribute to readmission, accrued medical cost, and burden of disease.
We extend previous research[5, 31, 32] by showing that, compared to those without and those with mild symptoms, the readmission risk is even greater for those who screen positive for moderate‐to‐severe symptoms. The mechanism linking depressive symptoms and readmission is not well understood. Behavioral mechanisms such as physical symptom amplification or anxiety about symptoms link depressive symptoms to healthcare utilization after discharge.[33] Depressive symptoms among patients with diabetes, asthma, hypertension, or human immunodeficiency virus (HIV) impairs medication adherence and self‐care behavior.[14, 34, 35, 36] Depressed patients might have reduced social support leading to increased stress, worsened symptoms, and prolonged recovery.[37] These mechanisms may prompt patients to present to hospitals for reevaluation. The direct physiologic consequences of depressive symptoms may be similar to that of the diagnosis of depression. Patients with cardiovascular disease and depression have poor outcomes, which may be related to decreased heart rate variability, hypercoagulability, high burden of inflammatory markers, and severity of left ventricular dysfunction.[38, 39] Among patients with HIV/acquired immunodeficiency syndrome and coronary artery disease, depression is linked to increased proinflammatory marker levels and less favorable outcomes, which may signal a more severe form of the disease or an impaired response to treatment.[15, 16]
Our data have several implications. Though disease burden may play a role in the presence of depressive symptomatology in hospitalized patients, screen‐positive patients still experienced more readmission events as compared to those without depressive symptoms after controlling for relevant confounders. Further, there appears to be a dose‐dependent relationship between depressive symptom severity and rate of readmission. Use of a categorical ICD‐9 code often implies that the diagnosis of depression has been confirmed. Rather than using administrative ICD‐9 codes to account for readmission risk, hospitals may consider screening patients for depressive symptoms during hospitalizations to both identify and risk‐stratify patients at high risk for readmission. Procedures should be implemented to address barriers to safe transitions in care in the screen‐positive population. The relationship between symptom severity and readmission rate may aid in the decision to devote resources to those at highest risk of readmission. Lastly, though research on the treatment of depressive symptoms in medical inpatients has been inconclusive in determining whether this approach is better than usual care or structured pharmacotherapies,[40] further study is needed to determine whether treatment of mild and moderate‐to‐severe depressive symptoms during an acute medical hospitalization will decrease readmission.
Strengths of the current study include the large dataset, the broad range of covariates available for analyses, and the inclusive nature of the sample, which was not restricted to factors such as age or medical condition.
Several limitations should be noted. We did not conduct a psychiatric evaluation to evaluate screen‐positive patients who met diagnostic criteria for minor or major depressive disorder, nor did we reconfirm the presence of symptoms at the time of or following hospital discharge. Our data, then, may not reflect patients' depressive symptomatology prior to the index hospitalization or at the time of discharge. Although such data might further refine the use of depressive symptomatology in identifying patients at high risk for readmission, our findings demonstrate that simply screening positive for depressive symptomatology at time of admission is associated with increased risk of readmission. We do not know the direction of the reported associations. If depressive symptoms are the consequence of higher disease burden, treatment of the underlying disease may be the most important intervention. Although this is possible, our model does include variables (eg, length of stay, Charlson Comorbidity Index), which are likely to adjust for disease severity, pointing to the likelihood that depressive symptoms truly predict hospital readmission independent of disease severity. Data on utilization outside Boston Medical Center (about 9% of outcomes) were determined by patient self‐report and not confirmed by document review. Our results may not be generalizable to populations other than those served by an urban safety‐net hospital or other populations excluded from analysis (eg, nonEnglish‐speaking patients, patients from nursing homes). Finally, social factors such as social support may residually confound the relationship between depressive symptom severity and readmission.
Our finding linking both mild and moderate‐to‐severe depressive symptoms to increased readmission when compared to those without depressive symptoms is significant for future policy. If future studies demonstrate that the initiation of treatment of patients who screen positive for depressive symptoms during an acute hospitalization leads to reduced readmission, policymakers should increase support for mental health screening and programming as an integral portion of general medical patient management.
In conclusion, screening positive for mild or moderate‐to‐severe depressive symptoms is associated with an increased rate of early hospital readmission as compared to those without depressive symptoms, even after controlling for relevant confounders. The rate and hazard of hospital readmission increase with symptom severity. This finding has important implications for future research for hospital screening programming and interventions for patients who screen positive for depressive symptoms.
Disclosures: This research was funded in part by grants from the Agency for Healthcare Research and Quality (NCT00252057) and the National Heart, Lung, and Blood Institute (NCT00217867). Dr. Cancino has been paid for consulting work for PracticeUpdate, a subsidiary of Elsevier. Dr. Culpepper has been paid for participation in advisory boards by AstraZeneca, Eli Lilly and Co., Boehringer Ingelheim Pharmaceuticals Inc., Forest Labs, Janssen Pharmaceuticals, Inc., Jazz Pharmaceuticals plc, H. Lundbeck A/S, Merck & Co., Pfizer Inc., Reckitt Benckiser Pharmaceuticals Inc., Sunovion Pharmaceuticals Inc., and Takeda Pharmaceuticals Inc. He has received payment for educational presentations regarding hospital readmission without mention of any pharmaceutical or other products from Merck. Dr. Mitchell has received honoraria from Merck for lectures on health behavior counseling. Trial registration: NCT00252057, NCT00217867.
- , , , , . The association between the quality of inpatient care and early readmission: a meta‐analysis of the evidence. Med Care. 1997;35(10):1044–1059.
- , , . Rehospitalizations among patients in the Medicare fee‐for‐service program. N Engl J Med. 2009;360(14):1418–1428.
- Medicare program. Final rule. Fed Regist. 2012;77(170):53257–53750.
- , , , , . Prevalence, severity, and comorbidity of 12‐month DSM‐IV disorders in the National Comorbidity Survey Replication. Arch Gen Psychiatry. 2005;62(6):617–627.
- , , , et al. Post‐discharge hospital utilization among adult medical inpatients with depressive symptoms. J Hosp Med. 2010;5(7):378–384.
- , , , , . The association between depressive symptoms and non‐psychiatric hospitalisation in older adults. PLoS One. 2012;7(4):e34821.
- , , , . Depressive symptoms and risk of functional decline and death in patients with heart failure. J Am Coll Cardiol. 2001;38(1):199–205.
- , , , . Mental health conditions are associated with increased health care utilization among urban family medicine patients. J Am Board Fam Med. 2008;21(5):398–407.
- , , , , , . Depressive symptoms and health‐related quality of life: the heart and soul study. JAMA. 2003;290(2):215–221.
- , , , , , . Major depressive disorder in hospitalized medically ill patients: an examination of young and elderly male veterans. J Am Geriatr Soc. 1991;39(9):881–890.
- , . Single item on positive affect is associated with 1‐year survival in consecutive medical inpatients. Gen Hosp Psychiatry. 2009;31(1):8–13.
- , , . The effect of depression on self‐care behaviors and quality of care in a national sample of adults with diabetes. Gen Hosp Psychiatry. 2009;31(5):422–427.
- , , , et al. The prevalence and correlates of major and minor depression in older medical inpatients. J Am Geriatr Soc. 2005;53(8):1344–1353.
- , , , , . Depression is an important contributor to low medication adherence in hemodialyzed patients and transplant recipients. Kidney Int. 2009;75(11):1223–1229.
- , . Depression and immunity: inflammation and depressive symptoms in multiple sclerosis. Neurol Clin. 2006;24(3):507–519.
- , , , et al. Synergistic effects of psychological and immune stressors on inflammatory cytokine and sickness responses in humans. Brain Behav Immun. 2009;23(2):217–224.
- , , , et al. Relationship between baseline white‐matter changes and development of late‐life depressive symptoms: 3‐year results from the LADIS study. Psychol Med. 2010;40(4):603–610.
- , , . The PHQ‐9: validity of a brief depression severity measure. J Gen Intern Med. 2001;16(9):606–613.
- , , , et al. A reengineered hospital discharge program to decrease rehospitalization: a randomized trial. Ann Intern Med. 2009;150(3):178–187.
- , , . Taking the time to care: empowering low health literacy hospital patients with virtual nurse agents. In: Proceedings of the SIGCHI Conference on Human Factors in Computing Systems. New York, NY: Association for Computing Machinery; 2009:1265–1274.
- , , , et al. Usability of conversational agents by patients with inadequate health literacy: evidence from two clinical trials. J Health Commun. 2010;15(suppl 2):197–210.
- , , , , , . Factors associated with unplanned hospital readmission among patients 65 years of age and older in a Medicare managed care plan. Am J Med. 1999;107(1):13–17.
- , , , et al. Gender as risk factor for 30 days post‐discharge hospital utilisation: a secondary data analysis. BMJ Open. 2012;2(2):e000428.
- , , , et al. Rapid estimate of adult literacy in medicine: a shortened screening instrument. Fam Med. 1993;25(6):391–395.
- , , . The impact of patient socioeconomic status and other social factors on readmission: a prospective study in four Massachusetts hospitals. Inquiry. 1994;31(2):163–172.
- , , , . A new method of classifying prognostic comorbidity in longitudinal studies: development and validation. J Chronic Dis. 1987;40(5):373–383.
- , , , . Continuity of care and patient outcomes after hospital discharge. J Gen Intern Med. 2004;19(6):624–631.
- , , , et al. Readmission after hospitalization for congestive heart failure among Medicare beneficiaries. Arch Intern Med. 1997;157(1):99–104.
- , , . Minor depression: risk profiles, functional disability, health care use and risk of developing major depression. J Affect Disord. 2004;79(1‐3):71–79.
- , , , et al. Relationship of depression to increased risk of mortality and rehospitalization in patients with congestive heart failure. Arch Intern Med. 2001;161(15):1849–1856.
- , , , et al. Antidepressant drug effects and depression severity: a patient‐level meta‐analysis. JAMA. 2010;303(1):47–53.
- , , , et al. Depression is a risk factor for rehospitalization in medical inpatients. Prim Care Companion J Clin Psychiatry. 2007;9(4):256–262.
- , , , et al. Adverse drug reactions as cause of admission to hospital: prospective analysis of 18 820 patients. BMJ. 2004;329(7456):15–19.
- , , , et al. The effect of adherence on the association between depressive symptoms and mortality among HIV‐infected individuals first initiating HAART. AIDS. 2007;21(9):1175–1183.
- , , , et al. Symptoms of depression prospectively predict poorer self‐care in patients with Type 2 diabetes. Diabet Med. 2008;25(9):1102–1107.
- , , . Self‐efficacy mediates the relationship between depressive symptoms and medication adherence among hypertensive African Americans. Health Educ Behav. 2009;36(1):127–137.
- , . The impact of depression on social skills. J Nerv Ment Dis. 2004;192(4):260–268.
- , , , et al. Relationship between left ventricular dysfunction and depression following myocardial infarction: data from the MIND‐IT. Eur Heart J. 2005;26(24):2650–2656.
- , , , et al. Platelet/endothelial biomarkers in depressed patients treated with the selective serotonin reuptake inhibitor sertraline after acute coronary events: the Sertraline AntiDepressant Heart Attack Randomized Trial (SADHART) Platelet Substudy. Circulation. 2003;108(8):939–944.
- , , , , , . Psychological treatment of depression in inpatients: a systematic review and meta‐analysis. Clin Psychol Rev. 2011;31(3):353–360.
© 2014 Society of Hospital Medicine

Post‐Discharge Inpatients With Depressive Symptoms
Fully 19% of Medicare patients are readmitted to the hospital within 30 days of discharge.1 This represents a large amount of potentially avoidable morbidity and cost. Indeed, projects to improve the discharge process and post‐hospital care have shown that as much as one‐third of hospital utilization in the month after discharge can be avoided.2 Consequently, the rate of early, unplanned hospital utilization after discharge has emerged as an important indicator of hospital quality and the Centers for Medicare and Medicaid Services (CMS) has proposed a policy to decrease payments to hospitals with high rates of early unplanned hospital utilization. Thus, there is great interest in identifying modifiable risk factors for rehospitalization that could be used to refine intervention models and lead to improvements in quality of care, patient outcomes, and cost savings.
To date, known predictors of readmission include: lower socioeconomic status,3 history of prior hospitalization4 and advanced age,5 length of stay greater than 7 days,6 a high burden of comorbid illnesses (based on Charlson score),7 poor social support,8 and specific diagnoses (eg, congestive heart failure, chronic obstructive pulmonary disease [COPD] and myocardial infarction).5, 9, 10 In addition, unplanned readmissions and emergency department (ED) visits have been linked to polypharmacy and adverse drug events related to treatment with medications such as warfarin, digoxin and narcotics.11, 12 Another characteristic that has also been linked to readmission is depression;13 however5 reports supporting this association are from studies of elderly patients or with patients who have specific diagnoses (eg, congestive heart failure [CHF], COPD, myocardial infarction).1416
Depression is common, affecting 13% to 16% of people in the US, and is recognized as an important risk factor for poor outcomes among patients with various chronic illnesses.1719 The mechanisms by which depression can be linked to health outcomes and health service utilization have been studied in age‐specific or disease‐specific cohorts such as cardiac patients or frail elders and include both physiologic factors such as hypercoagulability and hyperinflammatory conditions, as well as behavioral factors such as poor self‐care behaviors and heightened sensitivity to somatic symptoms. How these mechanisms link depression to health outcomes and hospital utilization in a general medical population is not clearly understood. Kartha et al.13 reported findings indicating that depression is a risk factor for rehospitalization in general medical inpatients, but the study sample was relatively small and the study design methodology significantly limited its generalizability.12 It would be useful to provide supporting evidence showing depression as an important risk factor for readmission in the general medical in‐patient population using more rigorous study methods and a larger cohort.
We hypothesized that depressive symptoms would be an independent risk factor for early unplanned hospital utilization after discharge for all medical patients. Therefore, we conducted a secondary analysis of the Project RED clinical trial dataset to assess the association between a positive depression screen during inpatient hospitalization and the rate of subsequent hospital utilization.
Methods
Data from the Project RED clinical trial were reviewed for inclusion in a secondary analysis. Complete data were available for 738 of the 749 subjects recruited for Project RED.
Project RED Setting and Participants
Project RED was a two‐armed randomized controlled trial of English‐speaking adult patients, 18 years or older, admitted to the teaching service of Boston Medical Center, a large urban safety‐net hospital with an ethnically diverse patient population. A total of 749 subjects were enrolled and randomized between January 3, 2006 and October 18, 2007. Patients were required to have a telephone, be able to comprehend study details and the consent process in English, and have plans to be discharged to a US community. Patients were not enrolled if they were admitted from a skilled nursing facility or other hospital, transferred to a different hospital service prior to enrollment, admitted for a planned hospitalization, on hospital precautions, on suicide watch, deaf or blind. The Institutional Review Board of Boston University approved all study activities. A full description of the methods for the Project RED trial has been described previously.2
Outcome Variable
The primary endpoint was rate of hospital utilization within 30 days of discharge from the index admission, defined as the total number of ED visits and readmissions per subject within 30 days of the index discharge. Hospital utilization rates within 60 and 90 days of the index hospitalization discharge were also analyzed as secondary outcomes. Any ED visit in which a subject was subsequently admitted to the hospital was only counted as a readmission. Outcome data were collected by reviewing the hospital's electronic medical records (EMRs) and by contacting subjects by telephone 30 days after discharge. Dates of hospital utilization occurring at Boston Medical Center were obtained from the EMR, while those at other hospitals were collected through subject report. Subjects who could not be reached within 60 days of discharge were assumed alive.
Primary Independent Variable
The primary independent variable of interest was depressive symptoms defined as a positive score for minor or major depression on the nine‐item Patient Health Questionnaire (PHQ‐9) depression screening tool.20 A dichotomized variable was created using a standardized scoring system to determine the screening cut‐off for major or minor depressive symptoms.19
Statistical Analysis
Demographic and other characteristics of the subjects were compared by depression status (Table 1). Potential confounders were identified a priori from the available literature on factors associated with rehospitalization. These included age, gender, marital status, health literacy score (rapid estimate of health literacy in adult medicine tool [REALM]),21 Charlson score,22 insurance type, employment status, income level, homelessness status within past three months, hospital utilization within the 6 months prior to the index hospitalization, educational attainment, length of hospital stay and Project RED study group assignment. Bivariate analyses were conducted to determine which covariates were significant confounders of the relationship between depression and hospital utilization within 30 days of discharge. Chi‐square tests were used for categorical variables and t‐tests for continuous variables.
| Characteristic | Depression Screen* | ||
|---|---|---|---|
| Negative (n = 500) | Positive (n = 238) | P Value | |
| |||
| Race, No. (%) | |||
| White | 140 (30) | 66 (30) | |
| Black | 268 (58) | 117 (54) | |
| Hispanic | 47 (10) | 29 (13) | 0.760 |
| Insurance, No. (%) | |||
| Private | 95 (19) | 22 (9) | |
| Medicare | 69 (14) | 30 (13) | |
| Medicaid | 214 (43) | 143 (61) | |
| Free care | 118 (24) | 40 (17) | <0.001 |
| Education, No. (%) | |||
| <8th grade | 33 (7) | 21 (9) | |
| Some high school | 82 (17) | 52 (22) | |
| High school grad | 192 (38) | 90 (38) | |
| Some college | 126 (25) | 51 (22) | |
| College grad | 67 (13) | 22 (9) | 0.135 |
| Health Literacy | |||
| Grade 3 and below | 64 (13) | 44 (19) | |
| Grade 46 | 54 (11) | 22 (10) | |
| Grade 78 | 156 (32) | 73 (32) | |
| Grade 9 and above | 213 (44) | 89 (39) | 0.170 |
| Income, $, No. (%) | |||
| No income | 61 (12) | 37 (16) | |
| <10K | 77 (15) | 61 (26) | |
| 1020K | 96 (19) | 35 (15) | |
| 2050K | 97 (19) | 34 (14) | |
| 50100K | 35 (8) | 7 (2) | |
| No answer | 132 (27) | 64 (27) | 0.002 |
| Employment status, No. (%) | |||
| Full time | 142 (28) | 34 (14) | |
| Part time | 57 (11) | 30 (13) | |
| Not Working | 297 (59) | 171 (72) | <0.001 |
| Age, mean (SD), years | 49.9 (16.0) | 49.6 (13.3) | 0.802 |
| Gender: No. (%) Female | 239 (48) | 133 (56) | 0.040 |
| Have PCP, No. (%) Yes | 399 (80) | 197 (83) | 0.340 |
| Marital status,∥ No. (%) unmarried | 365 (73) | 201 (85) | <0.001 |
| Charlson score, mean (SD) | 1.058 (1.6) | 1.56 (2.39) | 0.001 |
| RED study group,# No. (%) | |||
| Intervention | 243 (49) | 127 (53) | 0.22 |
| Length of stay, days, mean (SD) | 2.5 (2.8) | 3.1 (3.8) | 0.016 |
| Homeless in last 3 months, No. (%) | 45 (9) | 30 (13) | 0.130 |
| Frequent utilizer,** No. (%) | 159 (32) | 104 (44) | 0.002 |
Age, length of stay, and Charlson score were used as continuous variables. Gender, marital status, frequent prior utilization (01 vs. 2 or more), and homelessness were treated as dichotomous variables. Categorical variables were created for, educational attainment (less than eighth grade, some high school, high school graduate, some college, college graduate), insurance type (Medicare, Medicaid, private insurance or free care), income level (no income, less than $10,000 per year, $10,00020,000, $20,00050,000, $50,000100,000, no answer), level of health literacy (grade 3 and below, grade 46, grade 78, grade 9 or above) and employment status(working full‐time, working part‐time, not working, no answer).
The 30‐day hospital utilization rate reflects the number of hospital utilization events within 30 days of discharge per subject. The same method was used to calculate hospital utilization rates within 60 and 90 days of discharge respectively. The unadjusted incident rate ratio (IRR) was calculated as the ratio of the rate of hospital utilizations among patients with depressive symptoms versus patients without depressive symptoms. Data for hospital utilization at 30, 60, and 90 days are cumulative.
Poisson models were used to test for significant differences between the predicted and observed number of hospitalization events at 30 days. A backward stepwise regression was conducted to identify and control for relevant confounders and construct the final, best‐fit model for the association between depression and hospital reutilization. A statistical significance level of P = 0.10 was used for the stepwise regression. To evaluate potential interactions between depression and the Project RED intervention, interaction terms were included. Two‐sided significance tests were used. P values of less than 0.05 were considered to indicate statistical significance. All data were analyzed with S‐Plus 8.0 (Seattle, WA).
In addition, a Kaplan‐Meier hazard curve was generated for the first hospital utilization event, ED visit or readmission, for the 30‐day period following discharge and compared with a log‐rank test.
Results
A total of 28% of subjects were categorized as having a positive depression screen. More women (36%) had positive depression screens than men (28%). Among patients with a positive depression screen, 58% had a history of depression and 53% were currently taking medications at the time of enrollment, compared with 25% and 22% respectively for subjects with a negative depression screen. Table 1 presents the means or percentages for baseline characteristics by depression status in the analytic cohort. Subjects with Medicaid for insurance had a higher rate of depression (61%) than subjects with Medicare (13%), private insurance (9%), or those who qualified for the Free Care pool (17%) which is the Massachusetts state funding for healthcare to uninsured persons. Subjects who were unemployed, unmarried, or who reported earnings less than $10,000 per year were also more likely to screen positive for depression. In addition, depressed subjects had a higher severity of co‐morbid disease and longer length of stay for the index hospitalization. Patients categorized as frequent utilizers (2 or more prior admissions) for the 6 months prior to the index hospitalization were also more likely to be depressed. Of further note, is the relatively younger average age among both depressive patients (49.6 years) and non‐depressive patients (49.9) of these study subjects.
The unadjusted hospital utilization rate at 30, 60, and 90 days post‐discharge by depression status is shown in Table 2. At 30 days post‐discharge, those with depressive symptoms had a higher rate of hospital utilization than those without depressive symptoms (0.563 vs. 0.296). In other words, 56 utilization events occurred per 100 patients with depressive symptoms, compared with 30 utilization events per 100 patients without depressive symptoms. The unadjusted 30‐day post‐discharge hospital utilization rate among those with depressive symptoms was higher compared with those without symptoms (IRR, 1.90, 95% confidence interval [CI], 1.242.71). A similar trend was found among subjects at 60 and 90 days post‐discharge.
| Hospital Utilization | Depression Screen* | P Value | IRR (CI) | |
|---|---|---|---|---|
| Negative, n = 500 (68%) | Positive, n = 238 (32%) | |||
| ||||
| No. of hospital utilizations | 140 | 134 | 1.90 (1.51,2.40) | |
| 30‐day hospital utilization rate | 0.296 | 0.563 | <0.001 | |
| No. of hospital utilizations | 231 | 205 | 1.87 (1.55,2.26) | |
| 60‐day hospital utilization rate | 0.463 | 0.868 | <0.001 | |
| No. of hospital utilizations | 324 | 275 | 1.79 (1.53,2.10) | |
| 90‐day hospital utilization rate | 0.648 | 1.165 | <0.001 | |
Poisson regression analyses were conducted to control for potential confounding in the relationship between depressive symptoms and hospital utilization rate within 30 days after discharge (Table 3). After controlling for relevant confounders, including age, gender, employment status, frequent prior hospitalization status, marital status, Charlson score, Project RED study group assignment and the interaction variable for RED study group assignment and depression, the association between symptoms of depression, and hospital utilization rate remained significant (IRR, 1.73; 95% CI, 1.272.36).
| Characteristics | IRR | CI | P Value |
|---|---|---|---|
| |||
| Depression symptoms* | <0.001 | ||
| Positive | 1.73 | 1.272.36 | |
| Negative | REF | 1.0 | |
| Gender | <0.001 | ||
| Male | 1.87 | 1.472.40 | |
| Female | REF | 1.0 | |
| Marital status | 0.005 | ||
| Married | 0.625 | 0.440.89 | |
| Unmarried | 1.0 | REF | |
| Frequent utilizer | <0.001 | ||
| 2+ prior visits | 2.45 | 1.923.15 | |
| <2 prior visits | 1.0 | REF | |
| Study group | 0.054 | ||
| Intervention | 0.76 | 0.551.06 | |
| Control | 1.0 | REF | |
| Employment | |||
| Part time | 1.40 | 0.852.30 | 0.095 |
| Not working | 1.67 | 1.152.44 | 0.003 |
| Other | 0.52 | 0.073.85 | 0.262 |
| Full time | 1.0 | REF | |
| Charlson Score∥ | 0.98 | 0.921.04 | 0.250 |
| Group* depression | 0.84 | 0.521.36 | 0.236 |
| Age | 1.00 | 0.991.01 | 0.375 |
Figure 1 depicts the Kaplan‐Meier hazard curve generated for time to first hospital utilization, stratified by depression status. While 21% of participants without symptoms of depression had a hospital utilization within 30 days, fully 29% of participants with symptoms of depression had a hospital utilization within 30 days (P = 0.011).
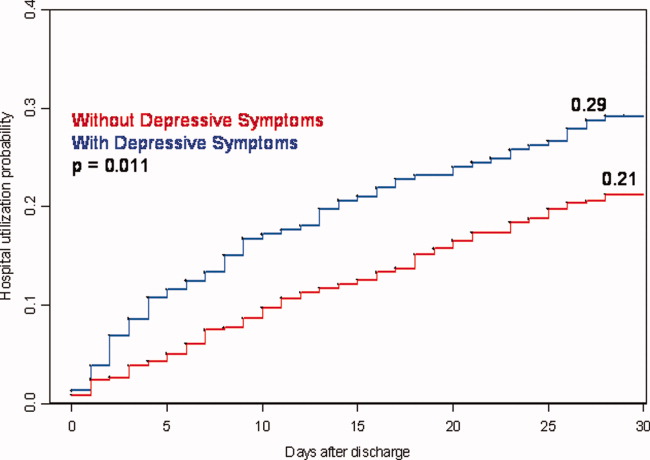
Discussion
Our study shows hospitalized patients who screen positive for depressive symptoms are significantly more likely to have a hospital visit (emergency room or rehospitalization) within 30 days of discharge than those who do not screen positive for depressive symptoms among medical patients admitted to an urban, academic, safety‐net hospital. These findings are consistent with, and extend, prior reports regarding depression and rehospitalization in specific populations (ie, geriatrics) and specific diagnoses (ie, cardiovascular disease [CVD] and COPD).1012 We observed a 73% higher incidence rate for hospital utilization within 30 days of discharge for those with symptoms of depression. This puts symptoms of depression on par with frequent prior rehospitalization, advanced age and low social support, as known risk factors for rehospitalization.4, 5, 23
Also of significance is the relatively young age of this study population (49.9 years non‐depressive patients and 49.6 years for depressive patients) compared with the study cohorts used for research in the majority of the existing literature. The chief reason for the young age of our cohort is that potential subjects were excluded if they came from a skilled nursing facility or other hospital. This may limit the generalizability of our findings; however, it seems likely that interventions relating to depression and transitions of care will need to be quite different for patients that reside in long‐term care facilities vs. patients that live in the community. For example, patients living in the community may have significant barriers to access post‐discharge services due to insurance status and are more likely to be sensitive to variations in social support.
Early rehospitalization is associated with significant morbidity, mortality, and expense. It is also a potential marker for poor quality of care.24 Concerns for patient safety, escalating healthcare costs, and possible change in hospital reimbursement mechanisms are fueling the search for modifiable risk factors associated with early rehospitalization. Our data provide evidence that symptoms of depression may be an important focus of attention. We do not know, however whether treating hospitalized patients who screen positive for depression will decrease early rehospitalization and emergency room utilization rates.
Various physiologic and behavioral mechanisms may link symptoms of depression to hospital utilization after discharge. For example, depressed patients with features of somatization may be more likely to experience worrisome physical symptoms after discharge and present prematurely for reevaluation. Patients who are sicker in some fashion not captured by our measured confounders may have symptoms of depression related to chronic, debilitating disease warranting early return to the hospital. Depression may also yield nonadherence to aspects of the discharge treatment plan leading to rehospitalization as a result of poor post‐discharge disease management. For example, research shows that patients with depression following coronary artery bypass surgery are less likely to adhere with cardiac rehabilitation programs.25 Likewise, depression among chronically ill patients such as diabetics, asthmatics, or human immunodeficiency virus (HIV)‐positive patients impairs medication adherence and self‐care behavior which may lead to disease relapse or recurrence.2628 One study examining depression effects on hypertensive medicine adherence in African Americans identified self‐efficacy as a mediating factor between depression and nonadherence.29 This implies that interventions such as self‐management education, a program through which chronically‐ill patients learn to better manage their illnesses through enhanced self‐confidence and problem‐solving strategies (including mood disorder challenges) may reduce early rehospitalization among depressed patients.30
There is also evidence that depression may have direct physiologic consequences. In patients with CVD, depression is associated with poor outcomes possibly related to decreased heart rate variability, hypercoagulability, high burdens of inflammatory markers, and severity of left ventricular dysfunction.3134 Similarly, depression among HIV/acquired immune deficiency syndrome (AIDS), diabetics and multiple sclerosis (MS) patients is linked to heightened levels of proinflammatory markers and less favorable outcomes that may signal a more severe form of the disease or an impaired response to treatment.3538 Indeed, MS investigators now hypothesize that the proinflammatory environment associated with the neurologic manifestations of MS are also causing depression symptoms among MS patients.34 This theory contrasts the common belief that depression in the chronically ill manifests independent of the chronic illness or in response to living with chronic disease.
A major strength of the current study is the large dataset and the broad range of covariates available for analyses. However, several limitations should be noted. First, data on hospital utilization outside Boston Medical Center were determined by patient self‐report and were not confirmed by document review. Second, we do not know the direction of the associations we report. If symptoms of depression are merely the consequence of having a higher disease burden, treatment of the underlying disease may be the most important response. While this is possible, our model does include several variables (eg, Charlson score and length of stay) that are likely to adjust for disease severity, pointing to the likelihood that symptoms of depression truly predict hospital utilization in a fashion that is independent of disease severity. Third, our results may not be generalizable to populations other than those served by urban safety‐net hospitals or other populations excluded from the Project RED trial (eg, non‐English speaking patients and patients from nursing homes). Finally, social factors such as substance use and social support system variables may residually confound the relationship between depression and hospital reutilization demonstrated in this study. While this dataset does not include a measure of social support other than marital status and housing status, data is available on substance use. Analyses conducted by our colleagues using Project RED data found that in this study population depression was significantly more prevalent among substance users (29% vs. 14%) compared with non‐users and that substance use is an independent risk factor for hospital reutilization (unpublished data).
Our findings linking depression to increased hospital utilization also warrant further consideration from healthcare policymakers. Central to the Obama Administration's February 2009 healthcare reform proposal is the pursuit of cost savings through reductions in unplanned hospital readmissions.39 Thus, identifying potentially modifiable risk factors for readmission, such as depression, is of great concern to healthcare providers and policymakers across the nation. If, through testing of interventions, depression proves to be a modifiable risk for readmission, policymakers, while negotiating healthcare reform measures, must provide for the services required to address this comorbidity at the time of discharge. For example, if a patient screens positive for depressive symptoms during a hospitalization for COPD exacerbation, will the proposed payment reforms allow for mental health services during the immediate post‐discharge period in order to reduce the likelihood of hospital readmission? Will those mental health services be readily available? Payment reforms that account for all necessary transitional care services will indeed help reduce readmission costs with less risk for untoward consequences.
In conclusion, our results indicate that a positive depression screen is a significant risk factor for early post‐discharge hospital utilization among hospitalized adults on a general medical service, even after controlling for relevant confounders. Screening for depression during acute hospitalizations may be an important step in identifying patients at increased risk for readmission. Future research should focus on further characterizing and stratifying populations at highest risk for depression. Efforts should also include developing and evaluating targeted interventions for patients with symptoms of depression among hospitalized patients as part of discharge planning. Timely depression therapy during the hospitalization or following hospital discharge might reduce costly readmissions and enhance patient safety.
- ,,.Rehospitalizations among patients in the Medicare fee‐for‐service program.N Engl J Med.2009;360(14):1457–1459.
- ,,, et al.The reengineered hospital discharge program to decrease rehospitalization.Ann Intern Med.2009;150(3):178–187.
- ,,.The impact of patient socioeconomic status and other social factors on readmission: a prospective study in four Massachusetts hospitals.Inquiry.1994;31(2):163–172.
- ,,,.Continuity of care and patient outcomes after hospital discharge.J Gen Intern Med.2004;19:624–631. [PMID: 15209600]
- ,,,,,.Factors associated with unplanned hospital readmission among patients 65 years of age and older in a Medicare managed care plan.Am J Med.1999;107(1):13–17.
- ,,, et al.Readmission after hospitalization for congestive heart failure among Medicare beneficiaries.Arch Intern Med.1997;157(1):99–104.
- ,,.Chronic comorbidity and outcomes of hospital care: length of stay, mortality and readmission at 30 and 365 days.J Clin Epidemiol.1999;52(3):171–179.
- ,,, et al.Social network as a predictor of hospital readmission and mortality among older patients with heart failure.J Card Fail.2006;12:621–627.
- ,,,,.Acute exacerbation of chronic obstructive pulmonary disease: influence of social factors in determining length of stay and readmission rates.Can Respir J.2008;15(7):361–364.
- ,,, et al.Time course of depression and outcome of myocardial infarction.Arch Intern Med.2006;166(18):2035–2043.
- ,,, et al.Medication use leading to emergency department visits for adverse drug events in older adults.Ann Intern Med.2007;147(11):755–765.
- ,,.A systematic literature review of factors affecting outcomes in older medical patients admitted to hospital.Age Ageing.2004;33(2):110–115.
- ,,, et al.Depression is a risk factor for rehospitalization in medical inpatients.Prim Care Companion J Clin Psychiatry.2007;9(4):256–262.
- ,,, et al.Risk factors for hospital readmission in patients with chronic obstructive pulmonary disease.Respiration.2006;73:311–317.
- ,,, et al.Depression and healthcare costs during the first year following myocardial infarction.J Psychosom Res.2000;48(4–5):471–478.
- ,,, et al.Relationship of depression to increased risk of mortality and rehospitalization.Arch Intern Med.2001;161(15):1849–1856.
- ,,, et al.Time course of depression and outcome of myocardial infarction.Arch Intern Med.2006;166:2035–2043.
- ,.Single item on positive affect is associated with 1‐year survival in consecutive medical inpatients.J Gen Hosp Psych.2009;31:8–13.
- ,,,.Epidemiology of major depressive disorder: results from the National Epidemiologic Survey on Alcoholism and Related Conditions.Arch Gen Psychiatry.2005;62(10):1097–106.
- ,,.The PHQ‐9: Validity of a brief depression severity measure.J Gen Intern Med.2001;16:606–613. [PMID:11556941]
- ,,, et al.Rapid estimate of adult literacy in medicine: a shortened screening instrument.Fam Med.1993;25:391–395. [PMID:8349060]
- ,,,.A new method of classifying prognostic comorbidity in longitudinal studies: development and validation.J Chronic Dis.1987;40:373–383. [PMID: 3558716]
- ,,, et al.Social network as a predictor of hospital readmission and mortality among older patients with heart failure.J Card Fail.2006;12(8):621–627.
- ,,,,.The association between the quality of inpatient care and early readmission: a meta‐analysis of the evidence.Med Care.1997;35(10):1044–1059.
- ,,, et al.Persistent depression affects adherence to secondary prevention behaviors after acute coronary syndromes.J Gen Intern Med.2006;21(11):1178–1183.
- ,,,,.Depression is an important contributor to low medication adherence in hemodialyzed patients and transplant recipients.Kidney Int.2009;75(11):1223–1229.
- ,,, et al.Symptoms of depression prospectively predict poorer self‐care in patients with Type 2 diabetes.Diabet Med.2008;25(9):1102–1107.
- ,,, et al.The effect of adherence on the association between depressive symptoms and mortality among HIV‐infected individuals first initiating HAART.AIDS.2007;21(9):1175–1183.
- ,,.Self‐efficacy mediates the relationship between depressive symptoms and medication adherence.Health Educ Behav.2009;36(1):127–137.
- ,,,.Patient self‐management of chronic disease in primary care.JAMA.2002;288(19):2469–2475.
- .Effects of sertraline on the recovery rate of cardiac autonomic function in depressed patients after acute myocardial infarction.Am Heart J.2001;142:617–623.
- ,,, et al.Relationship between left ventricular dysfunction and depression following myocardial infarction: data from the MIND‐IT.Eur Heart J.2005;26:2650–2656.
- ,,, et al.Platelet/endothelial biomarkers in depressed patients treated with the selective serotonin reuptake inhibitor sertraline after acugte coronary events: the Sertraline AntiDepressant Heart Attack Randomized Trial (SADHART) Platelet SubStudy.Circulation.2003;108:939–944.
- ,.Inflammation in acute coronary syndromes.Cleve Clin J Med.2002;69(Suppl2):SII130–SII142.
- ,.Depression and immunity: inflammation and depressive symptoms in multiple sclerosis.Neurol Clin.2006;24(3):507–519.
- ,,, et al.Synergistic effects of psychological and immune stressors on inflammatory cytokines and sickness responses in humans.Brain Behav Immun.2009;23(2):217–224.
- ,,,,,.Psychological distress, killer lymphocytes and disease severity in HIV/AIDS.Brain Behav Immun.2008;22(6):901–911.
- ,,,.Analysis of potential predictors of depression among coronary heart disease risk factors including heart rate variability, markers of inflammation, and endothelial function.Eur Heart J.2008;29(9):1110–1117.
- .Obama proposes $634 billion fund for health care.Washington Post. February 26,2009:A1.
Fully 19% of Medicare patients are readmitted to the hospital within 30 days of discharge.1 This represents a large amount of potentially avoidable morbidity and cost. Indeed, projects to improve the discharge process and post‐hospital care have shown that as much as one‐third of hospital utilization in the month after discharge can be avoided.2 Consequently, the rate of early, unplanned hospital utilization after discharge has emerged as an important indicator of hospital quality and the Centers for Medicare and Medicaid Services (CMS) has proposed a policy to decrease payments to hospitals with high rates of early unplanned hospital utilization. Thus, there is great interest in identifying modifiable risk factors for rehospitalization that could be used to refine intervention models and lead to improvements in quality of care, patient outcomes, and cost savings.
To date, known predictors of readmission include: lower socioeconomic status,3 history of prior hospitalization4 and advanced age,5 length of stay greater than 7 days,6 a high burden of comorbid illnesses (based on Charlson score),7 poor social support,8 and specific diagnoses (eg, congestive heart failure, chronic obstructive pulmonary disease [COPD] and myocardial infarction).5, 9, 10 In addition, unplanned readmissions and emergency department (ED) visits have been linked to polypharmacy and adverse drug events related to treatment with medications such as warfarin, digoxin and narcotics.11, 12 Another characteristic that has also been linked to readmission is depression;13 however5 reports supporting this association are from studies of elderly patients or with patients who have specific diagnoses (eg, congestive heart failure [CHF], COPD, myocardial infarction).1416
Depression is common, affecting 13% to 16% of people in the US, and is recognized as an important risk factor for poor outcomes among patients with various chronic illnesses.1719 The mechanisms by which depression can be linked to health outcomes and health service utilization have been studied in age‐specific or disease‐specific cohorts such as cardiac patients or frail elders and include both physiologic factors such as hypercoagulability and hyperinflammatory conditions, as well as behavioral factors such as poor self‐care behaviors and heightened sensitivity to somatic symptoms. How these mechanisms link depression to health outcomes and hospital utilization in a general medical population is not clearly understood. Kartha et al.13 reported findings indicating that depression is a risk factor for rehospitalization in general medical inpatients, but the study sample was relatively small and the study design methodology significantly limited its generalizability.12 It would be useful to provide supporting evidence showing depression as an important risk factor for readmission in the general medical in‐patient population using more rigorous study methods and a larger cohort.
We hypothesized that depressive symptoms would be an independent risk factor for early unplanned hospital utilization after discharge for all medical patients. Therefore, we conducted a secondary analysis of the Project RED clinical trial dataset to assess the association between a positive depression screen during inpatient hospitalization and the rate of subsequent hospital utilization.
Methods
Data from the Project RED clinical trial were reviewed for inclusion in a secondary analysis. Complete data were available for 738 of the 749 subjects recruited for Project RED.
Project RED Setting and Participants
Project RED was a two‐armed randomized controlled trial of English‐speaking adult patients, 18 years or older, admitted to the teaching service of Boston Medical Center, a large urban safety‐net hospital with an ethnically diverse patient population. A total of 749 subjects were enrolled and randomized between January 3, 2006 and October 18, 2007. Patients were required to have a telephone, be able to comprehend study details and the consent process in English, and have plans to be discharged to a US community. Patients were not enrolled if they were admitted from a skilled nursing facility or other hospital, transferred to a different hospital service prior to enrollment, admitted for a planned hospitalization, on hospital precautions, on suicide watch, deaf or blind. The Institutional Review Board of Boston University approved all study activities. A full description of the methods for the Project RED trial has been described previously.2
Outcome Variable
The primary endpoint was rate of hospital utilization within 30 days of discharge from the index admission, defined as the total number of ED visits and readmissions per subject within 30 days of the index discharge. Hospital utilization rates within 60 and 90 days of the index hospitalization discharge were also analyzed as secondary outcomes. Any ED visit in which a subject was subsequently admitted to the hospital was only counted as a readmission. Outcome data were collected by reviewing the hospital's electronic medical records (EMRs) and by contacting subjects by telephone 30 days after discharge. Dates of hospital utilization occurring at Boston Medical Center were obtained from the EMR, while those at other hospitals were collected through subject report. Subjects who could not be reached within 60 days of discharge were assumed alive.
Primary Independent Variable
The primary independent variable of interest was depressive symptoms defined as a positive score for minor or major depression on the nine‐item Patient Health Questionnaire (PHQ‐9) depression screening tool.20 A dichotomized variable was created using a standardized scoring system to determine the screening cut‐off for major or minor depressive symptoms.19
Statistical Analysis
Demographic and other characteristics of the subjects were compared by depression status (Table 1). Potential confounders were identified a priori from the available literature on factors associated with rehospitalization. These included age, gender, marital status, health literacy score (rapid estimate of health literacy in adult medicine tool [REALM]),21 Charlson score,22 insurance type, employment status, income level, homelessness status within past three months, hospital utilization within the 6 months prior to the index hospitalization, educational attainment, length of hospital stay and Project RED study group assignment. Bivariate analyses were conducted to determine which covariates were significant confounders of the relationship between depression and hospital utilization within 30 days of discharge. Chi‐square tests were used for categorical variables and t‐tests for continuous variables.
| Characteristic | Depression Screen* | ||
|---|---|---|---|
| Negative (n = 500) | Positive (n = 238) | P Value | |
| |||
| Race, No. (%) | |||
| White | 140 (30) | 66 (30) | |
| Black | 268 (58) | 117 (54) | |
| Hispanic | 47 (10) | 29 (13) | 0.760 |
| Insurance, No. (%) | |||
| Private | 95 (19) | 22 (9) | |
| Medicare | 69 (14) | 30 (13) | |
| Medicaid | 214 (43) | 143 (61) | |
| Free care | 118 (24) | 40 (17) | <0.001 |
| Education, No. (%) | |||
| <8th grade | 33 (7) | 21 (9) | |
| Some high school | 82 (17) | 52 (22) | |
| High school grad | 192 (38) | 90 (38) | |
| Some college | 126 (25) | 51 (22) | |
| College grad | 67 (13) | 22 (9) | 0.135 |
| Health Literacy | |||
| Grade 3 and below | 64 (13) | 44 (19) | |
| Grade 46 | 54 (11) | 22 (10) | |
| Grade 78 | 156 (32) | 73 (32) | |
| Grade 9 and above | 213 (44) | 89 (39) | 0.170 |
| Income, $, No. (%) | |||
| No income | 61 (12) | 37 (16) | |
| <10K | 77 (15) | 61 (26) | |
| 1020K | 96 (19) | 35 (15) | |
| 2050K | 97 (19) | 34 (14) | |
| 50100K | 35 (8) | 7 (2) | |
| No answer | 132 (27) | 64 (27) | 0.002 |
| Employment status, No. (%) | |||
| Full time | 142 (28) | 34 (14) | |
| Part time | 57 (11) | 30 (13) | |
| Not Working | 297 (59) | 171 (72) | <0.001 |
| Age, mean (SD), years | 49.9 (16.0) | 49.6 (13.3) | 0.802 |
| Gender: No. (%) Female | 239 (48) | 133 (56) | 0.040 |
| Have PCP, No. (%) Yes | 399 (80) | 197 (83) | 0.340 |
| Marital status,∥ No. (%) unmarried | 365 (73) | 201 (85) | <0.001 |
| Charlson score, mean (SD) | 1.058 (1.6) | 1.56 (2.39) | 0.001 |
| RED study group,# No. (%) | |||
| Intervention | 243 (49) | 127 (53) | 0.22 |
| Length of stay, days, mean (SD) | 2.5 (2.8) | 3.1 (3.8) | 0.016 |
| Homeless in last 3 months, No. (%) | 45 (9) | 30 (13) | 0.130 |
| Frequent utilizer,** No. (%) | 159 (32) | 104 (44) | 0.002 |
Age, length of stay, and Charlson score were used as continuous variables. Gender, marital status, frequent prior utilization (01 vs. 2 or more), and homelessness were treated as dichotomous variables. Categorical variables were created for, educational attainment (less than eighth grade, some high school, high school graduate, some college, college graduate), insurance type (Medicare, Medicaid, private insurance or free care), income level (no income, less than $10,000 per year, $10,00020,000, $20,00050,000, $50,000100,000, no answer), level of health literacy (grade 3 and below, grade 46, grade 78, grade 9 or above) and employment status(working full‐time, working part‐time, not working, no answer).
The 30‐day hospital utilization rate reflects the number of hospital utilization events within 30 days of discharge per subject. The same method was used to calculate hospital utilization rates within 60 and 90 days of discharge respectively. The unadjusted incident rate ratio (IRR) was calculated as the ratio of the rate of hospital utilizations among patients with depressive symptoms versus patients without depressive symptoms. Data for hospital utilization at 30, 60, and 90 days are cumulative.
Poisson models were used to test for significant differences between the predicted and observed number of hospitalization events at 30 days. A backward stepwise regression was conducted to identify and control for relevant confounders and construct the final, best‐fit model for the association between depression and hospital reutilization. A statistical significance level of P = 0.10 was used for the stepwise regression. To evaluate potential interactions between depression and the Project RED intervention, interaction terms were included. Two‐sided significance tests were used. P values of less than 0.05 were considered to indicate statistical significance. All data were analyzed with S‐Plus 8.0 (Seattle, WA).
In addition, a Kaplan‐Meier hazard curve was generated for the first hospital utilization event, ED visit or readmission, for the 30‐day period following discharge and compared with a log‐rank test.
Results
A total of 28% of subjects were categorized as having a positive depression screen. More women (36%) had positive depression screens than men (28%). Among patients with a positive depression screen, 58% had a history of depression and 53% were currently taking medications at the time of enrollment, compared with 25% and 22% respectively for subjects with a negative depression screen. Table 1 presents the means or percentages for baseline characteristics by depression status in the analytic cohort. Subjects with Medicaid for insurance had a higher rate of depression (61%) than subjects with Medicare (13%), private insurance (9%), or those who qualified for the Free Care pool (17%) which is the Massachusetts state funding for healthcare to uninsured persons. Subjects who were unemployed, unmarried, or who reported earnings less than $10,000 per year were also more likely to screen positive for depression. In addition, depressed subjects had a higher severity of co‐morbid disease and longer length of stay for the index hospitalization. Patients categorized as frequent utilizers (2 or more prior admissions) for the 6 months prior to the index hospitalization were also more likely to be depressed. Of further note, is the relatively younger average age among both depressive patients (49.6 years) and non‐depressive patients (49.9) of these study subjects.
The unadjusted hospital utilization rate at 30, 60, and 90 days post‐discharge by depression status is shown in Table 2. At 30 days post‐discharge, those with depressive symptoms had a higher rate of hospital utilization than those without depressive symptoms (0.563 vs. 0.296). In other words, 56 utilization events occurred per 100 patients with depressive symptoms, compared with 30 utilization events per 100 patients without depressive symptoms. The unadjusted 30‐day post‐discharge hospital utilization rate among those with depressive symptoms was higher compared with those without symptoms (IRR, 1.90, 95% confidence interval [CI], 1.242.71). A similar trend was found among subjects at 60 and 90 days post‐discharge.
| Hospital Utilization | Depression Screen* | P Value | IRR (CI) | |
|---|---|---|---|---|
| Negative, n = 500 (68%) | Positive, n = 238 (32%) | |||
| ||||
| No. of hospital utilizations | 140 | 134 | 1.90 (1.51,2.40) | |
| 30‐day hospital utilization rate | 0.296 | 0.563 | <0.001 | |
| No. of hospital utilizations | 231 | 205 | 1.87 (1.55,2.26) | |
| 60‐day hospital utilization rate | 0.463 | 0.868 | <0.001 | |
| No. of hospital utilizations | 324 | 275 | 1.79 (1.53,2.10) | |
| 90‐day hospital utilization rate | 0.648 | 1.165 | <0.001 | |
Poisson regression analyses were conducted to control for potential confounding in the relationship between depressive symptoms and hospital utilization rate within 30 days after discharge (Table 3). After controlling for relevant confounders, including age, gender, employment status, frequent prior hospitalization status, marital status, Charlson score, Project RED study group assignment and the interaction variable for RED study group assignment and depression, the association between symptoms of depression, and hospital utilization rate remained significant (IRR, 1.73; 95% CI, 1.272.36).
| Characteristics | IRR | CI | P Value |
|---|---|---|---|
| |||
| Depression symptoms* | <0.001 | ||
| Positive | 1.73 | 1.272.36 | |
| Negative | REF | 1.0 | |
| Gender | <0.001 | ||
| Male | 1.87 | 1.472.40 | |
| Female | REF | 1.0 | |
| Marital status | 0.005 | ||
| Married | 0.625 | 0.440.89 | |
| Unmarried | 1.0 | REF | |
| Frequent utilizer | <0.001 | ||
| 2+ prior visits | 2.45 | 1.923.15 | |
| <2 prior visits | 1.0 | REF | |
| Study group | 0.054 | ||
| Intervention | 0.76 | 0.551.06 | |
| Control | 1.0 | REF | |
| Employment | |||
| Part time | 1.40 | 0.852.30 | 0.095 |
| Not working | 1.67 | 1.152.44 | 0.003 |
| Other | 0.52 | 0.073.85 | 0.262 |
| Full time | 1.0 | REF | |
| Charlson Score∥ | 0.98 | 0.921.04 | 0.250 |
| Group* depression | 0.84 | 0.521.36 | 0.236 |
| Age | 1.00 | 0.991.01 | 0.375 |
Figure 1 depicts the Kaplan‐Meier hazard curve generated for time to first hospital utilization, stratified by depression status. While 21% of participants without symptoms of depression had a hospital utilization within 30 days, fully 29% of participants with symptoms of depression had a hospital utilization within 30 days (P = 0.011).
Discussion
Our study shows hospitalized patients who screen positive for depressive symptoms are significantly more likely to have a hospital visit (emergency room or rehospitalization) within 30 days of discharge than those who do not screen positive for depressive symptoms among medical patients admitted to an urban, academic, safety‐net hospital. These findings are consistent with, and extend, prior reports regarding depression and rehospitalization in specific populations (ie, geriatrics) and specific diagnoses (ie, cardiovascular disease [CVD] and COPD).1012 We observed a 73% higher incidence rate for hospital utilization within 30 days of discharge for those with symptoms of depression. This puts symptoms of depression on par with frequent prior rehospitalization, advanced age and low social support, as known risk factors for rehospitalization.4, 5, 23
Also of significance is the relatively young age of this study population (49.9 years non‐depressive patients and 49.6 years for depressive patients) compared with the study cohorts used for research in the majority of the existing literature. The chief reason for the young age of our cohort is that potential subjects were excluded if they came from a skilled nursing facility or other hospital. This may limit the generalizability of our findings; however, it seems likely that interventions relating to depression and transitions of care will need to be quite different for patients that reside in long‐term care facilities vs. patients that live in the community. For example, patients living in the community may have significant barriers to access post‐discharge services due to insurance status and are more likely to be sensitive to variations in social support.
Early rehospitalization is associated with significant morbidity, mortality, and expense. It is also a potential marker for poor quality of care.24 Concerns for patient safety, escalating healthcare costs, and possible change in hospital reimbursement mechanisms are fueling the search for modifiable risk factors associated with early rehospitalization. Our data provide evidence that symptoms of depression may be an important focus of attention. We do not know, however whether treating hospitalized patients who screen positive for depression will decrease early rehospitalization and emergency room utilization rates.
Various physiologic and behavioral mechanisms may link symptoms of depression to hospital utilization after discharge. For example, depressed patients with features of somatization may be more likely to experience worrisome physical symptoms after discharge and present prematurely for reevaluation. Patients who are sicker in some fashion not captured by our measured confounders may have symptoms of depression related to chronic, debilitating disease warranting early return to the hospital. Depression may also yield nonadherence to aspects of the discharge treatment plan leading to rehospitalization as a result of poor post‐discharge disease management. For example, research shows that patients with depression following coronary artery bypass surgery are less likely to adhere with cardiac rehabilitation programs.25 Likewise, depression among chronically ill patients such as diabetics, asthmatics, or human immunodeficiency virus (HIV)‐positive patients impairs medication adherence and self‐care behavior which may lead to disease relapse or recurrence.2628 One study examining depression effects on hypertensive medicine adherence in African Americans identified self‐efficacy as a mediating factor between depression and nonadherence.29 This implies that interventions such as self‐management education, a program through which chronically‐ill patients learn to better manage their illnesses through enhanced self‐confidence and problem‐solving strategies (including mood disorder challenges) may reduce early rehospitalization among depressed patients.30
There is also evidence that depression may have direct physiologic consequences. In patients with CVD, depression is associated with poor outcomes possibly related to decreased heart rate variability, hypercoagulability, high burdens of inflammatory markers, and severity of left ventricular dysfunction.3134 Similarly, depression among HIV/acquired immune deficiency syndrome (AIDS), diabetics and multiple sclerosis (MS) patients is linked to heightened levels of proinflammatory markers and less favorable outcomes that may signal a more severe form of the disease or an impaired response to treatment.3538 Indeed, MS investigators now hypothesize that the proinflammatory environment associated with the neurologic manifestations of MS are also causing depression symptoms among MS patients.34 This theory contrasts the common belief that depression in the chronically ill manifests independent of the chronic illness or in response to living with chronic disease.
A major strength of the current study is the large dataset and the broad range of covariates available for analyses. However, several limitations should be noted. First, data on hospital utilization outside Boston Medical Center were determined by patient self‐report and were not confirmed by document review. Second, we do not know the direction of the associations we report. If symptoms of depression are merely the consequence of having a higher disease burden, treatment of the underlying disease may be the most important response. While this is possible, our model does include several variables (eg, Charlson score and length of stay) that are likely to adjust for disease severity, pointing to the likelihood that symptoms of depression truly predict hospital utilization in a fashion that is independent of disease severity. Third, our results may not be generalizable to populations other than those served by urban safety‐net hospitals or other populations excluded from the Project RED trial (eg, non‐English speaking patients and patients from nursing homes). Finally, social factors such as substance use and social support system variables may residually confound the relationship between depression and hospital reutilization demonstrated in this study. While this dataset does not include a measure of social support other than marital status and housing status, data is available on substance use. Analyses conducted by our colleagues using Project RED data found that in this study population depression was significantly more prevalent among substance users (29% vs. 14%) compared with non‐users and that substance use is an independent risk factor for hospital reutilization (unpublished data).
Our findings linking depression to increased hospital utilization also warrant further consideration from healthcare policymakers. Central to the Obama Administration's February 2009 healthcare reform proposal is the pursuit of cost savings through reductions in unplanned hospital readmissions.39 Thus, identifying potentially modifiable risk factors for readmission, such as depression, is of great concern to healthcare providers and policymakers across the nation. If, through testing of interventions, depression proves to be a modifiable risk for readmission, policymakers, while negotiating healthcare reform measures, must provide for the services required to address this comorbidity at the time of discharge. For example, if a patient screens positive for depressive symptoms during a hospitalization for COPD exacerbation, will the proposed payment reforms allow for mental health services during the immediate post‐discharge period in order to reduce the likelihood of hospital readmission? Will those mental health services be readily available? Payment reforms that account for all necessary transitional care services will indeed help reduce readmission costs with less risk for untoward consequences.
In conclusion, our results indicate that a positive depression screen is a significant risk factor for early post‐discharge hospital utilization among hospitalized adults on a general medical service, even after controlling for relevant confounders. Screening for depression during acute hospitalizations may be an important step in identifying patients at increased risk for readmission. Future research should focus on further characterizing and stratifying populations at highest risk for depression. Efforts should also include developing and evaluating targeted interventions for patients with symptoms of depression among hospitalized patients as part of discharge planning. Timely depression therapy during the hospitalization or following hospital discharge might reduce costly readmissions and enhance patient safety.
- ,,.Rehospitalizations among patients in the Medicare fee‐for‐service program.N Engl J Med.2009;360(14):1457–1459.
- ,,, et al.The reengineered hospital discharge program to decrease rehospitalization.Ann Intern Med.2009;150(3):178–187.
- ,,.The impact of patient socioeconomic status and other social factors on readmission: a prospective study in four Massachusetts hospitals.Inquiry.1994;31(2):163–172.
- ,,,.Continuity of care and patient outcomes after hospital discharge.J Gen Intern Med.2004;19:624–631. [PMID: 15209600]
- ,,,,,.Factors associated with unplanned hospital readmission among patients 65 years of age and older in a Medicare managed care plan.Am J Med.1999;107(1):13–17.
- ,,, et al.Readmission after hospitalization for congestive heart failure among Medicare beneficiaries.Arch Intern Med.1997;157(1):99–104.
- ,,.Chronic comorbidity and outcomes of hospital care: length of stay, mortality and readmission at 30 and 365 days.J Clin Epidemiol.1999;52(3):171–179.
- ,,, et al.Social network as a predictor of hospital readmission and mortality among older patients with heart failure.J Card Fail.2006;12:621–627.
- ,,,,.Acute exacerbation of chronic obstructive pulmonary disease: influence of social factors in determining length of stay and readmission rates.Can Respir J.2008;15(7):361–364.
- ,,, et al.Time course of depression and outcome of myocardial infarction.Arch Intern Med.2006;166(18):2035–2043.
- ,,, et al.Medication use leading to emergency department visits for adverse drug events in older adults.Ann Intern Med.2007;147(11):755–765.
- ,,.A systematic literature review of factors affecting outcomes in older medical patients admitted to hospital.Age Ageing.2004;33(2):110–115.
- ,,, et al.Depression is a risk factor for rehospitalization in medical inpatients.Prim Care Companion J Clin Psychiatry.2007;9(4):256–262.
- ,,, et al.Risk factors for hospital readmission in patients with chronic obstructive pulmonary disease.Respiration.2006;73:311–317.
- ,,, et al.Depression and healthcare costs during the first year following myocardial infarction.J Psychosom Res.2000;48(4–5):471–478.
- ,,, et al.Relationship of depression to increased risk of mortality and rehospitalization.Arch Intern Med.2001;161(15):1849–1856.
- ,,, et al.Time course of depression and outcome of myocardial infarction.Arch Intern Med.2006;166:2035–2043.
- ,.Single item on positive affect is associated with 1‐year survival in consecutive medical inpatients.J Gen Hosp Psych.2009;31:8–13.
- ,,,.Epidemiology of major depressive disorder: results from the National Epidemiologic Survey on Alcoholism and Related Conditions.Arch Gen Psychiatry.2005;62(10):1097–106.
- ,,.The PHQ‐9: Validity of a brief depression severity measure.J Gen Intern Med.2001;16:606–613. [PMID:11556941]
- ,,, et al.Rapid estimate of adult literacy in medicine: a shortened screening instrument.Fam Med.1993;25:391–395. [PMID:8349060]
- ,,,.A new method of classifying prognostic comorbidity in longitudinal studies: development and validation.J Chronic Dis.1987;40:373–383. [PMID: 3558716]
- ,,, et al.Social network as a predictor of hospital readmission and mortality among older patients with heart failure.J Card Fail.2006;12(8):621–627.
- ,,,,.The association between the quality of inpatient care and early readmission: a meta‐analysis of the evidence.Med Care.1997;35(10):1044–1059.
- ,,, et al.Persistent depression affects adherence to secondary prevention behaviors after acute coronary syndromes.J Gen Intern Med.2006;21(11):1178–1183.
- ,,,,.Depression is an important contributor to low medication adherence in hemodialyzed patients and transplant recipients.Kidney Int.2009;75(11):1223–1229.
- ,,, et al.Symptoms of depression prospectively predict poorer self‐care in patients with Type 2 diabetes.Diabet Med.2008;25(9):1102–1107.
- ,,, et al.The effect of adherence on the association between depressive symptoms and mortality among HIV‐infected individuals first initiating HAART.AIDS.2007;21(9):1175–1183.
- ,,.Self‐efficacy mediates the relationship between depressive symptoms and medication adherence.Health Educ Behav.2009;36(1):127–137.
- ,,,.Patient self‐management of chronic disease in primary care.JAMA.2002;288(19):2469–2475.
- .Effects of sertraline on the recovery rate of cardiac autonomic function in depressed patients after acute myocardial infarction.Am Heart J.2001;142:617–623.
- ,,, et al.Relationship between left ventricular dysfunction and depression following myocardial infarction: data from the MIND‐IT.Eur Heart J.2005;26:2650–2656.
- ,,, et al.Platelet/endothelial biomarkers in depressed patients treated with the selective serotonin reuptake inhibitor sertraline after acugte coronary events: the Sertraline AntiDepressant Heart Attack Randomized Trial (SADHART) Platelet SubStudy.Circulation.2003;108:939–944.
- ,.Inflammation in acute coronary syndromes.Cleve Clin J Med.2002;69(Suppl2):SII130–SII142.
- ,.Depression and immunity: inflammation and depressive symptoms in multiple sclerosis.Neurol Clin.2006;24(3):507–519.
- ,,, et al.Synergistic effects of psychological and immune stressors on inflammatory cytokines and sickness responses in humans.Brain Behav Immun.2009;23(2):217–224.
- ,,,,,.Psychological distress, killer lymphocytes and disease severity in HIV/AIDS.Brain Behav Immun.2008;22(6):901–911.
- ,,,.Analysis of potential predictors of depression among coronary heart disease risk factors including heart rate variability, markers of inflammation, and endothelial function.Eur Heart J.2008;29(9):1110–1117.
- .Obama proposes $634 billion fund for health care.Washington Post. February 26,2009:A1.
Copyright © 2010 Society of Hospital Medicine

The Active Management of Depression
While family physicians play a leading role in caring for patients with major depression, the quality of that care that could be greatly improved. A 1997 to 1998 survey of a national sample of adults with depressive or anxiety disorders revealed that 83% of these patients visited a health care provider.1 Of this total, 84% were treated by primary care clinicians, compared with 16% who were treated by mental health professionals. However, about 90% of those cared for by mental health professionals received treatment that met criteria for adequacy outlined in treatment guidelines, compared with 19% of those cared for by primary care professionals.
A critical role for family physicians is to integrate treatment of depression with that of other conditions, especially in light of the association of depression with a variety of chronic diseases. The Institute of Medicine has concluded that depression is strongly associated with the occurrence of, and death following, myocardial infarctions.2 In diabetes, depression is associated with a 2% increase in glycosylated hemoglobin levels3 and can predict occurrence of diabetic complications. Additionally, chronic illnesses may, in themselves, exacerbate depression several fold.
Primary care clinicians are ideally positioned to serve as the central health care providers for patients with major depression. These physicians have many attributes that support this role, including their longitudinal relationship with patients, response to undifferentiated problems, frequent use of the biopsychosocial model, and ability to integrate care of mental and medical conditions. However, challenges in fulfilling this role also exist, including difficulties in recognizing patients with major depression, developing an adequate diagnostic initial assessment, implementing effective short- and long-term treatment and management strategies, and integrating care of depression with that of other conditions affecting patients.4 This article will review each of these challenges.
Recognition of major depression
DeGruy has eloquently described the barriers to recognition and management of mental disorders in primary care, including infrequent use of diagnostic criteria, concern regarding treatment effectiveness, availability of time and resources, the presence of other pressing clinical problems, and issues of third-party reimbursement and other organizational concerns.4
Family physicians and their patients often do not recognize somatic symptoms as originating from depression. In one study, primary care physicians correctly identified 94% of depressed patients presenting with psychological complaints, but they failed to recognize the psychiatric nature of somatic complaints in about half of the patients. This finding is of concern because 83% of depressed patients presented with somatic complaints.5
The attribution patients assign to their problems can also contribute to lack of recognition. In one general practice study, patients’ attributions were classified as somatizing (5%), psychologizing (23%), normalizing (48%), or no predominate attribution (24%).6 For example, patients in this study might attribute fatigue to anemia (somatizing), emotional exhaustion (psychologizing), or being over-extended (normalizing). The likelihood of a missed diagnosis in patients who met criteria for depression or anxiety was strongly associated with attribution: Physicians diagnosed 72% of psychologizing patients accurately, but they reported a correct diagnosis in only 17% of somatizing patients, 15% of normalizing patients, and 31% of patients with no predominate attribution.
Initial diagnostic assessment
The United States Preventive Services Task Force suggests that primary care physicians screen for major depression. The Task Force recommends using 2 simple questions about mood and anhedonia (Table 1) that are generally as effective as longer instruments.7 The Patient Health Questionnaire-9 (PHQ-9) or the longer Prime-MD can be used for further evaluation of patients who respond positively to either question, thus helping to both confirm the diagnosis of depression and measure severity.8,9 Other instruments include the Beck Depression Inventory,10 the Zung scale,11 and the General Health Questionnaire.12 These tools take longer to administer, are not specific in measuring the criteria for major depression, and do not measure severity well.
In family practices, pregnant and postpartum women represent a special population at increased risk for depression.13 About 5% of middle class women and up to one quarter of low income women experience postpartum depression.14 In about half, onset of the depressive disorder occurs before delivery.15 Women who have previously suffered postpartum depression are at high risk, as are those with histories of depression or premenstrual dysphoric disorder. The Edinburgh Postnatal Depression Scale is a useful 10-item self-report instrument available in Spanish and English (Table 1).16,17 Similar instruments have not been developed for pregnant women.
A patient who responds positively to the 2 screening questions in Table 1 or to another screening approach should be further evaluated to confirm the diagnosis of major depression. Many primary care clinicians do this through unstructured history taking. Others use an instrument such as the previously discussed PHQ-9. This tool offers an advantage because it provides a reliable symptom assessment, measures severity, and can be repeated over time to evaluate therapeutic response.8
The physician should consider bereavement and substance abuse as possible causes of depression; bereaved patients who continue to meet criteria for major depression at 2 months often benefit from treatment. By that time, the sadness, poor concentration, and other symptoms associated with normal grief are no longer constant and occur in waves brought on by memories. Conversely, persons also suffering from depression report these symptoms as enduring and autonomous.18
The primary care physician also should inquire about agitation and symptoms of anxiety disorders. These are experienced by 85% of depressed patients; 50% have comorbid anxiety disorders.19-21 Identification of such comorbidity is helpful in determining treatment, evaluating response, and managing patients over the long term. The Prime-MD, available in multiple languages, is also useful for screening for both anxiety and substance abuse, which can complicate both the recognition and treatment of comorbid depression.9
Sexual function is often affected by depression. The physician should inquire about sexual arousal, erection or lubrication, and orgasm during the initial assessment.22 Approximately 50% of women and 40% of men with major depression report sexual-arousal problems, and 15% to 20% report orgasm problems during the month prior to diagnosis.23 Further questioning can assess whether this dysfunction is caused by another disorder (eg, diabetes) or whether it is part of the depressive syndrome. This provides a baseline for later assessment of side effects and treatment effectiveness, and it communicates to the patient that the physician will be attentive to this area. In discussing sexual function with depressed patients, it may be helpful to tell patients that a study of the effectiveness of treatment of depression with selective serotonin reuptake inhibitors (SSRIs) found that patients reported modestly improved sexual function with treatment.24
TABLE 1
Screening for depression
| Outpatient adults | |
| |
| Postpartum women (Edinburgh Postnatal Depression Scale) | |
1. I have been able to laugh and see the funny side of things
| 6. Things have been getting on top of me
|
2. I have looked forward with enjoyment to things
| 7. I have been so unhappy that I have had difficulty sleeping
|
3. I have blamed myself unnecessarily when things went wrong
| 8. I have felt sad or miserable
|
4. I have been anxious or worried for no good reason
| 9. I have been so unhappy that I have been crying
|
5. I have felt scared or panicky for no very good reason
| 10. The thought of harming myself has occurred to me
|
| Reprinted with permission, from Cox JL et al. British Journal of Psychiatry. 1987; 150:782-786. | |
Management of major depression
The acute management of the patient with major depression includes patient education, shared decision-making regarding a treatment modality, supportive counseling, and treatment-specific counseling.25 Education and counseling should extend over the initial weeks of treatment and be combined with monitoring response, identifying and managing any treatment-emergent side effects, and adjusting medications. Long-term management goals include attaining full remission of symptoms, assisting the patient to return to full functional status, integrating depression care with the treatment of other chronic illnesses, maintaining or tapering pharmacologic treatment, and monitoring for and preventing relapse or recurrence.
Education
Education should help patients understand and accept the diagnosis, reduce any stigma they or their families might attach to major depression, and build increased adherence to subsequent treatment.26 It might be helpful to provide a brief explanation of the biologic basis of depression (including biochemical changes in brain function and “chemical imbalances” of serotonin and other neurotransmitters). Explaining pharmacotherapeutic effects (if medication is desired) as mechanisms to help rebalance brain chemistry further emphasizes the biologic basis of depression and decreases any perceptions that depression is a result of moral or character weakness. This educational message should also stress that antidepressants are not habit-forming or addictive, are not “uppers” or “downers,” and are not tranquilizers. The physician also should convey a positive prognosis but note that several weeks and, possibly, adjustments in treatments, may be required. For patients choosing antidepressants, the McArthur Foundation Initiative has identified 7 key educational messages (Table 2).27
TABLE 2
Key messages for patient education about depression
|
Counseling
Patients often benefit from counseling regarding sleep, exercise, and substance use. Many patients with depression experience early morning awakening. Those with agitated depression also often experience delayed sleep onset associated with worry. Providing the patient with information on basic sleep hygiene, exercise, and encouraging abstinence from or moderation in consumption of alcohol might all help.28-30 Additionally, sleep disturbances can indicate the possibility of comorbid disorders. A report that a patient fears going to sleep because of nightmares suggests posttraumatic stress disorder.
For some patients, counseling by the family physician or through referral may be a helpful treatment adjunct. Often depressed patients have deficient coping mechanisms and need assistance in developing strategies to resolve issues in their life. Principles used in cognitive behavioral therapy might be helpful in patient education and counseling.31 These include problem-solving strategies to resolve stressful concerns and cognitive techniques to identify and correct distorted or maladaptive thought patterns.29
As patients respond to depression treatment, an additional component of primary-care-based counseling should target reinvolvement with pleasurable social and physical activities. This may simply involve identifying activities the patient enjoyed prior to the onset of depression but has since stopped, and focusing on the steps required to reactivate these interests.
Shared decision-making with regard to treatment will improve subsequent patient adherence.27 Treatment options include psychotherapy, particularly cognitive behavioral therapy, pharmacotherapy, and electroconvulsive therapy. The latter should be considered for severely depressed patients, particularly persons with few social supports who are at significant risk of suicide.25
Cognitive behavioral therapy and other psychotherapies can show effectiveness equal to that of pharmacotherapy, although response usually lags by a month to 6 weeks compared with that attained by pharmacotherapy.32 For moderately to severely depressed patients, pharmacotherapy is the treatment of choice in part because of its more rapid onset of action.25
Pharmacotherapy
Pharmacotherapy, most often in the form of an SSRI, is the treatment of choice for depression as a result of patient preference, insurance coverage limitations, or time constraints. In choosing an anti-depressant, the family physician should be guided by effectiveness and potential for drug–drug interactions and for both short-and long-term side effects.33
Tricyclics, the SSRIs, and other newer antidepressants offer similar efficacy.34 While efficacy assesses outcome under ideal treatment conditions, the primary care physician is more concerned with effectiveness, defined as the proportion of patients started on an antidepressant during routine clinical practice who attain lasting benefit. Effectiveness includes consideration of patients who discontinue treatment because of side effects or drug–drug interactions, as well as those who do not obtain adequate therapeutic response. Since about 25% of patients discontinue SSRIs because of side effects, this is an important concern.24 Few studies have been conducted comparing the effectiveness of antidepressants.
Drug–drug interactions are mediated predominately by the cytochrome P450 isoenzymes responsible for drug metabolism in the liver.35-37 The 2D6 isoenzyme is responsible for 50% of drug metabolism in the liver; the 3A4 isoenzyme is responsible for another 30%.38 As a clinical example of the importance of such inhibition, codeine requires 2D6-mediated metabolism to become morphine and is ineffective for pain in many patients who are prescribed a 2D6 inhibitor. Patients receiving such agents also can have a 300% to 400% increase in blood levels of previously stable ß-blockers. Paroxetine and fluoxetine, the two SSRIs that strongly inhibit the 2D6 isoenzyme, cause clinically significant interactions; fluoxetine is also a moderate inhibitor of the 3A4 isoenzyme.35 Because of the number of potential drug–drug interactions through these isoenzymes, physicians must check for interactions before prescribing these medications or adding other new medications in patients already receiving these agents. This also is a consideration for patients who might require additional medications acutely, for instance in response to a cardiac or other emergency.
Side effects of concern include gastrointestinal effects, particularly nausea, and central nervous system (CNS) effects, including anxiety and agitation, sleep disturbance, and tremor. When these occur, they often decrease rapidly over the first 1 to 3 weeks. If severe, they can be managed by a temporary dosage decrease. For patients with significant CNS side effects, altering the timing of the daily dose might provide relief from daytime somnolence or agitation or from nighttime insomnia.
Long-term side effects of concern include weight gain and sexual dysfunction. While other SSRIs have low rates for weight gain, paroxetine causes a weight gain of more than 7% (about 10 lbs for a patient of average weight) in 20% to 25% of patients.39 Some element of sexual dysfunction, most often delayed orgasm, is estimated to occur in 30% to 40% of individuals receiving SSRIs.40,41 Management options include delaying dosage of agents with a half-life of about 24 hours (escitalopram, citalopram, sertraline).42 For instance, an individual who usually takes one of these agents in the morning may delay a day’s dose until after engaging in sexual intercourse in the evening. While open-label studies support augmentation, particularly with bupropion or buspirone, the few small randomized double-blind trials available suggest that positive results should be interpreted with caution.43 Alternatively, patients may benefit from sildenafil44 or a switch to a non-SSRI antidepressant.
While management of side effects presents one option, the best clinical approach may be to select an agent with minimal side-effect potential. In double-blind randomized trials, escitalopram, a new SSRI treatment option, was demonstrated to require treatment termination in less than 5% of recipients at its usual dose of 10 mg, a rate no different from that of placebo.45 In contrast, rates of 15% to 30% have been reported for other SSRIs and newer antidepressants at the time of their initial release.
Adjusting treatment
One recent primary care trial examined the effectiveness of 3 SSRIs: fluoxetine, sertraline, and paroxetine. At the time this study was designed, citalopram was not in common use. While about 75% of patients attained remission, only 40% to 50% of patients were maintained on the first prescribed agent.24 Additionally, about 20% of depression “treatment resistance” resulted because patients did not fill their prescriptions or adhere to treatment.46 For patients who do not respond within the first month, increasing the dosage is appropriate.47 About 25% of patients respond to this adjustment.48 For patients who do not respond, reassessment of the diagnosis, as well as assessment of potential psychiatric comorbidities and suicidal ideation, is indicated. For nonresponders, and for those with intolerable side effects, switching to a second SSRI is a reasonable next step.49 About 50% of patients switched to a second agent respond.50 For those who do not respond, the primary care physician might consider a second medication switch or psychiatric consultation.
Further treatment adjustment is indicated for patients who experience partial response. This might take the form of augmentation with psychotherapy51 or with another agent.52 Lithium and thyroid hormone (often as 25 to 50 mg T3 daily) are the most frequently used options, although stimulants, other antidepressants, and atypical antipsychotics are all of value in some patients.48,49,53
When indicated, treatment should be discontinued by tapering the dose over several weeks to months, depending on the duration and severity of past episodes. Patients should be educated to be alert for recurrence. They should also be monitored for recurrence and restarted on full-dose therapy if this occurs. If patients stop therapy abruptly, the likelihood of withdrawal symptoms (agitation, irritability, dizziness, ataxia, nausea, paresthesias, sleep disturbances) is highly related to the half-life of the SSRI.39 For paroxetine, which has the shortest half-life, withdrawal is frequent; the extended release preparation does not decrease the likelihood of withdrawal. Withdrawal symptoms are infrequent (< 2%) for sertraline, citalopram, and escitalopram, and they do not occur with fluoxetine.
Duration of treatment
A major challenge in family practice is maintaining patient adherence to treatment for the recommended interval to prevent relapse and to avoid recurrence in those with a history of prior episodes. In one study, 25% to 33% of primary care patients stopped depression therapy within 1 month and over 40% within 3 months. Additionally, 62% failed to inform their physicians.54 Depression also adversely affects compliance with treatment of comorbid medical conditions; in one meta-analysis, depression increased noncompliance 3-fold.54
For the first lifetime episode, the recommended duration of treatment is 6 to 9 months (4 to 6 months after recovery).55 Longer therapy is appropriate for those with comorbid anxiety disorders, severe initial symptoms, difficulty in attaining therapeutic response, deficient social support, or a history of substance abuse, as well as for older adults. For patients with 3 or more previous episodes, long-term maintenance therapy is recommended.55 For those with even one past episode, extended maintenance therapy might be beneficial. Maintenance therapy should be at the full dose required to attain initial response. In one study, only about 20% to 30% (depending on the treatment) experienced recurrence over 3 years if maintained at full dose, compared with 70% maintained at half the initial treatment dose, and 78% of those receiving placebo.56 For women who have previously suffered from postpartum depression, postpartum prophylaxis can be very effective. In one randomized trial, 62.5% of women on place-bo experienced recurrence compared with only 6.7% of those receiving prophylaxis.57
Practice strategies to improve care
A number of primary care investigators have demonstrated the value of practice management and quality improvement techniques to increase the portion of patients who achieve and maintain response to depression therapy. These studies share an approach of “active management” to promote adherence to treatment guidelines.58-63 For instance, Simon and colleagues demonstrated the value of initial and monthly phone contact.64
Active management techniques include the following:
- Initial and ongoing patient education and counseling, as discussed above
- Patient involvement and agreement in treatment choice
- Initial phone contact to assure the prescription has been filled and initial dose taken
- Periodic contact to inquire about adherence, treatment response, side effects, and to answer patient questions
- Adjustment of therapy for those not responding adequately by 4 to 6 weeks
- Establishment of a collaborative relationship with a psychiatrist for consultation and telephone advice
Additionally, primary care clinicians may find it helpful to add depression to their medical record preventive health maintenance flow chart, especially for patients with any past history of depression. Using the PHQ-9 can be beneficial in providing both the patient and physician with an objective measure of monitoring response and remission.
Conclusions
Effective and available treatments can have a major beneficial impact on patients with depression. To be maximally effective, primary care clinicians must actively manage the care of their depressed patients, using screening strategies to recognize depression in addition to targeted educational messages and active follow-up to improve treatment adherence. Long-term maintenance treatment prevents further recurrences in those who have already experienced multiple episodes. Choice of treatment should be guided by patient preference. For pharmacologic agents, selection should be based on effectiveness, likelihood of side effects and resultant premature discontinuation, and potential for drug–drug interaction. The majority of individuals with depression are managed solely in primary-care settings. With adequate treatment, remission of symptoms, significant improvement in quality of life, and return to full function at home and at work can be attained.
1. Young AS, Klap R, Sherbourne CD, Wells KB. The quality of care for depressive and anxiety disorders in the United States. Arch Gen Psychiatry. 2001;58:55-61.
2. Institute of Medicine (U.S.). Committee on Health and Behavior: Research Practice and Policy. Health and Behavior: The Interplay of Biological, Behavioral, and Societal Influences. Washington, DC: National Academy Press. 2001.
3. Lustman PJ, Griffith LS, Freedland KE, Clouse RE. The course of major depression in diabetes. Gen Hosp Psychiatry. 1997;19:138-143.
4. deGruy F, III. Mental health care in the primary care setting. In: Donaldson MS, ed. Primary Care: America’s Health in a New Era. Washington, DC: National Academy Press; 1996;285-311.
5. Bridges KW, Goldberg DP. Somatic presentation of DSM III psychiatric disorders in primary care. J Psychosom Res. 1985;29:563-569.
6. Kessler D, Lloyd K, Lewis G, Gray DP. Cross sectional study of symptom attribution and recognition of depression and anxiety in primary care. BMJ. 1999;318:436-439.
7. Whooley MA, Avins AL, Miranda J, Browner WS. Case-finding instruments for depression: two questions are as good as many. J Gen Intern Med. 1997;12:439-445.
8. Kroenke K, Spitzer RL, Williams JB. The PHQ-9: validity of a brief depression severity measure. J Gen Intern Med. 2001;16:606-613.
9. Spitzer RL, Kroenke K, Williams JB. Validation and utility of a self-report version of PRIME-MD: the PHQ primary care study. Primary Care Evaluation of Mental Disorders. Patient Health Questionnaire. JAMA. 1999;282:1737-1744.
10. Steer RA, Cavalieri TA, Leonard DM, Beck AT. Use of the Beck Depression Inventory for Primary Care to screen for major depression disorders. Gen Hosp Psychiatry. 1999;21:106-111.
11. Biggs JT, Wylie LT, Ziegler VE. Validity of the Zung Self-rating Depression Scale. Br J Psychiatry. 1978;132:381-385.
12. Goldberg DP, Gater R, Sartorius N, et al. The validity of two versions of the GHQ in the WHO study of mental illness in general health care. Psychol Med. 1997;27:191-197.
13. Susman JL. Postpartum depressive disorders. J Fam Pract. 1996;43(6 suppl):S17-24.
14. O’Hara MW, Schlechte JA, Lewis DA, Varner MW. Controlled prospective study of postpartum mood disorders: psychological, environmental, and hormonal variables. J Abnorm Psychol. 1991;100:63-73.
15. Yonkers KA, Ramin SM, Rush AJ, et al. Onset and persistence of postpartum depression in an inner-city maternal health clinic system. Am J Psychiatry. 2001;158:1856-1863.
16. Georgiopoulos AM, Bryan TL, Wollan P, Yawn BP. Routine screening for postpartum depression. J Fam Pract. 2001;50:117-122.
17. Eberhard-Gran M, Eskild A, Tambs K, Opjordsmoen S, Samuelsen SO. Review of validation studies of the Edinburgh Postnatal Depression Scale. Acta Psychiatr Scand. 2001;104:243-249.
18. Osterweis M, Solomon F, Green M. Institute of Medicine (U.S.). Committee for the Study of Health Consequences of the Stress of Bereavement. Bereavement: Reactions, Consequences, and Care. Washington, DC: National Academy Press; 1984.
19. Keller MB, Hanks DL. The natural history and heterogeneity of depressive disorders: implications for rational antidepressant therapy. J Clin Psychiatry. 1994;55 (suppl A):25-31;discussion32-23,98-100.
20. Keller MB, Hanks DL. Anxiety symptom relief in depression treatment outcomes. J Clin Psychiatry. 1995;56(suppl 6):22-29.
21. Kravitz HM, Fogg L, Fawcett J, Edwards J. Antidepressant or antianxiety? A study of the efficacy of antidepressant medication. Psychiatry Res. 1990;32:141-149.
22. Clayton AH. Recognition and assessment of sexual dysfunction associated with depression. J Clin Psychiatry. 2001;62(suppl 3):5-9.
23. Kennedy SH, Dickens SE, Eisfeld BS, et al. Sexual dysfunction before antidepressant therapy in major depression. J Affect Disord. 1999;201-208.
24. Kroenke K, West SL, Swindle R, et al. Similar effectiveness of paroxetine, fluoxetine, and sertraline in primary care: a randomized trial. JAMA. 2001;286:2947-2955.
25. Depression Guideline Panel. Depression in Primary Care: Volume 2. Treatment of Major Depression. Clinical Practice Guideline, Number 5. Rockville, MD: U.S. Dept. of Health and Human Services, Agency for Health Care Policy and Research; April 1993. AHCPR publication 93-0551.
26. Hegner RE. Dispelling the myths and stigma of mental illness: the Surgeon General’s report on mental health. Issue Brief Natl Health Policy Forum. 2000;(754):1-7.
27. Lin EH, Von Korff M, Katon W, et al. The role of the primary care physician in patients’ adherence to antidepressant therapy. Med Care. 1995;33:67-74.
28. Bootzin RR, Epstein D, Wood JM. Stimulus control instructions. In: Hauri P, ed. Case Studies in Insomnia. New York: Plenum Medical Book; 1991:xiv, 254.
29. Culpepper L. Worries and anxiety. In: Staton EW, ed. 20 Common Problems in Behavioral Health. New York: McGraw-Hill; 2002;385-404.
30. Miser WF. Exercise as an effective treatment option for major depression in older adults. J Fam Pract. 2000;49:109-110.
31. Robinson P, Bush T, Von Korff M, et al. Primary care physician use of cognitive behavioral techniques with depressed patients. J Fam Pract. 1995;40:352-357.
32. Rush AJ, Thase ME. Psychotherapies for depressive disorders: a review. In: Sartorius N, ed. Depressive Disorders. New York: John Wiley and Sons; 1999.
33. Preskorn SH. Selection of an antidepressant: mirtazapine. J Clin Psychiatry. 1997;58(suppl 6):3-8.
34. Geddes JR, Freemantle N, Mason J, Eccles MP, Boynton J. SSRIs versus other antidepressants for depressive disorder. Cochrane Database Syst Rev. 2000;CD001851.-
35. Preskorn SH. Debate resolved: there are differential effects of serotonin selective reuptake inhibitors on cytochrome P450 enzymes. J Psychopharmacol. 1998;12(3 suppl B):S89-97.
36. Preskorn SH. Antidepressant options in primary care. Clin Cornerstone. 1999;1:31-55.
37. Greenblatt DJ, von Moltke LL, Harmatz JS, Shader RI. Drug interactions with newer antidepressants: role of human cytochromes P450. J Clin Psychiatry. 1998;59 (suppl. 15):19-27.
38. Preskorn SH. Clinically relevant pharmacology of selective serotonin reuptake inhibitors. An overview with emphasis on pharmacokinetics and effects on oxidative drug metabolism. Clin Pharmacokinet. 1997;32(suppl 1):1-21.
39. Fava M, Judge R, Hoog SL, Nilsson ME, Koke SC. Fluoxetine versus sertraline and paroxetine in major depressive disorder: changes in weight with long-term treatment. J Clin Psychiatry. 2000;61:863-867.
40. Montejo-Gonzalez AL, Llorca G, Izquierdo JA, et al. SSRI-induced sexual dysfunction: fluoxetine, paroxetine, sertraline, and fluvoxamine in a prospective, multicenter, and descriptive clinical study of 344 patients. J Sex Marital Ther. 1997;23:176-194.
41. Fava M, Rankin M. Sexual functioning and SSRIs. J Clin Psychiatry. 2002;63(suppl 5):13-16;discussion 23-15.
42. Zajecka J. Strategies for the treatment of antidepressant-related sexual dysfunction. J Clin Psychiatry. 2001;62 (suppl 3):35-43.
43. Sturpe DA, Mertens MK, Scoville C. What are the treatment options for SSRI-related sexual dysfunction? J Fam Practice. 2002;51:681.-
44. Nurnberg HG, Hensley PL, Lauriello J, Parker LM, Keith SJ. Sildenafil for women patients with antidepressant-induced sexual dysfunction. Psychiatr Serv. 1999;50:1076-1078.
45. Wade A, Michael Lemming O, Bang Hedegaard K. Escitalopram 10mg/day is effective and well tolerated in a placebo-controlled study in depression in primary care. Int Clin Psychopharmacol. 2002;95-102.
46. Souery D, Mendlewicz J. Compliance and therapeutic issues in resistant depression. Int Clin Psychopharmacol. 1998;13 (suppl 2):S13-18.
47. Thase ME, Rush AJ. Treatment-resistant depression. In: Kupfer DJ, ed. Psychopharmacology: The Fourth Generation of Progress. New York: Raven Press; 1995;1081-1097.
48. Thase ME. What role do atypical antipsychotic drugs have in treatment-resistant depression. J Clin Psychiatry. 2002;63:95-103.
49. Practice guideline for the treatment of patients with major depressive disorder (revision). American Psychiatric Association. Am J Psychiatry. 2000;157(4 suppl):1-45.
50. Howland RH, Thase ME. What to do with SSRI non-responders? J Pract Psychiatry Behav Health. 1999;5:216-233.
51. Thase ME, Friedman ES, Howland RH. Management of treatment-resistant depression: psychotherapeutic perspectives. J Clin Psychiatry. 2001;62(suppl 18):18-24.
52. Fava M. Augmentation and combination strategies in treatment-resistant depression. J Clin Psychiatry. 2001;62 (suppl 18):4-11.
53. Thase ME, Howland RH, Friedman ES. Treating antidepressant nonresponders with augmentation strategies: an overview. J Clin Psychiatry. 1998;59(suppl 5):5-12;discussion 13-15.
54. DiMatteo MR, Lepper HS, Croghan TW. Depression is a risk factor for noncompliance with medical treatment: meta-analysis of the effects of anxiety and depression on patient adherence. Arch Intern Med. 2000;160:2101-2107.
55. Keller MB. The long-term treatment of depression. J Clin Psychiatry. 1999;60(suppl 17):41-45;discussion 46-48.
56. Shea MT, Elkin I, Imber SD, et al. Course of depressive symptoms over follow-up. Findings from the National Institute of Mental Health Treatment of Depression Collaborative Research Program. Arch Gen Psychiatry. 1992;49:782-787.
57. Wisner KL, Wheeler SB. Prevention of recurrent postpartum major depression. Hosp Community Psychiatry. 1994;45:1191-1196.
58. Schulberg HC, Katon W, Simon GE, Rush AJ. Treating major depression in primary care practice: an update of the Agency for Health Care Policy and Research Practice Guidelines. Arch Gen Psychiatry. 1998;55:1121-1127.
59. Schulberg HC. Treating depression in primary care practice: applications of research findings. J Fam Pract. 2001;50:535-537.
60. Katon W, Von Korff M, Lin E, et al. Collaborative management to achieve treatment guidelines. Impact on depression in primary care. JAMA. 1995;273:1026-1031.
61. Katon W, Robinson P, Von Korff M, et al. A multifaceted intervention to improve treatment of depression in primary care. Arch Gen Psychiatry. 1996;53:924-932.
62. Katon W, Von Korff M, Lin E, et al. Stepped collaborative care for primary care patients with persistent symptoms of depression: a randomized trial. Arch Gen Psychiatry. 1999;56:1109-1115.
63. Von Korff M, Katon W, Unutzer J, Wells K, Wagner EH. Improving depression care: barriers, solutions, and research needs. J Fam Pract. 2001;50:E1.-
64. Simon GE, VonKorff M, Rutter C, Wagner E. Randomised trial of monitoring, feedback, and management of care by telephone to improve treatment of depression in primary care. BMJ. 2000;320:550-554.
While family physicians play a leading role in caring for patients with major depression, the quality of that care that could be greatly improved. A 1997 to 1998 survey of a national sample of adults with depressive or anxiety disorders revealed that 83% of these patients visited a health care provider.1 Of this total, 84% were treated by primary care clinicians, compared with 16% who were treated by mental health professionals. However, about 90% of those cared for by mental health professionals received treatment that met criteria for adequacy outlined in treatment guidelines, compared with 19% of those cared for by primary care professionals.
A critical role for family physicians is to integrate treatment of depression with that of other conditions, especially in light of the association of depression with a variety of chronic diseases. The Institute of Medicine has concluded that depression is strongly associated with the occurrence of, and death following, myocardial infarctions.2 In diabetes, depression is associated with a 2% increase in glycosylated hemoglobin levels3 and can predict occurrence of diabetic complications. Additionally, chronic illnesses may, in themselves, exacerbate depression several fold.
Primary care clinicians are ideally positioned to serve as the central health care providers for patients with major depression. These physicians have many attributes that support this role, including their longitudinal relationship with patients, response to undifferentiated problems, frequent use of the biopsychosocial model, and ability to integrate care of mental and medical conditions. However, challenges in fulfilling this role also exist, including difficulties in recognizing patients with major depression, developing an adequate diagnostic initial assessment, implementing effective short- and long-term treatment and management strategies, and integrating care of depression with that of other conditions affecting patients.4 This article will review each of these challenges.
Recognition of major depression
DeGruy has eloquently described the barriers to recognition and management of mental disorders in primary care, including infrequent use of diagnostic criteria, concern regarding treatment effectiveness, availability of time and resources, the presence of other pressing clinical problems, and issues of third-party reimbursement and other organizational concerns.4
Family physicians and their patients often do not recognize somatic symptoms as originating from depression. In one study, primary care physicians correctly identified 94% of depressed patients presenting with psychological complaints, but they failed to recognize the psychiatric nature of somatic complaints in about half of the patients. This finding is of concern because 83% of depressed patients presented with somatic complaints.5
The attribution patients assign to their problems can also contribute to lack of recognition. In one general practice study, patients’ attributions were classified as somatizing (5%), psychologizing (23%), normalizing (48%), or no predominate attribution (24%).6 For example, patients in this study might attribute fatigue to anemia (somatizing), emotional exhaustion (psychologizing), or being over-extended (normalizing). The likelihood of a missed diagnosis in patients who met criteria for depression or anxiety was strongly associated with attribution: Physicians diagnosed 72% of psychologizing patients accurately, but they reported a correct diagnosis in only 17% of somatizing patients, 15% of normalizing patients, and 31% of patients with no predominate attribution.
Initial diagnostic assessment
The United States Preventive Services Task Force suggests that primary care physicians screen for major depression. The Task Force recommends using 2 simple questions about mood and anhedonia (Table 1) that are generally as effective as longer instruments.7 The Patient Health Questionnaire-9 (PHQ-9) or the longer Prime-MD can be used for further evaluation of patients who respond positively to either question, thus helping to both confirm the diagnosis of depression and measure severity.8,9 Other instruments include the Beck Depression Inventory,10 the Zung scale,11 and the General Health Questionnaire.12 These tools take longer to administer, are not specific in measuring the criteria for major depression, and do not measure severity well.
In family practices, pregnant and postpartum women represent a special population at increased risk for depression.13 About 5% of middle class women and up to one quarter of low income women experience postpartum depression.14 In about half, onset of the depressive disorder occurs before delivery.15 Women who have previously suffered postpartum depression are at high risk, as are those with histories of depression or premenstrual dysphoric disorder. The Edinburgh Postnatal Depression Scale is a useful 10-item self-report instrument available in Spanish and English (Table 1).16,17 Similar instruments have not been developed for pregnant women.
A patient who responds positively to the 2 screening questions in Table 1 or to another screening approach should be further evaluated to confirm the diagnosis of major depression. Many primary care clinicians do this through unstructured history taking. Others use an instrument such as the previously discussed PHQ-9. This tool offers an advantage because it provides a reliable symptom assessment, measures severity, and can be repeated over time to evaluate therapeutic response.8
The physician should consider bereavement and substance abuse as possible causes of depression; bereaved patients who continue to meet criteria for major depression at 2 months often benefit from treatment. By that time, the sadness, poor concentration, and other symptoms associated with normal grief are no longer constant and occur in waves brought on by memories. Conversely, persons also suffering from depression report these symptoms as enduring and autonomous.18
The primary care physician also should inquire about agitation and symptoms of anxiety disorders. These are experienced by 85% of depressed patients; 50% have comorbid anxiety disorders.19-21 Identification of such comorbidity is helpful in determining treatment, evaluating response, and managing patients over the long term. The Prime-MD, available in multiple languages, is also useful for screening for both anxiety and substance abuse, which can complicate both the recognition and treatment of comorbid depression.9
Sexual function is often affected by depression. The physician should inquire about sexual arousal, erection or lubrication, and orgasm during the initial assessment.22 Approximately 50% of women and 40% of men with major depression report sexual-arousal problems, and 15% to 20% report orgasm problems during the month prior to diagnosis.23 Further questioning can assess whether this dysfunction is caused by another disorder (eg, diabetes) or whether it is part of the depressive syndrome. This provides a baseline for later assessment of side effects and treatment effectiveness, and it communicates to the patient that the physician will be attentive to this area. In discussing sexual function with depressed patients, it may be helpful to tell patients that a study of the effectiveness of treatment of depression with selective serotonin reuptake inhibitors (SSRIs) found that patients reported modestly improved sexual function with treatment.24
TABLE 1
Screening for depression
| Outpatient adults | |
| |
| Postpartum women (Edinburgh Postnatal Depression Scale) | |
1. I have been able to laugh and see the funny side of things
| 6. Things have been getting on top of me
|
2. I have looked forward with enjoyment to things
| 7. I have been so unhappy that I have had difficulty sleeping
|
3. I have blamed myself unnecessarily when things went wrong
| 8. I have felt sad or miserable
|
4. I have been anxious or worried for no good reason
| 9. I have been so unhappy that I have been crying
|
5. I have felt scared or panicky for no very good reason
| 10. The thought of harming myself has occurred to me
|
| Reprinted with permission, from Cox JL et al. British Journal of Psychiatry. 1987; 150:782-786. | |
Management of major depression
The acute management of the patient with major depression includes patient education, shared decision-making regarding a treatment modality, supportive counseling, and treatment-specific counseling.25 Education and counseling should extend over the initial weeks of treatment and be combined with monitoring response, identifying and managing any treatment-emergent side effects, and adjusting medications. Long-term management goals include attaining full remission of symptoms, assisting the patient to return to full functional status, integrating depression care with the treatment of other chronic illnesses, maintaining or tapering pharmacologic treatment, and monitoring for and preventing relapse or recurrence.
Education
Education should help patients understand and accept the diagnosis, reduce any stigma they or their families might attach to major depression, and build increased adherence to subsequent treatment.26 It might be helpful to provide a brief explanation of the biologic basis of depression (including biochemical changes in brain function and “chemical imbalances” of serotonin and other neurotransmitters). Explaining pharmacotherapeutic effects (if medication is desired) as mechanisms to help rebalance brain chemistry further emphasizes the biologic basis of depression and decreases any perceptions that depression is a result of moral or character weakness. This educational message should also stress that antidepressants are not habit-forming or addictive, are not “uppers” or “downers,” and are not tranquilizers. The physician also should convey a positive prognosis but note that several weeks and, possibly, adjustments in treatments, may be required. For patients choosing antidepressants, the McArthur Foundation Initiative has identified 7 key educational messages (Table 2).27
TABLE 2
Key messages for patient education about depression
|
Counseling
Patients often benefit from counseling regarding sleep, exercise, and substance use. Many patients with depression experience early morning awakening. Those with agitated depression also often experience delayed sleep onset associated with worry. Providing the patient with information on basic sleep hygiene, exercise, and encouraging abstinence from or moderation in consumption of alcohol might all help.28-30 Additionally, sleep disturbances can indicate the possibility of comorbid disorders. A report that a patient fears going to sleep because of nightmares suggests posttraumatic stress disorder.
For some patients, counseling by the family physician or through referral may be a helpful treatment adjunct. Often depressed patients have deficient coping mechanisms and need assistance in developing strategies to resolve issues in their life. Principles used in cognitive behavioral therapy might be helpful in patient education and counseling.31 These include problem-solving strategies to resolve stressful concerns and cognitive techniques to identify and correct distorted or maladaptive thought patterns.29
As patients respond to depression treatment, an additional component of primary-care-based counseling should target reinvolvement with pleasurable social and physical activities. This may simply involve identifying activities the patient enjoyed prior to the onset of depression but has since stopped, and focusing on the steps required to reactivate these interests.
Shared decision-making with regard to treatment will improve subsequent patient adherence.27 Treatment options include psychotherapy, particularly cognitive behavioral therapy, pharmacotherapy, and electroconvulsive therapy. The latter should be considered for severely depressed patients, particularly persons with few social supports who are at significant risk of suicide.25
Cognitive behavioral therapy and other psychotherapies can show effectiveness equal to that of pharmacotherapy, although response usually lags by a month to 6 weeks compared with that attained by pharmacotherapy.32 For moderately to severely depressed patients, pharmacotherapy is the treatment of choice in part because of its more rapid onset of action.25
Pharmacotherapy
Pharmacotherapy, most often in the form of an SSRI, is the treatment of choice for depression as a result of patient preference, insurance coverage limitations, or time constraints. In choosing an anti-depressant, the family physician should be guided by effectiveness and potential for drug–drug interactions and for both short-and long-term side effects.33
Tricyclics, the SSRIs, and other newer antidepressants offer similar efficacy.34 While efficacy assesses outcome under ideal treatment conditions, the primary care physician is more concerned with effectiveness, defined as the proportion of patients started on an antidepressant during routine clinical practice who attain lasting benefit. Effectiveness includes consideration of patients who discontinue treatment because of side effects or drug–drug interactions, as well as those who do not obtain adequate therapeutic response. Since about 25% of patients discontinue SSRIs because of side effects, this is an important concern.24 Few studies have been conducted comparing the effectiveness of antidepressants.
Drug–drug interactions are mediated predominately by the cytochrome P450 isoenzymes responsible for drug metabolism in the liver.35-37 The 2D6 isoenzyme is responsible for 50% of drug metabolism in the liver; the 3A4 isoenzyme is responsible for another 30%.38 As a clinical example of the importance of such inhibition, codeine requires 2D6-mediated metabolism to become morphine and is ineffective for pain in many patients who are prescribed a 2D6 inhibitor. Patients receiving such agents also can have a 300% to 400% increase in blood levels of previously stable ß-blockers. Paroxetine and fluoxetine, the two SSRIs that strongly inhibit the 2D6 isoenzyme, cause clinically significant interactions; fluoxetine is also a moderate inhibitor of the 3A4 isoenzyme.35 Because of the number of potential drug–drug interactions through these isoenzymes, physicians must check for interactions before prescribing these medications or adding other new medications in patients already receiving these agents. This also is a consideration for patients who might require additional medications acutely, for instance in response to a cardiac or other emergency.
Side effects of concern include gastrointestinal effects, particularly nausea, and central nervous system (CNS) effects, including anxiety and agitation, sleep disturbance, and tremor. When these occur, they often decrease rapidly over the first 1 to 3 weeks. If severe, they can be managed by a temporary dosage decrease. For patients with significant CNS side effects, altering the timing of the daily dose might provide relief from daytime somnolence or agitation or from nighttime insomnia.
Long-term side effects of concern include weight gain and sexual dysfunction. While other SSRIs have low rates for weight gain, paroxetine causes a weight gain of more than 7% (about 10 lbs for a patient of average weight) in 20% to 25% of patients.39 Some element of sexual dysfunction, most often delayed orgasm, is estimated to occur in 30% to 40% of individuals receiving SSRIs.40,41 Management options include delaying dosage of agents with a half-life of about 24 hours (escitalopram, citalopram, sertraline).42 For instance, an individual who usually takes one of these agents in the morning may delay a day’s dose until after engaging in sexual intercourse in the evening. While open-label studies support augmentation, particularly with bupropion or buspirone, the few small randomized double-blind trials available suggest that positive results should be interpreted with caution.43 Alternatively, patients may benefit from sildenafil44 or a switch to a non-SSRI antidepressant.
While management of side effects presents one option, the best clinical approach may be to select an agent with minimal side-effect potential. In double-blind randomized trials, escitalopram, a new SSRI treatment option, was demonstrated to require treatment termination in less than 5% of recipients at its usual dose of 10 mg, a rate no different from that of placebo.45 In contrast, rates of 15% to 30% have been reported for other SSRIs and newer antidepressants at the time of their initial release.
Adjusting treatment
One recent primary care trial examined the effectiveness of 3 SSRIs: fluoxetine, sertraline, and paroxetine. At the time this study was designed, citalopram was not in common use. While about 75% of patients attained remission, only 40% to 50% of patients were maintained on the first prescribed agent.24 Additionally, about 20% of depression “treatment resistance” resulted because patients did not fill their prescriptions or adhere to treatment.46 For patients who do not respond within the first month, increasing the dosage is appropriate.47 About 25% of patients respond to this adjustment.48 For patients who do not respond, reassessment of the diagnosis, as well as assessment of potential psychiatric comorbidities and suicidal ideation, is indicated. For nonresponders, and for those with intolerable side effects, switching to a second SSRI is a reasonable next step.49 About 50% of patients switched to a second agent respond.50 For those who do not respond, the primary care physician might consider a second medication switch or psychiatric consultation.
Further treatment adjustment is indicated for patients who experience partial response. This might take the form of augmentation with psychotherapy51 or with another agent.52 Lithium and thyroid hormone (often as 25 to 50 mg T3 daily) are the most frequently used options, although stimulants, other antidepressants, and atypical antipsychotics are all of value in some patients.48,49,53
When indicated, treatment should be discontinued by tapering the dose over several weeks to months, depending on the duration and severity of past episodes. Patients should be educated to be alert for recurrence. They should also be monitored for recurrence and restarted on full-dose therapy if this occurs. If patients stop therapy abruptly, the likelihood of withdrawal symptoms (agitation, irritability, dizziness, ataxia, nausea, paresthesias, sleep disturbances) is highly related to the half-life of the SSRI.39 For paroxetine, which has the shortest half-life, withdrawal is frequent; the extended release preparation does not decrease the likelihood of withdrawal. Withdrawal symptoms are infrequent (< 2%) for sertraline, citalopram, and escitalopram, and they do not occur with fluoxetine.
Duration of treatment
A major challenge in family practice is maintaining patient adherence to treatment for the recommended interval to prevent relapse and to avoid recurrence in those with a history of prior episodes. In one study, 25% to 33% of primary care patients stopped depression therapy within 1 month and over 40% within 3 months. Additionally, 62% failed to inform their physicians.54 Depression also adversely affects compliance with treatment of comorbid medical conditions; in one meta-analysis, depression increased noncompliance 3-fold.54
For the first lifetime episode, the recommended duration of treatment is 6 to 9 months (4 to 6 months after recovery).55 Longer therapy is appropriate for those with comorbid anxiety disorders, severe initial symptoms, difficulty in attaining therapeutic response, deficient social support, or a history of substance abuse, as well as for older adults. For patients with 3 or more previous episodes, long-term maintenance therapy is recommended.55 For those with even one past episode, extended maintenance therapy might be beneficial. Maintenance therapy should be at the full dose required to attain initial response. In one study, only about 20% to 30% (depending on the treatment) experienced recurrence over 3 years if maintained at full dose, compared with 70% maintained at half the initial treatment dose, and 78% of those receiving placebo.56 For women who have previously suffered from postpartum depression, postpartum prophylaxis can be very effective. In one randomized trial, 62.5% of women on place-bo experienced recurrence compared with only 6.7% of those receiving prophylaxis.57
Practice strategies to improve care
A number of primary care investigators have demonstrated the value of practice management and quality improvement techniques to increase the portion of patients who achieve and maintain response to depression therapy. These studies share an approach of “active management” to promote adherence to treatment guidelines.58-63 For instance, Simon and colleagues demonstrated the value of initial and monthly phone contact.64
Active management techniques include the following:
- Initial and ongoing patient education and counseling, as discussed above
- Patient involvement and agreement in treatment choice
- Initial phone contact to assure the prescription has been filled and initial dose taken
- Periodic contact to inquire about adherence, treatment response, side effects, and to answer patient questions
- Adjustment of therapy for those not responding adequately by 4 to 6 weeks
- Establishment of a collaborative relationship with a psychiatrist for consultation and telephone advice
Additionally, primary care clinicians may find it helpful to add depression to their medical record preventive health maintenance flow chart, especially for patients with any past history of depression. Using the PHQ-9 can be beneficial in providing both the patient and physician with an objective measure of monitoring response and remission.
Conclusions
Effective and available treatments can have a major beneficial impact on patients with depression. To be maximally effective, primary care clinicians must actively manage the care of their depressed patients, using screening strategies to recognize depression in addition to targeted educational messages and active follow-up to improve treatment adherence. Long-term maintenance treatment prevents further recurrences in those who have already experienced multiple episodes. Choice of treatment should be guided by patient preference. For pharmacologic agents, selection should be based on effectiveness, likelihood of side effects and resultant premature discontinuation, and potential for drug–drug interaction. The majority of individuals with depression are managed solely in primary-care settings. With adequate treatment, remission of symptoms, significant improvement in quality of life, and return to full function at home and at work can be attained.
1. Young AS, Klap R, Sherbourne CD, Wells KB. The quality of care for depressive and anxiety disorders in the United States. Arch Gen Psychiatry. 2001;58:55-61.
2. Institute of Medicine (U.S.). Committee on Health and Behavior: Research Practice and Policy. Health and Behavior: The Interplay of Biological, Behavioral, and Societal Influences. Washington, DC: National Academy Press. 2001.
3. Lustman PJ, Griffith LS, Freedland KE, Clouse RE. The course of major depression in diabetes. Gen Hosp Psychiatry. 1997;19:138-143.
4. deGruy F, III. Mental health care in the primary care setting. In: Donaldson MS, ed. Primary Care: America’s Health in a New Era. Washington, DC: National Academy Press; 1996;285-311.
5. Bridges KW, Goldberg DP. Somatic presentation of DSM III psychiatric disorders in primary care. J Psychosom Res. 1985;29:563-569.
6. Kessler D, Lloyd K, Lewis G, Gray DP. Cross sectional study of symptom attribution and recognition of depression and anxiety in primary care. BMJ. 1999;318:436-439.
7. Whooley MA, Avins AL, Miranda J, Browner WS. Case-finding instruments for depression: two questions are as good as many. J Gen Intern Med. 1997;12:439-445.
8. Kroenke K, Spitzer RL, Williams JB. The PHQ-9: validity of a brief depression severity measure. J Gen Intern Med. 2001;16:606-613.
9. Spitzer RL, Kroenke K, Williams JB. Validation and utility of a self-report version of PRIME-MD: the PHQ primary care study. Primary Care Evaluation of Mental Disorders. Patient Health Questionnaire. JAMA. 1999;282:1737-1744.
10. Steer RA, Cavalieri TA, Leonard DM, Beck AT. Use of the Beck Depression Inventory for Primary Care to screen for major depression disorders. Gen Hosp Psychiatry. 1999;21:106-111.
11. Biggs JT, Wylie LT, Ziegler VE. Validity of the Zung Self-rating Depression Scale. Br J Psychiatry. 1978;132:381-385.
12. Goldberg DP, Gater R, Sartorius N, et al. The validity of two versions of the GHQ in the WHO study of mental illness in general health care. Psychol Med. 1997;27:191-197.
13. Susman JL. Postpartum depressive disorders. J Fam Pract. 1996;43(6 suppl):S17-24.
14. O’Hara MW, Schlechte JA, Lewis DA, Varner MW. Controlled prospective study of postpartum mood disorders: psychological, environmental, and hormonal variables. J Abnorm Psychol. 1991;100:63-73.
15. Yonkers KA, Ramin SM, Rush AJ, et al. Onset and persistence of postpartum depression in an inner-city maternal health clinic system. Am J Psychiatry. 2001;158:1856-1863.
16. Georgiopoulos AM, Bryan TL, Wollan P, Yawn BP. Routine screening for postpartum depression. J Fam Pract. 2001;50:117-122.
17. Eberhard-Gran M, Eskild A, Tambs K, Opjordsmoen S, Samuelsen SO. Review of validation studies of the Edinburgh Postnatal Depression Scale. Acta Psychiatr Scand. 2001;104:243-249.
18. Osterweis M, Solomon F, Green M. Institute of Medicine (U.S.). Committee for the Study of Health Consequences of the Stress of Bereavement. Bereavement: Reactions, Consequences, and Care. Washington, DC: National Academy Press; 1984.
19. Keller MB, Hanks DL. The natural history and heterogeneity of depressive disorders: implications for rational antidepressant therapy. J Clin Psychiatry. 1994;55 (suppl A):25-31;discussion32-23,98-100.
20. Keller MB, Hanks DL. Anxiety symptom relief in depression treatment outcomes. J Clin Psychiatry. 1995;56(suppl 6):22-29.
21. Kravitz HM, Fogg L, Fawcett J, Edwards J. Antidepressant or antianxiety? A study of the efficacy of antidepressant medication. Psychiatry Res. 1990;32:141-149.
22. Clayton AH. Recognition and assessment of sexual dysfunction associated with depression. J Clin Psychiatry. 2001;62(suppl 3):5-9.
23. Kennedy SH, Dickens SE, Eisfeld BS, et al. Sexual dysfunction before antidepressant therapy in major depression. J Affect Disord. 1999;201-208.
24. Kroenke K, West SL, Swindle R, et al. Similar effectiveness of paroxetine, fluoxetine, and sertraline in primary care: a randomized trial. JAMA. 2001;286:2947-2955.
25. Depression Guideline Panel. Depression in Primary Care: Volume 2. Treatment of Major Depression. Clinical Practice Guideline, Number 5. Rockville, MD: U.S. Dept. of Health and Human Services, Agency for Health Care Policy and Research; April 1993. AHCPR publication 93-0551.
26. Hegner RE. Dispelling the myths and stigma of mental illness: the Surgeon General’s report on mental health. Issue Brief Natl Health Policy Forum. 2000;(754):1-7.
27. Lin EH, Von Korff M, Katon W, et al. The role of the primary care physician in patients’ adherence to antidepressant therapy. Med Care. 1995;33:67-74.
28. Bootzin RR, Epstein D, Wood JM. Stimulus control instructions. In: Hauri P, ed. Case Studies in Insomnia. New York: Plenum Medical Book; 1991:xiv, 254.
29. Culpepper L. Worries and anxiety. In: Staton EW, ed. 20 Common Problems in Behavioral Health. New York: McGraw-Hill; 2002;385-404.
30. Miser WF. Exercise as an effective treatment option for major depression in older adults. J Fam Pract. 2000;49:109-110.
31. Robinson P, Bush T, Von Korff M, et al. Primary care physician use of cognitive behavioral techniques with depressed patients. J Fam Pract. 1995;40:352-357.
32. Rush AJ, Thase ME. Psychotherapies for depressive disorders: a review. In: Sartorius N, ed. Depressive Disorders. New York: John Wiley and Sons; 1999.
33. Preskorn SH. Selection of an antidepressant: mirtazapine. J Clin Psychiatry. 1997;58(suppl 6):3-8.
34. Geddes JR, Freemantle N, Mason J, Eccles MP, Boynton J. SSRIs versus other antidepressants for depressive disorder. Cochrane Database Syst Rev. 2000;CD001851.-
35. Preskorn SH. Debate resolved: there are differential effects of serotonin selective reuptake inhibitors on cytochrome P450 enzymes. J Psychopharmacol. 1998;12(3 suppl B):S89-97.
36. Preskorn SH. Antidepressant options in primary care. Clin Cornerstone. 1999;1:31-55.
37. Greenblatt DJ, von Moltke LL, Harmatz JS, Shader RI. Drug interactions with newer antidepressants: role of human cytochromes P450. J Clin Psychiatry. 1998;59 (suppl. 15):19-27.
38. Preskorn SH. Clinically relevant pharmacology of selective serotonin reuptake inhibitors. An overview with emphasis on pharmacokinetics and effects on oxidative drug metabolism. Clin Pharmacokinet. 1997;32(suppl 1):1-21.
39. Fava M, Judge R, Hoog SL, Nilsson ME, Koke SC. Fluoxetine versus sertraline and paroxetine in major depressive disorder: changes in weight with long-term treatment. J Clin Psychiatry. 2000;61:863-867.
40. Montejo-Gonzalez AL, Llorca G, Izquierdo JA, et al. SSRI-induced sexual dysfunction: fluoxetine, paroxetine, sertraline, and fluvoxamine in a prospective, multicenter, and descriptive clinical study of 344 patients. J Sex Marital Ther. 1997;23:176-194.
41. Fava M, Rankin M. Sexual functioning and SSRIs. J Clin Psychiatry. 2002;63(suppl 5):13-16;discussion 23-15.
42. Zajecka J. Strategies for the treatment of antidepressant-related sexual dysfunction. J Clin Psychiatry. 2001;62 (suppl 3):35-43.
43. Sturpe DA, Mertens MK, Scoville C. What are the treatment options for SSRI-related sexual dysfunction? J Fam Practice. 2002;51:681.-
44. Nurnberg HG, Hensley PL, Lauriello J, Parker LM, Keith SJ. Sildenafil for women patients with antidepressant-induced sexual dysfunction. Psychiatr Serv. 1999;50:1076-1078.
45. Wade A, Michael Lemming O, Bang Hedegaard K. Escitalopram 10mg/day is effective and well tolerated in a placebo-controlled study in depression in primary care. Int Clin Psychopharmacol. 2002;95-102.
46. Souery D, Mendlewicz J. Compliance and therapeutic issues in resistant depression. Int Clin Psychopharmacol. 1998;13 (suppl 2):S13-18.
47. Thase ME, Rush AJ. Treatment-resistant depression. In: Kupfer DJ, ed. Psychopharmacology: The Fourth Generation of Progress. New York: Raven Press; 1995;1081-1097.
48. Thase ME. What role do atypical antipsychotic drugs have in treatment-resistant depression. J Clin Psychiatry. 2002;63:95-103.
49. Practice guideline for the treatment of patients with major depressive disorder (revision). American Psychiatric Association. Am J Psychiatry. 2000;157(4 suppl):1-45.
50. Howland RH, Thase ME. What to do with SSRI non-responders? J Pract Psychiatry Behav Health. 1999;5:216-233.
51. Thase ME, Friedman ES, Howland RH. Management of treatment-resistant depression: psychotherapeutic perspectives. J Clin Psychiatry. 2001;62(suppl 18):18-24.
52. Fava M. Augmentation and combination strategies in treatment-resistant depression. J Clin Psychiatry. 2001;62 (suppl 18):4-11.
53. Thase ME, Howland RH, Friedman ES. Treating antidepressant nonresponders with augmentation strategies: an overview. J Clin Psychiatry. 1998;59(suppl 5):5-12;discussion 13-15.
54. DiMatteo MR, Lepper HS, Croghan TW. Depression is a risk factor for noncompliance with medical treatment: meta-analysis of the effects of anxiety and depression on patient adherence. Arch Intern Med. 2000;160:2101-2107.
55. Keller MB. The long-term treatment of depression. J Clin Psychiatry. 1999;60(suppl 17):41-45;discussion 46-48.
56. Shea MT, Elkin I, Imber SD, et al. Course of depressive symptoms over follow-up. Findings from the National Institute of Mental Health Treatment of Depression Collaborative Research Program. Arch Gen Psychiatry. 1992;49:782-787.
57. Wisner KL, Wheeler SB. Prevention of recurrent postpartum major depression. Hosp Community Psychiatry. 1994;45:1191-1196.
58. Schulberg HC, Katon W, Simon GE, Rush AJ. Treating major depression in primary care practice: an update of the Agency for Health Care Policy and Research Practice Guidelines. Arch Gen Psychiatry. 1998;55:1121-1127.
59. Schulberg HC. Treating depression in primary care practice: applications of research findings. J Fam Pract. 2001;50:535-537.
60. Katon W, Von Korff M, Lin E, et al. Collaborative management to achieve treatment guidelines. Impact on depression in primary care. JAMA. 1995;273:1026-1031.
61. Katon W, Robinson P, Von Korff M, et al. A multifaceted intervention to improve treatment of depression in primary care. Arch Gen Psychiatry. 1996;53:924-932.
62. Katon W, Von Korff M, Lin E, et al. Stepped collaborative care for primary care patients with persistent symptoms of depression: a randomized trial. Arch Gen Psychiatry. 1999;56:1109-1115.
63. Von Korff M, Katon W, Unutzer J, Wells K, Wagner EH. Improving depression care: barriers, solutions, and research needs. J Fam Pract. 2001;50:E1.-
64. Simon GE, VonKorff M, Rutter C, Wagner E. Randomised trial of monitoring, feedback, and management of care by telephone to improve treatment of depression in primary care. BMJ. 2000;320:550-554.
Tympanometry Interpretation by Primary Care Physicians
METHODS: Primary care physicians in PBRNs in the Netherlands, United Kingdom, United States, and Canada enrolled 1773 children aged 6 to 180 months who contributed 6358 tympanograms during 3179 visits. The physicians were trained in the use and interpretation of tympanometry using the Modified Jerger Classification. We determined the level of agreement between physicians and experts for interpretation of tympanograms. One comparison used the 6358 individual ear tracings. A second comparison used the 3179 office visits by children as the unit of analysis.
RESULTS: The distribution of expert interpretation of all tympanograms was: 35.8% A, 30% B, 15.5% C1, 12% C2, and 6.8% uninterpretable; for visits, 37.8% were normal (A or C1), 55.6% abnormal (B or C2), and 6.6% could not be classified. There was a high degree of agreement in the interpretation of tympanograms between experts and primary care physicians across networks (k=0.70-0.77), age groups of children (k=0.69-0.73), and types of visits (k=0.66-0.77). This high degree of agreement was also found when children were used as a unit of analysis.
CONCLUSIONS: Interpretations of tympanograms by primary care physicians using the Modified Jerger Classification can be used with confidence. These results provide further evidence that practicing primary care physicians can provide high quality data for research purposes.
Tympanometry has been assessed and is sometimes promoted as a useful tool in the management of children with ear infections and effusions.1-6 Recently a group at the Centers for Disease Control and Prevention7 recommended tympanometry as a procedure of value when the diagnosis of acute otitis media is uncertain. It provides an objective assessment of the status of the middle ear8-10 and for some children correlates with hearing loss.11-12 The feasibility of using hand-held tympanometers in family practice has been established,3-13 but the accuracy of the interpretations of tympanograms made by primary care physicians is unknown.14 We report the level of agreement of interpretations of tympanograms between practicing primary care physicians and experts.
Methods
As part of a study of acute otitis media, 131 primary care physicians obtained 6358 tympanograms from 1773 children aged 6 to 180 months during 3179 routine practice visits: 2236 in the Netherlands, 1594 in the United Kingdom, and 2528 in North America. Data from Canada and the United States were combined, because the practices were united in one network (The Ambulatory Sentinel Practice Network), and followed the same study standards. Visits occurred either at the time of the diagnosis of a new episode of acute otitis media, or at 2- or 5-month study follow-up visits. Diagnostic criteria for acute otitis media included either otoscopic evidence of a bulging tympanic membrane, drainage of pus, or a red ear accompanied by ear pain.
A study coordinator trained each physician in the otoscopic examination of the ear, the use of the Welch Allyn Micro Tymp 2 (Skaneateles Falls, NY), and tympanogram interpretation. The study physicians were observed and coached as necessary until they were able to demonstrate competence to the study coordinator. The physicians were provided with a calibrated tympanometer and printer. The Modified Jerger Classification1 which includes 5 categories (A, C1, C2, B, and uninterpretable) was used. This established classification is based primarily on the pressure at which acoustic admittance is greatest (A: -99 to 200 daPa; C1: -199 to -100 daPa; C2: -399 to -200 daPa; B: less than -399, seen as a flat tracing)
Tympanograms were forwarded to national data centers and blindly reinterpreted by 1 of 3 national study coordinators. The study coordinators identified difficult to interpret tympanograms, reached agreement about rules to be used in their interpretation, and informed the participating physicians of these rules during the ongoing study. These national coordinators and the criterion referee interpreted a set of 52 tympanograms randomly selected from a pool of difficult to interpret tympanograms. The k statistic, a chance-corrected measure of agreement, was calculated using SPSS software (Chicago, Ill) to determine inter-rater agreement.15 A k of 0.75 or greater represents excellent agreement beyond chance, and values between 0.40 and 0.75 represent fair to good agreement. Kappas for expert interrater reliability ranged from 0.77 to 0.95. Conflicts among the interpretations of the expert national study coordinators were resolved by the most experienced investigator, who served as the study’s criterion standard.13
Data from the interpretations of the tympanograms were organized by country (Canada and the United States were combined as North America), age of child (6-12,13-24, and 25-180 months),16 and type of visit (initial, follow-up at 2 months, follow-up at 5 months). On the basis of established cut-points related to sensitivity and specificity, C1 and A interpretations were categorized as normal and C2 and B as abnormal. The interpretation of individual tympanograms is important in determining test performance. However, treatment decisions affect the whole child and depend on assessment of the combined interpretation of tympanograms from both ears obtained from a child during a visit. Therefore, both individual and bilateral sets of tympanograms obtained for a child at a visit were used as units of analyses.
Significance testing of differences is not reported because of small standard deviations associated with most of the observations.
Results
The expert national coordinators interpreted 35.8% of the tympanograms as A curves, 30% as B curves, 15.5% as C1 curves, and 12% as C2 curves. Only 6.8% of the curves were considered uninterpretable, ranging from a high of 9.5% at initial visits to a low of 3.0% at 5-month visits. The distribution of the interpretations by country, age group, and visit type is shown in Table 1.
From a clinical perspective decisions are made on the basis of individuals, not ears. As shown in Table 2, 37.8% of the visiting children were classified as normal (A or C1 classification of both ears), 55.6% as abnormal (B or C2 classification of at least one ear), and 6.6% could not be classified. The distribution varied by country, age, and type of visit. The Netherlands had the largest percentage of children with abnormal tympanograms. A majority of children had an abnormal tympanogram at the initial visit, but there was little difference among children in the 3 age groups.
There was a high level of agreement between primary care physicians and the experts as shown in Table 3. Agreement in interpretation of the tympanograms in both type of curve (A, C1, C2, B) and classification of children as normal or abnormal was high in all countries, in all the age groups, and at all types of visits. Similarly, agreement was high in all countries, age groups, and visit types for classification of children at visits as normal or abnormal on the basis of tympanograms of both ears, with the lowest k (0.58) for children at their initial visits, and kappas of 0.76 and 0.75 at follow-up visits.
Discussion
The need for primary care research in practice settings is established.17 Some researchers, however, question the accuracy of the data gathered and reported by busy primary care clinicians in their practice settings. Our findings demonstrate that primary care physicians can obtain and accurately interpret tympanograms during daily practice. A high level of agreement with experts was found in the Netherlands, the United Kingdom, and North America for infants and older children and at initial as well as follow-up visits for children with acute otitis media. High levels of agreement persisted when analyzed as bilateral sets of tympanograms obtained at a visit. This analysis suggests agreement at the level most relevant to clinical decision making in primary care.
The lower—but still high—level of agreement in interpretations by child at initial visit may relate to physiological, anatomic, and behavioral aspects present at the early stages of acute otitis media as seen in the primary care setting. The higher levels of agreement at follow-up are reassuring, given the role of tympanometry in assessing effusion as a potential complication of acute otitis media.
Conclusions
The results of our study are unique and important because they are robust and based on large numbers of tympanograms obtained from both infants and older children in primary care practices in the Netherlands, the United Kingdom, the United States, and Canada. Our findings support the assertion that primary care physicians can successfully use tympanometry but offer no data to verify the relevance of tympanometry in the management of acute otitis media or other middle ear disease in primary care. Tympanometry is feasible in primary care practice, and the results obtained by physicians trained in the use of the Modified Jerger Classification can be used with confidence. These results provide further evidence that practicing primary care physicians can provide high-quality data for research purposes.
Acknowledgments
Our work was supported by the Agency for Health Care Policy and Research grant no. RO1 HS07035-03. The tympanometers were purchased at a discounted rate from Welch Allyn. The participating physicians were: Ambulatory Sentinel Practice Network (United States and Canada): Arlis Adolf, Jules Amer, John Anderson, Robert Baker, Gordon Blakeman, Brian Caplan, Paul Collins, Bill Davis, Richard Douglass, Patricia Fibiger, Stephen Fischer, Ed Friedler, Ronald Gagne, Thomas Gilbert, Susan Girardeau, John Glennon, Gary Gray, Cindy Hansen, Terry Hankey, Michael Hartsell, Joseph Hildner, Robert Howse, Jr., Robert James, Roger Kimber, Gary Knaus, Paula Leonard-Schwartz, Mary Maguire, Kim Manning, Kathleen McGarr, Doreen McMahon, Jasmine Moghissi, Michael Mulligan, William Nietert, Spiro Papadopoulos, Donya Powers, Thomas Overholt, Steve Perry, Paul Schmitt, John Scott, Susan Shapiro, Brian Siray, Kimball Spence, Jon Sternburg, Linda Stewart, Lynne Studebaker, James Wickerath, Elizabeth Wise, and Lloyd Wollstadt. Surrey GP Network (the United Kingdom): Nick Barrie, G. Bennett, S. Brown, Jace Clarke, Mark Cornbloom, I. Davies, Niall Ferguson, N. Fisher, Richard France, Paul Grob, Mark Hanan, Robert Harvey, John Healey, David William Holwell, R. N. Jeffery, Murdo Macleod, Mather, Philip Moore, Julia Oxenbury, Margaret Palmer, C. A. Pearson, C. Pidgeon, M. Pujara, David Skipp, A. Smith, K. Tarrant, Chris Tibbott, Brett J. Whitby-Smith, Hamish Whitaker, Mary Anne Whitehead, P. R. Wilks, Sidney Worthington, and J. Young. University of Utrecht Network (the Netherlands): Atyvan Aarnhem, G. Ploosvan Amstel, D. B. van Baarda, Marja Baeten, P. J. van Beek, H. C. V. Berkum, R. Bohm, J. C. M. van Campen, J. W. Cirkel, H. J. R. Dorman, J. H. Duistermaat, H. van Es, N. Goudswaard, N. de Grunt, Ax. M. E. J. Hoeberichts, M. E. van der Hoek, J. M. P. M. Janssen, E. G. A. de Jong, L. Klaphake, A. W. K. Kramer, J. Kuiper, N. Kwakernaak, Hans Kootte, Jaap R. van der Laan, O. J. M. Lackamp, C. G. Lameris, Marjan Lamers, H. C. de Lathouder, P. J. Luyendijk, G. A. M. Maathuis, R. H. L. Morshuis, W. P. G. Mulder, P. L. W. Pijman, F. G. Pingen, Pricleer, Liesbeth Redeke, M. J. G. van Roosmalen, C. J. Rovers, S. H. A. Schmeets, J. F. Scholte, B. P. Schreuder, T. Steenkamer, Jette Timmer-Martijn, F. Trip, de Vries, Christine Weenink, H. C. P. M. van Weert, P. Willems, Boes Willemse, and P. van de Woestijne.
1. Balen FAM, de Melker RA. Validation of a portable tympanometer for use in primary care. Int J Ped Otorhinolaryngol 1994;29:219-25.
2. G. Tympanometry in general practice. Practitioner 1993;237:547-51.
3. JM, Allison RS, Corwin P, White PS, Doherty J. Microtympanometry, microscopy and tympanometry in evaluating middle ear effusion prior to myringotomy. N Z Med J 1993;106:386-87.
4. T, Friel-Patti S, Chinn K, Brown O. Tympanometry and otoscopy prior to myringotomy: issues in diagnosis of otitis media. Int J Pediatr Otorhinolaryngol 1992;24:101-10.
5. R, Mills RP. The Welch Allyn audioscope and microtymp: their accuracy and that of pneumatic otoscopy, tympanometry and pure tone audiometry as predictors of otitis media with effusion. J Laryngol Otol 1992;106:600-02.
6. T, Felding JU, Eriksen EW, Pedersen LV. Diagnosis and treatment of ear diseases in general practice: a controlled trial of the effect of the introduction of middle ear measurement (tympanometry). Ugeskr Laeger 1991;153:3004-07.
7. SF, Butler JC, Giebink GS, et al. Acute otitis media: management and surveillance in an era of pneumococcal resistance: a report from the Drug-resistant Streptococcus pneumoniae Therapeutic Working Group. Pediatr Infect Dis J 1999;18:1-9.
8. RC. An introduction to tympanometry. Am Fam Physician 1991;44:2113-18.
9. AR. Using tympanometry to detect glue ear in general practice: overreliance will lead to overtreatment. BMJ 1992;304:67-68.
10. J, Shelton C. Basic principles and clinical applications of tympanometry. Otolaryngol Clin North Am 1991;24:299-328.
11. SG, Maw AR. Tympanometry, stapedius reflex and hearing impairment in children with otitis media with effusion. Acta Otolaryngol 1994;114:410-14.
12. JH, MacKenzie K. Tympanometry in the detection of hearing impariments associated with otitis media with effusion. Clin Otolaryngol 1991;16:157-59.
13. Melker RA. Diagnostic value of microtympanometry in primary care. BMJ 1992;304:96-98.
14. M, Dostaler LP, Dumont H, Huard G, Laflamme L. Interobserver reliability of a portable tympanometer, the microtymp. Can Med Assoc J 1993;148:559-64.
15. JL. Statistical methods for rates and proportions. New York, NY: John Wiley & Sons; 1981.
16. J, Bryant K, Mundy M, Zeisel S, Roberts J. Developmental changes in static admittance and tympanometric width in infants and toddlers. J Am Acad Audiol 1995;6:334-38.
17. MS, Yordy KD, Lohr KN, eds. Primary care: America’s health in a new era. Washington DC: National Academy Press; 1996.
METHODS: Primary care physicians in PBRNs in the Netherlands, United Kingdom, United States, and Canada enrolled 1773 children aged 6 to 180 months who contributed 6358 tympanograms during 3179 visits. The physicians were trained in the use and interpretation of tympanometry using the Modified Jerger Classification. We determined the level of agreement between physicians and experts for interpretation of tympanograms. One comparison used the 6358 individual ear tracings. A second comparison used the 3179 office visits by children as the unit of analysis.
RESULTS: The distribution of expert interpretation of all tympanograms was: 35.8% A, 30% B, 15.5% C1, 12% C2, and 6.8% uninterpretable; for visits, 37.8% were normal (A or C1), 55.6% abnormal (B or C2), and 6.6% could not be classified. There was a high degree of agreement in the interpretation of tympanograms between experts and primary care physicians across networks (k=0.70-0.77), age groups of children (k=0.69-0.73), and types of visits (k=0.66-0.77). This high degree of agreement was also found when children were used as a unit of analysis.
CONCLUSIONS: Interpretations of tympanograms by primary care physicians using the Modified Jerger Classification can be used with confidence. These results provide further evidence that practicing primary care physicians can provide high quality data for research purposes.
Tympanometry has been assessed and is sometimes promoted as a useful tool in the management of children with ear infections and effusions.1-6 Recently a group at the Centers for Disease Control and Prevention7 recommended tympanometry as a procedure of value when the diagnosis of acute otitis media is uncertain. It provides an objective assessment of the status of the middle ear8-10 and for some children correlates with hearing loss.11-12 The feasibility of using hand-held tympanometers in family practice has been established,3-13 but the accuracy of the interpretations of tympanograms made by primary care physicians is unknown.14 We report the level of agreement of interpretations of tympanograms between practicing primary care physicians and experts.
Methods
As part of a study of acute otitis media, 131 primary care physicians obtained 6358 tympanograms from 1773 children aged 6 to 180 months during 3179 routine practice visits: 2236 in the Netherlands, 1594 in the United Kingdom, and 2528 in North America. Data from Canada and the United States were combined, because the practices were united in one network (The Ambulatory Sentinel Practice Network), and followed the same study standards. Visits occurred either at the time of the diagnosis of a new episode of acute otitis media, or at 2- or 5-month study follow-up visits. Diagnostic criteria for acute otitis media included either otoscopic evidence of a bulging tympanic membrane, drainage of pus, or a red ear accompanied by ear pain.
A study coordinator trained each physician in the otoscopic examination of the ear, the use of the Welch Allyn Micro Tymp 2 (Skaneateles Falls, NY), and tympanogram interpretation. The study physicians were observed and coached as necessary until they were able to demonstrate competence to the study coordinator. The physicians were provided with a calibrated tympanometer and printer. The Modified Jerger Classification1 which includes 5 categories (A, C1, C2, B, and uninterpretable) was used. This established classification is based primarily on the pressure at which acoustic admittance is greatest (A: -99 to 200 daPa; C1: -199 to -100 daPa; C2: -399 to -200 daPa; B: less than -399, seen as a flat tracing)
Tympanograms were forwarded to national data centers and blindly reinterpreted by 1 of 3 national study coordinators. The study coordinators identified difficult to interpret tympanograms, reached agreement about rules to be used in their interpretation, and informed the participating physicians of these rules during the ongoing study. These national coordinators and the criterion referee interpreted a set of 52 tympanograms randomly selected from a pool of difficult to interpret tympanograms. The k statistic, a chance-corrected measure of agreement, was calculated using SPSS software (Chicago, Ill) to determine inter-rater agreement.15 A k of 0.75 or greater represents excellent agreement beyond chance, and values between 0.40 and 0.75 represent fair to good agreement. Kappas for expert interrater reliability ranged from 0.77 to 0.95. Conflicts among the interpretations of the expert national study coordinators were resolved by the most experienced investigator, who served as the study’s criterion standard.13
Data from the interpretations of the tympanograms were organized by country (Canada and the United States were combined as North America), age of child (6-12,13-24, and 25-180 months),16 and type of visit (initial, follow-up at 2 months, follow-up at 5 months). On the basis of established cut-points related to sensitivity and specificity, C1 and A interpretations were categorized as normal and C2 and B as abnormal. The interpretation of individual tympanograms is important in determining test performance. However, treatment decisions affect the whole child and depend on assessment of the combined interpretation of tympanograms from both ears obtained from a child during a visit. Therefore, both individual and bilateral sets of tympanograms obtained for a child at a visit were used as units of analyses.
Significance testing of differences is not reported because of small standard deviations associated with most of the observations.
Results
The expert national coordinators interpreted 35.8% of the tympanograms as A curves, 30% as B curves, 15.5% as C1 curves, and 12% as C2 curves. Only 6.8% of the curves were considered uninterpretable, ranging from a high of 9.5% at initial visits to a low of 3.0% at 5-month visits. The distribution of the interpretations by country, age group, and visit type is shown in Table 1.
From a clinical perspective decisions are made on the basis of individuals, not ears. As shown in Table 2, 37.8% of the visiting children were classified as normal (A or C1 classification of both ears), 55.6% as abnormal (B or C2 classification of at least one ear), and 6.6% could not be classified. The distribution varied by country, age, and type of visit. The Netherlands had the largest percentage of children with abnormal tympanograms. A majority of children had an abnormal tympanogram at the initial visit, but there was little difference among children in the 3 age groups.
There was a high level of agreement between primary care physicians and the experts as shown in Table 3. Agreement in interpretation of the tympanograms in both type of curve (A, C1, C2, B) and classification of children as normal or abnormal was high in all countries, in all the age groups, and at all types of visits. Similarly, agreement was high in all countries, age groups, and visit types for classification of children at visits as normal or abnormal on the basis of tympanograms of both ears, with the lowest k (0.58) for children at their initial visits, and kappas of 0.76 and 0.75 at follow-up visits.
Discussion
The need for primary care research in practice settings is established.17 Some researchers, however, question the accuracy of the data gathered and reported by busy primary care clinicians in their practice settings. Our findings demonstrate that primary care physicians can obtain and accurately interpret tympanograms during daily practice. A high level of agreement with experts was found in the Netherlands, the United Kingdom, and North America for infants and older children and at initial as well as follow-up visits for children with acute otitis media. High levels of agreement persisted when analyzed as bilateral sets of tympanograms obtained at a visit. This analysis suggests agreement at the level most relevant to clinical decision making in primary care.
The lower—but still high—level of agreement in interpretations by child at initial visit may relate to physiological, anatomic, and behavioral aspects present at the early stages of acute otitis media as seen in the primary care setting. The higher levels of agreement at follow-up are reassuring, given the role of tympanometry in assessing effusion as a potential complication of acute otitis media.
Conclusions
The results of our study are unique and important because they are robust and based on large numbers of tympanograms obtained from both infants and older children in primary care practices in the Netherlands, the United Kingdom, the United States, and Canada. Our findings support the assertion that primary care physicians can successfully use tympanometry but offer no data to verify the relevance of tympanometry in the management of acute otitis media or other middle ear disease in primary care. Tympanometry is feasible in primary care practice, and the results obtained by physicians trained in the use of the Modified Jerger Classification can be used with confidence. These results provide further evidence that practicing primary care physicians can provide high-quality data for research purposes.
Acknowledgments
Our work was supported by the Agency for Health Care Policy and Research grant no. RO1 HS07035-03. The tympanometers were purchased at a discounted rate from Welch Allyn. The participating physicians were: Ambulatory Sentinel Practice Network (United States and Canada): Arlis Adolf, Jules Amer, John Anderson, Robert Baker, Gordon Blakeman, Brian Caplan, Paul Collins, Bill Davis, Richard Douglass, Patricia Fibiger, Stephen Fischer, Ed Friedler, Ronald Gagne, Thomas Gilbert, Susan Girardeau, John Glennon, Gary Gray, Cindy Hansen, Terry Hankey, Michael Hartsell, Joseph Hildner, Robert Howse, Jr., Robert James, Roger Kimber, Gary Knaus, Paula Leonard-Schwartz, Mary Maguire, Kim Manning, Kathleen McGarr, Doreen McMahon, Jasmine Moghissi, Michael Mulligan, William Nietert, Spiro Papadopoulos, Donya Powers, Thomas Overholt, Steve Perry, Paul Schmitt, John Scott, Susan Shapiro, Brian Siray, Kimball Spence, Jon Sternburg, Linda Stewart, Lynne Studebaker, James Wickerath, Elizabeth Wise, and Lloyd Wollstadt. Surrey GP Network (the United Kingdom): Nick Barrie, G. Bennett, S. Brown, Jace Clarke, Mark Cornbloom, I. Davies, Niall Ferguson, N. Fisher, Richard France, Paul Grob, Mark Hanan, Robert Harvey, John Healey, David William Holwell, R. N. Jeffery, Murdo Macleod, Mather, Philip Moore, Julia Oxenbury, Margaret Palmer, C. A. Pearson, C. Pidgeon, M. Pujara, David Skipp, A. Smith, K. Tarrant, Chris Tibbott, Brett J. Whitby-Smith, Hamish Whitaker, Mary Anne Whitehead, P. R. Wilks, Sidney Worthington, and J. Young. University of Utrecht Network (the Netherlands): Atyvan Aarnhem, G. Ploosvan Amstel, D. B. van Baarda, Marja Baeten, P. J. van Beek, H. C. V. Berkum, R. Bohm, J. C. M. van Campen, J. W. Cirkel, H. J. R. Dorman, J. H. Duistermaat, H. van Es, N. Goudswaard, N. de Grunt, Ax. M. E. J. Hoeberichts, M. E. van der Hoek, J. M. P. M. Janssen, E. G. A. de Jong, L. Klaphake, A. W. K. Kramer, J. Kuiper, N. Kwakernaak, Hans Kootte, Jaap R. van der Laan, O. J. M. Lackamp, C. G. Lameris, Marjan Lamers, H. C. de Lathouder, P. J. Luyendijk, G. A. M. Maathuis, R. H. L. Morshuis, W. P. G. Mulder, P. L. W. Pijman, F. G. Pingen, Pricleer, Liesbeth Redeke, M. J. G. van Roosmalen, C. J. Rovers, S. H. A. Schmeets, J. F. Scholte, B. P. Schreuder, T. Steenkamer, Jette Timmer-Martijn, F. Trip, de Vries, Christine Weenink, H. C. P. M. van Weert, P. Willems, Boes Willemse, and P. van de Woestijne.
1. Balen FAM, de Melker RA. Validation of a portable tympanometer for use in primary care. Int J Ped Otorhinolaryngol 1994;29:219-25.
2. G. Tympanometry in general practice. Practitioner 1993;237:547-51.
3. JM, Allison RS, Corwin P, White PS, Doherty J. Microtympanometry, microscopy and tympanometry in evaluating middle ear effusion prior to myringotomy. N Z Med J 1993;106:386-87.
4. T, Friel-Patti S, Chinn K, Brown O. Tympanometry and otoscopy prior to myringotomy: issues in diagnosis of otitis media. Int J Pediatr Otorhinolaryngol 1992;24:101-10.
5. R, Mills RP. The Welch Allyn audioscope and microtymp: their accuracy and that of pneumatic otoscopy, tympanometry and pure tone audiometry as predictors of otitis media with effusion. J Laryngol Otol 1992;106:600-02.
6. T, Felding JU, Eriksen EW, Pedersen LV. Diagnosis and treatment of ear diseases in general practice: a controlled trial of the effect of the introduction of middle ear measurement (tympanometry). Ugeskr Laeger 1991;153:3004-07.
7. SF, Butler JC, Giebink GS, et al. Acute otitis media: management and surveillance in an era of pneumococcal resistance: a report from the Drug-resistant Streptococcus pneumoniae Therapeutic Working Group. Pediatr Infect Dis J 1999;18:1-9.
8. RC. An introduction to tympanometry. Am Fam Physician 1991;44:2113-18.
9. AR. Using tympanometry to detect glue ear in general practice: overreliance will lead to overtreatment. BMJ 1992;304:67-68.
10. J, Shelton C. Basic principles and clinical applications of tympanometry. Otolaryngol Clin North Am 1991;24:299-328.
11. SG, Maw AR. Tympanometry, stapedius reflex and hearing impairment in children with otitis media with effusion. Acta Otolaryngol 1994;114:410-14.
12. JH, MacKenzie K. Tympanometry in the detection of hearing impariments associated with otitis media with effusion. Clin Otolaryngol 1991;16:157-59.
13. Melker RA. Diagnostic value of microtympanometry in primary care. BMJ 1992;304:96-98.
14. M, Dostaler LP, Dumont H, Huard G, Laflamme L. Interobserver reliability of a portable tympanometer, the microtymp. Can Med Assoc J 1993;148:559-64.
15. JL. Statistical methods for rates and proportions. New York, NY: John Wiley & Sons; 1981.
16. J, Bryant K, Mundy M, Zeisel S, Roberts J. Developmental changes in static admittance and tympanometric width in infants and toddlers. J Am Acad Audiol 1995;6:334-38.
17. MS, Yordy KD, Lohr KN, eds. Primary care: America’s health in a new era. Washington DC: National Academy Press; 1996.
Clinical Wisdom and the Evidence Base Otitis Media with Effusion
In this issue of the Journal, van Balen and de Melker1 provide new insights into the natural history of otitis media with effusion (OME). Since family physicians often manage the early stages of illness, we are interested in both diagnosis and prognosis, with prognosis frequently being more important. OME is diagnosable in a large portion of children. It is diagnosable at some point during each year in up to 97% of young children in daycare, for example, and is present for the average child approximately 20% of the time.2,3
This suggests that rather than viewing OME as distinct pathology, it should be considered part of the natural course of events: a physiologic phenomenon that reflects eustachian tube obstruction with secondary fluid accumulation in the middle ear, which commonly follows upper respiratory tract infections (URIs) or acute otitis media. >From a primary care clinical perspective, what distinguishes OME as a physiologic process from OME as a pathologic process-a disease-is not the anatomic characteristics of the ear or the nature of the fluid, but the prognosis.
The importance of prognosis
The natural history of OME includes spontaneous clearing of the fluid in 60% to 65% of children every 3 months, with an even higher rate of clearing if the fluid occurs following acute otitis media.4 Among those children with persistent effusion, only a minority have significant hearing deficits bilaterally, resulting in only a few requiring intervention, possibly less than 5% of those with OME.5 We only need to be concerned about the child who is destined to develop an adverse outcome of consequence. That is the significance of the search for prognostic discriminators, the focus of the work of van Balen and de Melker.
First, we need to consider what the possible adverse outcomes are; persistent fluid by itself may be of little consequence. The ultimate outcomes that suggest that OME is clinically important are persistent hearing deficits and the conjectured (yet to be supported by strong evidence) long-term impairment of the development of speech and language resulting from such deficits. The Agency for Health Care Policy and Research panel on OME6 recommended that children have their hearing tested before they are treated for persistent OME, and only those with bilateral hearing deficits should be considered for the insertion of tympanostomy tubes. However, because of the difficulty in testing hearing in young children, the identification of those with persistent OME has evolved as a surrogate predictor of persistent hearing deficits to limit the number of children requiring a hearing evaluation.
Thus the real prognostic question of interest is: Which young children are likely to have a persistent hearing deficit leading to impaired language development? If the ultimate outcome of language development is the focus, the presence of the ameliorating behaviors of the family and other caregivers, such as daily reading with the child, becomes as important as the presence of fluid.7
Predictors of persistent ome
Within this context, the van Balen and de Melker study provides 2 major advances in our understanding: one based on their clinical wisdom and the other based on the results of their data analyses. Perhaps their more important contribution is the former. In designing their study-possibly to decrease the workload of the physicians involved-they sought to select a group of children likely to have bilateral OME during routine office visits to family physicians. Their clinical experience and review of the literature led them to use a selection strategy that included children with hearing loss (including subjective), language and speech problems, mouth breathing and snoring, a history of recurrent URI (6 or more episodes in 12 months), a family history of otitis media, and acute otitis 6 weeks previously. Children with these characteristics represent a very different group of children from those with asymptomatic OME discovered by routine screening or as a chance observation during 1 of the numerous preventive health care visits that occur during the first years of life.
An examination of these inclusion criteria suggests that most are likely to be indicators of significant persistent eustachian tube obstruction, leading to persistent OME. Thus, at study entry the investigators had already taken a major step toward identifying a group of children with the prognosis of persistent OME. The value of their inclusion criteria as diagnostic and prognostic indicators is verified by their data. Eighty-four percent had bilateral OME at the initial visit; the expected rate is 20% to 30% among all young children visiting family physicians.3 Seventy-six percent had persistent OME at a 3-month follow-up visit, with three quarters of these having bilateral OME. Thus, the inclusion criteria were powerful predictors of persistent OME.
Given the prognostic power of the set of variables included in their selection strategy, it is not surprising that a very limited number of additional potential prognostic factors contributed to prognosis. The identification of these additional factors is the evidence-based contribution of their study. Recurrent URIs, and in their absence intact adenoids, summer-fall presentation, and a history of otitis during the first year of life all marginally increase the likelihood of persistent effusion, although the discriminant power of these factors is low. However, these items and the inclusion criteria may be important and possibly discriminating factors in the general population of children visiting family physicians and pediatricians.
Future research
What remains for future investigation is the evaluation of the discriminating capacity and screening characteristics—both sensitivity and specificity—of each of the identification factors when applied to general primary care populations. For now, the most important take-home message might be that the inclusion criteria coupled with URI at follow-up are highly predictive of persistent OME and deserving of further patient follow-up and a hearing evaluation.
1. Van Balen F, de Melker R. Factors associated with persistent otitis media with effusion. J Fam Pract 2000;49:605-611.
2. Casselbrant ML, Brostoff LM, Cantekin EI, et al. Otitis media with effusion in preschool children. Laryngoscope 1985;95:428-36.
3. Paradise JL, Rockette HE, Colborn DK, et al. Otitis media in 2253 Pittsburgh-area infants: prevalence and risk factors during the first two years of life. Pediatrics 1997;99:318-33.
4. Zielhuis GA, Straatman H, Rach GH, van den Broek P. Analysis and presentation of data on the natural course of otitis media with effusion in children. Int J Epidemiol 1990;19:1037-44.
5. Culpepper L, Froom J. Otitis media with effusion in young children: treatment in search of a problem. J Am Board Fam Pract 1995;8:1-12.
6. Stool SE, Berg AO, Berman S, et al. Otitis media with effusion in young children. Clinical practice guideline, number 12. Rockville, Md: Agency for Health Care Policy and Research, Public Health Services, US Department of Health and Human Services; 1994. AHCPR publication no. 94-0622.
7. Robert JE, Burchinal MR, Medley LP, et al. Otitis media, hearing sensitivity, and maternal responsiveness in relation to language during infancy. J Pediatr 1995;126:481-89.
In this issue of the Journal, van Balen and de Melker1 provide new insights into the natural history of otitis media with effusion (OME). Since family physicians often manage the early stages of illness, we are interested in both diagnosis and prognosis, with prognosis frequently being more important. OME is diagnosable in a large portion of children. It is diagnosable at some point during each year in up to 97% of young children in daycare, for example, and is present for the average child approximately 20% of the time.2,3
This suggests that rather than viewing OME as distinct pathology, it should be considered part of the natural course of events: a physiologic phenomenon that reflects eustachian tube obstruction with secondary fluid accumulation in the middle ear, which commonly follows upper respiratory tract infections (URIs) or acute otitis media. >From a primary care clinical perspective, what distinguishes OME as a physiologic process from OME as a pathologic process-a disease-is not the anatomic characteristics of the ear or the nature of the fluid, but the prognosis.
The importance of prognosis
The natural history of OME includes spontaneous clearing of the fluid in 60% to 65% of children every 3 months, with an even higher rate of clearing if the fluid occurs following acute otitis media.4 Among those children with persistent effusion, only a minority have significant hearing deficits bilaterally, resulting in only a few requiring intervention, possibly less than 5% of those with OME.5 We only need to be concerned about the child who is destined to develop an adverse outcome of consequence. That is the significance of the search for prognostic discriminators, the focus of the work of van Balen and de Melker.
First, we need to consider what the possible adverse outcomes are; persistent fluid by itself may be of little consequence. The ultimate outcomes that suggest that OME is clinically important are persistent hearing deficits and the conjectured (yet to be supported by strong evidence) long-term impairment of the development of speech and language resulting from such deficits. The Agency for Health Care Policy and Research panel on OME6 recommended that children have their hearing tested before they are treated for persistent OME, and only those with bilateral hearing deficits should be considered for the insertion of tympanostomy tubes. However, because of the difficulty in testing hearing in young children, the identification of those with persistent OME has evolved as a surrogate predictor of persistent hearing deficits to limit the number of children requiring a hearing evaluation.
Thus the real prognostic question of interest is: Which young children are likely to have a persistent hearing deficit leading to impaired language development? If the ultimate outcome of language development is the focus, the presence of the ameliorating behaviors of the family and other caregivers, such as daily reading with the child, becomes as important as the presence of fluid.7
Predictors of persistent ome
Within this context, the van Balen and de Melker study provides 2 major advances in our understanding: one based on their clinical wisdom and the other based on the results of their data analyses. Perhaps their more important contribution is the former. In designing their study-possibly to decrease the workload of the physicians involved-they sought to select a group of children likely to have bilateral OME during routine office visits to family physicians. Their clinical experience and review of the literature led them to use a selection strategy that included children with hearing loss (including subjective), language and speech problems, mouth breathing and snoring, a history of recurrent URI (6 or more episodes in 12 months), a family history of otitis media, and acute otitis 6 weeks previously. Children with these characteristics represent a very different group of children from those with asymptomatic OME discovered by routine screening or as a chance observation during 1 of the numerous preventive health care visits that occur during the first years of life.
An examination of these inclusion criteria suggests that most are likely to be indicators of significant persistent eustachian tube obstruction, leading to persistent OME. Thus, at study entry the investigators had already taken a major step toward identifying a group of children with the prognosis of persistent OME. The value of their inclusion criteria as diagnostic and prognostic indicators is verified by their data. Eighty-four percent had bilateral OME at the initial visit; the expected rate is 20% to 30% among all young children visiting family physicians.3 Seventy-six percent had persistent OME at a 3-month follow-up visit, with three quarters of these having bilateral OME. Thus, the inclusion criteria were powerful predictors of persistent OME.
Given the prognostic power of the set of variables included in their selection strategy, it is not surprising that a very limited number of additional potential prognostic factors contributed to prognosis. The identification of these additional factors is the evidence-based contribution of their study. Recurrent URIs, and in their absence intact adenoids, summer-fall presentation, and a history of otitis during the first year of life all marginally increase the likelihood of persistent effusion, although the discriminant power of these factors is low. However, these items and the inclusion criteria may be important and possibly discriminating factors in the general population of children visiting family physicians and pediatricians.
Future research
What remains for future investigation is the evaluation of the discriminating capacity and screening characteristics—both sensitivity and specificity—of each of the identification factors when applied to general primary care populations. For now, the most important take-home message might be that the inclusion criteria coupled with URI at follow-up are highly predictive of persistent OME and deserving of further patient follow-up and a hearing evaluation.
1. Van Balen F, de Melker R. Factors associated with persistent otitis media with effusion. J Fam Pract 2000;49:605-611.
2. Casselbrant ML, Brostoff LM, Cantekin EI, et al. Otitis media with effusion in preschool children. Laryngoscope 1985;95:428-36.
3. Paradise JL, Rockette HE, Colborn DK, et al. Otitis media in 2253 Pittsburgh-area infants: prevalence and risk factors during the first two years of life. Pediatrics 1997;99:318-33.
4. Zielhuis GA, Straatman H, Rach GH, van den Broek P. Analysis and presentation of data on the natural course of otitis media with effusion in children. Int J Epidemiol 1990;19:1037-44.
5. Culpepper L, Froom J. Otitis media with effusion in young children: treatment in search of a problem. J Am Board Fam Pract 1995;8:1-12.
6. Stool SE, Berg AO, Berman S, et al. Otitis media with effusion in young children. Clinical practice guideline, number 12. Rockville, Md: Agency for Health Care Policy and Research, Public Health Services, US Department of Health and Human Services; 1994. AHCPR publication no. 94-0622.
7. Robert JE, Burchinal MR, Medley LP, et al. Otitis media, hearing sensitivity, and maternal responsiveness in relation to language during infancy. J Pediatr 1995;126:481-89.