Results
Demographic and clinical characteristics
Table 1 provides the demographic and clinical descriptions of patients admitted by the different admitting physician models. Patients in the different groups were similar, with 2 exceptions: hypertension was significantly more common in the critical care hospitalist group than in the other groups (P < .05), and there was a trend toward more diabetes in the critical care hospitalist group that did not quite reach statistical significance. Nonsignificant trends also existed for PSI, effusion on chest x-ray, and mental status, with more effusions and acute mental status changes occurring in the critical care hospitalist group, more chronic altered mental status in the family physician hospitalist group, and greater severity of illness in the critical care hospitalist group. Otherwise, demographics, disease severity, and comorbidities were comparable.
TABLE 1
Demographic and clinical characteristics
| Admission group | |||
|---|---|---|---|
| Variable | Critical care hospitalists | Family physician hospitalists | Primary care physicians |
| Total† | 22 (21) | 54 (53) | 23 (23) |
| Demographics | |||
| Age, y‡ | 70 (4) | 66 (3) | 67 (4) |
| Male† | 57 (12) | 62 (33) | 48 (11) |
| Female† | 43 (9) | 38 (20) | 52 (12) |
| Comorbidities† | |||
| Hypertension* | 29 (6) | 23 (12) | 54 (12) |
| Diabetes§ | 0 (0) | 9 (5) | 22 (5) |
| Mental status | |||
| Acute changes | 14 (3) | 6 (3) | 0 (0) |
| Chronic changes | 14 (3) | 26 (14) | 17 (4) |
| Effusion on chest x-ray | 33 (7) | 24 (13) | 17 (4) |
| Renal disease | 10 (2) | 6 (3) | 4 (1) |
| Liver disease | 5 (1) | 2 (1) | 4 (1) |
| Cerebrovascular disease | 14 (3) | 11 (6) | 13 (3) |
| Coronary artery disease | 24 (5) | 27 (14) | 22 (5) |
| Heart failure | 24 (5) | 23 (12) | 18 (4) |
| Cancer | 0 (0) | 2 (1) | 4 (1) |
| Nursing home resident | 9 (2) | 4 (2) | 13 (3) |
| Smokers | 19 (4) | 37 (20) | 26 (6) |
| Vital signs/laboratory values‡ | |||
| Heart rate | 92 (5) | 94 (3) | 92 (5) |
| Respiratory rate | 24 (2) | 24 (1) | 23 (2) |
| Systolic blood pressure | 124 (6) | 127 (4) | 136 (6) |
| Temperature (°F) | 99 (0) | 99 (0) | 99 (0) |
| Pulse oximetry | 86 (2) | 88 (1) | 89 (2) |
| Blood urea nitrogen | 20 (3) | 20 (2) | 22 (3) |
| Glucose | 123 (16) | 130 (10) | 154 (16) |
| Hematocrit | 40 (1) | 41 (1) | 39 (1) |
| Sodium | 136 (1) | 136 (1) | 137 (1) |
| Disease severity | |||
| PSI, raw data‡ | 103 (10) | 85 (6) | 99 (9) |
| PSI risk† | |||
| Low | 10 (2) | 24 (13) | 22 (5) |
| Moderate | 29 (6) | 19 (10) | 26 (6) |
| High | 62 (13) | 55 (30) | 52 (12) |
| *P = .024. | |||
| †Percentage (number of patients). | |||
| ‡Mean (± standard deviation). | |||
| §P = .058; otherwise, P > .05 (chi-square for ordinal and categorical variables, analysis of variance for continuous variables). | |||
| PSI, Pneumonia Severity Index. | |||
Primary outcomes
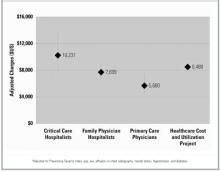
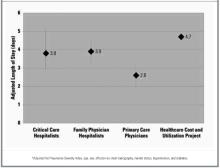
After controlling for severity of illness and intergroup differences, we found that the critical care hospitalist team had the highest mean hospital charge ($10,231), followed by the family physician hospitalist ($7699) and the primary care physician ($5680) groups (Figure 1). The difference in charges between the primary care physician and the critical care hospitalist groups was statistically significant (P = .005) and approached significance between the primary care physician and family physician hospitalist groups (P = .08). The critical care hospitalist and family physician hospitalist groups had longer mean lengths of stay than did the primary care physician group (P = .04 and .01, respectively; Figure 2). The other primary outcomes were rare: 1 primary care physician patient died (4.5%), 2 critical care hospitalist patients died (9.5%) and no family physician hospitalist patients died; no primary care physician patients were readmitted, 1 critical care hospitalist patient was readmitted (4.8%), and 2 family physician hospitalist patients were readmitted (3.8%). There was 1 return to the emergency room in the cohort, in the family physician hospitalist group (1.9%). No intergroup comparisons between these unadjusted rates were statistically significant (P > .05).
FIGURE 1
Hospital charges (in US dollars; with 95% confidence intervals)*
FIGURE 2
Length of stay (in days; with 95% confidence intervals)*
Secondary outcomes
After controlling for severity of illness and intergroup differences, we found that the critical care hospitalists were more likely to obtain 2 or more chest x-rays than the primary care physicians. There were nonsignificant trends toward longer stays in intensive care, greater likelihood of obtaining sputum cultures, and documenting end-of-life counseling by the critical care hospitalists compared with the primary care physicians. For the family physician hospitalists, there were nonsignificant trends toward better compliance with American Thoracic Society antibiotic guidelines and greater likelihood of documenting end-of-life and lifestyle modification counseling compared with the primary care physicians (Table 2).
TABLE 2
Secondary “process of care” outcomes*
| Outcome | Primary care physicians† | Critical care hospitalists | Family physician hospitalists |
|---|---|---|---|
| Chest x-ray (≥2) | 1 | 4.1 (1.1–15.5) | 0.9 (0.3–2.6) |
| ICU stay (≥1 d) | 1 | 2.9 (0.6–14.6) | 0.5 (0.1–3) |
| ATS guideline adherence | 1 | 1.4 (0.4–5.0) | 2.3 (0.8–7.0) |
| Sputum culture obtained | 1 | 2.3 (0.7–8.0) | 0.6 (0.2–1.7) |
| Blood culture obtained | 1 | 1.3 (0.4–4.8) | 1.2 (0.4–3.5) |
| End-of-life counseling documented | 1 | 3.0 (0.6–14.3) | 3.1 (0.7–12.9) |
| Lifestyle modification documented | 1 | 1.1 (0.3–4.5) | 2.7 (0.8–8.7) |
| *Data are presented as odds ratio (95% confidence interval). Odds ratios were adjusted for Pneumonia Severity Index, age, sex, effusion on chest radiography, mental status, hypertension, and diabetes. | |||
| †Reference group. | |||
| ATS, American Thoracic Society; ICU, intensive care unit. | |||
Discussion
Our study provided a unique perspective on the impact of different models of caring for inpatients on the quality, processes, and cost of care. We believe this is the first study to successfully address several methodologic limitations of previous studies: potential time-effect bias, inappropriate controls, differential assignment of house staff and case management resources, unvalidated outcomes, and lack of clinical data.
In addition, we reduced the potential biases inherent in comparing different hospitals and different outpatient physician specialties and used a standardized chart abstraction instrument to avoid the problems inherent in using claims data. As a result, we were able to examine processes of care and use the PSI, an extensively validated tool, to control for disease severity. This study represents an effectiveness study of a real-life intervention by a health maintenance organization to mandate the use of hospitalists. Although the retrospective design of this study may create the potential for bias, there was inadequate advanced notice of the implementation of this hospitalist plan to allow for prospective analysis. Despite not being randomly assigned to 1 of the 3 groups, patients were quite similar with the exceptions of hypertension and possibly diabetes and PSI, which we controlled for in the statistical analysis.


