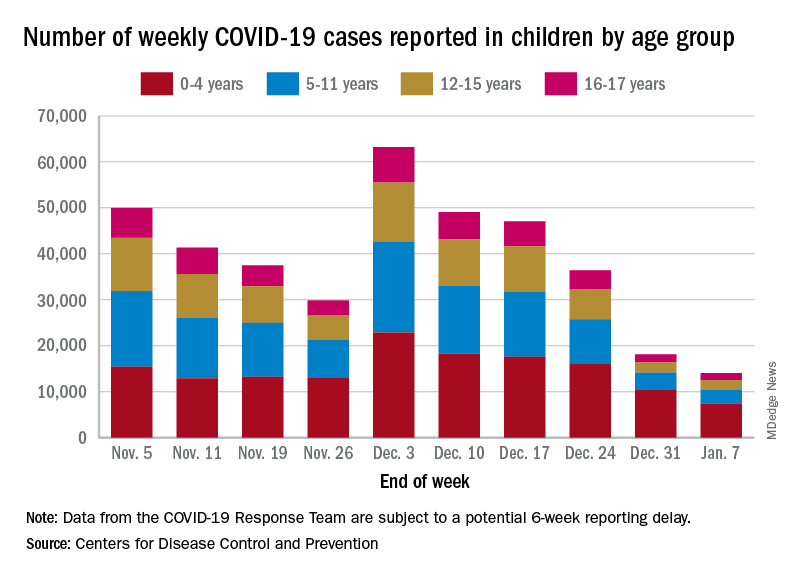
Emergency department visits and hospitalizations for COVID-19 in children appear to be following the declining trend set by weekly cases since early December, based on data from the Centers for Disease Control and Prevention.
. New cases took a different path that had the weekly total falling through November before taking a big jump during the week of Nov. 27 to Dec. 3 – the count doubled from 30,000 the previous week to 63,000 – and then decreased again, the CDC reported.
The proportion of ED visits with COVID, which was down to 1.0% of all ED visits (7-day average) for children aged 0-4 years on Nov. 4, was up to 3.2% on Jan. 3 but slipped to 2.5% as of Jan. 10. The patterns for older children are similar, with some differences in timing and lower peaks (1.7% for 12- to 15-year-olds and 1.9% for those aged 16-17), according to the CDC’s COVID Data Tracker.
The trend for new hospital admissions of children with confirmed COVID showed a similar rise through December, and the latest data for the very beginning of January suggest an even faster drop, although there is more of a reporting lag with hospitalization data, compared with ED visits, the CDC noted.
The most current data (Dec. 30 to Jan. 5) available from the American Academy of Pediatrics and the Children’s Hospital Association show less volatility in the number of weekly cases through November and December, with the peak being about 48,000 in mid-December. The AAP/CHA totals for the last 2 weeks, however, were both higher than the CDC’s corresponding counts, which are more preliminary and subject to revision.
The CDC puts the total number of COVID cases in children at 16.7 million – about 17.2% of all cases – as of Jan. 11, with 1,981 deaths reported so far. The AAP and CHA are not tracking deaths, but their case total as of Jan. 5 was 15.2 million, which represents 18.1% of cases in all ages. The AAP/CHA report is based on data reported publicly by an ever-decreasing number of states and territories.


