User login
Man’s best friend, fatal in the end
A previously healthy 59-year-old woman with a remote history of splenectomy following a motor vehicle accident presented to the emergency department with a chief complaint of fever. She had been in her usual state of health until the day before, when she developed chills and fever, with temperatures as high as 39.4°C (102.9°F). She also began to have nausea, vomiting, and diffuse body weakness and had to be brought to the emergency department in a wheelchair. She denied upper-respiratory or urinary symptoms, headache, stiff neck, recent travel, or sick contacts.
She had sustained a minor dog bite on her right hand 2 days before, but she denied swelling, erythema, or exudate. The dog, a family pet, was up to date on all of its vaccinations, including rabies.
 on patient’s right thumb from a dog bite")
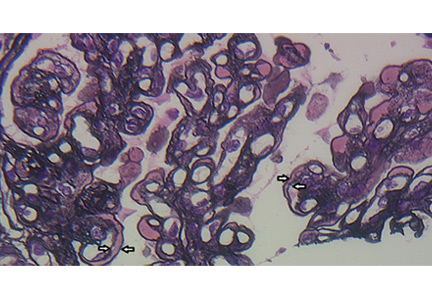
Her temperature was 39.3°C (102.7°F), heart rate 121 beats per minute, and blood pressure 113/71 mm Hg. She had a clean, nonerythematous, healing, 1-cm laceration on her right thumb (Figure 1).
Initial laboratory values (Table 1) and a radiograph of her right thumb were unremarkable.
FEVER IN ASPLENIC PATIENTS
1. What is the appropriate next step in this patient’s management?
- Discharge her from the emergency department and have her follow up with her primary care physician within 48 hours
- Admit her for observation and defer antibiotic therapy
- Admit her and start empiric antibiotic therapy
- Admit but wait for culture results to come back before starting antibiotic therapy

The patient’s history of splenectomy and presentation with fever raise the concern that she may be going into sepsis. In addition to fever, patients with sepsis may present with flulike symptoms such as myalgias, headache, vomiting, diarrhea, and abdominal pain.1
Sepsis in asplenic patients, also known as overwhelming postsplenectomy infection, can have a sudden onset and fulminant course, with a mortality rate as high as 50%.2 It is important to recognize those who are susceptible, including patients without a spleen from splenectomy or congenital asplenia, as well as those with functional asplenia from diseases such as sickle cell disease. Without the spleen, the immune system cannot clear immunoglobulin G-coated bacteria and encapsulated bacteria that are not opsonized by antibodies or complement.3
Any asplenic patient presenting with fever or other symptoms of systemic infection warrants immediate antibiotic treatment, without delay for cultures or further testing.1
CASE CONTINUED: RAPID DETERIORATION
With no clear source of infection, the patient’s clinical presentation was presumed to be due to a viral infection, and antibiotics were deferred. She was admitted to the hospital for observation.

By the next morning, her mental status had declined. Her temperature at that time was 39.6°C (103.2°F), heart rate 115 per minute, and blood pressure 113/74 mm Hg. Her skin became mottled, and her lactate level increased from 1.9 mmol/L to 4.9 mmol/L (reference range 0.5–1.9 mmol/L) within 9 hours and continued to climb (Table 2).
EMPIRIC ANTIBIOTICS IN ASPLENIC SEPSIS
2. Which first-line antibiotics should have been started on initial presentation?
- Intravenous vancomycin and intravenous ceftriaxone
- Intravenous vancomycin and intravenous metronidazole
- Oral levofloxacin
- Oral amoxicillin
At initial presentation to the hospital, the most appropriate regimen for this patient would have been vancomycin and ceftriaxone or cefepime in meningitis-level (ie, high) doses.2,4
Due to impaired immunity, asplenic patients are highly susceptible to encapsulated gram-positive organisms such as Streptococcus pneumoniae and gram-negative organisms such as Haemophilus influenzae, Neisseria meningitidis, and Capnocytophaga canimorsus. These organisms are all susceptible to ceftriaxone, with the exception of methicillin-resistant S pneumoniae, which is best covered with vancomycin.1 Patients with beta-lactam hypersensitivity can be treated with moxifloxacin instead.4,5
Vancomycin and metronidazole alone would not be adequate. Oral levofloxacin or amoxicillin would be appropriate initial treatment if the patient did not have access to a hospital within 2 hours. Ideally, the patient would have had one of these medications on hand and taken it at the first sign of fever.4
CASE CONTINUED: TRANSFER TO ICU
The patient was empirically started on vancomycin and ceftriaxone and transferred to the intensive care unit. She required intubation for airway protection. She became hypotensive despite receiving intravenous fluids and multiple vasopressors. She continued to rapidly decline and developed lactic acidosis, which resulted in a severe anion gap metabolic acidosis with respiratory compensation. Her course was further complicated by disseminated intravascular coagulation, acute kidney failure, and ischemic hepatitis (“shock liver”) (Table 2).
CAUSES OF SEPSIS IN ASPLENIC PATIENTS
3. The patient’s septic shock is likely the result of which bacterial pathogen?
- S pneumoniae
- H influenzae
- C canimorsus
- N meningitidis
Encapsulated organisms including S pneumoniae, H influenzae, and N meningitidis account for almost 70% of infections in postsplenectomy patients, including those with overwhelming postsplenectomy infection.6S pneumoniae is the most common culprit. However, the patient’s history of a recent dog bite suggests that the most likely cause was C canimorsus.
C canimorsus is a gram-negative bacillus commonly associated with exposure to dogs or cats through saliva, scratches, or bites.7,8 Even a seemingly small, benign-appearing wound, as seen in this case, can be a portal of entry for this organism. About 84 cases leading to fulminant sepsis were reported in the United States from 1990 to 2014.9 Patients infected with this organism can progress to fulminant sepsis with multiorgan failure with disseminated intravascular coagulation, anuria, and hypotension.10–12
CASE CONCLUDED
The patient died 40 hours after admission. Her blood cultures grew a slow-growing gram-negative rod within 2 days, subsequently identified as C canimorsus.
4. What is the best strategy for prevention of sepsis in an asplenic patient?
- Vaccinate against S pneumoniae (with PCV13 and PPSV23), H influenzae type b, and N meningitidis
- Prescribe antibiotics that the patient can take in case of fever
- Both of the above
- Prescribe lifelong daily antibiotic prophylaxis
- All of the above
Asplenic patients should receive pneumococcal, H influenzae type b, and meningococcal vaccines.13 Invasive bacterial infections, particularly with encapsulated organisms, occur 10 to 50 times more often in this population than in a healthy population and can be fatal.13 These vaccines have been shown to reduce the rate of life-threatening infections. Patients should receive the vaccines at least 2 weeks before an elective splenectomy or 2 weeks after a nonelective splenectomy.2
For the pneumococcal vaccines, PCV13 should be given first, followed by PPSV23 at least 8 weeks later. If the patient has already received PCV13, PPSV23 should be given at least 2 weeks after splenectomy. A second dose of PPSV23 should be given 5 years later.
The H influenzae type b vaccine should be administered if not already given.
For the meningococcal vaccine, the two-dose series should be administered with an interval of 8 to 12 weeks between doses. A booster meningococcal dose should be given every 5 years.
The patient should also receive the flu vaccine annually.2,14
Patients should also be given antibiotics (typically an antibiotic with activity against S pneumoniae, such as amoxicillin or levofloxacin) to carry with them. They should be told to take them if fever or chills develop and they cannot see a physician within 2 hours.2
Daily antibiotic prophylaxis with penicillin is typically given to patients younger than age 5, as studies have shown benefit in reducing pneumococcal sepsis. In adults, some experts recommend daily antibiotic prophylaxis for 1 year after splenectomy.2 However, there is a lack of data and expert consensus to recommend lifelong daily antibiotic prophylaxis for all asplenic patients. Thus, it is not recommended in adults unless the patient is immunocompromised or is a survivor of pneumococcal sepsis.4
KEY POINTS
- In an asplenic patient, fever can be an early sign of sepsis, which can have a rapid and fulminant course.
- Asplenic patients are particularly susceptible to infection by encapsulated organisms such as S pneumoniae, H influenzae, N meningitidis, and C canimorsus due to impaired immunity.
- If an asplenic patient has been exposed to a dog bite, scratch, or saliva, one should suspect C canimorsus.
- Asplenic patients who present with fever should be treated immediately with intravenous vancomycin and ceftriaxone without delay for laboratory tests or imaging.
- To help prevent fulminant sepsis, asplenic patients should receive vaccines (pneumococcal, meningococcal, and H influenzae type b) as well as a prescription for antibiotics (levofloxacin) to be used if they develop fever and cannot see a physician within 2 hours.
- Brigden ML. Detection, education and management of the asplenic or hyposplenic patient. Am Fam Physician 2001; 63:499–508.
- Rubin LG, Schaffner W. Clinical practice. Care of the asplenic patient. N Engl J Med 2014; 371:349–356.
- Di Sabatino A, Carsetti R, Corazza GR. Post-splenectomy and hyposplenic states. Lancet 2011; 378:86–97.
- Brigden ML, Pattullo AL. Prevention and management of overwhelming postsplenectomy infection—an update. Crit Care Med 1999; 27:836–842.
- Lynch AM, Kapila R. Overwhelming postsplenectomy infection. Infect Dis Clin North Am 1996; 10:693–707.
- Kuchar E, Miskiewicz K, Karlikowska M. A review of guidance on immunization in persons with defective or deficient splenic function. Br J Haematol 2015; 171:683–694.
- Le Moal G, Landron C, Grollier G, Robert R, Burucoa C. Meningitis due to Capnocytophaga canimorsus after receipt of a dog bite: case report and review of the literature. Clin Infect Dis 2003; 36:e42–e46.
- Lion C, Escande F, Burdin JC. Capnocytophaga canimorsus infections in human: review of the literature and cases report. Eur J Epidemiol 1996; 12:521–533.
- Butler T. Capnocytophaga canimorsus: an emerging cause of sepsis, meningitis, and post-splenectomy infection after dog bites. Eur J Clin Microbiol Infect Dis 2015; 34:1271–1280.
- Pers C, Gahrn-Hansen B, Frederiksen W. Capnocytophaga canimorsus septicemia in Denmark, 1982-1995: review of 39 cases. Clin Infect Dis 1996; 23:71–75.
- Chiappa V, Chang CY, Sellas MI, Pierce VM, Kradin RL. Case records of the Massachusetts General Hospital. Case 10-2014. A 45-year-old man with a rash. N Engl J Med 2014; 370:1238–1248.
- Martone WJ, Zuehl RW, Minson GE, Scheld WM. Postsplenectomy sepsis with DF-2: report of a case with isolation of the organism from the patient’s dog. Ann Intern Med 1980; 93:457–458.
- Centers for Disease Control and Prevention (CDC). Asplenia and adult vaccination. www.cdc.gov/vaccines/adults/rec-vac/health-conditions/asplenia.html. Accessed January 6, 2017.
- Rubin LG, Levin MJ, Ljungman P, et al; Infectious Diseases Society of America. 2013 IDSA clinical practice guideline for vaccination of the immunocompromised host. Clin Infect Dis 2014; 58:309–318.
A previously healthy 59-year-old woman with a remote history of splenectomy following a motor vehicle accident presented to the emergency department with a chief complaint of fever. She had been in her usual state of health until the day before, when she developed chills and fever, with temperatures as high as 39.4°C (102.9°F). She also began to have nausea, vomiting, and diffuse body weakness and had to be brought to the emergency department in a wheelchair. She denied upper-respiratory or urinary symptoms, headache, stiff neck, recent travel, or sick contacts.
She had sustained a minor dog bite on her right hand 2 days before, but she denied swelling, erythema, or exudate. The dog, a family pet, was up to date on all of its vaccinations, including rabies.
Her temperature was 39.3°C (102.7°F), heart rate 121 beats per minute, and blood pressure 113/71 mm Hg. She had a clean, nonerythematous, healing, 1-cm laceration on her right thumb (Figure 1).
Initial laboratory values (Table 1) and a radiograph of her right thumb were unremarkable.
FEVER IN ASPLENIC PATIENTS
1. What is the appropriate next step in this patient’s management?
- Discharge her from the emergency department and have her follow up with her primary care physician within 48 hours
- Admit her for observation and defer antibiotic therapy
- Admit her and start empiric antibiotic therapy
- Admit but wait for culture results to come back before starting antibiotic therapy
The patient’s history of splenectomy and presentation with fever raise the concern that she may be going into sepsis. In addition to fever, patients with sepsis may present with flulike symptoms such as myalgias, headache, vomiting, diarrhea, and abdominal pain.1
Sepsis in asplenic patients, also known as overwhelming postsplenectomy infection, can have a sudden onset and fulminant course, with a mortality rate as high as 50%.2 It is important to recognize those who are susceptible, including patients without a spleen from splenectomy or congenital asplenia, as well as those with functional asplenia from diseases such as sickle cell disease. Without the spleen, the immune system cannot clear immunoglobulin G-coated bacteria and encapsulated bacteria that are not opsonized by antibodies or complement.3
Any asplenic patient presenting with fever or other symptoms of systemic infection warrants immediate antibiotic treatment, without delay for cultures or further testing.1
CASE CONTINUED: RAPID DETERIORATION
With no clear source of infection, the patient’s clinical presentation was presumed to be due to a viral infection, and antibiotics were deferred. She was admitted to the hospital for observation.
By the next morning, her mental status had declined. Her temperature at that time was 39.6°C (103.2°F), heart rate 115 per minute, and blood pressure 113/74 mm Hg. Her skin became mottled, and her lactate level increased from 1.9 mmol/L to 4.9 mmol/L (reference range 0.5–1.9 mmol/L) within 9 hours and continued to climb (Table 2).
EMPIRIC ANTIBIOTICS IN ASPLENIC SEPSIS
2. Which first-line antibiotics should have been started on initial presentation?
- Intravenous vancomycin and intravenous ceftriaxone
- Intravenous vancomycin and intravenous metronidazole
- Oral levofloxacin
- Oral amoxicillin
At initial presentation to the hospital, the most appropriate regimen for this patient would have been vancomycin and ceftriaxone or cefepime in meningitis-level (ie, high) doses.2,4
Due to impaired immunity, asplenic patients are highly susceptible to encapsulated gram-positive organisms such as Streptococcus pneumoniae and gram-negative organisms such as Haemophilus influenzae, Neisseria meningitidis, and Capnocytophaga canimorsus. These organisms are all susceptible to ceftriaxone, with the exception of methicillin-resistant S pneumoniae, which is best covered with vancomycin.1 Patients with beta-lactam hypersensitivity can be treated with moxifloxacin instead.4,5
Vancomycin and metronidazole alone would not be adequate. Oral levofloxacin or amoxicillin would be appropriate initial treatment if the patient did not have access to a hospital within 2 hours. Ideally, the patient would have had one of these medications on hand and taken it at the first sign of fever.4
CASE CONTINUED: TRANSFER TO ICU
The patient was empirically started on vancomycin and ceftriaxone and transferred to the intensive care unit. She required intubation for airway protection. She became hypotensive despite receiving intravenous fluids and multiple vasopressors. She continued to rapidly decline and developed lactic acidosis, which resulted in a severe anion gap metabolic acidosis with respiratory compensation. Her course was further complicated by disseminated intravascular coagulation, acute kidney failure, and ischemic hepatitis (“shock liver”) (Table 2).
CAUSES OF SEPSIS IN ASPLENIC PATIENTS
3. The patient’s septic shock is likely the result of which bacterial pathogen?
- S pneumoniae
- H influenzae
- C canimorsus
- N meningitidis
Encapsulated organisms including S pneumoniae, H influenzae, and N meningitidis account for almost 70% of infections in postsplenectomy patients, including those with overwhelming postsplenectomy infection.6S pneumoniae is the most common culprit. However, the patient’s history of a recent dog bite suggests that the most likely cause was C canimorsus.
C canimorsus is a gram-negative bacillus commonly associated with exposure to dogs or cats through saliva, scratches, or bites.7,8 Even a seemingly small, benign-appearing wound, as seen in this case, can be a portal of entry for this organism. About 84 cases leading to fulminant sepsis were reported in the United States from 1990 to 2014.9 Patients infected with this organism can progress to fulminant sepsis with multiorgan failure with disseminated intravascular coagulation, anuria, and hypotension.10–12
CASE CONCLUDED
The patient died 40 hours after admission. Her blood cultures grew a slow-growing gram-negative rod within 2 days, subsequently identified as C canimorsus.
4. What is the best strategy for prevention of sepsis in an asplenic patient?
- Vaccinate against S pneumoniae (with PCV13 and PPSV23), H influenzae type b, and N meningitidis
- Prescribe antibiotics that the patient can take in case of fever
- Both of the above
- Prescribe lifelong daily antibiotic prophylaxis
- All of the above
Asplenic patients should receive pneumococcal, H influenzae type b, and meningococcal vaccines.13 Invasive bacterial infections, particularly with encapsulated organisms, occur 10 to 50 times more often in this population than in a healthy population and can be fatal.13 These vaccines have been shown to reduce the rate of life-threatening infections. Patients should receive the vaccines at least 2 weeks before an elective splenectomy or 2 weeks after a nonelective splenectomy.2
For the pneumococcal vaccines, PCV13 should be given first, followed by PPSV23 at least 8 weeks later. If the patient has already received PCV13, PPSV23 should be given at least 2 weeks after splenectomy. A second dose of PPSV23 should be given 5 years later.
The H influenzae type b vaccine should be administered if not already given.
For the meningococcal vaccine, the two-dose series should be administered with an interval of 8 to 12 weeks between doses. A booster meningococcal dose should be given every 5 years.
The patient should also receive the flu vaccine annually.2,14
Patients should also be given antibiotics (typically an antibiotic with activity against S pneumoniae, such as amoxicillin or levofloxacin) to carry with them. They should be told to take them if fever or chills develop and they cannot see a physician within 2 hours.2
Daily antibiotic prophylaxis with penicillin is typically given to patients younger than age 5, as studies have shown benefit in reducing pneumococcal sepsis. In adults, some experts recommend daily antibiotic prophylaxis for 1 year after splenectomy.2 However, there is a lack of data and expert consensus to recommend lifelong daily antibiotic prophylaxis for all asplenic patients. Thus, it is not recommended in adults unless the patient is immunocompromised or is a survivor of pneumococcal sepsis.4
KEY POINTS
- In an asplenic patient, fever can be an early sign of sepsis, which can have a rapid and fulminant course.
- Asplenic patients are particularly susceptible to infection by encapsulated organisms such as S pneumoniae, H influenzae, N meningitidis, and C canimorsus due to impaired immunity.
- If an asplenic patient has been exposed to a dog bite, scratch, or saliva, one should suspect C canimorsus.
- Asplenic patients who present with fever should be treated immediately with intravenous vancomycin and ceftriaxone without delay for laboratory tests or imaging.
- To help prevent fulminant sepsis, asplenic patients should receive vaccines (pneumococcal, meningococcal, and H influenzae type b) as well as a prescription for antibiotics (levofloxacin) to be used if they develop fever and cannot see a physician within 2 hours.
- Brigden ML. Detection, education and management of the asplenic or hyposplenic patient. Am Fam Physician 2001; 63:499–508.
- Rubin LG, Schaffner W. Clinical practice. Care of the asplenic patient. N Engl J Med 2014; 371:349–356.
- Di Sabatino A, Carsetti R, Corazza GR. Post-splenectomy and hyposplenic states. Lancet 2011; 378:86–97.
- Brigden ML, Pattullo AL. Prevention and management of overwhelming postsplenectomy infection—an update. Crit Care Med 1999; 27:836–842.
- Lynch AM, Kapila R. Overwhelming postsplenectomy infection. Infect Dis Clin North Am 1996; 10:693–707.
- Kuchar E, Miskiewicz K, Karlikowska M. A review of guidance on immunization in persons with defective or deficient splenic function. Br J Haematol 2015; 171:683–694.
- Le Moal G, Landron C, Grollier G, Robert R, Burucoa C. Meningitis due to Capnocytophaga canimorsus after receipt of a dog bite: case report and review of the literature. Clin Infect Dis 2003; 36:e42–e46.
- Lion C, Escande F, Burdin JC. Capnocytophaga canimorsus infections in human: review of the literature and cases report. Eur J Epidemiol 1996; 12:521–533.
- Butler T. Capnocytophaga canimorsus: an emerging cause of sepsis, meningitis, and post-splenectomy infection after dog bites. Eur J Clin Microbiol Infect Dis 2015; 34:1271–1280.
- Pers C, Gahrn-Hansen B, Frederiksen W. Capnocytophaga canimorsus septicemia in Denmark, 1982-1995: review of 39 cases. Clin Infect Dis 1996; 23:71–75.
- Chiappa V, Chang CY, Sellas MI, Pierce VM, Kradin RL. Case records of the Massachusetts General Hospital. Case 10-2014. A 45-year-old man with a rash. N Engl J Med 2014; 370:1238–1248.
- Martone WJ, Zuehl RW, Minson GE, Scheld WM. Postsplenectomy sepsis with DF-2: report of a case with isolation of the organism from the patient’s dog. Ann Intern Med 1980; 93:457–458.
- Centers for Disease Control and Prevention (CDC). Asplenia and adult vaccination. www.cdc.gov/vaccines/adults/rec-vac/health-conditions/asplenia.html. Accessed January 6, 2017.
- Rubin LG, Levin MJ, Ljungman P, et al; Infectious Diseases Society of America. 2013 IDSA clinical practice guideline for vaccination of the immunocompromised host. Clin Infect Dis 2014; 58:309–318.

A patient with altered mental status and an acid-base disturbance
A 78-year-old black woman with a history of osteoarthrosis and chronic diffuse joint pain presents with altered mental status and tachypnea, which began 3 hours earlier. She lives alone, and her family suspects she abuses both alcohol and her pain medications. She has not been eating well and has lost approximately 10 pounds over the past 3 months. Her analgesic regimen includes acetaminophen and acetaminophen-oxycodone.
In the emergency department her temperature is 98.6°F (37.0°C), pulse 100 beats per minute and regular, respiratory rate 22 per minute, and blood pressure 136/98 mm Hg. She is obtunded but has no focal neurologic defects or meningismus. She has no signs of heart failure (jugular venous distention, cardiomegaly, or gallops), and examination of the lungs and abdomen is unremarkable.

Suspecting that the patient may have taken too much oxycodone, the physician gives her naloxone, but her mental status does not improve. Results of chest radiography and cranial computed tomography are unremarkable. The physician’s initial impression is that the patient has “metabolic encephalopathy of unknown etiology.”
The patient’s laboratory values are shown in Table 1.
WHICH ACID-BASE DISORDER DOES SHE HAVE?
1. Which acid-base disorder does this patient have?
- Metabolic acidosis and respiratory alkalosis
- Metabolic acidosis and respiratory acidosis
- Metabolic acidosis with an elevated anion gap
- A triple disturbance: metabolic acidosis, respiratory acidosis, and metabolic alkalosis
A 5-step approach
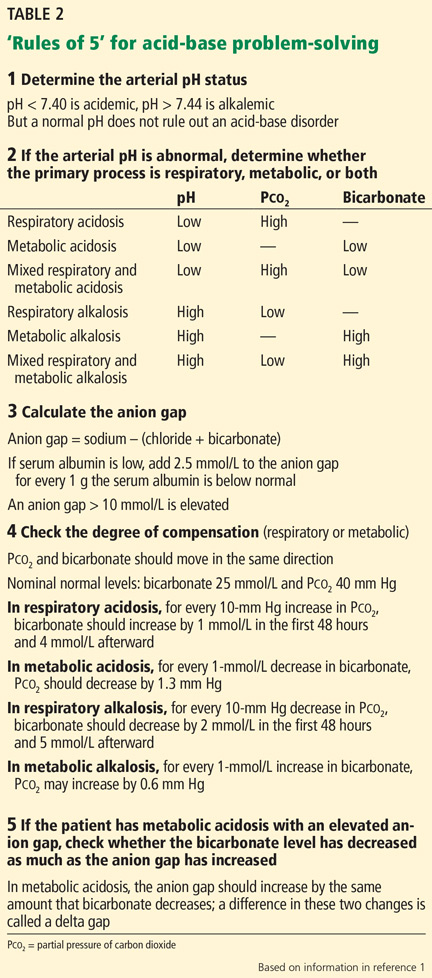
Acid-base disorders can be diagnosed and characterized using a systematic approach known as the “Rules of 5” (Table 2)1:
1. Determine the arterial pH status.
2. Determine whether the primary process is respiratory, metabolic, or both.
3. Calculate the anion gap.
4. Check the degree of compensation (respiratory or metabolic).
5. If the patient has metabolic acidosis with an elevated anion gap, check whether the bicarbonate level has decreased as much as the anion gap has increased (ie, whether there is a delta gap).
Let us apply this approach to the patient described above.
1. What is her pH status?
An arterial pH less than 7.40 is acidemic, whereas a pH higher than 7.44 is alkalemic. (Acidemia and alkalemia refer to the abnormal laboratory value, while acidosis and alkalosis refer to the process causing the abnormal value—a subtle distinction, but worth keeping in mind.)
Caveat. A patient may have a significant acid-base disorder even if the pH is normal. Therefore, even if the pH is normal, one should verify that the partial pressure of carbon dioxide (Pco2), bicarbonate level, and anion gap are normal. If they are not, the patient may have a mixed acid-base disorder such as respiratory acidosis superimposed on metabolic alkalosis.
Our patient’s pH is 7.25, which is in the acidemic range.
2. Is her acidosis respiratory, metabolic, or both?
Respiratory acidosis and alkalosis affect the Pco2. The Pco2 is high in respiratory acidosis (due to failure to get rid of excess carbon dioxide), whereas it is low in respiratory alkalosis (due to loss of too much carbon dioxide through hyperventilation).
Metabolic acidosis and alkalosis, on the other hand, affect the serum bicarbonate level. In metabolic acidosis the bicarbonate level is low, whereas in metabolic alkalosis the bicarbonate level is high.
Moreover, in mixed respiratory and metabolic acidosis, the bicarbonate level can be low and the Pco2 can be high. In mixed metabolic and respiratory alkalosis, the bicarbonate level can be high and the Pco2 can be low (Table 2).
Our patient’s serum bicarbonate level is low at 16.0 mmol/L, indicating that the process is metabolic. Her Pco2 is also low (28 mm Hg), which reflects an appropriate response to compensate for the acidosis.
3. What is her anion gap?
Always calculate the anion gap, ie, the serum sodium concentration minus the serum chloride and serum bicarbonate concentrations. If the patient’s serum albumin level is low, for every 1 gram it is below normal, an additional 2.5 mmol/L should be added to the calculated anion gap. We consider an anion gap of 10 mmol/L or less as normal.
Caveats. The blood sample used to calculate the anion gap should be drawn close in time to the arterial blood gas sample.
Although the anion gap is an effective tool in assessing acid-base disorders, further investigation is warranted if clinical judgment suggests that an anion gap calculation is inconsistent with the patient’s circumstances.2
Our patient’s anion gap is elevated (21 mmol/L). Her serum albumin level is in the normal range, so her anion gap does not need to be adjusted.
4. Is the degree of compensation appropriate for the primary acid-base disturbance?
The kidneys compensate for the lungs, and vice versa. That is, in respiratory acidosis or alkalosis, the kidneys adjust the bicarbonate levels, and in metabolic acidosis, the lungs adjust the Pco2 (although in metabolic alkalosis, it is hard for patients to breathe less, especially if they are already hypoxic).
In metabolic acidosis, people compensate by breathing harder to get rid of more carbon dioxide. For every 1-mmol/L decrease in the bicarbonate level, the Pco2 should decrease by 1.3 mm Hg.
Compensation does not return pH to normal; rather, it mitigates the impact of an acid or alkali excess or deficit. If the pH is normalized with an underlying acid-base disturbance, there may be mixed acid-base processes rather than compensation.
Our patient’s bicarbonate level is 16 mmol/L, which is 9 mmol/L lower than normal (for acid-base calculations, we use 25 mmol/L as the nominal normal level). If she is compensating appropriately, her Pco2 should decline from 40 mm Hg (the nominal normal level) by about 11.7 mm Hg (9 × 1.3), to approximately 28.3 mm Hg. Her Pco2 is, indeed, 28 mm Hg, indicating that she is compensating adequately for her metabolic acidosis.
If we use Winter’s formula instead (Pco2 = [1.5 × the bicarbonate level] + 8 ± 2),3 the lowest calculated Pco2 would be 30 mm Hg, which is within 2 mm Hg of the Rules of 5 calculation. Other formulas for calculating compensation are available.3
This information rules out the first two answers to question 1, ie, metabolic acidosis with respiratory alkalosis or acidosis.
5. Is there a delta gap?
Although we know the patient has metabolic acidosis with an elevated anion gap, we have not ruled out the possibility that she may have a triple disturbance. For this reason we need to check her delta gap.
In metabolic acidosis with an elevated anion gap, as the bicarbonate level decreases, the anion gap should increase by the same amount. If the bicarbonate level decreases more than the anion gap increases, the additional decline is the result of a second process—an additional normal-anion-gap acidosis. If the bicarbonate level does not decrease as much as the anion gap increases, there is an additional metabolic alkalosis.
Our patient’s bicarbonate level decreased 9 mmol/L (from the nominal normal level of 25 to 16), and therefore her anion gap should have increased approximately the same amount—and it did. (A normal anion gap for problem-solving is 10, and this patient’s anion gap has increased to 21. A difference of ± 2 is insignificant.) This conclusion verifies that a triple acid-base disturbance is not present, so the last answer is incorrect.
So, the correct answer to the question posed above is metabolic acidosis with an elevated anion gap (that is, metabolic acidosis with appropriate respiratory compensation).
‘MUD PILES’: FINDING THE CAUSE OF ANION GAP METABOLIC ACIDOSIS

The possible causes of metabolic acidosis with an elevated anion gap (as in our patient) can be summarized in the mnemonic MUD PILES (methanol, uremia, diabetes, paraldehyde, isoniazid, lactate, ethylene glycol, and salicylates), which has been used for many years. Parts of it are no longer useful, but rather than discard it, we propose to update it (Table 3).
Methanol and ethylene glycol
We will address toxic ingestion of methanol and ethylene glycol (the “M” and “E” of MUD PILES) at the same time.

In cases of suspected ingestion of toxic substances such as these, it is useful to examine the osmol gap, ie, the difference between the calculated and the measured serum osmolality. Serum osmolality (in mOsm/kg) is calculated as the sodium concentration in mmol/L times 2, plus the glucose concentration in mg/dL divided by 18, plus the blood urea nitrogen concentration in mg/dL divided by 2.8 (Table 4). If the measured osmolality is higher than this calculated value, the difference may be due to solutes in the blood that should not be there such as ethylene glycol, diethylene glycol, methanol, and their many metabolic products.
In our patient, ingestion of both methanol and ethylene glycol should be considered, since she lives alone and has been suspected of alcohol and opioid abuse. Her calculated osmol gap is 278 mOsm/kg. Her measured osmolality is 318 mOsm/kg (Table 1). The osmol gap is 40 mOsm/kg (normal is ≤ 10).4,5 Therefore, her osmol gap is elevated.
Identifying the specific substance the patient ingested that caused metabolic acidosis with anion gap may be difficult. Poisonings with these agents do not always increase the osmol gap.6 A high index of suspicion is essential. It is helpful to have the family search for any sources of ethylene glycol and methanol at home and initiate treatment early if an ingestion is suspected, using fomepizole (an alcohol dehydrogenase inhibitor) or parenteral ethanol and hemodialysis.7 Liquid chromatography identifies these two toxins, but results are not available emergently.
Diethylene glycol ingestion should also be considered.8 Since it is diagnosed and treated like ethylene glycol intoxication, it can be placed with the “E” of (di)ethylene glycol in the mnemonic.
Uremia
Renal failure can lead to metabolic acidosis.9 Our patient has no history of kidney disease, but her blood urea nitrogen and creatinine concentrations are above normal, and her estimated glomerular filtration rate by the Modification of Diet in Renal Disease formula is 48 mL/min/1.73 m2—low, but not uremic.
Rhabdomyolysis (suspected by elevated creatine kinase values) should be considered in any patient with mental status changes, suspected toxic ingestion, and metabolic acidosis (see the “I” in MUD PILES below). Compartment syndromes with muscle necrosis may present in a subtle fashion. Therefore, renal failure from rhabdomyolysis may complicate this patient’s course later, and should be kept in mind.
Diabetes
The patient has no history of diabetes and has a normal blood glucose level. Blood testing did not reveal ketones. She is not taking metformin (alleged to cause lactic acidosis) or a sodium-glucose cotransporter 2 inhibitor (which have been associated with ketoacidosis).10
There is another, less common cause of ketoacidosis: alcohol.11 Although alcoholism is common, alcoholic ketoacidosis is uncommon, even in heavy drinkers. Ethyl alcohol causing metabolic acidosis is similar to metabolic acidosis with (di)ethylene glycol and methanol, and if suspected it should be treated empirically (first with thiamine, then dextrose and saline, and correcting other electrolyte disturbances such as hypokalemia and hypomagnesemia) before specific identification is made. Ketones (predominantly beta-hydroxybutyrate) may persist up to 2 weeks after alcohol ingestion has stopped.11 Ketosis in the setting of alcoholic ketoacidosis is frequently accompanied by other markers of alcohol target organ injury: elevated bilirubin, aspartate aminotransferase, alanine aminotransferase, and gamma-glutamyl transferase levels. The term “ketohepatitis” has been suggested as an alternative to alcoholic ketosis.11
This patient did not have an elevated blood ethanol level, and her liver markers were otherwise normal.
THE NEW MUD PILES
2. Which of the following is (are) true? Regarding the remaining letters of the MUD PILES mnemonic:
- The “P” (paraldehyde) has been replaced by pyroglutamic acid (5-oxoproline) and propylene glycol.
- There are two isomers of lactate (dextro and levo), and consequently two clinical varieties of lactic acidosis.
- Isoniazid is no longer associated with metabolic acidosis with elevated anion gap.
- Salicylates can paradoxically be associated both with elevated and low anion gaps.
Isoniazid is still associated with metabolic acidosis with elevated anion gap, and so the third answer choice is false; the rest are true.
Paraldehyde, isoniazid, lactate
The “P,” “I,” and “L” (d-lactate) of the revamped MUD PILES acronym are less common than the others. They should be considered when the more typical causes of metabolic acidosis are not present, as in this patient.
UPDATING THE ‘P’ IN MUD PILES
Paraldehyde is rarely prescribed anymore. A PubMed search on December 21, 2015 applying the terms paraldehyde and metabolic acidosis yielded 17 results. Those specific to anion gap metabolic acidosis were from 1957 to 1986 (n = 9).12–20
Therefore, we can eliminate paraldehyde from the MUD PILES mnemonic and replace it with pyroglutamic acid and propylene glycol.
5-Oxoproline or pyroglutamic acid, a metabolite of acetaminophen
Acetaminophen depletes glutathione stores in acute overdoses, in patients with inborn errors of metabolism, and after chronic ingestion of excessive, frequent doses. Depletion of glutathione increases metabolic products, including pyroglutamic acid, which dissociates into hydrogen ions (leading to metabolic acidosis and an anion gap), and 5-oxoproline, (which can be detected in the urine).21,22
Risk factors for metabolic acidosis with acetaminophen ingestion include malnutrition, chronic alcoholism, liver disease, and female sex. In fact, most cases have been reported in females, and altered mental status has been common.
Metabolic acidosis with pyroglutamic acid can occur without elevated acetaminophen levels. Serum and urine levels of pyroglutamic acid may assist with diagnosis. Since identification of urine pyroglutamic acid usually requires outside laboratory assistance, a clinical diagnosis is often made initially and corroborated later by laboratory results. When the anion gap metabolic acidosis is multifactorial, as it was suspected to be in a case reported by Tan et al,23 the osmol gap may be elevated as a consequence of additional toxic ingestions, as it was in the reported patient.
No controlled studies of treatment have been done. n-Acetylcysteine may be of benefit. Occasional patients have been dialyzed for removal of excess pyroglutamic acid.
Propylene glycol, a component of parenteral lorazepam
Lorazepam is a hydrophobic drug, so when it is given parenterally, it must be mixed with a suitable solvent. A typical formulation adds propylene glycol. In patients receiving high doses of lorazepam as relaxation therapy for acute respiratory distress syndrome in the intensive care unit, or as treatment of alcohol withdrawal, the propylene glycol component can precipitate anion gap metabolic acidosis.24,25
Although nearly one-half of the administered propylene glycol is excreted by the kidneys, the remaining substrate is metabolized by alcohol dehydrogenase into d,l-lactaldehyde, then converted into d- or l-lactate. l-Lactate can be metabolized, but d-lactate cannot and leads to anion gap metabolic acidosis. This is another toxic metabolic acidosis associated with an elevated osmol gap. An increasing osmol gap in the intensive care unit can serve as a surrogate marker of excessive propylene glycol administration.23
Isoniazid
Although it is uncommon, there are reports of isoniazid-induced anion gap metabolic acidosis,26 either due to overdoses, or less commonly, with normal dosing. Isoniazid should therefore remain in the mnemonic MUD PILES and may be suspected when metabolic acidosis is accompanied by seizures unresponsive to usual therapy. The seizures respond to pyridoxine.
The “I” should also be augmented by newer causes of metabolic acidosis associated with “ingestions.” Ecstasy, or 3,4-methylenedioxymethamphetamine, can cause metabolic acidosis and seizures. Ecstasy has been associated with rhabdomyolysis and uremia, also leading to anion gap metabolic acidosis.27 A newer class of abused substances, synthetic cathinones (“bath salts”), are associated with metabolic acidosis, compartment syndrome, and renal failure.28
Lactic acidosis
Lactic acidosis and metabolic acidosis can result from hypoperfusion (type A) or other causes (type B). Not all lactic acidosis is contingent on l-lactate, which humans can metabolize. Metabolic acidosis may be a consequence of d-lactate (mammals have no d-lactate dehydrogenase). d-Lactic acidosis as a result of short bowel syndrome has been known for more than a generation.29 However, d-lactic acidosis occurs in another new setting. The new “P” in MUD PILES, propylene glycol, can generate substantial amounts of d-lactate.29
d-lactic metabolic acidosis is always accompanied by neurologic manifestations (slurred speech, confusion, somnolence, ataxia, abusive behavior, and others).30 With short bowel syndrome, the neurologic manifestations occur after eating and clear later.30
Although our patient’s anion gap is more than 20 mmol/L, her blood level of lactate is not elevated, and she had no history to suggest short-bowel syndrome.
Salicylates
Salicylate overdose can cause a mixed acid-base disorder: metabolic acidosis with elevated anion gap and respiratory alkalosis.
Although our patient does not have respiratory alkalosis, an aspirin overdose must be considered. A salicylate level was ordered; it was negative.
Despite the typical association of salicylates with an elevated anion gap, they may also cause a negative anion gap.31 Chloride-sensing ion-specific electrodes contain a membrane permeable to chloride. Salicylates can increase the chloride permeability of these membranes, generating pseudohyperchloremia, and consequently, a negative anion gap.
WHAT ELSE MUST BE CONSIDERED?
3. In view of her anion gap metabolic acidosis, elevated osmol gap, and absence of diabetes, renal failure, or lactate excess, what are the remaining diagnoses to consider in this patient? (Choose all that are potential sources of metabolic acidosis and an increased anion gap.)
- Methanol, ethylene, or diethylene glycol
- Excessive, chronic acetaminophen ingestion
- Salicylate toxicity
- Alcoholic ketoacidosis
All of the above can potentially contribute to metabolic acidosis.
A search of the patient’s home did not reveal a source of methanol or either ethylene or diethylene glycol. Similarly, no aspirin was found, and the patient’s salicylate levels were not elevated. The patient’s laboratory work did not reveal increased ketones.
Since none of the common causes of metabolic acidosis were discovered, and since the patient had been taking acetaminophen, the diagnosis of excessive chronic acetaminophen ingestion was suspected pending laboratory verification. Identification of 5-oxoproline in the urine may take a week or more since the sample is usually sent to special laboratories. Acetaminophen levels in this patient were significantly elevated, as were urinary oxyproline levels, which returned later.
The patient was diagnosed with pyroglutamic acid metabolic acidosis. She was treated supportively and with n-acetylcysteine intravenously, although there have been no controlled studies of the efficacy of this drug. Seventy-two hours after admission, she had improved. Her acid-base status returned to normal.
GOLD MARK: ANOTHER WAY TO REMEMBER
Another mnemonic device for remembering the causes of metabolic acidosis with elevated anion gap is “GOLD MARK”: glycols (ethylene and propylene), oxoproline (instead of pyroglutamic acid from acetaminophen), l-lactate, d-lactate, methanol, aspirin, renal failure, and ketoacidosis).32
ACID-BASE DISORDERS IN DIFFERENT DISEASES
Diverse diseases cause distinctive acid-base abnormalities. Matching the appropriate acid-base abnormality with its associated disease may lead to more timely diagnosis and treatment:
Type 2 diabetes mellitus, for example, can lead to lactic acidosis, ketoacidosis, or type 4 renal tubular acidosis.33
Heart failure, although not typically framed in the context of acid-base physiology, can lead to elevated lactate, which is associated with a worse prognosis.34
Acquired immunodeficiency syndrome. Abacavir can cause normal anion gap metabolic acidosis.35,36
Cancer37,38 can be associated with proximal tubular renal tubular acidosis and lactic acidosis.
An expanding array of toxic ingestions
Metabolic acidosis may be the most prominent and potentially lethal clinical acid-base disturbance. When metabolic acidosis occurs in certain disease states—lactic acidosis with hypoperfusion or methanol ingestion with metabolic acidosis, for example—there is increased morbidity and mortality.
As reflected in the revisions to MUD PILES and in the newer GOLD MARK acronym, the osmol gap has become more valuable in differential diagnosis of metabolic acidosis with an elevated anion gap consequent to an expanding array of toxic ingestions (methanol, propylene glycol, pyroglutamic acid-oxoproline, ethylene glycol, and diethylene glycol), which may accompany pyroglutamic acid-oxoproline.
- Whittier WL, Rutecki GW. Primer on clinical acid-base problem solving. Dis Mon 2004; 50:122–162.
- Kraut JA, Madias NE. Serum anion gap: its uses and limitations in clinical medicine. Clin J Am Soc Nephrol 2007; 2:162–174.
- Adrogué HJ, Madias NE. Secondary responses to altered acid-base status: the rules of engagement. J Am Soc Nephrol 2010; 21:920–923.
- Krasowski MD, Wilcoxon RM, Miron J. A retrospective analysis of glycol and toxic alcohol ingestion: utility of anion and osmolal gaps. BMC Clin Pathol 2012;12:1.
- Latus J, Kimmel M, Alscher MD, Braun N. Ethylene glycol poisoning: a rare but life-threatening cause of metabolic acidosis—a single-centre experience. Clin Kidney J 2012; 5:120–123.
- Kraut JA. Diagnosis of toxic alcohols: limitations of present methods. Clin Toxicol (Phila) 2015; 53:589–595.
- Ghannoum M, Hoffman RS, Mowry JB, Lavergne V. Trends in toxic alcohol exposures in the United States from 2000 to 2013: a focus on the use of antidotes and extracorporeal treatments. Semin Dial 2014; 27:395–401.
- Schep LJ, Slaughter RJ, Temple WA, Beasley DM. Diethylene glycol poisoning. Clin Toxicol (Phila) 2009; 47:525–535.
- Kraut JA, Madias NE. Metabolic acidosis of CKD: an update. Am J Kidney Dis 2016; 67:307–317.
- Taylor SI, Blau JE, Rother KI. SGLT2 inhibitors may predispose to ketoacidosis. J Clin Endocrinol Metab 2015; 100:2849–2852.
- Yokoyama A, Yokoyama T, Mizukami T, et al. Alcoholic ketosis: prevalence, determinants, and ketohepatitis in Japanese alcoholic men. Alcohol Alcohol 2014; 49:618–625.
- Hayward JN, Boshell BR. Paraldehyde intoxication with metabolic acidosis; report of two cases, experimental data and a critical review of the literature. Am J Med 1957; 23:965–976.
- Elkinton JR, Huth EJ, Clark JK, Barker ES, Seligson D. Renal tubular acidosis with organic aciduria during paraldehyde ingestion; six year study of an unusual case. Am J Med 1957; 23:977–986.
- Waterhouse C, Stern EA. Metabolic acidosis occurring during administration of paraldehyde. Am J Med 1957; 23:987–989.
- Beier LS, Pitts WH, Gonick HC. Metabolic acidosis occurring during paraldehyde intoxication. Ann Intern Med 1963; 58:155–158.
- Hiemcke T. Metabolic acidosis due to paraldehyde. Ned Tijdschr Geneeskd 1964; 108:2165–2167. Dutch.
- Gailitis RJ. Paraldehyde acidosis syndrome. IMJ III Med J 1966; 129:258–262.
- Gutman RA, Burnell JM. Paraldehyde acidosis. Am J Med 1967; 42:435–440.
- Hadden JW, Metzner RJ. Pseudoketosis and hyperacetaldehydemia in paraldehyde acidosis. Am J Med 1969; 47:642–647.
- Linter CM, Linter SP. Severe lactic acidosis following paraldehyde administration. Br J Psychiatry 1986; 149:650–651.
- Zand L, Muriithi A, Nelsen E, et al. Severe anion gap metabolic acidosis from acetaminophen use secondary to 5-oxoproline (pyroglutamic acid) accumulation. Am J Med Sci 2012; 344:501–504.
- Abkur TM, Mohammed W, Ali M, Casserly L. Acetaminophen-induced anion gap metabolic acidosis secondary to 5-oxoproline: a case report. J Med Case Rep 2014; 8:409.
- Tan EM, Kalimullah E, Sohail MR, Ramar K. Diagnostic challenge in a patient with severe anion gap metabolic acidosis. Case Rep Crit Care 2015; 2015:272914.
- Jorens PG, Demey HE, Schepens PJ, et al. Unusual d-lactic acid acidosis from propylene glycol metabolism in overdose. J Toxicol Clin Toxicol 2004; 42:163–169.
- Barnes BJ, Gerst C, Smith JR, Terrell AR, Mullins ME. Osmol gap as a surrogate marker for serum propylene glycol concentrations in patients receiving lorazepam for sedation. Pharmacotherapy 2006; 26:23–33.
- Gokhale YA, Vaidya MS, Mehta AD, Rathod NN. Isoniazid toxicity presenting as status epilepticus and severe metabolic acidosis. J Assoc Physicians India 2009; 57:70–71.
- Ben-Abraham R, Szold O, Rudick V, Weinbroum AA. ‘Ecstasy’ intoxication: life-threatening manifestations and resuscitative measures in the intensive care setting. Eur J Emerg Med 2003; 10:309–313.
- German CL, Fleckenstein AE, Hanson GR. Bath salts and synthetic cathinones: an emerging designer drug phenomenon. Life Sci 2014; 97:2–8.
- Jorens PG, Demey HE, Schepens PJ, et al. Unusual d-lactic acidosis from propylene glycol metabolism in overdose. J Toxicol Clin Toxicol 2004; 42:163–169.
- Kang KP, Le S, Kang SK. d-Lactic acidosis in humans: review and update. Electrolyte Blood Press 2006; 4:53–56.
- Emmett M. Approach to the patient with a negative anion gap. Am J Kidney Dis 2016; 67:143–150.
- Mehta AN, Emmett JB, Emmett M. GOLD MARK: an anion gap mnemonic for the 21st Century. Lancet 2008; 372:892.
- Palmer BF, Clegg DJ. Electrolyte and acid-base disturbances in patients with diabetes mellitus. N Engl J Med 2015; 373:548–559.
- Park JJ, Choi DJ, Yoon CH, et al; KorHF Registry. The prognostic value of arterial blood gas analysis in high-risk acute heart failure patients: an analysis of the Korean Heart Failure (KorHF) registry. Eur J Heart Fail 2015; 17:601–611.
- Musso CG, Belloso WH, Glassock RJ. Water, electrolytes, and acid-base alterations in human immunodeficiency virus infected patients. World J Nephrol 2016; 5:33–42.
- Camara-Lemarroy CR, Flores-Cantu H, Calderon-Hernandez HJ, Diaz-Torres MA, Villareal-Velazquez HJ. Drug-induced haemolysis, renal failure, thrombocytopenia and lactic acidosis in patients with HIV and cryptococcal meningitis: a diagnostic challenge. Int J STD AIDS 2015; 26:1052–1054.
- Miltiadous G, Christidis D, Kalogirou M, Elisaf M. Causes and mechanisms of acid-base and electrolyte abnormalities in cancer. Eur J Intern Med 2008; 19:1–7.
- Vlachostergios PJ, Oikonomou KG, Gibilaro E, Apergis G. Elevated lactic acid is a negative prognostic factor in metastatic lung cancer. Cancer Biomark 2015; 15:725–734.
A 78-year-old black woman with a history of osteoarthrosis and chronic diffuse joint pain presents with altered mental status and tachypnea, which began 3 hours earlier. She lives alone, and her family suspects she abuses both alcohol and her pain medications. She has not been eating well and has lost approximately 10 pounds over the past 3 months. Her analgesic regimen includes acetaminophen and acetaminophen-oxycodone.
In the emergency department her temperature is 98.6°F (37.0°C), pulse 100 beats per minute and regular, respiratory rate 22 per minute, and blood pressure 136/98 mm Hg. She is obtunded but has no focal neurologic defects or meningismus. She has no signs of heart failure (jugular venous distention, cardiomegaly, or gallops), and examination of the lungs and abdomen is unremarkable.
Suspecting that the patient may have taken too much oxycodone, the physician gives her naloxone, but her mental status does not improve. Results of chest radiography and cranial computed tomography are unremarkable. The physician’s initial impression is that the patient has “metabolic encephalopathy of unknown etiology.”
The patient’s laboratory values are shown in Table 1.
WHICH ACID-BASE DISORDER DOES SHE HAVE?
1. Which acid-base disorder does this patient have?
- Metabolic acidosis and respiratory alkalosis
- Metabolic acidosis and respiratory acidosis
- Metabolic acidosis with an elevated anion gap
- A triple disturbance: metabolic acidosis, respiratory acidosis, and metabolic alkalosis
A 5-step approach
Acid-base disorders can be diagnosed and characterized using a systematic approach known as the “Rules of 5” (Table 2)1:
1. Determine the arterial pH status.
2. Determine whether the primary process is respiratory, metabolic, or both.
3. Calculate the anion gap.
4. Check the degree of compensation (respiratory or metabolic).
5. If the patient has metabolic acidosis with an elevated anion gap, check whether the bicarbonate level has decreased as much as the anion gap has increased (ie, whether there is a delta gap).
Let us apply this approach to the patient described above.
1. What is her pH status?
An arterial pH less than 7.40 is acidemic, whereas a pH higher than 7.44 is alkalemic. (Acidemia and alkalemia refer to the abnormal laboratory value, while acidosis and alkalosis refer to the process causing the abnormal value—a subtle distinction, but worth keeping in mind.)
Caveat. A patient may have a significant acid-base disorder even if the pH is normal. Therefore, even if the pH is normal, one should verify that the partial pressure of carbon dioxide (Pco2), bicarbonate level, and anion gap are normal. If they are not, the patient may have a mixed acid-base disorder such as respiratory acidosis superimposed on metabolic alkalosis.
Our patient’s pH is 7.25, which is in the acidemic range.
2. Is her acidosis respiratory, metabolic, or both?
Respiratory acidosis and alkalosis affect the Pco2. The Pco2 is high in respiratory acidosis (due to failure to get rid of excess carbon dioxide), whereas it is low in respiratory alkalosis (due to loss of too much carbon dioxide through hyperventilation).
Metabolic acidosis and alkalosis, on the other hand, affect the serum bicarbonate level. In metabolic acidosis the bicarbonate level is low, whereas in metabolic alkalosis the bicarbonate level is high.
Moreover, in mixed respiratory and metabolic acidosis, the bicarbonate level can be low and the Pco2 can be high. In mixed metabolic and respiratory alkalosis, the bicarbonate level can be high and the Pco2 can be low (Table 2).
Our patient’s serum bicarbonate level is low at 16.0 mmol/L, indicating that the process is metabolic. Her Pco2 is also low (28 mm Hg), which reflects an appropriate response to compensate for the acidosis.
3. What is her anion gap?
Always calculate the anion gap, ie, the serum sodium concentration minus the serum chloride and serum bicarbonate concentrations. If the patient’s serum albumin level is low, for every 1 gram it is below normal, an additional 2.5 mmol/L should be added to the calculated anion gap. We consider an anion gap of 10 mmol/L or less as normal.
Caveats. The blood sample used to calculate the anion gap should be drawn close in time to the arterial blood gas sample.
Although the anion gap is an effective tool in assessing acid-base disorders, further investigation is warranted if clinical judgment suggests that an anion gap calculation is inconsistent with the patient’s circumstances.2
Our patient’s anion gap is elevated (21 mmol/L). Her serum albumin level is in the normal range, so her anion gap does not need to be adjusted.
4. Is the degree of compensation appropriate for the primary acid-base disturbance?
The kidneys compensate for the lungs, and vice versa. That is, in respiratory acidosis or alkalosis, the kidneys adjust the bicarbonate levels, and in metabolic acidosis, the lungs adjust the Pco2 (although in metabolic alkalosis, it is hard for patients to breathe less, especially if they are already hypoxic).
In metabolic acidosis, people compensate by breathing harder to get rid of more carbon dioxide. For every 1-mmol/L decrease in the bicarbonate level, the Pco2 should decrease by 1.3 mm Hg.
Compensation does not return pH to normal; rather, it mitigates the impact of an acid or alkali excess or deficit. If the pH is normalized with an underlying acid-base disturbance, there may be mixed acid-base processes rather than compensation.
Our patient’s bicarbonate level is 16 mmol/L, which is 9 mmol/L lower than normal (for acid-base calculations, we use 25 mmol/L as the nominal normal level). If she is compensating appropriately, her Pco2 should decline from 40 mm Hg (the nominal normal level) by about 11.7 mm Hg (9 × 1.3), to approximately 28.3 mm Hg. Her Pco2 is, indeed, 28 mm Hg, indicating that she is compensating adequately for her metabolic acidosis.
If we use Winter’s formula instead (Pco2 = [1.5 × the bicarbonate level] + 8 ± 2),3 the lowest calculated Pco2 would be 30 mm Hg, which is within 2 mm Hg of the Rules of 5 calculation. Other formulas for calculating compensation are available.3
This information rules out the first two answers to question 1, ie, metabolic acidosis with respiratory alkalosis or acidosis.
5. Is there a delta gap?
Although we know the patient has metabolic acidosis with an elevated anion gap, we have not ruled out the possibility that she may have a triple disturbance. For this reason we need to check her delta gap.
In metabolic acidosis with an elevated anion gap, as the bicarbonate level decreases, the anion gap should increase by the same amount. If the bicarbonate level decreases more than the anion gap increases, the additional decline is the result of a second process—an additional normal-anion-gap acidosis. If the bicarbonate level does not decrease as much as the anion gap increases, there is an additional metabolic alkalosis.
Our patient’s bicarbonate level decreased 9 mmol/L (from the nominal normal level of 25 to 16), and therefore her anion gap should have increased approximately the same amount—and it did. (A normal anion gap for problem-solving is 10, and this patient’s anion gap has increased to 21. A difference of ± 2 is insignificant.) This conclusion verifies that a triple acid-base disturbance is not present, so the last answer is incorrect.
So, the correct answer to the question posed above is metabolic acidosis with an elevated anion gap (that is, metabolic acidosis with appropriate respiratory compensation).
‘MUD PILES’: FINDING THE CAUSE OF ANION GAP METABOLIC ACIDOSIS
The possible causes of metabolic acidosis with an elevated anion gap (as in our patient) can be summarized in the mnemonic MUD PILES (methanol, uremia, diabetes, paraldehyde, isoniazid, lactate, ethylene glycol, and salicylates), which has been used for many years. Parts of it are no longer useful, but rather than discard it, we propose to update it (Table 3).
Methanol and ethylene glycol
We will address toxic ingestion of methanol and ethylene glycol (the “M” and “E” of MUD PILES) at the same time.
In cases of suspected ingestion of toxic substances such as these, it is useful to examine the osmol gap, ie, the difference between the calculated and the measured serum osmolality. Serum osmolality (in mOsm/kg) is calculated as the sodium concentration in mmol/L times 2, plus the glucose concentration in mg/dL divided by 18, plus the blood urea nitrogen concentration in mg/dL divided by 2.8 (Table 4). If the measured osmolality is higher than this calculated value, the difference may be due to solutes in the blood that should not be there such as ethylene glycol, diethylene glycol, methanol, and their many metabolic products.
In our patient, ingestion of both methanol and ethylene glycol should be considered, since she lives alone and has been suspected of alcohol and opioid abuse. Her calculated osmol gap is 278 mOsm/kg. Her measured osmolality is 318 mOsm/kg (Table 1). The osmol gap is 40 mOsm/kg (normal is ≤ 10).4,5 Therefore, her osmol gap is elevated.
Identifying the specific substance the patient ingested that caused metabolic acidosis with anion gap may be difficult. Poisonings with these agents do not always increase the osmol gap.6 A high index of suspicion is essential. It is helpful to have the family search for any sources of ethylene glycol and methanol at home and initiate treatment early if an ingestion is suspected, using fomepizole (an alcohol dehydrogenase inhibitor) or parenteral ethanol and hemodialysis.7 Liquid chromatography identifies these two toxins, but results are not available emergently.
Diethylene glycol ingestion should also be considered.8 Since it is diagnosed and treated like ethylene glycol intoxication, it can be placed with the “E” of (di)ethylene glycol in the mnemonic.
Uremia
Renal failure can lead to metabolic acidosis.9 Our patient has no history of kidney disease, but her blood urea nitrogen and creatinine concentrations are above normal, and her estimated glomerular filtration rate by the Modification of Diet in Renal Disease formula is 48 mL/min/1.73 m2—low, but not uremic.
Rhabdomyolysis (suspected by elevated creatine kinase values) should be considered in any patient with mental status changes, suspected toxic ingestion, and metabolic acidosis (see the “I” in MUD PILES below). Compartment syndromes with muscle necrosis may present in a subtle fashion. Therefore, renal failure from rhabdomyolysis may complicate this patient’s course later, and should be kept in mind.
Diabetes
The patient has no history of diabetes and has a normal blood glucose level. Blood testing did not reveal ketones. She is not taking metformin (alleged to cause lactic acidosis) or a sodium-glucose cotransporter 2 inhibitor (which have been associated with ketoacidosis).10
There is another, less common cause of ketoacidosis: alcohol.11 Although alcoholism is common, alcoholic ketoacidosis is uncommon, even in heavy drinkers. Ethyl alcohol causing metabolic acidosis is similar to metabolic acidosis with (di)ethylene glycol and methanol, and if suspected it should be treated empirically (first with thiamine, then dextrose and saline, and correcting other electrolyte disturbances such as hypokalemia and hypomagnesemia) before specific identification is made. Ketones (predominantly beta-hydroxybutyrate) may persist up to 2 weeks after alcohol ingestion has stopped.11 Ketosis in the setting of alcoholic ketoacidosis is frequently accompanied by other markers of alcohol target organ injury: elevated bilirubin, aspartate aminotransferase, alanine aminotransferase, and gamma-glutamyl transferase levels. The term “ketohepatitis” has been suggested as an alternative to alcoholic ketosis.11
This patient did not have an elevated blood ethanol level, and her liver markers were otherwise normal.
THE NEW MUD PILES
2. Which of the following is (are) true? Regarding the remaining letters of the MUD PILES mnemonic:
- The “P” (paraldehyde) has been replaced by pyroglutamic acid (5-oxoproline) and propylene glycol.
- There are two isomers of lactate (dextro and levo), and consequently two clinical varieties of lactic acidosis.
- Isoniazid is no longer associated with metabolic acidosis with elevated anion gap.
- Salicylates can paradoxically be associated both with elevated and low anion gaps.
Isoniazid is still associated with metabolic acidosis with elevated anion gap, and so the third answer choice is false; the rest are true.
Paraldehyde, isoniazid, lactate
The “P,” “I,” and “L” (d-lactate) of the revamped MUD PILES acronym are less common than the others. They should be considered when the more typical causes of metabolic acidosis are not present, as in this patient.
UPDATING THE ‘P’ IN MUD PILES
Paraldehyde is rarely prescribed anymore. A PubMed search on December 21, 2015 applying the terms paraldehyde and metabolic acidosis yielded 17 results. Those specific to anion gap metabolic acidosis were from 1957 to 1986 (n = 9).12–20
Therefore, we can eliminate paraldehyde from the MUD PILES mnemonic and replace it with pyroglutamic acid and propylene glycol.
5-Oxoproline or pyroglutamic acid, a metabolite of acetaminophen
Acetaminophen depletes glutathione stores in acute overdoses, in patients with inborn errors of metabolism, and after chronic ingestion of excessive, frequent doses. Depletion of glutathione increases metabolic products, including pyroglutamic acid, which dissociates into hydrogen ions (leading to metabolic acidosis and an anion gap), and 5-oxoproline, (which can be detected in the urine).21,22
Risk factors for metabolic acidosis with acetaminophen ingestion include malnutrition, chronic alcoholism, liver disease, and female sex. In fact, most cases have been reported in females, and altered mental status has been common.
Metabolic acidosis with pyroglutamic acid can occur without elevated acetaminophen levels. Serum and urine levels of pyroglutamic acid may assist with diagnosis. Since identification of urine pyroglutamic acid usually requires outside laboratory assistance, a clinical diagnosis is often made initially and corroborated later by laboratory results. When the anion gap metabolic acidosis is multifactorial, as it was suspected to be in a case reported by Tan et al,23 the osmol gap may be elevated as a consequence of additional toxic ingestions, as it was in the reported patient.
No controlled studies of treatment have been done. n-Acetylcysteine may be of benefit. Occasional patients have been dialyzed for removal of excess pyroglutamic acid.
Propylene glycol, a component of parenteral lorazepam
Lorazepam is a hydrophobic drug, so when it is given parenterally, it must be mixed with a suitable solvent. A typical formulation adds propylene glycol. In patients receiving high doses of lorazepam as relaxation therapy for acute respiratory distress syndrome in the intensive care unit, or as treatment of alcohol withdrawal, the propylene glycol component can precipitate anion gap metabolic acidosis.24,25
Although nearly one-half of the administered propylene glycol is excreted by the kidneys, the remaining substrate is metabolized by alcohol dehydrogenase into d,l-lactaldehyde, then converted into d- or l-lactate. l-Lactate can be metabolized, but d-lactate cannot and leads to anion gap metabolic acidosis. This is another toxic metabolic acidosis associated with an elevated osmol gap. An increasing osmol gap in the intensive care unit can serve as a surrogate marker of excessive propylene glycol administration.23
Isoniazid
Although it is uncommon, there are reports of isoniazid-induced anion gap metabolic acidosis,26 either due to overdoses, or less commonly, with normal dosing. Isoniazid should therefore remain in the mnemonic MUD PILES and may be suspected when metabolic acidosis is accompanied by seizures unresponsive to usual therapy. The seizures respond to pyridoxine.
The “I” should also be augmented by newer causes of metabolic acidosis associated with “ingestions.” Ecstasy, or 3,4-methylenedioxymethamphetamine, can cause metabolic acidosis and seizures. Ecstasy has been associated with rhabdomyolysis and uremia, also leading to anion gap metabolic acidosis.27 A newer class of abused substances, synthetic cathinones (“bath salts”), are associated with metabolic acidosis, compartment syndrome, and renal failure.28
Lactic acidosis
Lactic acidosis and metabolic acidosis can result from hypoperfusion (type A) or other causes (type B). Not all lactic acidosis is contingent on l-lactate, which humans can metabolize. Metabolic acidosis may be a consequence of d-lactate (mammals have no d-lactate dehydrogenase). d-Lactic acidosis as a result of short bowel syndrome has been known for more than a generation.29 However, d-lactic acidosis occurs in another new setting. The new “P” in MUD PILES, propylene glycol, can generate substantial amounts of d-lactate.29
d-lactic metabolic acidosis is always accompanied by neurologic manifestations (slurred speech, confusion, somnolence, ataxia, abusive behavior, and others).30 With short bowel syndrome, the neurologic manifestations occur after eating and clear later.30
Although our patient’s anion gap is more than 20 mmol/L, her blood level of lactate is not elevated, and she had no history to suggest short-bowel syndrome.
Salicylates
Salicylate overdose can cause a mixed acid-base disorder: metabolic acidosis with elevated anion gap and respiratory alkalosis.
Although our patient does not have respiratory alkalosis, an aspirin overdose must be considered. A salicylate level was ordered; it was negative.
Despite the typical association of salicylates with an elevated anion gap, they may also cause a negative anion gap.31 Chloride-sensing ion-specific electrodes contain a membrane permeable to chloride. Salicylates can increase the chloride permeability of these membranes, generating pseudohyperchloremia, and consequently, a negative anion gap.
WHAT ELSE MUST BE CONSIDERED?
3. In view of her anion gap metabolic acidosis, elevated osmol gap, and absence of diabetes, renal failure, or lactate excess, what are the remaining diagnoses to consider in this patient? (Choose all that are potential sources of metabolic acidosis and an increased anion gap.)
- Methanol, ethylene, or diethylene glycol
- Excessive, chronic acetaminophen ingestion
- Salicylate toxicity
- Alcoholic ketoacidosis
All of the above can potentially contribute to metabolic acidosis.
A search of the patient’s home did not reveal a source of methanol or either ethylene or diethylene glycol. Similarly, no aspirin was found, and the patient’s salicylate levels were not elevated. The patient’s laboratory work did not reveal increased ketones.
Since none of the common causes of metabolic acidosis were discovered, and since the patient had been taking acetaminophen, the diagnosis of excessive chronic acetaminophen ingestion was suspected pending laboratory verification. Identification of 5-oxoproline in the urine may take a week or more since the sample is usually sent to special laboratories. Acetaminophen levels in this patient were significantly elevated, as were urinary oxyproline levels, which returned later.
The patient was diagnosed with pyroglutamic acid metabolic acidosis. She was treated supportively and with n-acetylcysteine intravenously, although there have been no controlled studies of the efficacy of this drug. Seventy-two hours after admission, she had improved. Her acid-base status returned to normal.
GOLD MARK: ANOTHER WAY TO REMEMBER
Another mnemonic device for remembering the causes of metabolic acidosis with elevated anion gap is “GOLD MARK”: glycols (ethylene and propylene), oxoproline (instead of pyroglutamic acid from acetaminophen), l-lactate, d-lactate, methanol, aspirin, renal failure, and ketoacidosis).32
ACID-BASE DISORDERS IN DIFFERENT DISEASES
Diverse diseases cause distinctive acid-base abnormalities. Matching the appropriate acid-base abnormality with its associated disease may lead to more timely diagnosis and treatment:
Type 2 diabetes mellitus, for example, can lead to lactic acidosis, ketoacidosis, or type 4 renal tubular acidosis.33
Heart failure, although not typically framed in the context of acid-base physiology, can lead to elevated lactate, which is associated with a worse prognosis.34
Acquired immunodeficiency syndrome. Abacavir can cause normal anion gap metabolic acidosis.35,36
Cancer37,38 can be associated with proximal tubular renal tubular acidosis and lactic acidosis.
An expanding array of toxic ingestions
Metabolic acidosis may be the most prominent and potentially lethal clinical acid-base disturbance. When metabolic acidosis occurs in certain disease states—lactic acidosis with hypoperfusion or methanol ingestion with metabolic acidosis, for example—there is increased morbidity and mortality.
As reflected in the revisions to MUD PILES and in the newer GOLD MARK acronym, the osmol gap has become more valuable in differential diagnosis of metabolic acidosis with an elevated anion gap consequent to an expanding array of toxic ingestions (methanol, propylene glycol, pyroglutamic acid-oxoproline, ethylene glycol, and diethylene glycol), which may accompany pyroglutamic acid-oxoproline.
- Whittier WL, Rutecki GW. Primer on clinical acid-base problem solving. Dis Mon 2004; 50:122–162.
- Kraut JA, Madias NE. Serum anion gap: its uses and limitations in clinical medicine. Clin J Am Soc Nephrol 2007; 2:162–174.
- Adrogué HJ, Madias NE. Secondary responses to altered acid-base status: the rules of engagement. J Am Soc Nephrol 2010; 21:920–923.
- Krasowski MD, Wilcoxon RM, Miron J. A retrospective analysis of glycol and toxic alcohol ingestion: utility of anion and osmolal gaps. BMC Clin Pathol 2012;12:1.
- Latus J, Kimmel M, Alscher MD, Braun N. Ethylene glycol poisoning: a rare but life-threatening cause of metabolic acidosis—a single-centre experience. Clin Kidney J 2012; 5:120–123.
- Kraut JA. Diagnosis of toxic alcohols: limitations of present methods. Clin Toxicol (Phila) 2015; 53:589–595.
- Ghannoum M, Hoffman RS, Mowry JB, Lavergne V. Trends in toxic alcohol exposures in the United States from 2000 to 2013: a focus on the use of antidotes and extracorporeal treatments. Semin Dial 2014; 27:395–401.
- Schep LJ, Slaughter RJ, Temple WA, Beasley DM. Diethylene glycol poisoning. Clin Toxicol (Phila) 2009; 47:525–535.
- Kraut JA, Madias NE. Metabolic acidosis of CKD: an update. Am J Kidney Dis 2016; 67:307–317.
- Taylor SI, Blau JE, Rother KI. SGLT2 inhibitors may predispose to ketoacidosis. J Clin Endocrinol Metab 2015; 100:2849–2852.
- Yokoyama A, Yokoyama T, Mizukami T, et al. Alcoholic ketosis: prevalence, determinants, and ketohepatitis in Japanese alcoholic men. Alcohol Alcohol 2014; 49:618–625.
- Hayward JN, Boshell BR. Paraldehyde intoxication with metabolic acidosis; report of two cases, experimental data and a critical review of the literature. Am J Med 1957; 23:965–976.
- Elkinton JR, Huth EJ, Clark JK, Barker ES, Seligson D. Renal tubular acidosis with organic aciduria during paraldehyde ingestion; six year study of an unusual case. Am J Med 1957; 23:977–986.
- Waterhouse C, Stern EA. Metabolic acidosis occurring during administration of paraldehyde. Am J Med 1957; 23:987–989.
- Beier LS, Pitts WH, Gonick HC. Metabolic acidosis occurring during paraldehyde intoxication. Ann Intern Med 1963; 58:155–158.
- Hiemcke T. Metabolic acidosis due to paraldehyde. Ned Tijdschr Geneeskd 1964; 108:2165–2167. Dutch.
- Gailitis RJ. Paraldehyde acidosis syndrome. IMJ III Med J 1966; 129:258–262.
- Gutman RA, Burnell JM. Paraldehyde acidosis. Am J Med 1967; 42:435–440.
- Hadden JW, Metzner RJ. Pseudoketosis and hyperacetaldehydemia in paraldehyde acidosis. Am J Med 1969; 47:642–647.
- Linter CM, Linter SP. Severe lactic acidosis following paraldehyde administration. Br J Psychiatry 1986; 149:650–651.
- Zand L, Muriithi A, Nelsen E, et al. Severe anion gap metabolic acidosis from acetaminophen use secondary to 5-oxoproline (pyroglutamic acid) accumulation. Am J Med Sci 2012; 344:501–504.
- Abkur TM, Mohammed W, Ali M, Casserly L. Acetaminophen-induced anion gap metabolic acidosis secondary to 5-oxoproline: a case report. J Med Case Rep 2014; 8:409.
- Tan EM, Kalimullah E, Sohail MR, Ramar K. Diagnostic challenge in a patient with severe anion gap metabolic acidosis. Case Rep Crit Care 2015; 2015:272914.
- Jorens PG, Demey HE, Schepens PJ, et al. Unusual d-lactic acid acidosis from propylene glycol metabolism in overdose. J Toxicol Clin Toxicol 2004; 42:163–169.
- Barnes BJ, Gerst C, Smith JR, Terrell AR, Mullins ME. Osmol gap as a surrogate marker for serum propylene glycol concentrations in patients receiving lorazepam for sedation. Pharmacotherapy 2006; 26:23–33.
- Gokhale YA, Vaidya MS, Mehta AD, Rathod NN. Isoniazid toxicity presenting as status epilepticus and severe metabolic acidosis. J Assoc Physicians India 2009; 57:70–71.
- Ben-Abraham R, Szold O, Rudick V, Weinbroum AA. ‘Ecstasy’ intoxication: life-threatening manifestations and resuscitative measures in the intensive care setting. Eur J Emerg Med 2003; 10:309–313.
- German CL, Fleckenstein AE, Hanson GR. Bath salts and synthetic cathinones: an emerging designer drug phenomenon. Life Sci 2014; 97:2–8.
- Jorens PG, Demey HE, Schepens PJ, et al. Unusual d-lactic acidosis from propylene glycol metabolism in overdose. J Toxicol Clin Toxicol 2004; 42:163–169.
- Kang KP, Le S, Kang SK. d-Lactic acidosis in humans: review and update. Electrolyte Blood Press 2006; 4:53–56.
- Emmett M. Approach to the patient with a negative anion gap. Am J Kidney Dis 2016; 67:143–150.
- Mehta AN, Emmett JB, Emmett M. GOLD MARK: an anion gap mnemonic for the 21st Century. Lancet 2008; 372:892.
- Palmer BF, Clegg DJ. Electrolyte and acid-base disturbances in patients with diabetes mellitus. N Engl J Med 2015; 373:548–559.
- Park JJ, Choi DJ, Yoon CH, et al; KorHF Registry. The prognostic value of arterial blood gas analysis in high-risk acute heart failure patients: an analysis of the Korean Heart Failure (KorHF) registry. Eur J Heart Fail 2015; 17:601–611.
- Musso CG, Belloso WH, Glassock RJ. Water, electrolytes, and acid-base alterations in human immunodeficiency virus infected patients. World J Nephrol 2016; 5:33–42.
- Camara-Lemarroy CR, Flores-Cantu H, Calderon-Hernandez HJ, Diaz-Torres MA, Villareal-Velazquez HJ. Drug-induced haemolysis, renal failure, thrombocytopenia and lactic acidosis in patients with HIV and cryptococcal meningitis: a diagnostic challenge. Int J STD AIDS 2015; 26:1052–1054.
- Miltiadous G, Christidis D, Kalogirou M, Elisaf M. Causes and mechanisms of acid-base and electrolyte abnormalities in cancer. Eur J Intern Med 2008; 19:1–7.
- Vlachostergios PJ, Oikonomou KG, Gibilaro E, Apergis G. Elevated lactic acid is a negative prognostic factor in metastatic lung cancer. Cancer Biomark 2015; 15:725–734.

Left ventricular thrombosis can still complicate acute myocardial infarction
A 62-year-old man with hypertension, type 2 diabetes mellitus, and hypercholesterolemia presented to the emergency department with substernal chest pain that started about 15 hours earlier while he was at rest watching television.
On examination, his pulse was 92 beats per minute and regular, his blood pressure was 160/88 mm Hg, and he had no evidence of jugular venous distention or pedal edema. Lung examination was positive for bibasilar crackles.
Electrocardiography revealed Q waves with ST elevation in leads I, aVL, V4, V5, and V6 with reciprocal ST depression in leads II, III, and aVF.
His troponin T level on presentation was markedly elevated.

He underwent heart catheterization and was found to have 100% occlusion of the proximal left anterior descending artery. He underwent successful percutaneous coronary intervention with placement of a drug-eluting stent, and afterward had grade 3 flow on the Thrombolysis in Myocardial Infarction (TIMI) scale.
Echocardiography the next day revealed a mobile echo-dense mass in the left ventricular apex (Figure 1) and a left ventricular ejection fraction of 35%.
THE INCIDENCE OF LEFT VENTRICULAR THROMBOSIS IN ACUTE MI
1. What is the incidence of left ventricular thrombosis after acute myocardial infarction (MI), now that primary percutaneous coronary intervention is common?
- 0.1%
- 2%
- 20%
- 40%
Left ventricular thrombosis is a serious complication of acute MI that can cause systemic thromboembolism, including stroke.1 Before thrombolytic therapy was available, this complication occurred in 20% to 60% of patients with acute MI.2,3 But early reperfusion strategies, anticoagulation for the first 48 hours, and dual antiplatelet therapy have reduced the incidence of this complication significantly.
In the thrombolytic era, the incidence of left ventricular thrombosis was 5.1% in the Gruppo Italiano per lo Studio della Sopravvivenza nell’Infarto Miocardico (GISSI) 3 study, which had 8,326 patients. A subset of patients who had an anterior MI had almost double the incidence (11.5%).3

The incidence has further declined with the advent of primary percutaneous coronary intervention, likely thanks to enhanced myocardial salvage, and now ranges from 2.5% to 15% (Table 1).4–11 The largest observational study, with 2,911 patients undergoing percutaneous coronary intervention, reported an incidence of 2.5% within 3 to 5 days of the MI.7 At our center, the incidence was found to be even lower, 1.8% in 1,700 patients presenting with ST-elevation MI undergoing primary percutaneous coronary intervention. Hence, of the answers to the question above, 2% would be closest.
Large infarct size with a low left ventricular ejection fraction (< 40%), anterior wall MI, hypertension, and delay in time from symptom onset to intervention were independent predictors of left ventricular thrombus formation in most studies.7,12 The risk is highest during the first 2 weeks after MI, and thrombosis almost never occurs more than 3 months after the index event.5,13–16
WHAT IS THE PATHOGENESIS OF LEFT VENTRICULAR THROMBOSIS?
A large transmural infarct results in loss of contractile function, which causes stagnation and pooling of blood adjacent to the infarcted ventricular segment. In addition, endocardial injury exposes tissue factor, which then initiates the coagulation cascade. To make matters worse, MI results in a hypercoagulable state through unclear mechanisms, which completes the Virchow triad for thrombus formation. Elevations of D-dimer, fibrinogen, anticardiolipin antibodies (IgM and IgG), and tissue factor have also been reported after acute MI.17
Thrombus formation begins with platelet aggregation at the site of endocardial damage, forming a platelet plug, followed by activation of clotting factors. These thrombi are referred to as “mural,” as they adhere to the chamber wall (endocardium). They are composed of fibrin and entrapped red and white blood cells (Figure 2).
The natural course of thrombus evolution is established but variable. A left ventricular thrombus may dislodge and embolize, resulting in stroke or other thromboembolic complications. Alternately, it can dissolve over time, aided by intrinsic fibrinolytic mechanisms. On other occasions, the thrombus may organize, a process characterized by ingrowth of smooth muscle cells, fibroblasts, and endothelium.
HOW IS LEFT VENTRICULAR THROMBOSIS DIAGNOSED?
2. What is the best imaging test for detecting a thrombus?
- Transesophageal echocardiography
- Transthoracic echocardiography
- Cardiac magnetic resonance imaging (MRI) without gadolinium contrast
- Cardiac MRI with gadolinium contrast
Evaluation of left ventricular function after acute MI carries a class I indication (ie, it should be performed).18
Echocardiography is commonly used, and it has a 60% sensitivity to detect a thrombus.19 In patients with poorer transthoracic echocardiographic windows, contrast can be used to better delineate the left ventricular cavity and show the thrombus. Transesophageal echocardiography is seldom useful, as the left ventricular apex is foreshortened and in the far field.
A left ventricular thrombus is confirmed if an echo-dense mass with well-demarcated margins distinct from the endocardium is seen throughout the cardiac cycle. It should be evident in at least two different views (apical and short-axis) and should be adjacent to a hypokinetic or akinetic left ventricular wall. False-positive findings can occur due to misidentified false tendons, papillary muscles, and trabeculae.
Cardiac MRI with late gadolinium enhancement is now the gold standard for diagnostic imaging, as it accurately characterizes the shape, size, and location of the thrombus (Figure 3). Gadolinium contrast increases the enhancement of the ventricular cavity, thus allowing easy detection of thrombus, which appears dark. Cardiac MRI with delayed enhancement has 88% to 91% sensitivity and 99% specificity to detect left ventricular thrombosis.20,21 However, compared with echocardiography, routine cardiac MRI is time-intensive, costly, and not routinely available. As a result, it should be performed only in patients with poor acoustic windows and a high clinical suspicion of left ventricular thrombosis.
Delayed-contrast cardiac computed tomography can be used to identify left ventricular thrombosis, using absence of contrast uptake. The need to use contrast is a disadvantage, but computed tomography can be an alternative in patients with contraindications to cardiac MRI.
WHAT COMPLICATIONS ARISE FROM LEFT VENTRICULAR THROMBOSIS?
The most feared complication of left ventricular thrombosis is thromboembolism. Cardioembolic stroke is generally severe, prone to early and long-term recurrence, and associated with a higher death rate than noncardioembolic ischemic stroke.22,23 Thrombi associated with thromboembolism are often acute and mobile rather than organized and immobile.24 They may embolize to the brain, spleen, kidneys, and bowel.25 In a meta-analysis of 11 studies, the pooled odds ratio for risk of embolization was 5.45 (95% confidence interval [CI] 3.02–9.83) with left ventricular thrombi vs without.26 Before systemic thrombolysis and antiplatelet therapy became available, stroke rates ranged from 1.5% to 10%.27–29
In a meta-analysis of 22 studies from 1978 to 2004, the incidence of ischemic stroke after MI during hospitalization was around 11.1 per 1,000 MIs.30 This study found that anterior MI was associated with a higher risk of stroke, but reported no difference in the incidence of stroke with percutaneous coronary intervention, systemic thrombolysis, or no reperfusion.
In a large prospective cohort study of 2,160 patients,31 259 (12%) had a stroke after MI. In multivariable analysis, age, diabetes, and previous stroke were predictors of stroke after MI. This study reported significantly fewer strokes in patients who underwent percutaneous coronary intervention than with other or no reperfusion therapies.31
ANTICOAGULATION TREATMENT
3. How would you treat a patient who has a drug-eluting stent in the left anterior descending artery and a new diagnosis of left ventricular thrombosis?
- Warfarin
- Aspirin and clopidogrel
- Aspirin, clopidogrel, and warfarin
- Aspirin and warfarin
The management of left ventricular thrombosis has been summarized in guidelines from the American College of Chest Physicians (ACCP) in 2012,32 and from the American College of Cardiology/American Heart Association in 2013,18 which recommend anticoagulation for at least 3 months, or indefinitely if bleeding risk is low, for all patients developing a left ventricular thrombus.
For patients with acute MI and left ventricular thrombosis, the ACCP guidelines recommend warfarin with a target international normalized ratio of 2.0 to 3.0 plus dual antiplatelet therapy (eg, aspirin plus clopidogrel) for 3 months, after which warfarin is discontinued but dual antiplatelet therapy is continued for up to 12 months.32
The European Society of Cardiology guidelines33 recommend 6 months of anticoagulation. However, if the patient is receiving dual antiplatelet therapy, they recommend repeated imaging of the left ventricle after 3 months of anticoagulation, which may allow for earlier discontinuation of anticoagulation if the thrombus has resolved and apical wall motion has recovered. Therefore, most experts recommend 3 months of anticoagulation when used in combination with dual antiplatelet therapy and repeating echocardiography at 3 months to safely discontinue anticoagulation. The best answer to the question posed here is aspirin, clopidogrel, and warfarin.
Decisions about antithrombotic therapy may also depend on stent type and the patient’s bleeding risk. With bare-metal stents, dual antiplatelet therapy along with anticoagulation should be used for 1 month, after which anticoagulation should be used with a single antiplatelet agent for another 2 months; after this, the anticoagulant can be discontinued and dual antiplatelet therapy can be resumed for a total of 12 months. Newer anticoagulants such as rivaroxaban, dabigatran, edoxaban, and apixaban may also have a role, but they have not yet been studied for this indication.
Surgical thrombectomy is rarely considered now, given the known efficacy of anticoagulants in dissolving the thrombus. It was done in the past for large, mobile, or protruding left ventricular thrombi, which have a higher potential for embolization.34 Currently, it can be done under very special circumstances, such as before placement of a left ventricular assist device or if the thrombus is large, to prevent embolism.35,36
BLEEDING COMPLICATIONS WITH TRIPLE ANTITHROMBOTIC THERAPY
After stent placement, almost all patients need to be on dual antiplatelet therapy for a specified duration depending on the type and generation of stent used. Such patients end up on “triple” antithrombotic therapy (two antiplatelet drugs plus an anticoagulant), which poses a high risk of bleeding.37 Consideration needs to be given to the risks of stroke, stent thrombosis, and major bleeding when selecting the antithrombotic regimen.38 Triple antithrombotic therapy has been associated with a risk of fatal and nonfatal bleeding of 4% to 16% when used for indications such as atrial fibrillation.39–41
Risks of triple antithrombotic therapy (aspirin 80–100 mg, clopidogrel 75 mg, and warfarin) were compared with those of clopidogrel plus warfarin in the What Is the Optimal Antiplatelet and Anticoagulant therapy in Patients With Oral Anticoagulation and Coronary Stenting Trial,37 which reported a significantly lower risk of major and minor bleeding with clopidogrel-plus-warfarin therapy than with triple antithrombotic therapy, 14.3% vs 31.7% (hazard ratio 0.40, 95% CI 0.28–0.58, P < .0001).
Additionally, the increased risk of major and minor bleeding associated with triple antithrombotic therapy has been confirmed in many observational studies; other studies found a trend toward lower risk with triple therapy, but this was not statistically significant (Table 2).38,40,42–55 A large multicenter European trial is being conducted to compare dual antiplatelet therapy vs triple antithrombotic therapy in patients with left ventricular thrombosis.
CASE FOLLOW-UP
Our patient was started on warfarin, clopidogrel 75 mg, and aspirin 75 mg at the time of discharge. He was continued on warfarin for 3 months, at which time a follow-up echocardiogram showed no thrombus in the left ventricle. Warfarin was discontinued, and he had no thromboembolic complications.
TAKE-HOME POINTS
Left ventricular thrombosis after an acute MI is very important to detect, as it can lead to serious complications through arterial embolism.
The incidence of left ventricular thrombosis has declined significantly with the use of percutaneous coronary intervention. However, it may still occur in a small number of patients with larger infarcts owing to delay in revascularization or proximal (left main or left anterior descending) occlusions with larger infarct size.
Echocardiography, which is routinely performed after acute MI to assess myocardial function, uncovers most left ventricular thrombi. In high-risk cases, MRI with late gadolinium enhancement can increase the diagnostic yield.
Anticoagulation with warfarin is recommended for at least 3 months. Post-MI patients undergoing stent implantation may need triple antithrombotic therapy, which, however, increases the bleeding risk significantly. Large randomized trials are needed to guide physicians in risk stratification of such patients.
- Lip GY, Piotrponikowski P, Andreotti F, et al; Heart Failure Association (EHFA) of the European Society of Cardiology (ESC) and the ESC Working Group on Thrombosis. Thromboembolism and antithrombotic therapy for heart failure in sinus rhythm: an executive summary of a joint consensus document from the ESC Heart Failure Association and the ESC Working Group on Thrombosis. Thromb Haemost 2012; 108:1009–1022.
- Turpie AG, Robinson JG, Doyle DJ, et al. Comparison of high-dose with low-dose subcutaneous heparin to prevent left ventricular mural thrombosis in patients with acute transmural anterior myocardial infarction. N Engl J Med 1989; 320:352–357.
- Chiarella F, Santoro E, Domenicucci S, Maggioni A, Vecchio C. Predischarge two-dimensional echocardiographic evaluation of left ventricular thrombosis after acute myocardial infarction in the GISSI-3 study. Am J Cardiol 1998; 81:822–827.
- Kalra A, Jang IK. Prevalence of early left ventricular thrombus after primary coronary intervention for acute myocardial infarction. J Thromb Thrombolysis 2000; 10:133–136.
- Nayak D, Aronow WS, Sukhija R, McClung JA, Monsen CE, Belkin RN. Comparison of frequency of left ventricular thrombi in patients with anterior wall versus non-anterior wall acute myocardial infarction treated with antithrombotic and antiplatelet therapy with or without coronary revascularization. Am J Cardiol 2004; 93:1529–1530.
- Rehan A, Kanwar M, Rosman H, et al. Incidence of post myocardial infarction left ventricular thrombus formation in the era of primary percutaneous intervention and glycoprotein IIb/IIIa inhibitors. A prospective observational study. Cardiovasc Ultrasound 2006;4:20.
- Zielinska M, Kaczmarek K, Tylkowski M. Predictors of left ventricular thrombus formation in acute myocardial infarction treated with successful primary angioplasty with stenting. Am J Med Sci 2008; 335:171–176.
- Osherov AB, Borovik-Raz M, Aronson D, et al. Incidence of early left ventricular thrombus after acute anterior wall myocardial infarction in the primary coronary intervention era. Am Heart J 2009; 157:1074–1080.
- Solheim S, Seljeflot I, Lunde K, et al. Frequency of left ventricular thrombus in patients with anterior wall acute myocardial infarction treated with percutaneous coronary intervention and dual antiplatelet therapy. Am J Cardiol 2010; 106:1197–1200.
- Shacham Y, Leshem-Rubinow E, Ben Assa E, et al. Comparison of C-reactive protein and fibrinogen levels in patients having anterior wall ST-segment elevation myocardial infarction with versus without left ventricular thrombus (from a primary percutaneous coronary intervention cohort). Am J Cardiol 2013; 112:57–60.
- Gianstefani S, Douiri A, Delithanasis I, et al. Incidence and predictors of early left ventricular thrombus after ST-elevation myocardial infarction in the contemporary era of primary percutaneous coronary intervention. Am J Cardiol 2014; 113:1111–1116.
- Shacham Y, Birati EY, Rogovski O, Cogan Y, Keren G, Roth A. Left ventricular thrombus formation and bleeding complications during continuous in-hospital anticoagulation for acute anterior myocardial infarction. Isr Med Assoc J 2012; 14:742–746.
- Asinger RW, Mikell FL, Elsperger J, Hodges M. Incidence of left-ventricular thrombosis after acute transmural myocardial infarction. Serial evaluation by two-dimensional echocardiography. N Engl J Med 1981; 305:297–302.
- Nihoyannopoulos P, Smith GC, Maseri A, Foale RA. The natural history of left ventricular thrombus in myocardial infarction: a rationale in support of masterly inactivity. J Am Coll Cardiol 1989; 14:903–911.
- Weinreich DJ, Burke JF, Pauletto FJ. Left ventricular mural thrombi complicating acute myocardial infarction. Long-term follow-up with serial echocardiography. Ann Intern Med 1984; 100:789–794.
- Greaves SC, Zhi G, Lee RT, et al. Incidence and natural history of left ventricular thrombus following anterior wall acute myocardial infarction. Am J Cardiol 1997; 80:442–448.
- Solheim S, Seljeflot I, Lunde K, et al. Prothrombotic markers in patients with acute myocardial infarction and left ventricular thrombus formation treated with pci and dual antiplatelet therapy. Thromb J 2013; 11:1.
- O’Gara PT, Kushner FG, Ascheim DD, et al; American College of Cardiology Foundation/American Heart Association Task Force on Practice Guidelines. 2013 ACCF/AHA guideline for the management of ST-elevation myocardial infarction: a report of the American College of Cardiology Foundation/American Heart Association Task Force on Practice Guidelines. Circulation 2013; 127:e362–e425.
- Weinsaft JW, Kim HW, Crowley AL, et al. LV thrombus detection by routine echocardiography: insights into performance characteristics using delayed enhancement CMR. JACC Cardiovasc Imaging 2011; 4:702–712.
- Mollet NR, Dymarkowski S, Volders W, et al. Visualization of ventricular thrombi with contrast-enhanced magnetic resonance imaging in patients with ischemic heart disease. Circulation 2002; 106:2873–2876.
- Srichai MB, Junor C, Rodriguez LL, et al. Clinical, imaging, and pathological characteristics of left ventricular thrombus: a comparison of contrast-enhanced magnetic resonance imaging, transthoracic echocardiography, and transesophageal echocardiography with surgical or pathological validation. Am Heart J 2006; 152:75–84.
- Eriksson SE, Olsson JE. Survival and recurrent strokes in patients with different subtypes of stroke: a fourteen-year follow-up study. Cerebrovasc Dis 2001; 12:171–180.
- Grau AJ, Weimar C, Buggle F, et al. Risk factors, outcome, and treatment in subtypes of ischemic stroke: the German Stroke Data Bank. Stroke 2001; 32:2559–2566.
- Keren A, Goldberg S, Gottlieb S, et al. Natural history of left ventricular thrombi: their appearance and resolution in the posthospitalization period of acute myocardial infarction. J Am Coll Cardiol 1990; 15:790–800.
- Jordan RA, Miller RD, Edwards JE, Parker RL. Thrombo-embolism in acute and in healed myocardial infarction. I. Intracardiac mural thrombosis. Circulation 1952; 6:1–6.
- Vaitkus PT, Barnathan ES. Embolic potential, prevention and management of mural thrombus complicating anterior myocardial infarction: a meta-analysis. J Am Coll Cardiol 1993; 22:1004–1009.
- ISIS-2 (Second International Study of Infarct Survival) Collaborative Group. Randomised trial of intravenous streptokinase, oral aspirin, both, or neither among 17,187 cases of suspected acute myocardial infarction: ISIS-2. Lancet 1988; 2:349–360.
- Cabin HS, Roberts WC. Left ventricular aneurysm, intraaneurysmal thrombus and systemic embolus in coronary heart disease. Chest 1980; 77:586–590.
- Keating EC, Gross SA, Schlamowitz RA, et al. Mural thrombi in myocardial infarctions. Prospective evaluation by two-dimensional echocardiography. Am J Med 1983; 74:989–995.
- Witt BJ, Ballman KV, Brown RD Jr, Meverden RA, Jacobsen SJ, Roger VL. The incidence of stroke after myocardial infarction: a meta-analysis. Am J Med 2006; 119:354.e1–354.e9.
- Witt BJ, Brown RD Jr, Jacobsen SJ, Weston SA, Yawn BP, Roger VL. A community-based study of stroke incidence after myocardial infarction. Ann Intern Med 2005; 143:785–792.
- Vandvik PO, Lincoff AM, Gore JM, et al; American College of Chest Physicians. Primary and secondary prevention of cardiovascular disease: antithrombotic therapy and prevention of thrombosis, 9th ed: American College of Chest Physicians Evidence-Based Clinical Practice Guidelines. Chest 2012; 141(suppl):e637S–e68S.
- Steg G, James SK, Atar D, et al. ESC guidelines for the management of acute myocardial infarction in patients presenting with ST-segment elevation. Eur Heart J 2012; 33:2569–2619.
- Nili M, Deviri E, Jortner R, Strasberg B, Levy MJ. Surgical removal of a mobile, pedunculated left ventricular thrombus: report of 4 cases. Ann Thorac Surg 1988; 46:396–400.
- Kanemitsu S, Miyake Y, Okabe M. Surgical removal of a left ventricular thrombus associated with cardiac sarcoidosis. Interact Cardiovasc Thorac Surg 2008; 7:333–335.
- Engin C, Yagdi T, Balcioglu O, et al. Left ventricular assist device implantation in heart failure patients with a left ventricular thrombus. Transplant Proc 2013; 45:1017–1019.
- Dewilde WJ, Oirbans T, Verheugt FW, et al; WOEST study investigators. Use of clopidogrel with or without aspirin in patients taking oral anticoagulant therapy and undergoing percutaneous coronary intervention: an open-label, randomised, controlled trial. Lancet 2013; 381:1107–1115.
- Faxon DP, Eikelboom JW, Berger PB, et al. Antithrombotic therapy in patients with atrial fibrillation undergoing coronary stenting: a North American perspective: executive summary. Circ Cardiovasc Interv 2011; 4:522–534.
- Hansen ML, Sorensen R, Clausen MT, et al. Risk of bleeding with single, dual, or triple therapy with warfarin, aspirin, and clopidogrel in patients with atrial fibrillation. Arch Intern Med 2010; 170:1433–1441.
- Karjalainen PP, Porela P, Ylitalo A, et al. Safety and efficacy of combined antiplatelet-warfarin therapy after coronary stenting. Eur Heart J 2007; 28:726–732.
- Doyle BJ, Rihal CS, Gastineau DA, Holmes DR Jr. Bleeding, blood transfusion, and increased mortality after percutaneous coronary intervention: implications for contemporary practice. J Am Coll Cardiol 2009; 53:2019–2027.
- Azoulay L, Dell’Aniello S, Simon T, Renoux C, Suissa S. The concurrent use of antithrombotic therapies and the risk of bleeding in patients with atrial fibrillation. Thromb Haemost 2013; 109:431–439.
- Deshmukh A, Hilleman DE, Del Core M, Nair CK. Antithrombotic regimens in patients with indication for long-term anticoagulation undergoing coronary interventions-systematic analysis, review of literature, and implications on management. Am J Ther 2013; 20:654–663.
- Fosbol EL, Wang TY, Li S, et al. Warfarin use among older atrial fibrillation patients with non-ST-segment elevation myocardial infarction managed with coronary stenting and dual antiplatelet therapy. Am Heart J 2013; 166:864–870.
- Gao F, Zhou YJ, Wang ZJ, et al. Meta-analysis of the combination of warfarin and dual antiplatelet therapy after coronary stenting in patients with indications for chronic oral anticoagulation. Int J Cardiol 2011; 148:96–101.
- Hansen ML, Sorensen R, Clausen MT, et al. Risk of bleeding with single, dual, or triple therapy with warfarin, aspirin, and clopidogrel in patients with atrial fibrillation. Arch Intern Med 2010; 170:1433–1441.
- Hermosillo AJ, Spinler SA. Aspirin, clopidogrel, and warfarin: is the combination appropriate and effective or inappropriate and too dangerous? Ann Pharmacother 2008; 42:790–805.
- Holmes DR Jr, Kereiakes DJ, Kleiman NS, Moliterno DJ, Patti G, Grines CL. Combining antiplatelet and anticoagulant therapies. J Am Coll Cardiol 2009; 54:95–109.
- Khurram Z, Chou E, Minutello R, et al. Combination therapy with aspirin, clopidogrel and warfarin following coronary stenting is associated with a significant risk of bleeding. J Invasive Cardiol 2006; 18:162–164.
- Orford JL, Fasseas P, Melby S, et al. Safety and efficacy of aspirin, clopidogrel, and warfarin after coronary stent placement in patients with an indication for anticoagulation. Am Heart J 2004; 147:463–467.
- Porter A, Konstantino Y, Iakobishvili Z, Shachar L, Battler A, Hasdai D. Short-term triple therapy with aspirin, warfarin, and a thienopyridine among patients undergoing percutaneous coronary intervention. Catheter Cardiovasc Interv 2006; 68:56–61.
- DeEugenio D, Kolman L, DeCaro M, et al. Risk of major bleeding with concomitant dual antiplatelet therapy after percutaneous coronary intervention in patients receiving long-term warfarin therapy. Pharmacotherapy 2007; 27:691–696.
- Ruiz-Nodar JM, Marin F, Hurtado JA, et al. Anticoagulant and antiplatelet therapy use in 426 patients with atrial fibrillation undergoing percutaneous coronary intervention and stent implantation implications for bleeding risk and prognosis. J Am Coll Cardiol 2008; 51:818–825.
- Sarafoff N, Ndrepepa G, Mehilli J, et al. Aspirin and clopidogrel with or without phenprocoumon after drug eluting coronary stent placement in patients on chronic oral anticoagulation. J Intern Med 2008; 264:472–480.
- Rossini R, Musumeci GF, Lettieri CF, et al. Long-term outcomes in patients undergoing coronary stenting on dual oral antiplatelet treatment requiring oral anticoagulant therapy. Am J Cardiol 2008; 102:1618–1623.
A 62-year-old man with hypertension, type 2 diabetes mellitus, and hypercholesterolemia presented to the emergency department with substernal chest pain that started about 15 hours earlier while he was at rest watching television.
On examination, his pulse was 92 beats per minute and regular, his blood pressure was 160/88 mm Hg, and he had no evidence of jugular venous distention or pedal edema. Lung examination was positive for bibasilar crackles.
Electrocardiography revealed Q waves with ST elevation in leads I, aVL, V4, V5, and V6 with reciprocal ST depression in leads II, III, and aVF.
His troponin T level on presentation was markedly elevated.
He underwent heart catheterization and was found to have 100% occlusion of the proximal left anterior descending artery. He underwent successful percutaneous coronary intervention with placement of a drug-eluting stent, and afterward had grade 3 flow on the Thrombolysis in Myocardial Infarction (TIMI) scale.
Echocardiography the next day revealed a mobile echo-dense mass in the left ventricular apex (Figure 1) and a left ventricular ejection fraction of 35%.
THE INCIDENCE OF LEFT VENTRICULAR THROMBOSIS IN ACUTE MI
1. What is the incidence of left ventricular thrombosis after acute myocardial infarction (MI), now that primary percutaneous coronary intervention is common?
- 0.1%
- 2%
- 20%
- 40%
Left ventricular thrombosis is a serious complication of acute MI that can cause systemic thromboembolism, including stroke.1 Before thrombolytic therapy was available, this complication occurred in 20% to 60% of patients with acute MI.2,3 But early reperfusion strategies, anticoagulation for the first 48 hours, and dual antiplatelet therapy have reduced the incidence of this complication significantly.
In the thrombolytic era, the incidence of left ventricular thrombosis was 5.1% in the Gruppo Italiano per lo Studio della Sopravvivenza nell’Infarto Miocardico (GISSI) 3 study, which had 8,326 patients. A subset of patients who had an anterior MI had almost double the incidence (11.5%).3
The incidence has further declined with the advent of primary percutaneous coronary intervention, likely thanks to enhanced myocardial salvage, and now ranges from 2.5% to 15% (Table 1).4–11 The largest observational study, with 2,911 patients undergoing percutaneous coronary intervention, reported an incidence of 2.5% within 3 to 5 days of the MI.7 At our center, the incidence was found to be even lower, 1.8% in 1,700 patients presenting with ST-elevation MI undergoing primary percutaneous coronary intervention. Hence, of the answers to the question above, 2% would be closest.
Large infarct size with a low left ventricular ejection fraction (< 40%), anterior wall MI, hypertension, and delay in time from symptom onset to intervention were independent predictors of left ventricular thrombus formation in most studies.7,12 The risk is highest during the first 2 weeks after MI, and thrombosis almost never occurs more than 3 months after the index event.5,13–16
WHAT IS THE PATHOGENESIS OF LEFT VENTRICULAR THROMBOSIS?
A large transmural infarct results in loss of contractile function, which causes stagnation and pooling of blood adjacent to the infarcted ventricular segment. In addition, endocardial injury exposes tissue factor, which then initiates the coagulation cascade. To make matters worse, MI results in a hypercoagulable state through unclear mechanisms, which completes the Virchow triad for thrombus formation. Elevations of D-dimer, fibrinogen, anticardiolipin antibodies (IgM and IgG), and tissue factor have also been reported after acute MI.17
Thrombus formation begins with platelet aggregation at the site of endocardial damage, forming a platelet plug, followed by activation of clotting factors. These thrombi are referred to as “mural,” as they adhere to the chamber wall (endocardium). They are composed of fibrin and entrapped red and white blood cells (Figure 2).
The natural course of thrombus evolution is established but variable. A left ventricular thrombus may dislodge and embolize, resulting in stroke or other thromboembolic complications. Alternately, it can dissolve over time, aided by intrinsic fibrinolytic mechanisms. On other occasions, the thrombus may organize, a process characterized by ingrowth of smooth muscle cells, fibroblasts, and endothelium.
HOW IS LEFT VENTRICULAR THROMBOSIS DIAGNOSED?
2. What is the best imaging test for detecting a thrombus?
- Transesophageal echocardiography
- Transthoracic echocardiography
- Cardiac magnetic resonance imaging (MRI) without gadolinium contrast
- Cardiac MRI with gadolinium contrast
Evaluation of left ventricular function after acute MI carries a class I indication (ie, it should be performed).18
Echocardiography is commonly used, and it has a 60% sensitivity to detect a thrombus.19 In patients with poorer transthoracic echocardiographic windows, contrast can be used to better delineate the left ventricular cavity and show the thrombus. Transesophageal echocardiography is seldom useful, as the left ventricular apex is foreshortened and in the far field.
A left ventricular thrombus is confirmed if an echo-dense mass with well-demarcated margins distinct from the endocardium is seen throughout the cardiac cycle. It should be evident in at least two different views (apical and short-axis) and should be adjacent to a hypokinetic or akinetic left ventricular wall. False-positive findings can occur due to misidentified false tendons, papillary muscles, and trabeculae.
Cardiac MRI with late gadolinium enhancement is now the gold standard for diagnostic imaging, as it accurately characterizes the shape, size, and location of the thrombus (Figure 3). Gadolinium contrast increases the enhancement of the ventricular cavity, thus allowing easy detection of thrombus, which appears dark. Cardiac MRI with delayed enhancement has 88% to 91% sensitivity and 99% specificity to detect left ventricular thrombosis.20,21 However, compared with echocardiography, routine cardiac MRI is time-intensive, costly, and not routinely available. As a result, it should be performed only in patients with poor acoustic windows and a high clinical suspicion of left ventricular thrombosis.
Delayed-contrast cardiac computed tomography can be used to identify left ventricular thrombosis, using absence of contrast uptake. The need to use contrast is a disadvantage, but computed tomography can be an alternative in patients with contraindications to cardiac MRI.
WHAT COMPLICATIONS ARISE FROM LEFT VENTRICULAR THROMBOSIS?
The most feared complication of left ventricular thrombosis is thromboembolism. Cardioembolic stroke is generally severe, prone to early and long-term recurrence, and associated with a higher death rate than noncardioembolic ischemic stroke.22,23 Thrombi associated with thromboembolism are often acute and mobile rather than organized and immobile.24 They may embolize to the brain, spleen, kidneys, and bowel.25 In a meta-analysis of 11 studies, the pooled odds ratio for risk of embolization was 5.45 (95% confidence interval [CI] 3.02–9.83) with left ventricular thrombi vs without.26 Before systemic thrombolysis and antiplatelet therapy became available, stroke rates ranged from 1.5% to 10%.27–29
In a meta-analysis of 22 studies from 1978 to 2004, the incidence of ischemic stroke after MI during hospitalization was around 11.1 per 1,000 MIs.30 This study found that anterior MI was associated with a higher risk of stroke, but reported no difference in the incidence of stroke with percutaneous coronary intervention, systemic thrombolysis, or no reperfusion.
In a large prospective cohort study of 2,160 patients,31 259 (12%) had a stroke after MI. In multivariable analysis, age, diabetes, and previous stroke were predictors of stroke after MI. This study reported significantly fewer strokes in patients who underwent percutaneous coronary intervention than with other or no reperfusion therapies.31
ANTICOAGULATION TREATMENT
3. How would you treat a patient who has a drug-eluting stent in the left anterior descending artery and a new diagnosis of left ventricular thrombosis?
- Warfarin
- Aspirin and clopidogrel
- Aspirin, clopidogrel, and warfarin
- Aspirin and warfarin
The management of left ventricular thrombosis has been summarized in guidelines from the American College of Chest Physicians (ACCP) in 2012,32 and from the American College of Cardiology/American Heart Association in 2013,18 which recommend anticoagulation for at least 3 months, or indefinitely if bleeding risk is low, for all patients developing a left ventricular thrombus.
For patients with acute MI and left ventricular thrombosis, the ACCP guidelines recommend warfarin with a target international normalized ratio of 2.0 to 3.0 plus dual antiplatelet therapy (eg, aspirin plus clopidogrel) for 3 months, after which warfarin is discontinued but dual antiplatelet therapy is continued for up to 12 months.32
The European Society of Cardiology guidelines33 recommend 6 months of anticoagulation. However, if the patient is receiving dual antiplatelet therapy, they recommend repeated imaging of the left ventricle after 3 months of anticoagulation, which may allow for earlier discontinuation of anticoagulation if the thrombus has resolved and apical wall motion has recovered. Therefore, most experts recommend 3 months of anticoagulation when used in combination with dual antiplatelet therapy and repeating echocardiography at 3 months to safely discontinue anticoagulation. The best answer to the question posed here is aspirin, clopidogrel, and warfarin.
Decisions about antithrombotic therapy may also depend on stent type and the patient’s bleeding risk. With bare-metal stents, dual antiplatelet therapy along with anticoagulation should be used for 1 month, after which anticoagulation should be used with a single antiplatelet agent for another 2 months; after this, the anticoagulant can be discontinued and dual antiplatelet therapy can be resumed for a total of 12 months. Newer anticoagulants such as rivaroxaban, dabigatran, edoxaban, and apixaban may also have a role, but they have not yet been studied for this indication.
Surgical thrombectomy is rarely considered now, given the known efficacy of anticoagulants in dissolving the thrombus. It was done in the past for large, mobile, or protruding left ventricular thrombi, which have a higher potential for embolization.34 Currently, it can be done under very special circumstances, such as before placement of a left ventricular assist device or if the thrombus is large, to prevent embolism.35,36
BLEEDING COMPLICATIONS WITH TRIPLE ANTITHROMBOTIC THERAPY
After stent placement, almost all patients need to be on dual antiplatelet therapy for a specified duration depending on the type and generation of stent used. Such patients end up on “triple” antithrombotic therapy (two antiplatelet drugs plus an anticoagulant), which poses a high risk of bleeding.37 Consideration needs to be given to the risks of stroke, stent thrombosis, and major bleeding when selecting the antithrombotic regimen.38 Triple antithrombotic therapy has been associated with a risk of fatal and nonfatal bleeding of 4% to 16% when used for indications such as atrial fibrillation.39–41
Risks of triple antithrombotic therapy (aspirin 80–100 mg, clopidogrel 75 mg, and warfarin) were compared with those of clopidogrel plus warfarin in the What Is the Optimal Antiplatelet and Anticoagulant therapy in Patients With Oral Anticoagulation and Coronary Stenting Trial,37 which reported a significantly lower risk of major and minor bleeding with clopidogrel-plus-warfarin therapy than with triple antithrombotic therapy, 14.3% vs 31.7% (hazard ratio 0.40, 95% CI 0.28–0.58, P < .0001).
Additionally, the increased risk of major and minor bleeding associated with triple antithrombotic therapy has been confirmed in many observational studies; other studies found a trend toward lower risk with triple therapy, but this was not statistically significant (Table 2).38,40,42–55 A large multicenter European trial is being conducted to compare dual antiplatelet therapy vs triple antithrombotic therapy in patients with left ventricular thrombosis.
CASE FOLLOW-UP
Our patient was started on warfarin, clopidogrel 75 mg, and aspirin 75 mg at the time of discharge. He was continued on warfarin for 3 months, at which time a follow-up echocardiogram showed no thrombus in the left ventricle. Warfarin was discontinued, and he had no thromboembolic complications.
TAKE-HOME POINTS
Left ventricular thrombosis after an acute MI is very important to detect, as it can lead to serious complications through arterial embolism.
The incidence of left ventricular thrombosis has declined significantly with the use of percutaneous coronary intervention. However, it may still occur in a small number of patients with larger infarcts owing to delay in revascularization or proximal (left main or left anterior descending) occlusions with larger infarct size.
Echocardiography, which is routinely performed after acute MI to assess myocardial function, uncovers most left ventricular thrombi. In high-risk cases, MRI with late gadolinium enhancement can increase the diagnostic yield.
Anticoagulation with warfarin is recommended for at least 3 months. Post-MI patients undergoing stent implantation may need triple antithrombotic therapy, which, however, increases the bleeding risk significantly. Large randomized trials are needed to guide physicians in risk stratification of such patients.
- Lip GY, Piotrponikowski P, Andreotti F, et al; Heart Failure Association (EHFA) of the European Society of Cardiology (ESC) and the ESC Working Group on Thrombosis. Thromboembolism and antithrombotic therapy for heart failure in sinus rhythm: an executive summary of a joint consensus document from the ESC Heart Failure Association and the ESC Working Group on Thrombosis. Thromb Haemost 2012; 108:1009–1022.
- Turpie AG, Robinson JG, Doyle DJ, et al. Comparison of high-dose with low-dose subcutaneous heparin to prevent left ventricular mural thrombosis in patients with acute transmural anterior myocardial infarction. N Engl J Med 1989; 320:352–357.
- Chiarella F, Santoro E, Domenicucci S, Maggioni A, Vecchio C. Predischarge two-dimensional echocardiographic evaluation of left ventricular thrombosis after acute myocardial infarction in the GISSI-3 study. Am J Cardiol 1998; 81:822–827.
- Kalra A, Jang IK. Prevalence of early left ventricular thrombus after primary coronary intervention for acute myocardial infarction. J Thromb Thrombolysis 2000; 10:133–136.
- Nayak D, Aronow WS, Sukhija R, McClung JA, Monsen CE, Belkin RN. Comparison of frequency of left ventricular thrombi in patients with anterior wall versus non-anterior wall acute myocardial infarction treated with antithrombotic and antiplatelet therapy with or without coronary revascularization. Am J Cardiol 2004; 93:1529–1530.
- Rehan A, Kanwar M, Rosman H, et al. Incidence of post myocardial infarction left ventricular thrombus formation in the era of primary percutaneous intervention and glycoprotein IIb/IIIa inhibitors. A prospective observational study. Cardiovasc Ultrasound 2006;4:20.
- Zielinska M, Kaczmarek K, Tylkowski M. Predictors of left ventricular thrombus formation in acute myocardial infarction treated with successful primary angioplasty with stenting. Am J Med Sci 2008; 335:171–176.
- Osherov AB, Borovik-Raz M, Aronson D, et al. Incidence of early left ventricular thrombus after acute anterior wall myocardial infarction in the primary coronary intervention era. Am Heart J 2009; 157:1074–1080.
- Solheim S, Seljeflot I, Lunde K, et al. Frequency of left ventricular thrombus in patients with anterior wall acute myocardial infarction treated with percutaneous coronary intervention and dual antiplatelet therapy. Am J Cardiol 2010; 106:1197–1200.
- Shacham Y, Leshem-Rubinow E, Ben Assa E, et al. Comparison of C-reactive protein and fibrinogen levels in patients having anterior wall ST-segment elevation myocardial infarction with versus without left ventricular thrombus (from a primary percutaneous coronary intervention cohort). Am J Cardiol 2013; 112:57–60.
- Gianstefani S, Douiri A, Delithanasis I, et al. Incidence and predictors of early left ventricular thrombus after ST-elevation myocardial infarction in the contemporary era of primary percutaneous coronary intervention. Am J Cardiol 2014; 113:1111–1116.
- Shacham Y, Birati EY, Rogovski O, Cogan Y, Keren G, Roth A. Left ventricular thrombus formation and bleeding complications during continuous in-hospital anticoagulation for acute anterior myocardial infarction. Isr Med Assoc J 2012; 14:742–746.
- Asinger RW, Mikell FL, Elsperger J, Hodges M. Incidence of left-ventricular thrombosis after acute transmural myocardial infarction. Serial evaluation by two-dimensional echocardiography. N Engl J Med 1981; 305:297–302.
- Nihoyannopoulos P, Smith GC, Maseri A, Foale RA. The natural history of left ventricular thrombus in myocardial infarction: a rationale in support of masterly inactivity. J Am Coll Cardiol 1989; 14:903–911.
- Weinreich DJ, Burke JF, Pauletto FJ. Left ventricular mural thrombi complicating acute myocardial infarction. Long-term follow-up with serial echocardiography. Ann Intern Med 1984; 100:789–794.
- Greaves SC, Zhi G, Lee RT, et al. Incidence and natural history of left ventricular thrombus following anterior wall acute myocardial infarction. Am J Cardiol 1997; 80:442–448.
- Solheim S, Seljeflot I, Lunde K, et al. Prothrombotic markers in patients with acute myocardial infarction and left ventricular thrombus formation treated with pci and dual antiplatelet therapy. Thromb J 2013; 11:1.
- O’Gara PT, Kushner FG, Ascheim DD, et al; American College of Cardiology Foundation/American Heart Association Task Force on Practice Guidelines. 2013 ACCF/AHA guideline for the management of ST-elevation myocardial infarction: a report of the American College of Cardiology Foundation/American Heart Association Task Force on Practice Guidelines. Circulation 2013; 127:e362–e425.
- Weinsaft JW, Kim HW, Crowley AL, et al. LV thrombus detection by routine echocardiography: insights into performance characteristics using delayed enhancement CMR. JACC Cardiovasc Imaging 2011; 4:702–712.
- Mollet NR, Dymarkowski S, Volders W, et al. Visualization of ventricular thrombi with contrast-enhanced magnetic resonance imaging in patients with ischemic heart disease. Circulation 2002; 106:2873–2876.
- Srichai MB, Junor C, Rodriguez LL, et al. Clinical, imaging, and pathological characteristics of left ventricular thrombus: a comparison of contrast-enhanced magnetic resonance imaging, transthoracic echocardiography, and transesophageal echocardiography with surgical or pathological validation. Am Heart J 2006; 152:75–84.
- Eriksson SE, Olsson JE. Survival and recurrent strokes in patients with different subtypes of stroke: a fourteen-year follow-up study. Cerebrovasc Dis 2001; 12:171–180.
- Grau AJ, Weimar C, Buggle F, et al. Risk factors, outcome, and treatment in subtypes of ischemic stroke: the German Stroke Data Bank. Stroke 2001; 32:2559–2566.
- Keren A, Goldberg S, Gottlieb S, et al. Natural history of left ventricular thrombi: their appearance and resolution in the posthospitalization period of acute myocardial infarction. J Am Coll Cardiol 1990; 15:790–800.
- Jordan RA, Miller RD, Edwards JE, Parker RL. Thrombo-embolism in acute and in healed myocardial infarction. I. Intracardiac mural thrombosis. Circulation 1952; 6:1–6.
- Vaitkus PT, Barnathan ES. Embolic potential, prevention and management of mural thrombus complicating anterior myocardial infarction: a meta-analysis. J Am Coll Cardiol 1993; 22:1004–1009.
- ISIS-2 (Second International Study of Infarct Survival) Collaborative Group. Randomised trial of intravenous streptokinase, oral aspirin, both, or neither among 17,187 cases of suspected acute myocardial infarction: ISIS-2. Lancet 1988; 2:349–360.
- Cabin HS, Roberts WC. Left ventricular aneurysm, intraaneurysmal thrombus and systemic embolus in coronary heart disease. Chest 1980; 77:586–590.
- Keating EC, Gross SA, Schlamowitz RA, et al. Mural thrombi in myocardial infarctions. Prospective evaluation by two-dimensional echocardiography. Am J Med 1983; 74:989–995.
- Witt BJ, Ballman KV, Brown RD Jr, Meverden RA, Jacobsen SJ, Roger VL. The incidence of stroke after myocardial infarction: a meta-analysis. Am J Med 2006; 119:354.e1–354.e9.
- Witt BJ, Brown RD Jr, Jacobsen SJ, Weston SA, Yawn BP, Roger VL. A community-based study of stroke incidence after myocardial infarction. Ann Intern Med 2005; 143:785–792.
- Vandvik PO, Lincoff AM, Gore JM, et al; American College of Chest Physicians. Primary and secondary prevention of cardiovascular disease: antithrombotic therapy and prevention of thrombosis, 9th ed: American College of Chest Physicians Evidence-Based Clinical Practice Guidelines. Chest 2012; 141(suppl):e637S–e68S.
- Steg G, James SK, Atar D, et al. ESC guidelines for the management of acute myocardial infarction in patients presenting with ST-segment elevation. Eur Heart J 2012; 33:2569–2619.
- Nili M, Deviri E, Jortner R, Strasberg B, Levy MJ. Surgical removal of a mobile, pedunculated left ventricular thrombus: report of 4 cases. Ann Thorac Surg 1988; 46:396–400.
- Kanemitsu S, Miyake Y, Okabe M. Surgical removal of a left ventricular thrombus associated with cardiac sarcoidosis. Interact Cardiovasc Thorac Surg 2008; 7:333–335.
- Engin C, Yagdi T, Balcioglu O, et al. Left ventricular assist device implantation in heart failure patients with a left ventricular thrombus. Transplant Proc 2013; 45:1017–1019.
- Dewilde WJ, Oirbans T, Verheugt FW, et al; WOEST study investigators. Use of clopidogrel with or without aspirin in patients taking oral anticoagulant therapy and undergoing percutaneous coronary intervention: an open-label, randomised, controlled trial. Lancet 2013; 381:1107–1115.
- Faxon DP, Eikelboom JW, Berger PB, et al. Antithrombotic therapy in patients with atrial fibrillation undergoing coronary stenting: a North American perspective: executive summary. Circ Cardiovasc Interv 2011; 4:522–534.
- Hansen ML, Sorensen R, Clausen MT, et al. Risk of bleeding with single, dual, or triple therapy with warfarin, aspirin, and clopidogrel in patients with atrial fibrillation. Arch Intern Med 2010; 170:1433–1441.
- Karjalainen PP, Porela P, Ylitalo A, et al. Safety and efficacy of combined antiplatelet-warfarin therapy after coronary stenting. Eur Heart J 2007; 28:726–732.
- Doyle BJ, Rihal CS, Gastineau DA, Holmes DR Jr. Bleeding, blood transfusion, and increased mortality after percutaneous coronary intervention: implications for contemporary practice. J Am Coll Cardiol 2009; 53:2019–2027.
- Azoulay L, Dell’Aniello S, Simon T, Renoux C, Suissa S. The concurrent use of antithrombotic therapies and the risk of bleeding in patients with atrial fibrillation. Thromb Haemost 2013; 109:431–439.
- Deshmukh A, Hilleman DE, Del Core M, Nair CK. Antithrombotic regimens in patients with indication for long-term anticoagulation undergoing coronary interventions-systematic analysis, review of literature, and implications on management. Am J Ther 2013; 20:654–663.
- Fosbol EL, Wang TY, Li S, et al. Warfarin use among older atrial fibrillation patients with non-ST-segment elevation myocardial infarction managed with coronary stenting and dual antiplatelet therapy. Am Heart J 2013; 166:864–870.
- Gao F, Zhou YJ, Wang ZJ, et al. Meta-analysis of the combination of warfarin and dual antiplatelet therapy after coronary stenting in patients with indications for chronic oral anticoagulation. Int J Cardiol 2011; 148:96–101.
- Hansen ML, Sorensen R, Clausen MT, et al. Risk of bleeding with single, dual, or triple therapy with warfarin, aspirin, and clopidogrel in patients with atrial fibrillation. Arch Intern Med 2010; 170:1433–1441.
- Hermosillo AJ, Spinler SA. Aspirin, clopidogrel, and warfarin: is the combination appropriate and effective or inappropriate and too dangerous? Ann Pharmacother 2008; 42:790–805.
- Holmes DR Jr, Kereiakes DJ, Kleiman NS, Moliterno DJ, Patti G, Grines CL. Combining antiplatelet and anticoagulant therapies. J Am Coll Cardiol 2009; 54:95–109.
- Khurram Z, Chou E, Minutello R, et al. Combination therapy with aspirin, clopidogrel and warfarin following coronary stenting is associated with a significant risk of bleeding. J Invasive Cardiol 2006; 18:162–164.
- Orford JL, Fasseas P, Melby S, et al. Safety and efficacy of aspirin, clopidogrel, and warfarin after coronary stent placement in patients with an indication for anticoagulation. Am Heart J 2004; 147:463–467.
- Porter A, Konstantino Y, Iakobishvili Z, Shachar L, Battler A, Hasdai D. Short-term triple therapy with aspirin, warfarin, and a thienopyridine among patients undergoing percutaneous coronary intervention. Catheter Cardiovasc Interv 2006; 68:56–61.
- DeEugenio D, Kolman L, DeCaro M, et al. Risk of major bleeding with concomitant dual antiplatelet therapy after percutaneous coronary intervention in patients receiving long-term warfarin therapy. Pharmacotherapy 2007; 27:691–696.
- Ruiz-Nodar JM, Marin F, Hurtado JA, et al. Anticoagulant and antiplatelet therapy use in 426 patients with atrial fibrillation undergoing percutaneous coronary intervention and stent implantation implications for bleeding risk and prognosis. J Am Coll Cardiol 2008; 51:818–825.
- Sarafoff N, Ndrepepa G, Mehilli J, et al. Aspirin and clopidogrel with or without phenprocoumon after drug eluting coronary stent placement in patients on chronic oral anticoagulation. J Intern Med 2008; 264:472–480.
- Rossini R, Musumeci GF, Lettieri CF, et al. Long-term outcomes in patients undergoing coronary stenting on dual oral antiplatelet treatment requiring oral anticoagulant therapy. Am J Cardiol 2008; 102:1618–1623.
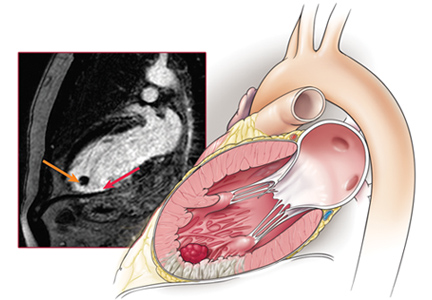
Erythrocytosis due to presumed polycythemia vera
A 40-year-old woman with hypertrophic obstructive cardiomyopathy presents to the hematology clinic for a second opinion regarding a history of headaches and fatigue for the past 10 years. She has been diagnosed with idiopathic erythrocytosis, presumed to be due to polycythemia vera. She periodically undergoes phlebotomy to keep her hematocrit below 41%, and this markedly improves her headaches. She denies shortness of breath, cough, fever, weight loss, joint pain, and visual or other neurologic symptoms. She has never reported pruritus related to bathing or exposure to water.
She does not smoke, drink alcohol, or use illicit drugs. She works as a pharmacy technician. She says her father died of cancer (no further details available) and describes a family history of gastrointestinal malignancy in her grandfather and paternal aunt. She takes aspirin, metoprolol, and spironolactone for her cardiomyopathy.
Physical examination reveals generalized plethora, more marked on her cheeks and face, and mild bilateral pitting pedal edema. No lymphadenopathy or hepatosplenomegaly can be palpated. Other systems, including the cardiac, respiratory, and nervous systems, are normal.
ERYTHROCYTOSIS AND POLYCYTHEMIA VERA
1. In patients with erythrocytosis, which of the following is not characteristic of polycythemia vera?
- Erythromelalgia and postbathing pruritus
- Splenomegaly
- History of thrombosis
- Gout
- Hematuria
Erythrocytosis—an abnormally high concentration of red blood cells in the peripheral blood—is a laboratory finding. It often reflects an increase in the total quantity or mass of red blood cells in the body (polycythemia) but can sometimes be due to decreased plasma volume (spurious polycythemia).1 Erythrocytosis can be caused by a number of diseases, hereditary and acquired, and can be classified as primary or secondary (Table 1).
Symptoms arise from an increase in the total blood volume and red blood cell mass, often leading to dilated capillaries and other blood vessels. Symptoms can occur regardless of the cause and classically include headache (often described as diffuse heaviness), dizziness, and a tendency for bleeding or thrombosis.2 Symptoms are relieved when the hematocrit is lowered.
Several features in the history and physical examination of a patient being evaluated for erythrocytosis can suggest an underlying cause. Smoking, chronic respiratory insufficiency, and congenital cyanotic heart disease point to secondary erythrocytosis and can usually be identified at the outset. A history of occupational exposure to carbon monoxide (such as engine exhaust) should be elicited carefully. A family history of erythrocytosis should raise suspicion of a heritable condition such as a hemoglobinopathy associated with increased oxygen affinity or rare forms of primary erythrocytosis associated with endogenous overproduction of erythropoietin or activating mutations of the erythropoietin receptor.3 Iatrogenic causes such as androgen supplementation, erythropoietin abuse, and postrenal-transplant erythrocytosis should also be considered.
Secretion of erythropoietin or erythropoietinlike proteins by a malignant neoplasm is a rare but important cause of erythrocytosis. For example, renal cell carcinoma may present with erythrocytosis secondary to excessive erythropoietin production, and hematuria can be an early symptom.
Polycythemia vera
Polycythemia vera, a myeloproliferative neoplasm, is characterized by increased red blood cell production independent of the mechanisms that normally regulate erythropoiesis. The bone marrow shows a panmyelosis that is often accompanied by leukocytosis or thrombocytosis, or both, in the peripheral blood.
Symptoms such as severe itching after exposure to hot water (aquagenic pruritus) and periodic attacks of redness, swelling, and pain in the hands or feet, or both (erythromelalgia), have been described in patients with polycythemia vera. Splenomegaly is relatively common, seen in approximately two-thirds of patients.4 Hyperuricemia (from increased cell turnover) and gout are also associated with polycythemia vera, as is a history of arterial and venous thrombosis.5
Hematuria is not commonly seen in polycythemia vera, although bleeding from the bladder, vagina, or uterus has been described.
CASE RESUMED: INITIAL LABORATORY TESTS
Results of our patient’s initial laboratory tests are:
- Hemoglobin 16.9 g/dL (reference range 11.5–15.5)
- Hematocrit 48.8% (36.0–46.0)
- Mean corpuscular volume 85.2 fL (80–100)
- Platelet count 328 × 109/L (150–400)
- White blood cell count 9.14 × 10⁹/L (3.7–11.0)
- Absolute neutrophil count 5.95 × 10⁹/L (1.45–7.5)
- Blood urea nitrogen 12 mg/dL (8–25)
- Creatinine 0.5 mg/dL (0.7–1.4)
- Lactate dehydrogenase 180 U/L (100–220)
- Uric acid 3.0 mg/dL (2.0–7.0)
- Thyroid-stimulating hormone 2.2 µU/mL (0.4–5.5).
The patient undergoes additional tests, including a serum erythropoietin level and hemoglobinopathy screen. Bone marrow aspiration and biopsy are performed, with cytogenetic analysis, chromosomal microarray analysis, and molecular testing for mutation of the Janus kinase 2 (JAK2) gene.
CONFIRMING SUSPECTED POLYCYTHEMIA VERA
2. In patients with suspected polycythemia vera, which of the following laboratory tests is most useful in making the diagnosis?
- Hemoglobin, hematocrit, and red blood cell mass
- Serum erythropoietin level
- Arterial blood gases with co-oximetry
- Testing for the JAK2 mutation
- Bone marrow aspiration and biopsy
The aim of the initial workup of erythrocytosis is to differentiate polycythemia vera from secondary causes of erythrocytosis.
Hemoglobin, hematocrit, red cell mass
Erythrocytosis is defined by an abnormal elevation in the hematocrit (> 48% in women or > 49% in men), hemoglobin concentration (> 16.0 g/dL in women or > 16.5 g/dL in men), or red blood cell mass. The red blood cell count should not be used as a surrogate for red blood cell mass, since some anemias (especially thalassemia minor) can be associated with an increase in the number of red blood cells but a low hemoglobin concentration.
Isotope dilution techniques to determine the red cell mass and plasma volume can differentiate true erythrocytosis from a spurious elevation due to a decrease in plasma volume.6,7 However, this is an expensive, time-consuming test that is not widely available and so is rarely performed.8
JAK2 mutation testing
The initial evaluation of a patient with erythrocytosis has changed significantly in the past 10 years with the discovery of the JAK2 gene and its role in the pathogenesis of polycythemia vera and other myeloproliferative neoplasms.
JAK2, located at 9p24, codes for a tyrosine kinase important for signal transduction in hematopoietic cells. Mutations in this gene have been shown to promote hypersensitivity to cytokines, including erythropoietin.9 The most common somatic mutation occurs within exon 14 at base pair 1849 and results in a phenylalanine-for-valine amino acid substitution in the JAK2 protein, designated V617F. Less commonly, mutations occur elsewhere in exons 12 to 15, with more than 50 different mutations described; nonpolymorphic mutations are assumed to have biologic effects similar to those of V617F.
Taken together, the JAK2 V617F and non-V617F mutations have a diagnostic sensitivity of 98% to 100% for polycythemia vera. For practical purposes, this means that the presence of a JAK2 mutation can be used as a clonal marker to distinguish polycythemia vera from reactive secondary causes of erythrocytosis. A JAK2 mutation is one of three major diagnostic criteria for polycythemia vera in the 2016 revision to the 2008 World Health Organization criteria (Table 2).10 Of note, this mutation is not specific for polycythemia vera and can also be found in other myeloproliferative neoplasms, including primary myelofibrosis and essential thrombocythemia.
Absence of a JAK2 mutation makes polycythemia vera unlikely, so this test is most useful in making the diagnosis.
Serum erythropoietin
Serum erythropoietin testing can be very useful to distinguish polycythemia vera from secondary erythrocytosis. Low levels suggest polycythemia vera, while high levels are seen in secondary processes.11
This test is best used along with JAK2 V617F mutation analysis as an initial step in evaluating patients with erythrocytosis. When JAK2 V617F mutation analysis is negative, a low serum erythropoietin level should prompt further testing for non-V617F JAK2 mutations, whereas a normal or elevated erythropoietin level should be evaluated further with tests to distinguish hereditary from acquired secondary causes of erythrocytosis.
Arterial blood gas analysis and co-oximetry
Arterial blood gas analysis can reveal hypoxemia, pointing to a cardiorespiratory process driving the erythrocytosis, whereas co-oximetry can be used to identify the presence and amount of carboxyhemoglobin in the blood.
Bone marrow biopsy
An increase in pleomorphic megakaryocytes in the bone marrow without stainable iron is often described as characteristic in polycythemia vera patients, but it is not diagnostic. Panmyelosis with increased cellularity is the norm but can be seen in other myeloproliferative neoplasms. The morphologic features of bone marrow are now included as one of the major diagnostic criteria for polycythemia vera (Table 2).
OUR PATIENT’S FURTHER WORKUP
Our patient’s erythropoietin level is 34.2 mIU/mL (reference range 4.7–28.6). Her oxygen saturation is 96%, and her carboxyhemoglobin level is 1.1% (0–5).
She undergoes bone marrow biopsy. Analysis finds that the marrow is normocellular (60%) with trilineage hematopoiesis and decreased stainable iron.
Cytogenetic analysis shows a 46,XX[20] karyotype. Chromosomal microarray analysis shows no pathogenic copy-number changes. There is no detectable JAK2 V617F or exon 12-to-15 mutation.
The patient’s erythrocytosis and abnormal hemoglobin electrophoresis study raise suspicion for a variant type of hemoglobin that has a higher affinity for oxygen than normal.
3. What is the next best step to evaluate this patient?
- Red-cell oxygen equilibrium curve to calculate the P50 (the partial pressure of oxygen that is required to saturate 50% of the hemoglobin.)
- High-performance liquid chromatography
- Globin gene DNA sequencing
- Testing 2,3-bisphosphoglycerate mutase (BPGM) activity
Nearly 200 mutational variants in alpha and beta globin chains that lead to an increased affinity of hemoglobin for oxygen have been reported.12 While not all mutations are clinically significant, increased oxygen affinity variants can lead to impaired oxygen delivery to tissues, especially the kidneys, resulting in a physiologic increase in erythropoietin and erythrocytosis.
In patients being evaluated for a high-oxygen-affinity hemoglobinopathy, a two-step approach has been outlined.13 The first involves measuring the oxygen-binding properties of a freshly collected sample of blood by directly measuring the oxygen saturation of the hemoglobin and pO2 using a co-oximeter. This information is used to create a red cell oxygen equilibrium curve and to calculate the P50. A low P50 correlates with an abnormally high affinity of hemoglobin for oxygen.
The second step is to identify the abnormal hemoglobin. High-performance liquid chromatography is now widely available as a screening test but does not detect all variants. For many years, sequencing of globin chain DNA has been a gold standard for identifying specific mutations. Subsequent to analyzing a catalog of known hemoglobin variants, mass spectrometry can serve as a screening and identification technique. Mass spectroscopy can also detect known rare variants with posttranslational modifications14 that are not recognized by DNA analysis. Mass spectroscopy and DNA sequencing are complementary techniques available only in specialized reference laboratories.
Erythrocytosis due to BPGM deficiency is very rare. Clinical and laboratory features mimic those of high-oxygen-affinity hemoglobin, but patients do not have a demonstrable mutation in alpha or beta globin genes. The level of BPGM is low, and the diagnosis is established by measuring BPGM levels and sequencing the BPGM gene.15
RESULTS OF THE ADDITIONAL WORKUP
In our patient, hemoglobin electrophoresis reveals an abnormal hemoglobin variant. High-performance liquid chromatography reveals an abnormal peak that comprises approximately 23.7% of the total hemoglobin, consistent with an alpha globin variant. Further characterization (using a sample of venous blood) shows an oxygen dissociation P50 of 22 mm Hg (normal 24–30 mm Hg) (Figure 1).
Mass spectrometry identifies the variant as hemoglobin Tarrant. This variant is characterized by a substitution of asparagine for aspartic acid at position 126 of the alpha globin chain, a known site of contact between the alpha 1 and beta 1 chains.16 It has been seen in patients of Hispanic heritage and clinically correlates with mild erythrocytosis. Indeed, this woman’s mother was from Mexico.
EDUCATING PATIENTS
4. What should patients know about their high-oxygen-affinity hemoglobinopathy?
- High altitudes and air travel can be risky
- Pregnancy may have adverse outcomes
- Systemic anticoagulation may lower the risk of venous thromboembolism
- Periodic phlebotomy may help control symptoms
Most patients with high-oxygen-affinity hemoglobin do not require specific clinical management but only counseling and education about their condition. Establishing an accurate diagnosis is important in order to avoid further inappropriate, invasive, and expensive testing.
Although exposure to high altitudes may be associated with decreased ambient oxygen levels, hypoxia is usually not a problem because of hemoglobin’s high affinity for oxygen.
Impaired delivery of oxygen across the placenta may be anticipated in a mother with high-oxygen-affinity hemoglobin, but this has not been observed clinically.17
Compared with patients with polycythemia vera, patients with high-oxygen-affinity hemoglobin have fewer complications from hyperviscosity and thrombosis, even with comparable degrees of erythrocytosis.
Although patients usually do not require treatment, phlebotomy may be helpful for symptoms that can be attributed to the higher hemoglobin concentration.
Our patient continues to be seen in clinic for periodic blood counts and phlebotomy for her headaches, as required.
HEMOGLOBIN: RELAXED OR TENSE
Normal adult hemoglobin is a tetramer composed of two pairs of globin polypeptide chains: alpha and beta (Figure 2). The intrinsic properties of the constituent globin chains and their allosteric conformation—as well as extrinsic factors including temperature, pH, and the binding of hydrogen ion and 2,3-BPG—play important roles in modifying the affinity of hemoglobin for oxygen. The major modulator of hemoglobin-oxygen affinity in human erythrocytes is 2,3-BPG.
The hemoglobin tetramer, consisting of two identical halves, alpha 1-beta 1 and alpha 2-beta 2, oscillates between two quaternary conformations, “relaxed” (fully oxygenated) and “tense” (fully deoxygenated).18 High-oxygen-affinity hemoglobins can result from factors that enhance the relaxed state, either by stabilizing the relaxed state or by destabilizing the tense state. Structural modifications in hemoglobin typically affect the main contacts involved in the transition from the deoxygenated to the oxygenated state, the 2,3-BPG binding sites, the heme pocket, or elongation of globin chains by various mutations. In hemoglobin Tarrant, the mutation prevents formation of noncovalent salt bridges in the alpha 1-beta 1 contact that normally stabilize the deoxygenated conformation of hemoglobin. As a result, the deoxygenated (tense) state is destabilized, shifting the allosteric equilibrium in favor of the oxygenated (relaxed) state with consequent high oxygen affinity.16
MORE ABOUT HIGH-OXYGEN-AFFINITY HEMOGLOBINS
The first case of erythrocytosis due to an abnormal hemoglobin was identified in 1966. This was an alpha chain variant with an arginine-to-leucine substitution at position 92, named hemoglobin Chesapeake.19
High-oxygen-affinity hemoglobin variants are usually transmitted as autosomal dominant traits. Patients are most often identified because of unexplained erythrocytosis detected on a routine blood cell count, as in our patient.
Not all high-oxygen-affinity hemoglobinopathies are associated with erythrocytosis. The degree of increased oxygen affinity may only be mild or the abnormal hemoglobin may be slightly unstable, thereby masking the usual clinical signs and symptoms.
Therapeutic phlebotomy should be used cautiously since it can decrease delivery of oxygen to tissues. A subset of patients whose symptoms are related to an elevated red cell mass may experience some relief, as did our patient.
- Kremyanskaya M, Mascarenhas J, Hoffman R. Why does my patient have erythrocytosis? Hematol Oncol Clin North Am 2012; 26:267–283.
- Keohane C, McMullin MF, Harrison C. The diagnosis and management of erythrocytosis. BMJ 2013; 347:f6667.
- Agarwal N, Gordeuk RV, Prchal JT. Genetic mechanisms underlying regulation of hemoglobin mass. Adv Exp Med Biol 2007; 618:195–210.
- Tefferi A. Polycythemia vera and essential thrombocythemia: 2012 update on diagnosis, risk stratification, and management. Am J Hematol 2012; 87:285–293.
- Landolfi R, Di Gennaro L, Falanga A. Thrombosis in myeloproliferative disorders: pathogenetic facts and speculation. Leukemia 2008; 22:2020–2028.
- Tefferi A, Spivak JL. Polycythemia vera: scientific advances and current practice. Semin Hematol 2005; 42:206–220.
- Ferrant A. What clinical and laboratory data are indicative of polycythemia and when are blood volume studies needed? Nouv Rev Fr Hematol 1994; 36:151–154.
- Fairbanks VF, Klee GG, Wiseman GA, et al. Measurement of blood volume and red cell mass: re-examination of 51Cr and 125I methods. Blood Cells Mol Dis 1996; 22:169–186; discussion 186a–186g.
- James C, Ugo V, Le Couédic JP, et al. A unique clonal JAK2 mutation leading to constitutive signalling causes polycythaemia vera. Nature 2005; 434:1144–1148.
- Arber DA, Orazi A, Hasserjian R, et al. The 2016 revision to the World Health Organization classification of myeloid neoplasms and acute leukemia. Blood 2016; 127:2391–2405.
- Messinezy M, Westwood NB, El-Hemaidi I, Marsden JT, Sherwood RS, Pearson TC. Serum erythropoietin values in erythrocytosis and in primary thrombocythaemia. Br J Haematol 2002; 117:47–53.
- Hardison RC, Chui DHK, Giardine B, et al. HbVar: a relational database of human hemoglobin variants and thalassemia mutations at the globin gene server. Human Mutat 2002; 19:225–233.
- Percy MJ, Butt NN, Crotty GM, et al. Identification of high oxygen affinity hemoglobin variants in the investigation of patients with erythrocytosis. Haematologica 2009; 94:1321–1322.
- Kattamis AC, Kelly KM, Ohene-Frempong K, et al. Hb Osler [beta 145(HC2)Tyr-->Asp] results from posttranslational modification. Hemoglobin 1997; 21:109–120.
- Hoyer JD, Allen SL, Beutler E, Kubik K, West C, Fairbanks VF. Erythrocytosis due to bisphosphoglycerate mutase deficiency with concurrent glucose-6-phosphate dehydrogenase (G-6-PD) deficiency. Am J Hematol 2004; 75:205–208.
- Moo-Penn WF, Jue DL, Johnson MH, Wilson SM, Therrell B Jr, Schmidt RM. Hemoglobin Tarrant: alpha126(H9) asp leads to asn. A new hemoglobin variant in the alpha1beta1 contact region showing high oxygen affinity and reduced cooperativity. Biochim Biophys Acta 1977; 490:443–451.
- Bard H, Peri KG, Gagnon C. The biologic implications of a rare hemoglobin mutant that decreases oxygen affinity. Pediatr Res 2001; 49:69–73.
- Wajcman H, Galacteros F. Hemoglobins with high oxygen affinity leading to erythrocytosis: new variants and concepts. Hemoglobin 2005; 29:91–106.
- Clegg JB, Naughton MA, Weatherall DJ. Abnormal human haemoglobins. Separation and characterization of the alpha and beta chains by chromatography, and the determination of two new variants, hb Chesapeak and hb J (Bangkok). J Mol Biol 1966; 19:91–108.
A 40-year-old woman with hypertrophic obstructive cardiomyopathy presents to the hematology clinic for a second opinion regarding a history of headaches and fatigue for the past 10 years. She has been diagnosed with idiopathic erythrocytosis, presumed to be due to polycythemia vera. She periodically undergoes phlebotomy to keep her hematocrit below 41%, and this markedly improves her headaches. She denies shortness of breath, cough, fever, weight loss, joint pain, and visual or other neurologic symptoms. She has never reported pruritus related to bathing or exposure to water.
She does not smoke, drink alcohol, or use illicit drugs. She works as a pharmacy technician. She says her father died of cancer (no further details available) and describes a family history of gastrointestinal malignancy in her grandfather and paternal aunt. She takes aspirin, metoprolol, and spironolactone for her cardiomyopathy.
Physical examination reveals generalized plethora, more marked on her cheeks and face, and mild bilateral pitting pedal edema. No lymphadenopathy or hepatosplenomegaly can be palpated. Other systems, including the cardiac, respiratory, and nervous systems, are normal.
ERYTHROCYTOSIS AND POLYCYTHEMIA VERA
1. In patients with erythrocytosis, which of the following is not characteristic of polycythemia vera?
- Erythromelalgia and postbathing pruritus
- Splenomegaly
- History of thrombosis
- Gout
- Hematuria
Erythrocytosis—an abnormally high concentration of red blood cells in the peripheral blood—is a laboratory finding. It often reflects an increase in the total quantity or mass of red blood cells in the body (polycythemia) but can sometimes be due to decreased plasma volume (spurious polycythemia).1 Erythrocytosis can be caused by a number of diseases, hereditary and acquired, and can be classified as primary or secondary (Table 1).
Symptoms arise from an increase in the total blood volume and red blood cell mass, often leading to dilated capillaries and other blood vessels. Symptoms can occur regardless of the cause and classically include headache (often described as diffuse heaviness), dizziness, and a tendency for bleeding or thrombosis.2 Symptoms are relieved when the hematocrit is lowered.
Several features in the history and physical examination of a patient being evaluated for erythrocytosis can suggest an underlying cause. Smoking, chronic respiratory insufficiency, and congenital cyanotic heart disease point to secondary erythrocytosis and can usually be identified at the outset. A history of occupational exposure to carbon monoxide (such as engine exhaust) should be elicited carefully. A family history of erythrocytosis should raise suspicion of a heritable condition such as a hemoglobinopathy associated with increased oxygen affinity or rare forms of primary erythrocytosis associated with endogenous overproduction of erythropoietin or activating mutations of the erythropoietin receptor.3 Iatrogenic causes such as androgen supplementation, erythropoietin abuse, and postrenal-transplant erythrocytosis should also be considered.
Secretion of erythropoietin or erythropoietinlike proteins by a malignant neoplasm is a rare but important cause of erythrocytosis. For example, renal cell carcinoma may present with erythrocytosis secondary to excessive erythropoietin production, and hematuria can be an early symptom.
Polycythemia vera
Polycythemia vera, a myeloproliferative neoplasm, is characterized by increased red blood cell production independent of the mechanisms that normally regulate erythropoiesis. The bone marrow shows a panmyelosis that is often accompanied by leukocytosis or thrombocytosis, or both, in the peripheral blood.
Symptoms such as severe itching after exposure to hot water (aquagenic pruritus) and periodic attacks of redness, swelling, and pain in the hands or feet, or both (erythromelalgia), have been described in patients with polycythemia vera. Splenomegaly is relatively common, seen in approximately two-thirds of patients.4 Hyperuricemia (from increased cell turnover) and gout are also associated with polycythemia vera, as is a history of arterial and venous thrombosis.5
Hematuria is not commonly seen in polycythemia vera, although bleeding from the bladder, vagina, or uterus has been described.
CASE RESUMED: INITIAL LABORATORY TESTS
Results of our patient’s initial laboratory tests are:
- Hemoglobin 16.9 g/dL (reference range 11.5–15.5)
- Hematocrit 48.8% (36.0–46.0)
- Mean corpuscular volume 85.2 fL (80–100)
- Platelet count 328 × 109/L (150–400)
- White blood cell count 9.14 × 10⁹/L (3.7–11.0)
- Absolute neutrophil count 5.95 × 10⁹/L (1.45–7.5)
- Blood urea nitrogen 12 mg/dL (8–25)
- Creatinine 0.5 mg/dL (0.7–1.4)
- Lactate dehydrogenase 180 U/L (100–220)
- Uric acid 3.0 mg/dL (2.0–7.0)
- Thyroid-stimulating hormone 2.2 µU/mL (0.4–5.5).
The patient undergoes additional tests, including a serum erythropoietin level and hemoglobinopathy screen. Bone marrow aspiration and biopsy are performed, with cytogenetic analysis, chromosomal microarray analysis, and molecular testing for mutation of the Janus kinase 2 (JAK2) gene.
CONFIRMING SUSPECTED POLYCYTHEMIA VERA
2. In patients with suspected polycythemia vera, which of the following laboratory tests is most useful in making the diagnosis?
- Hemoglobin, hematocrit, and red blood cell mass
- Serum erythropoietin level
- Arterial blood gases with co-oximetry
- Testing for the JAK2 mutation
- Bone marrow aspiration and biopsy
The aim of the initial workup of erythrocytosis is to differentiate polycythemia vera from secondary causes of erythrocytosis.
Hemoglobin, hematocrit, red cell mass
Erythrocytosis is defined by an abnormal elevation in the hematocrit (> 48% in women or > 49% in men), hemoglobin concentration (> 16.0 g/dL in women or > 16.5 g/dL in men), or red blood cell mass. The red blood cell count should not be used as a surrogate for red blood cell mass, since some anemias (especially thalassemia minor) can be associated with an increase in the number of red blood cells but a low hemoglobin concentration.
Isotope dilution techniques to determine the red cell mass and plasma volume can differentiate true erythrocytosis from a spurious elevation due to a decrease in plasma volume.6,7 However, this is an expensive, time-consuming test that is not widely available and so is rarely performed.8
JAK2 mutation testing
The initial evaluation of a patient with erythrocytosis has changed significantly in the past 10 years with the discovery of the JAK2 gene and its role in the pathogenesis of polycythemia vera and other myeloproliferative neoplasms.
JAK2, located at 9p24, codes for a tyrosine kinase important for signal transduction in hematopoietic cells. Mutations in this gene have been shown to promote hypersensitivity to cytokines, including erythropoietin.9 The most common somatic mutation occurs within exon 14 at base pair 1849 and results in a phenylalanine-for-valine amino acid substitution in the JAK2 protein, designated V617F. Less commonly, mutations occur elsewhere in exons 12 to 15, with more than 50 different mutations described; nonpolymorphic mutations are assumed to have biologic effects similar to those of V617F.
Taken together, the JAK2 V617F and non-V617F mutations have a diagnostic sensitivity of 98% to 100% for polycythemia vera. For practical purposes, this means that the presence of a JAK2 mutation can be used as a clonal marker to distinguish polycythemia vera from reactive secondary causes of erythrocytosis. A JAK2 mutation is one of three major diagnostic criteria for polycythemia vera in the 2016 revision to the 2008 World Health Organization criteria (Table 2).10 Of note, this mutation is not specific for polycythemia vera and can also be found in other myeloproliferative neoplasms, including primary myelofibrosis and essential thrombocythemia.
Absence of a JAK2 mutation makes polycythemia vera unlikely, so this test is most useful in making the diagnosis.
Serum erythropoietin
Serum erythropoietin testing can be very useful to distinguish polycythemia vera from secondary erythrocytosis. Low levels suggest polycythemia vera, while high levels are seen in secondary processes.11
This test is best used along with JAK2 V617F mutation analysis as an initial step in evaluating patients with erythrocytosis. When JAK2 V617F mutation analysis is negative, a low serum erythropoietin level should prompt further testing for non-V617F JAK2 mutations, whereas a normal or elevated erythropoietin level should be evaluated further with tests to distinguish hereditary from acquired secondary causes of erythrocytosis.
Arterial blood gas analysis and co-oximetry
Arterial blood gas analysis can reveal hypoxemia, pointing to a cardiorespiratory process driving the erythrocytosis, whereas co-oximetry can be used to identify the presence and amount of carboxyhemoglobin in the blood.
Bone marrow biopsy
An increase in pleomorphic megakaryocytes in the bone marrow without stainable iron is often described as characteristic in polycythemia vera patients, but it is not diagnostic. Panmyelosis with increased cellularity is the norm but can be seen in other myeloproliferative neoplasms. The morphologic features of bone marrow are now included as one of the major diagnostic criteria for polycythemia vera (Table 2).
OUR PATIENT’S FURTHER WORKUP
Our patient’s erythropoietin level is 34.2 mIU/mL (reference range 4.7–28.6). Her oxygen saturation is 96%, and her carboxyhemoglobin level is 1.1% (0–5).
She undergoes bone marrow biopsy. Analysis finds that the marrow is normocellular (60%) with trilineage hematopoiesis and decreased stainable iron.
Cytogenetic analysis shows a 46,XX[20] karyotype. Chromosomal microarray analysis shows no pathogenic copy-number changes. There is no detectable JAK2 V617F or exon 12-to-15 mutation.
The patient’s erythrocytosis and abnormal hemoglobin electrophoresis study raise suspicion for a variant type of hemoglobin that has a higher affinity for oxygen than normal.
3. What is the next best step to evaluate this patient?
- Red-cell oxygen equilibrium curve to calculate the P50 (the partial pressure of oxygen that is required to saturate 50% of the hemoglobin.)
- High-performance liquid chromatography
- Globin gene DNA sequencing
- Testing 2,3-bisphosphoglycerate mutase (BPGM) activity
Nearly 200 mutational variants in alpha and beta globin chains that lead to an increased affinity of hemoglobin for oxygen have been reported.12 While not all mutations are clinically significant, increased oxygen affinity variants can lead to impaired oxygen delivery to tissues, especially the kidneys, resulting in a physiologic increase in erythropoietin and erythrocytosis.
In patients being evaluated for a high-oxygen-affinity hemoglobinopathy, a two-step approach has been outlined.13 The first involves measuring the oxygen-binding properties of a freshly collected sample of blood by directly measuring the oxygen saturation of the hemoglobin and pO2 using a co-oximeter. This information is used to create a red cell oxygen equilibrium curve and to calculate the P50. A low P50 correlates with an abnormally high affinity of hemoglobin for oxygen.
The second step is to identify the abnormal hemoglobin. High-performance liquid chromatography is now widely available as a screening test but does not detect all variants. For many years, sequencing of globin chain DNA has been a gold standard for identifying specific mutations. Subsequent to analyzing a catalog of known hemoglobin variants, mass spectrometry can serve as a screening and identification technique. Mass spectroscopy can also detect known rare variants with posttranslational modifications14 that are not recognized by DNA analysis. Mass spectroscopy and DNA sequencing are complementary techniques available only in specialized reference laboratories.
Erythrocytosis due to BPGM deficiency is very rare. Clinical and laboratory features mimic those of high-oxygen-affinity hemoglobin, but patients do not have a demonstrable mutation in alpha or beta globin genes. The level of BPGM is low, and the diagnosis is established by measuring BPGM levels and sequencing the BPGM gene.15
RESULTS OF THE ADDITIONAL WORKUP
In our patient, hemoglobin electrophoresis reveals an abnormal hemoglobin variant. High-performance liquid chromatography reveals an abnormal peak that comprises approximately 23.7% of the total hemoglobin, consistent with an alpha globin variant. Further characterization (using a sample of venous blood) shows an oxygen dissociation P50 of 22 mm Hg (normal 24–30 mm Hg) (Figure 1).
Mass spectrometry identifies the variant as hemoglobin Tarrant. This variant is characterized by a substitution of asparagine for aspartic acid at position 126 of the alpha globin chain, a known site of contact between the alpha 1 and beta 1 chains.16 It has been seen in patients of Hispanic heritage and clinically correlates with mild erythrocytosis. Indeed, this woman’s mother was from Mexico.
EDUCATING PATIENTS
4. What should patients know about their high-oxygen-affinity hemoglobinopathy?
- High altitudes and air travel can be risky
- Pregnancy may have adverse outcomes
- Systemic anticoagulation may lower the risk of venous thromboembolism
- Periodic phlebotomy may help control symptoms
Most patients with high-oxygen-affinity hemoglobin do not require specific clinical management but only counseling and education about their condition. Establishing an accurate diagnosis is important in order to avoid further inappropriate, invasive, and expensive testing.
Although exposure to high altitudes may be associated with decreased ambient oxygen levels, hypoxia is usually not a problem because of hemoglobin’s high affinity for oxygen.
Impaired delivery of oxygen across the placenta may be anticipated in a mother with high-oxygen-affinity hemoglobin, but this has not been observed clinically.17
Compared with patients with polycythemia vera, patients with high-oxygen-affinity hemoglobin have fewer complications from hyperviscosity and thrombosis, even with comparable degrees of erythrocytosis.
Although patients usually do not require treatment, phlebotomy may be helpful for symptoms that can be attributed to the higher hemoglobin concentration.
Our patient continues to be seen in clinic for periodic blood counts and phlebotomy for her headaches, as required.
HEMOGLOBIN: RELAXED OR TENSE
Normal adult hemoglobin is a tetramer composed of two pairs of globin polypeptide chains: alpha and beta (Figure 2). The intrinsic properties of the constituent globin chains and their allosteric conformation—as well as extrinsic factors including temperature, pH, and the binding of hydrogen ion and 2,3-BPG—play important roles in modifying the affinity of hemoglobin for oxygen. The major modulator of hemoglobin-oxygen affinity in human erythrocytes is 2,3-BPG.
The hemoglobin tetramer, consisting of two identical halves, alpha 1-beta 1 and alpha 2-beta 2, oscillates between two quaternary conformations, “relaxed” (fully oxygenated) and “tense” (fully deoxygenated).18 High-oxygen-affinity hemoglobins can result from factors that enhance the relaxed state, either by stabilizing the relaxed state or by destabilizing the tense state. Structural modifications in hemoglobin typically affect the main contacts involved in the transition from the deoxygenated to the oxygenated state, the 2,3-BPG binding sites, the heme pocket, or elongation of globin chains by various mutations. In hemoglobin Tarrant, the mutation prevents formation of noncovalent salt bridges in the alpha 1-beta 1 contact that normally stabilize the deoxygenated conformation of hemoglobin. As a result, the deoxygenated (tense) state is destabilized, shifting the allosteric equilibrium in favor of the oxygenated (relaxed) state with consequent high oxygen affinity.16
MORE ABOUT HIGH-OXYGEN-AFFINITY HEMOGLOBINS
The first case of erythrocytosis due to an abnormal hemoglobin was identified in 1966. This was an alpha chain variant with an arginine-to-leucine substitution at position 92, named hemoglobin Chesapeake.19
High-oxygen-affinity hemoglobin variants are usually transmitted as autosomal dominant traits. Patients are most often identified because of unexplained erythrocytosis detected on a routine blood cell count, as in our patient.
Not all high-oxygen-affinity hemoglobinopathies are associated with erythrocytosis. The degree of increased oxygen affinity may only be mild or the abnormal hemoglobin may be slightly unstable, thereby masking the usual clinical signs and symptoms.
Therapeutic phlebotomy should be used cautiously since it can decrease delivery of oxygen to tissues. A subset of patients whose symptoms are related to an elevated red cell mass may experience some relief, as did our patient.
- Kremyanskaya M, Mascarenhas J, Hoffman R. Why does my patient have erythrocytosis? Hematol Oncol Clin North Am 2012; 26:267–283.
- Keohane C, McMullin MF, Harrison C. The diagnosis and management of erythrocytosis. BMJ 2013; 347:f6667.
- Agarwal N, Gordeuk RV, Prchal JT. Genetic mechanisms underlying regulation of hemoglobin mass. Adv Exp Med Biol 2007; 618:195–210.
- Tefferi A. Polycythemia vera and essential thrombocythemia: 2012 update on diagnosis, risk stratification, and management. Am J Hematol 2012; 87:285–293.
- Landolfi R, Di Gennaro L, Falanga A. Thrombosis in myeloproliferative disorders: pathogenetic facts and speculation. Leukemia 2008; 22:2020–2028.
- Tefferi A, Spivak JL. Polycythemia vera: scientific advances and current practice. Semin Hematol 2005; 42:206–220.
- Ferrant A. What clinical and laboratory data are indicative of polycythemia and when are blood volume studies needed? Nouv Rev Fr Hematol 1994; 36:151–154.
- Fairbanks VF, Klee GG, Wiseman GA, et al. Measurement of blood volume and red cell mass: re-examination of 51Cr and 125I methods. Blood Cells Mol Dis 1996; 22:169–186; discussion 186a–186g.
- James C, Ugo V, Le Couédic JP, et al. A unique clonal JAK2 mutation leading to constitutive signalling causes polycythaemia vera. Nature 2005; 434:1144–1148.
- Arber DA, Orazi A, Hasserjian R, et al. The 2016 revision to the World Health Organization classification of myeloid neoplasms and acute leukemia. Blood 2016; 127:2391–2405.
- Messinezy M, Westwood NB, El-Hemaidi I, Marsden JT, Sherwood RS, Pearson TC. Serum erythropoietin values in erythrocytosis and in primary thrombocythaemia. Br J Haematol 2002; 117:47–53.
- Hardison RC, Chui DHK, Giardine B, et al. HbVar: a relational database of human hemoglobin variants and thalassemia mutations at the globin gene server. Human Mutat 2002; 19:225–233.
- Percy MJ, Butt NN, Crotty GM, et al. Identification of high oxygen affinity hemoglobin variants in the investigation of patients with erythrocytosis. Haematologica 2009; 94:1321–1322.
- Kattamis AC, Kelly KM, Ohene-Frempong K, et al. Hb Osler [beta 145(HC2)Tyr-->Asp] results from posttranslational modification. Hemoglobin 1997; 21:109–120.
- Hoyer JD, Allen SL, Beutler E, Kubik K, West C, Fairbanks VF. Erythrocytosis due to bisphosphoglycerate mutase deficiency with concurrent glucose-6-phosphate dehydrogenase (G-6-PD) deficiency. Am J Hematol 2004; 75:205–208.
- Moo-Penn WF, Jue DL, Johnson MH, Wilson SM, Therrell B Jr, Schmidt RM. Hemoglobin Tarrant: alpha126(H9) asp leads to asn. A new hemoglobin variant in the alpha1beta1 contact region showing high oxygen affinity and reduced cooperativity. Biochim Biophys Acta 1977; 490:443–451.
- Bard H, Peri KG, Gagnon C. The biologic implications of a rare hemoglobin mutant that decreases oxygen affinity. Pediatr Res 2001; 49:69–73.
- Wajcman H, Galacteros F. Hemoglobins with high oxygen affinity leading to erythrocytosis: new variants and concepts. Hemoglobin 2005; 29:91–106.
- Clegg JB, Naughton MA, Weatherall DJ. Abnormal human haemoglobins. Separation and characterization of the alpha and beta chains by chromatography, and the determination of two new variants, hb Chesapeak and hb J (Bangkok). J Mol Biol 1966; 19:91–108.
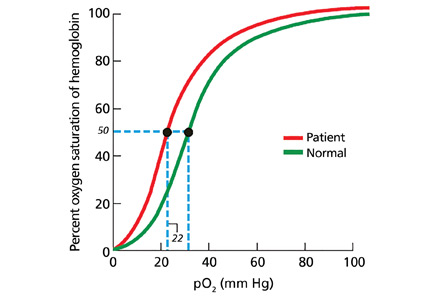
Renal failure in HCV cirrhosis
A 54-year-old man with a history of cirrhosis secondary to hepatitis C virus (HCV) infection has had a progressive decline in kidney function. He was diagnosed with hepatitis C 15 years ago; he tried interferon treatment, but this failed. He received a transjugular intrahepatic shunt 10 years ago after an episode of esophageal variceal bleeding. He has since been taking furosemide and spironolactone as maintenance treatment for ascites, and he has no other medical concerns such as hypertension or diabetes.
Two weeks ago, routine laboratory tests in the clinic showed that his serum creatinine level had increased from baseline. He was asked to stop his diuretics and increase his fluid intake. Nevertheless, his kidney function continued to decline (Table 1), and he was admitted to the hospital for further evaluation.
On admission, he appeared comfortable. He denied recent use of any medications, including nonsteroidal anti-inflammatory drugs, antibiotics, and diuretics, and he had no genitourinary symptoms. His temperature was normal, blood pressure 170/90 mm Hg, pulse rate 72 per minute, and respiratory rate 16. His skin and sclerae were not jaundiced; his abdomen was not tender, but it was grossly distended with ascites. He also had +3 pedal edema (on a scale of 4) extending to both knees. The rest of his physical examination was unremarkable. Results of further laboratory tests are shown in in Table 2.
Ultrasonography of the liver demonstrated cirrhosis with patent flow through the shunt, and ultrasonography of the kidneys showed that both were slightly enlarged with increased cortical echogenicity but no hydronephrosis or obstruction.
EXPLORING THE CAUSE OF RENAL FAILURE
1. Given this information, what is the likely cause of our patient’s renal failure?
- Volume depletion
- Acute tubular necrosis
- Hepatorenal syndrome
- HCV glomerulopathy
Renal failure is a common complication in cirrhosis and portends a higher risk of death.1 The differential diagnosis is broad, but a systematic approach incorporating data from the history, physical examination, and laboratory tests can help identify the cause and is essential in determining the prognosis and proper treatment.
Volume depletion
Volume depletion is a common cause of renal failure in cirrhotic patients. Common precipitants are excessive diuresis and gastrointestinal fluid loss from bleeding, vomiting, and diarrhea. Despite having ascites and edema, patients may have low fluid volume in the vascular space. Therefore, the first step in a patient with acute kidney injury is to withhold diuretics and give fluids. The renal failure usually rapidly reverses if the patient does not have renal parenchymal disease.2
Our patient did not present with any fluid losses, and his high blood pressure and normal heart rate did not suggest volume depletion. And most importantly, withholding his diuretics and giving fluids did not reverse his renal failure. Thus, volume depletion was an unlikely cause.
Acute tubular necrosis
The altered hemodynamics caused by cirrhosis predispose patients to acute tubular necrosis. Classically, this presents as muddy brown casts and renal tubular epithelial cells on urinalysis and as a fractional excretion of sodium greater than 2%.1 However, these microscopic findings lack sensitivity, and patients with cirrhosis may have marked sodium avidity and low urine sodium excretion despite tubular injury.3
This diagnosis must still be considered in patients with renal failure, especially after an insult such as hemorrhagic or septic shock or intake of nephrotoxins. However, because our patient did not have a history of any of these and because his renal failure had been progressing over weeks, acute tubular necrosis was considered unlikely.
Hepatorenal syndrome
Hepatorenal syndrome is characterized by progressive renal failure in the absence of renal parenchymal disease. It is a functional disorder, ie, the decreased glomerular filtration rate results from renal vasoconstriction, which in turn is due to decreased systemic vascular resistance and increased compensatory activity of the renin-angiotensin-aldosterone axis and of antiduretic hormone release (Figure 1).
Hepatorenal syndrome often occurs in patients with advanced liver disease. These patients typically have a hyperdynamic circulation (systemic vasodilation, low blood pressure, and increased blood volume) with a low mean arterial pressure and increased renin and norepinephrine levels. Other frequent findings include hyponatremia, low urinary sodium excretion (< 2 mmol/day), and low free water clearance,4 all of which mark the high systemic levels of antidiuretic hormone and aldosterone.
Importantly, while hepatorenal syndrome is always considered in the differential diagnosis because of its unique prognosis and therapy, it remains a diagnosis of exclusion. The International Ascites Club5 has provided diagnostic criteria for hepatorenal syndrome:
- Cirrhosis and ascites
- Serum creatinine greater than 1.5 mg/dL
- Failure of serum creatinine to fall to less than 1.5 mg/dL after at least 48 hours of diuretic withdrawal and volume expansion with albumin (recommended dose 1 g/kg body weight per day up to a maximum of 100 g per day)
- Absence of shock
- No current or recent treatment with nephrotoxic drugs
- No signs of parenchymal kidney disease such as proteinuria (protein excretion > 500 mg/day), microhematuria (> 50 red blood cells per high-power field), or abnormalities on renal ultrasonography.
While these criteria are not perfect,6 they remind clinicians that there are other important causes of renal insufficiency in cirrhosis.
Clinically, our patient had no evidence of a hyperdynamic circulation and was instead hypertensive. He was eunatremic and did not have marked renal sodium avidity. His pyuria, proteinuria (his protein excretion was approximately 1.9 g/day as determined by urine spot protein-to-creatinine ratio), and results of ultrasonography also suggested underlying renal parenchymal disease. Therefore, hepatorenal syndrome was not the likely diagnosis.
HCV glomerulopathy
Intrinsic renal disease is likely, given our patient’s proteinuria, active urine sediment (ie, containing red blood cells, white blood cells, and protein), and abnormal findings on ultrasonography. In patients with HCV infection and no other cause of intrinsic kidney disease, immune complex deposition leading to glomerulonephritis is the most common pattern.7 Despite the intrinsic renal disease, fractional excretion of sodium may be less than 1% in glomerulonephritis. Hypertension in a patient such as ours with cirrhosis and renal insufficiency raises suspicion for glomerular disease, as hypertension is unlikely in advanced cirrhosis.8
Glomerulonephritis in patients with cirrhosis is often clinically silent and may be highly prevalent; some studies have shown glomerular involvement in 55% to 83% of patients with cirrhosis.9,10 This increases the risk of end-stage renal disease, and the Kidney Disease Improving Global Outcomes guideline recommends that HCV-infected patients be tested at least once a year for proteinuria, hematuria, and estimated glomerular filtration rate to detect possible HCV-associated kidney disease.11 According to current guidelines of the Infectious Diseases Society of America (IDSA) and American Association for the Study of Liver Diseases (AASLD) , detection of glomerulonephritis in HCV patients puts them in the highest priority class for treatment of HCV.12
HISTOLOGIC FINDINGS
Because of the high likelihood of glomerulopathy, our patient underwent renal biopsy.
2. What is the classic pathologic finding in HCV kidney disease?
- Focal segmental glomerulosclerosis
- Crescentic glomerulonephritis
- Membranoproliferative glomerulonephritis
- Membranous glomerulonephritis
A number of pathologic patterns have been described in HCV kidney disease, including membranous glomerulonephritis, immunoglobulin A nephropathy, and focal segmental glomerulosclerosis. However, by far the most common pattern is type 1 membranoproliferative glomerulonephritis.13 (Types 2 and 3 are much less common, and we will not discuss them here.) In type 1, light microscopy shows increased mesangial cells and thickened capillary walls (lobular glomeruli), staining of the basement membrane reveals double contours (“tram tracking”) or splitting due to mesangial deposition, and immunofluorescence demonstrates immunoglobulin G and complement C3 deposition. All of these findings were seen in our patient (Figure 2, Figure 3).
Membranoproliferative glomerulonephritis in patients with HCV is most commonly associated with cryoglobulins, a mixture of monoclonal or polyclonal immunoglobulin (Ig) M that have antiglobulin (rheumatoid factor) activity and bind to polyclonal IgG. They reversibly precipitate at less than 37°C, (98.6°F), hence their name. Only 50% to 70% of patients with cryoglobulinemic membranoproliferative glomerulonephritis have detectable serum cryoglobulins; however, kidney biopsy may show globular accumulations of eosinophilic material and prominent hypercellularity due to infiltration of glomerular capillaries with mononuclear and polymorphonuclear leukocytes.
Noncryoglobulinemic membranoproliferative glomerulonephritis is also found in patients with HCV infection. Its histologic features are similar, but on biopsy, there is less prominent leukocytic infiltration and no eosinophilic material. Although the pathogenesis of glomerulonephritis in HCV infection is poorly understood, it is thought to result from deposition of circulating immune complexes of HCV, anti-HCV, and rheumatoid factor in the glomeruli.
3. What laboratory finding is often seen in membranoproliferative glomerulonephritis?
- Positive cytoplasmic antineutrophil cytoplasmic antibody
- serum complement Low levels
- Antiphospholipase A2 receptor antibodies
Cytoplasmic antineutrophil cytoplasmic antibody is seen in granulomatosis with polyangiitis, while antiphospholipid A2 receptor antibodies are seen in idiopathic membranous nephritis.
Low serum complement levels are frequently found in membranoproliferative glomerulonephritis. It is believed that immune complex deposition leads to glomerular damage through activation of the complement pathway and the subsequent influx of inflammatory cells, release of cytokines and proteases, and damage to capillary walls. When repair ensues, new mesangial matrix and basement membrane are deposited, leading to mesangial expansion and duplicated basement membrane.14
In cryoglobulinemic membranoproliferative glomerulonephritis, the complement C4 level is often much lower than C3, but in noncryoglobulinemic forms C3 is lower. A mnemonic to remember nephritic syndromes with low complement levels is “hy-PO-CO-MP-L-EM-ents”; PO for postinfectious, CO for cryoglobulins, MP for membranoproliferative glomerulonephritis, L for lupus, and EM for embolic.
BACK TO OUR PATIENT
In addition to kidney biopsy, we tested our patient for serum cryoglobulins, rheumatoid factor, and serum complements. Results from these tests (Table 3), in addition to the lack of cryoglobulins on his biopsy, led to the conclusion that he had noncryoglobulinemic membranoproliferative glomerulonephritis.
WHO SHOULD RECEIVE TREATMENT FOR HCV?
4. According to the current IDSA/AASLD guidelines, which of the following patients should not receive direct-acting antiviral therapy for HCV?
- Patients with HCV and only low-stage fibrosis
- Patients with decompensated cirrhosis
- Patients with a glomerular filtration rate less than 30 mL/minute
- None of the above—nearly all patients with HCV infection should receive treatment for it
While certain patients have compelling indications for HCV treatment, such as advanced fibrosis, severe extrahepatic manifestations of HCV (eg, glomerulonephritis, cryoglobulinemia), and posttransplant status, current guidelines recommend treatment for nearly all patients with HCV, including those with low-stage fibrosis.12
Patients with Child-Pugh grade B or C decompensated cirrhosis, even with hepatocellular carcinoma, may be considered for treatment. Multiple studies have demonstrated the efficacy and safety of direct-acting antiviral drugs in this patient population. In one randomized controlled trial,15 the combination of ledipasvir, sofosbuvir, and ribavirin resulted in high sustained virologic response rates at 12 weeks in patients infected with HCV genotype 1 or 4 with advanced liver disease, irrespective of transplant status (86% to 89% of patients were pretransplant). Sustained virologic response was associated with improvements in Model for End-Stage Liver Disease and Child-Pugh scores largely due to decreases in bilirubin and improvement in synthetic function (ie, albumin).
Similarly, even patients with a glomerular filtration rate less than 30 mL/min are candidates for treatment. Those with a glomerular filtration rate above 30 mL/min need no dosage adjustments for the most common regimens, while regimens are also available for those with a rate less than 30 mL/min. Although patients with low baseline renal function have a higher frequency of anemia (especially with ribavirin), worsening renal dysfunction, and more severe adverse events, treatment responses remain high and comparable to those without renal impairment.
The Hepatitis C Therapeutic Registry and Research Network (HCV-TARGET) is conducting an ongoing prospective study evaluating real-world use of direct-acting antiviral agents. The study has reported the safety and efficacy of sofosbuvir-containing regimens in patients with varying severities of kidney disease, including glomerular filtration rates less than 30 mL/min). The patients received different regimens that included sofosbuvir. The regimens were reportedly tolerated, and the rate of sustained viral response at 12 weeks remained high.16
The efficacy of direct-acting antiviral agents for HCV-associated glomerulonephritis remains to be studied but is promising. Earlier studies found that antiviral therapy based on interferon alfa with or without ribavirin can significantly decrease proteinuria and stabilize renal function.17–20 HCV RNA clearance has been found to best predict renal improvement.
OUR PATIENT’S COURSE
Unfortunately, our patient’s kidney function declined further over the next 3 months, and he is currently on dialysis awaiting simultaneous liver and kidney transplant.
- Ginès P, Schrier RW. Renal failure in cirrhosis. N Engl J Med 2009; 361:1279–1290.
- Mackelaite L, Alsauskas ZC, Ranganna K. Renal failure in patients with cirrhosis. Med Clin North Am 2009; 93:855–869.
- Wadei HM, Mai ML, Ahsan N, Gonwa TA. Hepatorenal syndrome: pathophysiology and management. Clin J Am Soc Nephrol 2006; 1:1066–1079.
- Gines A, Escorsell A, Gines P, et al. Incidence, predictive factors, and prognosis of the hepatorenal syndrome in cirrhosis with ascites. Gastroenterology 1993; 105:229–236.
- Salerno F, Gerbes A, Ginès P, Wong F, Arroyo V. Diagnosis, prevention and treatment of hepatorenal syndrome in cirrhosis. Gut 2007; 56:1310–1318.
- Watt K, Uhanova J, Minuk GY. Hepatorenal syndrome: diagnostic accuracy, clinical features, and outcome in a tertiary care center. Am J Gastroenterol 2002; 97:2046–2050.
- Graupera I, Cardenas A. Diagnostic approach to renal failure in cirrhosis. Clin Liver Dis 2013; 2:128–131.
- Dash SC, Bhowmik D. Glomerulopathy with liver disease: patterns and management. Saudi J Kidney Dis Transpl 2000; 11:414–420.
- Arase Y, Ikeda K, Murashima N, et al. Glomerulonephritis in autopsy cases with hepatitis C virus infection. Intern Med 1998; 37:836–840.
- McGuire BM, Julian BA, Bynon JS, et al. Brief communication: glomerulonephritis in patients with hepatitis C cirrhosis undergoing liver transplantation. Ann Intern Med 2006; 144:735–741.
- Kidney Disease: Improving Global Outcomes (KDIGO). KDIGO clinical practice guidelines for the prevention, diagnosis, evaluation, and treatment of hepatitis C in chronic kidney disease. Kidney Int Suppl 2008; 109:S1–S99.
- American Association for the Study of Liver Diseases (AASLD) and the Infectious Diseases Society of America (IDSA). HCV guidance: recommendations for testing, managing, and treating hepatitis C. www.hcvguidelines.org/. Accessed July 10, 2016.
- Lai KN. Hepatitis-related renal disease. Future Virology 2011; 6:1361–1376.
- Sethi S, Fervenza FC. Membranoproliferative glomerulonephritis—a new look at an old entity. N Engl J Med 2012; 366:1119–1131.
- Charlton M, Everson GT, Flamm SL, et al; SOLAR-1 Investigators. Ledipasvir and sofosbuvir plus ribavirin for treatment of HCV infection in patients with advanced liver disease. Gastroenterology 2015; 149:649–659.
- Saxena V, Koraishy FM, Sise ME, et al; HCV-TARGET. Safety and efficacy of sofosbuvir-containing regimens in hepatitis C-infected patients with impaired renal function. Liver Int 2016; 36:807–816.
- Feng B, Eknoyan G, Guo ZS, et al. Effect of interferon alpha-based antiviral therapy on hepatitis C virus-associated glomerulonephritis: a meta-analysis. Nephrol Dial Transplant 2012; 27:640–646.
- Bruchfeld A, Lindahl K, Ståhle L, Söderberg M, Schvarcz R. Interferon and ribavirin treatment in patients with hepatitis C-associated renal disease and renal insufficiency. Nephrol Dial Transplant 2003; 18:1573–1580.
- Rossi P, Bertani T, Baio P, et al. Hepatitis C virus-related cryoglobulinemic glomerulonephritis. Long-term remission after antiviral therapy. Kidney Int 2003; 63:2236–2241.
- Alric L, Plaisier E, Thebault S, et al. Influence of antiviral therapy in hepatitis C virus associated cryoglobulinemic MPGN. Am J Kidney Dis 2004; 43:617–623.
A 54-year-old man with a history of cirrhosis secondary to hepatitis C virus (HCV) infection has had a progressive decline in kidney function. He was diagnosed with hepatitis C 15 years ago; he tried interferon treatment, but this failed. He received a transjugular intrahepatic shunt 10 years ago after an episode of esophageal variceal bleeding. He has since been taking furosemide and spironolactone as maintenance treatment for ascites, and he has no other medical concerns such as hypertension or diabetes.
Two weeks ago, routine laboratory tests in the clinic showed that his serum creatinine level had increased from baseline. He was asked to stop his diuretics and increase his fluid intake. Nevertheless, his kidney function continued to decline (Table 1), and he was admitted to the hospital for further evaluation.
On admission, he appeared comfortable. He denied recent use of any medications, including nonsteroidal anti-inflammatory drugs, antibiotics, and diuretics, and he had no genitourinary symptoms. His temperature was normal, blood pressure 170/90 mm Hg, pulse rate 72 per minute, and respiratory rate 16. His skin and sclerae were not jaundiced; his abdomen was not tender, but it was grossly distended with ascites. He also had +3 pedal edema (on a scale of 4) extending to both knees. The rest of his physical examination was unremarkable. Results of further laboratory tests are shown in in Table 2.
Ultrasonography of the liver demonstrated cirrhosis with patent flow through the shunt, and ultrasonography of the kidneys showed that both were slightly enlarged with increased cortical echogenicity but no hydronephrosis or obstruction.
EXPLORING THE CAUSE OF RENAL FAILURE
1. Given this information, what is the likely cause of our patient’s renal failure?
- Volume depletion
- Acute tubular necrosis
- Hepatorenal syndrome
- HCV glomerulopathy
Renal failure is a common complication in cirrhosis and portends a higher risk of death.1 The differential diagnosis is broad, but a systematic approach incorporating data from the history, physical examination, and laboratory tests can help identify the cause and is essential in determining the prognosis and proper treatment.
Volume depletion
Volume depletion is a common cause of renal failure in cirrhotic patients. Common precipitants are excessive diuresis and gastrointestinal fluid loss from bleeding, vomiting, and diarrhea. Despite having ascites and edema, patients may have low fluid volume in the vascular space. Therefore, the first step in a patient with acute kidney injury is to withhold diuretics and give fluids. The renal failure usually rapidly reverses if the patient does not have renal parenchymal disease.2
Our patient did not present with any fluid losses, and his high blood pressure and normal heart rate did not suggest volume depletion. And most importantly, withholding his diuretics and giving fluids did not reverse his renal failure. Thus, volume depletion was an unlikely cause.
Acute tubular necrosis
The altered hemodynamics caused by cirrhosis predispose patients to acute tubular necrosis. Classically, this presents as muddy brown casts and renal tubular epithelial cells on urinalysis and as a fractional excretion of sodium greater than 2%.1 However, these microscopic findings lack sensitivity, and patients with cirrhosis may have marked sodium avidity and low urine sodium excretion despite tubular injury.3
This diagnosis must still be considered in patients with renal failure, especially after an insult such as hemorrhagic or septic shock or intake of nephrotoxins. However, because our patient did not have a history of any of these and because his renal failure had been progressing over weeks, acute tubular necrosis was considered unlikely.
Hepatorenal syndrome
Hepatorenal syndrome is characterized by progressive renal failure in the absence of renal parenchymal disease. It is a functional disorder, ie, the decreased glomerular filtration rate results from renal vasoconstriction, which in turn is due to decreased systemic vascular resistance and increased compensatory activity of the renin-angiotensin-aldosterone axis and of antiduretic hormone release (Figure 1).
Hepatorenal syndrome often occurs in patients with advanced liver disease. These patients typically have a hyperdynamic circulation (systemic vasodilation, low blood pressure, and increased blood volume) with a low mean arterial pressure and increased renin and norepinephrine levels. Other frequent findings include hyponatremia, low urinary sodium excretion (< 2 mmol/day), and low free water clearance,4 all of which mark the high systemic levels of antidiuretic hormone and aldosterone.
Importantly, while hepatorenal syndrome is always considered in the differential diagnosis because of its unique prognosis and therapy, it remains a diagnosis of exclusion. The International Ascites Club5 has provided diagnostic criteria for hepatorenal syndrome:
- Cirrhosis and ascites
- Serum creatinine greater than 1.5 mg/dL
- Failure of serum creatinine to fall to less than 1.5 mg/dL after at least 48 hours of diuretic withdrawal and volume expansion with albumin (recommended dose 1 g/kg body weight per day up to a maximum of 100 g per day)
- Absence of shock
- No current or recent treatment with nephrotoxic drugs
- No signs of parenchymal kidney disease such as proteinuria (protein excretion > 500 mg/day), microhematuria (> 50 red blood cells per high-power field), or abnormalities on renal ultrasonography.
While these criteria are not perfect,6 they remind clinicians that there are other important causes of renal insufficiency in cirrhosis.
Clinically, our patient had no evidence of a hyperdynamic circulation and was instead hypertensive. He was eunatremic and did not have marked renal sodium avidity. His pyuria, proteinuria (his protein excretion was approximately 1.9 g/day as determined by urine spot protein-to-creatinine ratio), and results of ultrasonography also suggested underlying renal parenchymal disease. Therefore, hepatorenal syndrome was not the likely diagnosis.
HCV glomerulopathy
Intrinsic renal disease is likely, given our patient’s proteinuria, active urine sediment (ie, containing red blood cells, white blood cells, and protein), and abnormal findings on ultrasonography. In patients with HCV infection and no other cause of intrinsic kidney disease, immune complex deposition leading to glomerulonephritis is the most common pattern.7 Despite the intrinsic renal disease, fractional excretion of sodium may be less than 1% in glomerulonephritis. Hypertension in a patient such as ours with cirrhosis and renal insufficiency raises suspicion for glomerular disease, as hypertension is unlikely in advanced cirrhosis.8
Glomerulonephritis in patients with cirrhosis is often clinically silent and may be highly prevalent; some studies have shown glomerular involvement in 55% to 83% of patients with cirrhosis.9,10 This increases the risk of end-stage renal disease, and the Kidney Disease Improving Global Outcomes guideline recommends that HCV-infected patients be tested at least once a year for proteinuria, hematuria, and estimated glomerular filtration rate to detect possible HCV-associated kidney disease.11 According to current guidelines of the Infectious Diseases Society of America (IDSA) and American Association for the Study of Liver Diseases (AASLD) , detection of glomerulonephritis in HCV patients puts them in the highest priority class for treatment of HCV.12
HISTOLOGIC FINDINGS
Because of the high likelihood of glomerulopathy, our patient underwent renal biopsy.
2. What is the classic pathologic finding in HCV kidney disease?
- Focal segmental glomerulosclerosis
- Crescentic glomerulonephritis
- Membranoproliferative glomerulonephritis
- Membranous glomerulonephritis
A number of pathologic patterns have been described in HCV kidney disease, including membranous glomerulonephritis, immunoglobulin A nephropathy, and focal segmental glomerulosclerosis. However, by far the most common pattern is type 1 membranoproliferative glomerulonephritis.13 (Types 2 and 3 are much less common, and we will not discuss them here.) In type 1, light microscopy shows increased mesangial cells and thickened capillary walls (lobular glomeruli), staining of the basement membrane reveals double contours (“tram tracking”) or splitting due to mesangial deposition, and immunofluorescence demonstrates immunoglobulin G and complement C3 deposition. All of these findings were seen in our patient (Figure 2, Figure 3).
Membranoproliferative glomerulonephritis in patients with HCV is most commonly associated with cryoglobulins, a mixture of monoclonal or polyclonal immunoglobulin (Ig) M that have antiglobulin (rheumatoid factor) activity and bind to polyclonal IgG. They reversibly precipitate at less than 37°C, (98.6°F), hence their name. Only 50% to 70% of patients with cryoglobulinemic membranoproliferative glomerulonephritis have detectable serum cryoglobulins; however, kidney biopsy may show globular accumulations of eosinophilic material and prominent hypercellularity due to infiltration of glomerular capillaries with mononuclear and polymorphonuclear leukocytes.
Noncryoglobulinemic membranoproliferative glomerulonephritis is also found in patients with HCV infection. Its histologic features are similar, but on biopsy, there is less prominent leukocytic infiltration and no eosinophilic material. Although the pathogenesis of glomerulonephritis in HCV infection is poorly understood, it is thought to result from deposition of circulating immune complexes of HCV, anti-HCV, and rheumatoid factor in the glomeruli.
3. What laboratory finding is often seen in membranoproliferative glomerulonephritis?
- Positive cytoplasmic antineutrophil cytoplasmic antibody
- serum complement Low levels
- Antiphospholipase A2 receptor antibodies
Cytoplasmic antineutrophil cytoplasmic antibody is seen in granulomatosis with polyangiitis, while antiphospholipid A2 receptor antibodies are seen in idiopathic membranous nephritis.
Low serum complement levels are frequently found in membranoproliferative glomerulonephritis. It is believed that immune complex deposition leads to glomerular damage through activation of the complement pathway and the subsequent influx of inflammatory cells, release of cytokines and proteases, and damage to capillary walls. When repair ensues, new mesangial matrix and basement membrane are deposited, leading to mesangial expansion and duplicated basement membrane.14
In cryoglobulinemic membranoproliferative glomerulonephritis, the complement C4 level is often much lower than C3, but in noncryoglobulinemic forms C3 is lower. A mnemonic to remember nephritic syndromes with low complement levels is “hy-PO-CO-MP-L-EM-ents”; PO for postinfectious, CO for cryoglobulins, MP for membranoproliferative glomerulonephritis, L for lupus, and EM for embolic.
BACK TO OUR PATIENT
In addition to kidney biopsy, we tested our patient for serum cryoglobulins, rheumatoid factor, and serum complements. Results from these tests (Table 3), in addition to the lack of cryoglobulins on his biopsy, led to the conclusion that he had noncryoglobulinemic membranoproliferative glomerulonephritis.
WHO SHOULD RECEIVE TREATMENT FOR HCV?
4. According to the current IDSA/AASLD guidelines, which of the following patients should not receive direct-acting antiviral therapy for HCV?
- Patients with HCV and only low-stage fibrosis
- Patients with decompensated cirrhosis
- Patients with a glomerular filtration rate less than 30 mL/minute
- None of the above—nearly all patients with HCV infection should receive treatment for it
While certain patients have compelling indications for HCV treatment, such as advanced fibrosis, severe extrahepatic manifestations of HCV (eg, glomerulonephritis, cryoglobulinemia), and posttransplant status, current guidelines recommend treatment for nearly all patients with HCV, including those with low-stage fibrosis.12
Patients with Child-Pugh grade B or C decompensated cirrhosis, even with hepatocellular carcinoma, may be considered for treatment. Multiple studies have demonstrated the efficacy and safety of direct-acting antiviral drugs in this patient population. In one randomized controlled trial,15 the combination of ledipasvir, sofosbuvir, and ribavirin resulted in high sustained virologic response rates at 12 weeks in patients infected with HCV genotype 1 or 4 with advanced liver disease, irrespective of transplant status (86% to 89% of patients were pretransplant). Sustained virologic response was associated with improvements in Model for End-Stage Liver Disease and Child-Pugh scores largely due to decreases in bilirubin and improvement in synthetic function (ie, albumin).
Similarly, even patients with a glomerular filtration rate less than 30 mL/min are candidates for treatment. Those with a glomerular filtration rate above 30 mL/min need no dosage adjustments for the most common regimens, while regimens are also available for those with a rate less than 30 mL/min. Although patients with low baseline renal function have a higher frequency of anemia (especially with ribavirin), worsening renal dysfunction, and more severe adverse events, treatment responses remain high and comparable to those without renal impairment.
The Hepatitis C Therapeutic Registry and Research Network (HCV-TARGET) is conducting an ongoing prospective study evaluating real-world use of direct-acting antiviral agents. The study has reported the safety and efficacy of sofosbuvir-containing regimens in patients with varying severities of kidney disease, including glomerular filtration rates less than 30 mL/min). The patients received different regimens that included sofosbuvir. The regimens were reportedly tolerated, and the rate of sustained viral response at 12 weeks remained high.16
The efficacy of direct-acting antiviral agents for HCV-associated glomerulonephritis remains to be studied but is promising. Earlier studies found that antiviral therapy based on interferon alfa with or without ribavirin can significantly decrease proteinuria and stabilize renal function.17–20 HCV RNA clearance has been found to best predict renal improvement.
OUR PATIENT’S COURSE
Unfortunately, our patient’s kidney function declined further over the next 3 months, and he is currently on dialysis awaiting simultaneous liver and kidney transplant.
- Ginès P, Schrier RW. Renal failure in cirrhosis. N Engl J Med 2009; 361:1279–1290.
- Mackelaite L, Alsauskas ZC, Ranganna K. Renal failure in patients with cirrhosis. Med Clin North Am 2009; 93:855–869.
- Wadei HM, Mai ML, Ahsan N, Gonwa TA. Hepatorenal syndrome: pathophysiology and management. Clin J Am Soc Nephrol 2006; 1:1066–1079.
- Gines A, Escorsell A, Gines P, et al. Incidence, predictive factors, and prognosis of the hepatorenal syndrome in cirrhosis with ascites. Gastroenterology 1993; 105:229–236.
- Salerno F, Gerbes A, Ginès P, Wong F, Arroyo V. Diagnosis, prevention and treatment of hepatorenal syndrome in cirrhosis. Gut 2007; 56:1310–1318.
- Watt K, Uhanova J, Minuk GY. Hepatorenal syndrome: diagnostic accuracy, clinical features, and outcome in a tertiary care center. Am J Gastroenterol 2002; 97:2046–2050.
- Graupera I, Cardenas A. Diagnostic approach to renal failure in cirrhosis. Clin Liver Dis 2013; 2:128–131.
- Dash SC, Bhowmik D. Glomerulopathy with liver disease: patterns and management. Saudi J Kidney Dis Transpl 2000; 11:414–420.
- Arase Y, Ikeda K, Murashima N, et al. Glomerulonephritis in autopsy cases with hepatitis C virus infection. Intern Med 1998; 37:836–840.
- McGuire BM, Julian BA, Bynon JS, et al. Brief communication: glomerulonephritis in patients with hepatitis C cirrhosis undergoing liver transplantation. Ann Intern Med 2006; 144:735–741.
- Kidney Disease: Improving Global Outcomes (KDIGO). KDIGO clinical practice guidelines for the prevention, diagnosis, evaluation, and treatment of hepatitis C in chronic kidney disease. Kidney Int Suppl 2008; 109:S1–S99.
- American Association for the Study of Liver Diseases (AASLD) and the Infectious Diseases Society of America (IDSA). HCV guidance: recommendations for testing, managing, and treating hepatitis C. www.hcvguidelines.org/. Accessed July 10, 2016.
- Lai KN. Hepatitis-related renal disease. Future Virology 2011; 6:1361–1376.
- Sethi S, Fervenza FC. Membranoproliferative glomerulonephritis—a new look at an old entity. N Engl J Med 2012; 366:1119–1131.
- Charlton M, Everson GT, Flamm SL, et al; SOLAR-1 Investigators. Ledipasvir and sofosbuvir plus ribavirin for treatment of HCV infection in patients with advanced liver disease. Gastroenterology 2015; 149:649–659.
- Saxena V, Koraishy FM, Sise ME, et al; HCV-TARGET. Safety and efficacy of sofosbuvir-containing regimens in hepatitis C-infected patients with impaired renal function. Liver Int 2016; 36:807–816.
- Feng B, Eknoyan G, Guo ZS, et al. Effect of interferon alpha-based antiviral therapy on hepatitis C virus-associated glomerulonephritis: a meta-analysis. Nephrol Dial Transplant 2012; 27:640–646.
- Bruchfeld A, Lindahl K, Ståhle L, Söderberg M, Schvarcz R. Interferon and ribavirin treatment in patients with hepatitis C-associated renal disease and renal insufficiency. Nephrol Dial Transplant 2003; 18:1573–1580.
- Rossi P, Bertani T, Baio P, et al. Hepatitis C virus-related cryoglobulinemic glomerulonephritis. Long-term remission after antiviral therapy. Kidney Int 2003; 63:2236–2241.
- Alric L, Plaisier E, Thebault S, et al. Influence of antiviral therapy in hepatitis C virus associated cryoglobulinemic MPGN. Am J Kidney Dis 2004; 43:617–623.