User login
Bundled payment for gastrointestinal hemorrhage
The Medicare Access and Chips Reauthorization Act (MACRA) is now law; it passed with bipartisan, virtually unanimous support in both chambers of Congress. MACRA replaced the Sustainable Growth Rate formula for physician reimbursement and replaced it with a pathway to value-based payment. This law will alter our practices more than the Affordable Care Act and to an extent not seen since the passage of the original Medicare Act. Practices that continue to hang on to our traditional colonoscopy-based fee-for-service reimbursement model will increasingly be marginalized (or discounted) by Medicare, commercial payers, and regional health systems. To thrive in the coming decade, innovative practices will move toward alternative payment models. Many practices have risk-linked bundled payments for colonoscopy, but this step is only for the interim. Long-term success will come to practices that understand the implications of episode payments, specialty medical homes, and total cost of care. Do not wait for the finances to magically appear – start now to build infrastructure. In this month’s article, Dr. Mehta provides a detailed description of how a practice might construct a bundled payment for a common inpatient disorder. No one is paying for this yet, but it will come. Now is not the time to be a “WIMP” (Gastroenterology. 2016;150:295-9).
John I. Allen, MD, MBA, AGAF
Editor in Chief
In January 2016, the Centers for Medicare & Medicaid Services (CMS) launched the Comprehensive Care for Joint Replacement (CJR) model. This payment model aims to improve the value of care provided to Medicare beneficiaries for hip and knee replacement surgery during the inpatient stay and 90-day period after discharge by holding hospitals accountable for cost and quality.1 It includes hospitals in 67 geographic areas across the United States and marks the first time that a postacute bundled payment model is mandatory for traditional Medicare patients. Although this may not seem to be relevant for gastroenterology, it marks an important signal by CMS that there will likely be more episode-payment models in the future.

Gastroenterologists have not been primary drivers or participants in these models, but gastrointestinal hemorrhage is included as 1 of the 48 clinical conditions for the postacute bundled payment program. In addition, CMS recently announced that clinical episode-based payment for GI hemorrhage will be included in hospital inpatient quality reporting (IQR) for fiscal year 2019.4 This is an opportunity for the field of gastroenterology to take a leadership role in an alternate payment model as it has for colonoscopy bundled payment,5 but it requires an understanding of the history of postacute bundled payments and the opportunities for and challenges to applying this model to GI hemorrhage. In this article, I will describe insights from our health system’s experience in evaluating different postacute bundled payment programs and participating in a GI bundled payment program.
Inpatient and postacute bundled payments
A bundled payment refers to a situation in which hospitals and physicians are incentivized to coordinate care for an episode of care across the continuum and eliminate unnecessary spending. In 1983, Medicare initiated a type of bundled payment for Part A spending on inpatient hospital care by creating prospective payment that is based on diagnosis-related groups (DRGs). This was a response to the rising cost of inpatient care resulting from retrospective payment that is based on hospital charges. Because hospitals would get paid the same amount for similar conditions, it resulted in shortened length of stay and reduction in the rise of inpatient costs, along with no measurable impact on quality of care.6 This was followed by prospective payment for outpatient hospital fees and skilled nursing facility (SNF) care as a result of the Balanced Budget Act of 1997. Medicare built on this by bundling physician and hospital fees through demonstration projects in coronary artery bypass graft surgery from 1991 to 1996 and orthopedic and cardiovascular surgery from 2009 to 2012, both resulting in reduced costs and no measurable impact on quality.
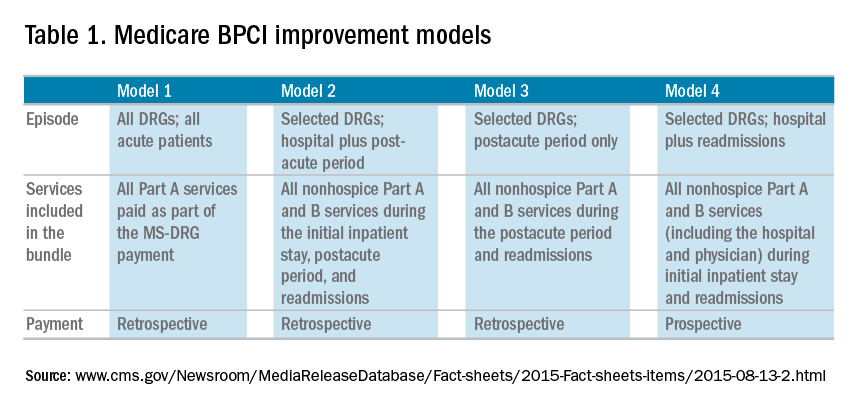
The Bundled Payment for Care Improvement (BPCI) program built on these results in 2013 by expanding to include Part A and B services rendered up to 90 days after discharge, and as of January 2016, it includes 1,574 participants across the country. On a voluntary basis, hospitals, physician groups, and postacute providers and conveners were able to participate in 1 of 4 bundled payment models that were anchored on an inpatient for any of 48 clinical conditions that were based on MS-DRG (Table 1).
• Model 1 defined the episode as the inpatient hospital stay and bundled the facility and physician fees, similar to prior demonstration projects.
• Model 2 is a retrospective bundled payment for Part A and B services in the inpatient hospital stay and up to 90 days after discharge.
• Model 3 is a retrospective model that starts after hospital discharge and includes up to 90 days. (Models 1-3 maintain the current payment structure and retrospectively compare the actual reimbursement with target values that are based on historical data for that hospital with a 2%-3% payment reduction.)
• Model 4 makes a single, prospectively determined global payment to a hospital that encompasses all services during the hospital stay.
Opportunities in inpatient and postacute bundled payments
Participation in bundled payments requires a new set of analytic and organizational capabilities.
• The first step is to identify the patient population on the basis of inclusion and exclusion criteria and to measure the current cost of care through external claims data and internal hospital data. This includes payments for hospital inpatient services, physician fees, postacute care, readmissions, other Part B services, and home health services. The biggest opportunity for postacute bundles is shifting site of service from postacute care to lower-cost settings and reducing readmission rates.
• Subsequently, they need to identify areas of opportunity to reduce expenditure, while also demonstrating consistent or improved quality and outcomes.
• On the basis of this, the team can identify variation in care within the cohort and in comparison with benchmarks across the country.
• After identifying areas of opportunity, the team needs to develop strategies to improve value such as care pathways, information technology tools, care coordination, and remote services.
Of the 48 clinical conditions in BPCI, 4 could be described as related to GI: esophagitis, gastroenteritis, and other digestive disorders (Medicare Severity–Diagnosis Related Group [MS-DRG] 391, 392); gastrointestinal hemorrhage (MS-DRG 377, 378, 379); gastrointestinal obstruction (MS-DRG 388, 389, 390); and major bowel procedure (MS-DRG 329, 330, 331). After evaluating the GI bundles, it was apparent that these were created for billing purposes and were not clinically intuitive, which is why our institution immediately excluded the broad category of esophagitis, gastroenteritis, and other digestive disorders. GI obstruction and major bowel surgery relate to the care of gastroenterologists, but surgeons are typically primary drivers of care for these patients. Thus, we believed that GI hemorrhage was most appropriate because gastroenterologists drive care for this condition, and there is substantial evidence about established guidelines and pathways during this episode.
Bundled payment for gastrointestinal hemorrhage
We built a multidisciplinary team of physicians, data analysts, clinical documentation specialists, and care managers to start developing a plan for improving the value of care in this population. This included data about readmissions and site of postacute care for this population, which were supplemented by chart review of financial outliers and readmissions. We quickly learned about some of the challenges to medical bundles and the GI hemorrhage bundle in particular. It is difficult to identify these patients early in the hospital stay because inclusion is based on a billing code. Many of these patients also have cardiovascular disease, cancer, or cirrhosis, which makes it hard to identify which patients will end up with primary GI hemorrhage coding until after the patient is discharged. They are also on many different inpatient services; in our hospital, there were at least 12 different admitting services. In addition, almost one-third of the patients actually had an admission before this hospitalization, often for different clinical conditions.
Most importantly, it was very challenging to develop protocols to improve the value of care in this population. Most of the patients had many comorbid conditions, so a GI hemorrhage pathway alone would not be sufficient to alter care. The two main areas of opportunity for cost savings in postacute bundled payments are postacute site of service and readmissions, both of which are hard to change for medical GI patients. For medical patients, they have many comorbidities before admission, so postacute site of service is typically driven by which site they were admitted from. This is different from surgical patients who are in SNF or rehabilitation facilities for limited time frames, and there may be more discretion to shift to lower cost settings. In addition, readmissions have not been studied much in GI hemorrhage, so it is not clear how to improve them. On the basis of these factors and the limited sample size for this condition, our health system opted to stop taking financial risk for this population.
Future opportunities for gastroenterology
However, the latest CMS Inpatient Prospective Payment System rule describes the implementation of a new quality metric for hospital IQR called the Gastrointestinal Hemorrhage Clinical Episode-Based Payment. This would hold hospitals accountable for the cost of care for GI hemorrhage admissions plus the 90 days after discharge, similar to model 2 of BPCI. This announcement, as well as the launch of mandatory orthopedic bundles, demonstrates that hospital reimbursement is shifting toward an expansion of bundled payments to include the postacute time frame. This is manifested in postacute bundles, episode-based payment, and readmission penalties. This reignited our GI hemorrhage episode team’s efforts, but with a broader purpose.
Gastroenterologists can take a leadership role in responding to episode-based payments as a way for us to demonstrate value in our collaboration with hospitals, health systems, and payers. The focus on cardiovascular disease as part of readmission penalties and core measures has allowed our cardiology colleagues to partner closely with service lines, learn about episode-based care, and garner resources to build and lead disease and episode teams. Because patients do not fit into the different clinical areas in mutually exclusive categories, we will need to collaborate with other specialties to care for the overlap with other conditions. Many heart failure and myocardial infarction patients will get readmitted for GI hemorrhage, and many GI hemorrhage patients will have concomitant cardiovascular disease or cancer. This suggests that future strategies need to integrate efforts of service lines and that there is greater opportunity for gastroenterologists than just the GI bundles.
Gastroenterologists should also participate in a proactive way. Any new payment mechanism will have some flaws in implementation, so it is more important to do what is right from a clinical standpoint rather than focusing too much on the specific billing code or payment model. These models are evolving, and we have an opportunity to have impact on future implementation. This starts with identifying and including patients from a clinical perspective rather than focusing on specific insurance types that participate in bundled payments. Some examples to improve the value of care in GI hemorrhage include creating evidence-based care pathways that span the episode of care, structured documentation after endoscopy for risk stratification, integrating pathways into the workflow of providers through the electronic health record, and increased coordination between specialties across the continuum of care. Other diagnoses that might be included in future bundles include cirrhosis, bowel obstruction, and inflammatory bowel disease. We can also learn from successful efforts in other clinical specialties that have identified variations in care and implemented a multi-modal strategy to improving care and measuring impact.
References
1. Mechanic, R.E. Mandatory Medicare bundled payment: Is it ready for prime time? N Engl J Med. 2015;373[14]:1291-3.
2. U.S. Department of Health and Human Services. Better, smarter, healthier: In historic announcement, HHS sets clear goals and timeline for shifting Medicare reimbursements from volume to value. January 26, 2015. Available from: http://www.hhs.gov/about/news/2015/01/26/better-smarter-healthier-in-historic-announcement-hhs-sets-clear-goals-and-timeline-for-shifting-medicare-reimbursements-from-volume-to-value.html. Accessed June 28, 2016.
3. Patel, K., Presser, E., George, M., et al. Shifting away from fee-for-service: Alternative approaches to payment in gastroenterology. Clin Gastroenterol Hepatol. 2016;14[4]:497-506.
4. Medicare FY 2016 IPPS final rule. Available from: https://www.cms.gov/Medicare/Medicare-Fee-for-Service-Payment/AcuteInpatientPPS/FY2016-IPPS-Final-Rule-Home-Page.html. Accessed June 28, 2016.
5. Ketover, S.R. Bundled payment for colonoscopy. Clin Gastroenterol Hepatol. 2013;11[5]:454-7.
6. Coulam, R.F., Gaumer, G.L. Medicare’s prospective payment system: a critical appraisal. Health Care Financ Rev Annu Suppl. 1991:45-77.
Dr. Mehta is in the division of gastroenterology, Perelman School of Medicine, University of Pennsylvania, and Penn Medicine Center for Health Care Innovation, University of Pennsylvania, Philadelphia. The author discloses no conflicts of interest.
The Medicare Access and Chips Reauthorization Act (MACRA) is now law; it passed with bipartisan, virtually unanimous support in both chambers of Congress. MACRA replaced the Sustainable Growth Rate formula for physician reimbursement and replaced it with a pathway to value-based payment. This law will alter our practices more than the Affordable Care Act and to an extent not seen since the passage of the original Medicare Act. Practices that continue to hang on to our traditional colonoscopy-based fee-for-service reimbursement model will increasingly be marginalized (or discounted) by Medicare, commercial payers, and regional health systems. To thrive in the coming decade, innovative practices will move toward alternative payment models. Many practices have risk-linked bundled payments for colonoscopy, but this step is only for the interim. Long-term success will come to practices that understand the implications of episode payments, specialty medical homes, and total cost of care. Do not wait for the finances to magically appear – start now to build infrastructure. In this month’s article, Dr. Mehta provides a detailed description of how a practice might construct a bundled payment for a common inpatient disorder. No one is paying for this yet, but it will come. Now is not the time to be a “WIMP” (Gastroenterology. 2016;150:295-9).
John I. Allen, MD, MBA, AGAF
Editor in Chief
In January 2016, the Centers for Medicare & Medicaid Services (CMS) launched the Comprehensive Care for Joint Replacement (CJR) model. This payment model aims to improve the value of care provided to Medicare beneficiaries for hip and knee replacement surgery during the inpatient stay and 90-day period after discharge by holding hospitals accountable for cost and quality.1 It includes hospitals in 67 geographic areas across the United States and marks the first time that a postacute bundled payment model is mandatory for traditional Medicare patients. Although this may not seem to be relevant for gastroenterology, it marks an important signal by CMS that there will likely be more episode-payment models in the future.
Gastroenterologists have not been primary drivers or participants in these models, but gastrointestinal hemorrhage is included as 1 of the 48 clinical conditions for the postacute bundled payment program. In addition, CMS recently announced that clinical episode-based payment for GI hemorrhage will be included in hospital inpatient quality reporting (IQR) for fiscal year 2019.4 This is an opportunity for the field of gastroenterology to take a leadership role in an alternate payment model as it has for colonoscopy bundled payment,5 but it requires an understanding of the history of postacute bundled payments and the opportunities for and challenges to applying this model to GI hemorrhage. In this article, I will describe insights from our health system’s experience in evaluating different postacute bundled payment programs and participating in a GI bundled payment program.
Inpatient and postacute bundled payments
A bundled payment refers to a situation in which hospitals and physicians are incentivized to coordinate care for an episode of care across the continuum and eliminate unnecessary spending. In 1983, Medicare initiated a type of bundled payment for Part A spending on inpatient hospital care by creating prospective payment that is based on diagnosis-related groups (DRGs). This was a response to the rising cost of inpatient care resulting from retrospective payment that is based on hospital charges. Because hospitals would get paid the same amount for similar conditions, it resulted in shortened length of stay and reduction in the rise of inpatient costs, along with no measurable impact on quality of care.6 This was followed by prospective payment for outpatient hospital fees and skilled nursing facility (SNF) care as a result of the Balanced Budget Act of 1997. Medicare built on this by bundling physician and hospital fees through demonstration projects in coronary artery bypass graft surgery from 1991 to 1996 and orthopedic and cardiovascular surgery from 2009 to 2012, both resulting in reduced costs and no measurable impact on quality.
The Bundled Payment for Care Improvement (BPCI) program built on these results in 2013 by expanding to include Part A and B services rendered up to 90 days after discharge, and as of January 2016, it includes 1,574 participants across the country. On a voluntary basis, hospitals, physician groups, and postacute providers and conveners were able to participate in 1 of 4 bundled payment models that were anchored on an inpatient for any of 48 clinical conditions that were based on MS-DRG (Table 1).
• Model 1 defined the episode as the inpatient hospital stay and bundled the facility and physician fees, similar to prior demonstration projects.
• Model 2 is a retrospective bundled payment for Part A and B services in the inpatient hospital stay and up to 90 days after discharge.
• Model 3 is a retrospective model that starts after hospital discharge and includes up to 90 days. (Models 1-3 maintain the current payment structure and retrospectively compare the actual reimbursement with target values that are based on historical data for that hospital with a 2%-3% payment reduction.)
• Model 4 makes a single, prospectively determined global payment to a hospital that encompasses all services during the hospital stay.
Opportunities in inpatient and postacute bundled payments
Participation in bundled payments requires a new set of analytic and organizational capabilities.
• The first step is to identify the patient population on the basis of inclusion and exclusion criteria and to measure the current cost of care through external claims data and internal hospital data. This includes payments for hospital inpatient services, physician fees, postacute care, readmissions, other Part B services, and home health services. The biggest opportunity for postacute bundles is shifting site of service from postacute care to lower-cost settings and reducing readmission rates.
• Subsequently, they need to identify areas of opportunity to reduce expenditure, while also demonstrating consistent or improved quality and outcomes.
• On the basis of this, the team can identify variation in care within the cohort and in comparison with benchmarks across the country.
• After identifying areas of opportunity, the team needs to develop strategies to improve value such as care pathways, information technology tools, care coordination, and remote services.
Of the 48 clinical conditions in BPCI, 4 could be described as related to GI: esophagitis, gastroenteritis, and other digestive disorders (Medicare Severity–Diagnosis Related Group [MS-DRG] 391, 392); gastrointestinal hemorrhage (MS-DRG 377, 378, 379); gastrointestinal obstruction (MS-DRG 388, 389, 390); and major bowel procedure (MS-DRG 329, 330, 331). After evaluating the GI bundles, it was apparent that these were created for billing purposes and were not clinically intuitive, which is why our institution immediately excluded the broad category of esophagitis, gastroenteritis, and other digestive disorders. GI obstruction and major bowel surgery relate to the care of gastroenterologists, but surgeons are typically primary drivers of care for these patients. Thus, we believed that GI hemorrhage was most appropriate because gastroenterologists drive care for this condition, and there is substantial evidence about established guidelines and pathways during this episode.
Bundled payment for gastrointestinal hemorrhage
We built a multidisciplinary team of physicians, data analysts, clinical documentation specialists, and care managers to start developing a plan for improving the value of care in this population. This included data about readmissions and site of postacute care for this population, which were supplemented by chart review of financial outliers and readmissions. We quickly learned about some of the challenges to medical bundles and the GI hemorrhage bundle in particular. It is difficult to identify these patients early in the hospital stay because inclusion is based on a billing code. Many of these patients also have cardiovascular disease, cancer, or cirrhosis, which makes it hard to identify which patients will end up with primary GI hemorrhage coding until after the patient is discharged. They are also on many different inpatient services; in our hospital, there were at least 12 different admitting services. In addition, almost one-third of the patients actually had an admission before this hospitalization, often for different clinical conditions.
Most importantly, it was very challenging to develop protocols to improve the value of care in this population. Most of the patients had many comorbid conditions, so a GI hemorrhage pathway alone would not be sufficient to alter care. The two main areas of opportunity for cost savings in postacute bundled payments are postacute site of service and readmissions, both of which are hard to change for medical GI patients. For medical patients, they have many comorbidities before admission, so postacute site of service is typically driven by which site they were admitted from. This is different from surgical patients who are in SNF or rehabilitation facilities for limited time frames, and there may be more discretion to shift to lower cost settings. In addition, readmissions have not been studied much in GI hemorrhage, so it is not clear how to improve them. On the basis of these factors and the limited sample size for this condition, our health system opted to stop taking financial risk for this population.
Future opportunities for gastroenterology
However, the latest CMS Inpatient Prospective Payment System rule describes the implementation of a new quality metric for hospital IQR called the Gastrointestinal Hemorrhage Clinical Episode-Based Payment. This would hold hospitals accountable for the cost of care for GI hemorrhage admissions plus the 90 days after discharge, similar to model 2 of BPCI. This announcement, as well as the launch of mandatory orthopedic bundles, demonstrates that hospital reimbursement is shifting toward an expansion of bundled payments to include the postacute time frame. This is manifested in postacute bundles, episode-based payment, and readmission penalties. This reignited our GI hemorrhage episode team’s efforts, but with a broader purpose.
Gastroenterologists can take a leadership role in responding to episode-based payments as a way for us to demonstrate value in our collaboration with hospitals, health systems, and payers. The focus on cardiovascular disease as part of readmission penalties and core measures has allowed our cardiology colleagues to partner closely with service lines, learn about episode-based care, and garner resources to build and lead disease and episode teams. Because patients do not fit into the different clinical areas in mutually exclusive categories, we will need to collaborate with other specialties to care for the overlap with other conditions. Many heart failure and myocardial infarction patients will get readmitted for GI hemorrhage, and many GI hemorrhage patients will have concomitant cardiovascular disease or cancer. This suggests that future strategies need to integrate efforts of service lines and that there is greater opportunity for gastroenterologists than just the GI bundles.
Gastroenterologists should also participate in a proactive way. Any new payment mechanism will have some flaws in implementation, so it is more important to do what is right from a clinical standpoint rather than focusing too much on the specific billing code or payment model. These models are evolving, and we have an opportunity to have impact on future implementation. This starts with identifying and including patients from a clinical perspective rather than focusing on specific insurance types that participate in bundled payments. Some examples to improve the value of care in GI hemorrhage include creating evidence-based care pathways that span the episode of care, structured documentation after endoscopy for risk stratification, integrating pathways into the workflow of providers through the electronic health record, and increased coordination between specialties across the continuum of care. Other diagnoses that might be included in future bundles include cirrhosis, bowel obstruction, and inflammatory bowel disease. We can also learn from successful efforts in other clinical specialties that have identified variations in care and implemented a multi-modal strategy to improving care and measuring impact.
References
1. Mechanic, R.E. Mandatory Medicare bundled payment: Is it ready for prime time? N Engl J Med. 2015;373[14]:1291-3.
2. U.S. Department of Health and Human Services. Better, smarter, healthier: In historic announcement, HHS sets clear goals and timeline for shifting Medicare reimbursements from volume to value. January 26, 2015. Available from: http://www.hhs.gov/about/news/2015/01/26/better-smarter-healthier-in-historic-announcement-hhs-sets-clear-goals-and-timeline-for-shifting-medicare-reimbursements-from-volume-to-value.html. Accessed June 28, 2016.
3. Patel, K., Presser, E., George, M., et al. Shifting away from fee-for-service: Alternative approaches to payment in gastroenterology. Clin Gastroenterol Hepatol. 2016;14[4]:497-506.
4. Medicare FY 2016 IPPS final rule. Available from: https://www.cms.gov/Medicare/Medicare-Fee-for-Service-Payment/AcuteInpatientPPS/FY2016-IPPS-Final-Rule-Home-Page.html. Accessed June 28, 2016.
5. Ketover, S.R. Bundled payment for colonoscopy. Clin Gastroenterol Hepatol. 2013;11[5]:454-7.
6. Coulam, R.F., Gaumer, G.L. Medicare’s prospective payment system: a critical appraisal. Health Care Financ Rev Annu Suppl. 1991:45-77.
Dr. Mehta is in the division of gastroenterology, Perelman School of Medicine, University of Pennsylvania, and Penn Medicine Center for Health Care Innovation, University of Pennsylvania, Philadelphia. The author discloses no conflicts of interest.
Building a cancer genetics and prevention program
Gastroenterologists offer more than just high-quality colonoscopy for colon cancer prevention. We often are the specialists who first recognize a genetic cancer syndrome during our endoscopy or clinic sessions. The patient who piqued my interest in colon cancer genetics was a 24-year-old woman who was referred for postoperative nausea after a hysterectomy for early stage uterine cancer (that alone should have raised alarm bells). Endoscopy revealed (by happenstance) a stomach coated with polyps. This led to a colonoscopy and diagnosis of familial adenomatous polyposis (uterine cancer within FAP is unusual but reported, for those of you studying for boards). In 1991, no coordinated genetics program existed within my practice so I arranged referrals to genetic counselors, surgeons, and pathologists. This led to the discovery of FAP and early stage (and curable) cancers in her two brothers and her father, in addition to extended pedigree analysis that established multi-organ cancer risks in other relatives. Years later, she brought her two adopted children to meet me and told me of lighting candles in my honor during an American Cancer Society walk. This is why we become doctors.
In this column, Dr. Xavier Llor describes the cancer genetics program he and others have built at Yale. It provides practical steps that can be taken by health system or community-based gastroenterologists to recognize and manage these complex syndromes. We are the specialists on the front lines and Dr. Llor helps us provide the coordinated care our patients expect from us.
John I. Allen, MD, MBA, AGAF
Editor in Chief
Among all common cancers, breast and colon have the highest percentage of cases that are due to hereditary syndromes. Many of the responsible genes have been identified, and the last few years have seen an increase in uptake of genetic testing supported by the refinement of the clinical criteria suggestive of these syndromes as well as the clear improvement in outcomes as a result of the adoption of cancer preventive measures in mutation carriers.1 In spite of this, genetic testing for colorectal cancer (CRC) syndromes is not ordered as often as it should be according to the prevalence of these syndromes.2 In contrast, testing for hereditary breast cancer has become more generalized, and the threshold for ordering genetic testing in the latter is often lower than for CRC. The are several reasons for this: 1) much greater awareness, by both providers and the general public, of hereditary breast cancer conditions; 2) fewer providers with expertise in CRC genetics; 3) lack of a systematic approach to identify patients with potential CRC syndromes; and 4) absence of a clear premorbid phenotype for the most common of all CRC syndromes, Lynch syndrome.3
The recent recommendation in practice guidelines to screen all CRC tumors for Lynch syndrome either with immunohistochemistry to evaluate mismatch repair (MMR) protein expression or through tandem repeat analysis to test for microsatellite instability4 has highlighted that about 10% of all CRCs (a percentage consistently seen in different ethnic groups5) need further cancer genetic evaluation, and many will require sequencing of germline DNA. Although data on cost-effectiveness of this approach are somewhat conflicting,6,7 it is sensible because it is systematic, and studies have shown an increase in diagnostic yield through universal tumor screening.8 Unfortunately, in practice, often suspicious tumor testing results are not followed up by cancer genetics referrals, and many patients with CRC syndrome remain undiagnosed.
Patients with oligopolyposis (fewer than 100 polyps over time) also present diagnostic challenges. Some have attenuated familial adenomatous polyposis because of an APC mutation or MUTYH-associated polyposis. Recent findings have revealed other less commonly mutated genes that also result in oligopolyposis and a significant CRC risk: polymerases POLE and POLD1, GREM1, MCM9, or NTHL1. Because of the relatively low number of polyps in many of these syndromes and the lack of a systematic strategy to add up all polyps diagnosed over time, we not uncommonly fail to suspect some polyposis syndromes. Furthermore, the mixed pattern of polyps that is often associated with some of the mentioned mutated genes adds an extra challenge to diagnosing these cases.
Once individuals with CRC syndromes are identified, the challenge is to provide them with the care that they need, because many gastroenterologists, oncologists, and other health care providers are not extremely familiar with the current options for these patients.
In summary, there is a need to find systematic ways to triage and appropriately refer patients with a potential CRC syndrome to cancer genetics specialists so patients and their families can benefit from proper diagnosis and cancer preventive measures.
Building a comprehensive cancer genetics program
Although implementing systematic approaches is key to selecting individuals at risk, the complexity of caring for these patients demands a service that can stand up to the multiple challenges. For instance, most CRC syndromes are in fact multi-cancer syndromes with an increased risk of cancer and other pathologies in different organs beside the colon. Furthermore, the psychological implications of having a heritable cancer condition often take an important toll on affected families, with common feelings of guilt for having passed the mutated genes to the offspring.
Thus, to provide the best care to affected families, there is a tremendous need for well-organized and comprehensive cancer genetics services that are capable of responding to the multiple needs of these families so state-of-the-art cancer preventive measures can be carried out and multilevel support can be provided. The mentioned considerations were the guiding force in the creation of the Smilow Cancer Genetics and Prevention Program (SCGPP) at Yale. Thus, we established a comprehensive program that brings together health professionals specializing in different aspects of these patients’ care that ensures their proper attention in a longitudinal fashion, making the program their home for health care. We integrated in the program, among others, physician leaders in gastrointestinal (GI), breast, gynecological, endocrine, and genitourinary high-risk malignancies; genetic counselors; an advanced practice registered nurse specializing in cancer prevention and risk reduction; and a scientific director who leads the Clinical Laboratory Improvement Amendments–certified laboratory at Yale that offers in-house genetic testing, including full exome sequencing. The SCGPP was started in July 2015, and it currently provides more than 250 new consultations per month.
The following are several key elements that I consider important for a cancer genetics program and how they have been addressed at the SCGPP.
Identification through risk stratification
Because the identification of all individuals who can benefit from cancer genetics consultation is complex yet essential, a comprehensive approach with different strategies is often necessary.9 Universal tumor testing is an effective tool, but other complementary approaches such as the use of questionnaires can also contribute to identifying patients in need for cancer genetics assessment. In our program, the pathology department tests for MMR protein expression in all bowel and endometrial tumors. The ones that have loss of expression of an MMR protein are reported to the SCGPP, which contacts the patient’s providers to request a referral. In a relatively short implementation time, this has already resulted in a significant increase in the number of patients referred for cancer genetics consultation and new Lynch syndrome diagnosis. On the other hand, two brief and simplified questionnaires have been developed and distributed in clinics, one for health providers and one administered directly to patients. The questionnaires contain questions related to the patient’s own cancer history, polyp history, cancer screening tests, and family history. The first one assists health care providers in identifying individuals. The second one is completed by patients, collected, and reviewed by a genetic counselor. Suitable patients are invited to a cancer genetics consultation through their primary health care providers. A third questionnaire directed to endoscopy services will be rolled out soon. This collects information on completed endoscopy procedures, polyps and cancers found, and family history.
The program is currently working with information technology to develop a system to pull from the electronic medical record (EMR) relevant information on the patient’s own medical history, family history, and endoscopy findings. A set of criteria has been established so relevant information will generate an alert for prompt referral for the SCGPP.
Because education of health care providers about these conditions is essential to foster collaboration and to help them better understand about cancer risk assessment, genetics, and what the SCGPP can offer to some of their patients, sessions are routinely held with some of them to discuss different aspects on cancer genetics.
In summary, a comprehensive and coordinated approach is key to substantially expand the number of individuals identified and referred for cancer genetics assessment.
Genetic testing
During the last few years we have witnessed changes at different levels around genetic testing that are having a tremendous impact. Some of these changes pose significant new challenges that require rapid adaptation on the providers’ side. Thus, we are quickly moving from single gene testing to panels of genes tested at once. This has resulted in unexpected findings such as mutated genes not initially suspected or variants of unknown significance that often should be interpreted in the context of the personal and family history of cancer because of the lack of definite information on their potential pathogenicity.10 Adding to that, genome-scale tumor sequencing is becoming more common as it increasingly informs on the types of anti-tumor therapies to be selected for a specific patient (precision medicine). This approach is revealing some unexpected information because in some cases it has helped identify significant mutations in the germline.11
Finally, the increasing number of commercial laboratories offering genetic testing has resulted in more competition and lower prices, in some cases to a point that direct-to-consumer charges may be even lower than insurance copayments. This is contributing to a rapid increase in individuals being tested including patients who otherwise would unlikely have been tested in the past because of lack of fulfillment of insurance criteria. The challenge for us is to be ready to help navigate the increasing amount of information obtained as a result of all these changes.
Integration of electronic platforms
In an era of full implementation of EMRs, a cancer genetics program should not simply adapt to the new environment but fully embrace it and explore the possibilities that come with it. Thus, from its inception, the SCGPP has been embracing the electronic platforms to the maximum extent so the clinical operation is streamlined and documentation is well-displayed and accessible in the EMR. The Yale health care system uses EPIC (Epic Systems, Verona, WI) as its EMR, and the SCGPP uses Progeny (Progeny Genetics LLC, Delray Beach, FL) to collect data, construct family pedigrees, and build the research registry of the Program. A joint effort by the developers of both systems has resulted in integration at different levels. Thus, after a referral is received, patients are called, registered, and asked several questions including their own cancer and polyp history as well as their family history of cancer. This assists in triaging patients to the most appropriate SCGPP provider: a genetic counselor, a disease physician leader, or a combined visit according to the established internal protocol. In all cases, for new patients with GI cancer syndromes, a combined appointment of a genetic counselor and the GI physician leader is scheduled. At the same time, patients are sent an email with a link to the Progeny online questionnaire that includes personal and family history of cancer as well as extensive clinical information. Once the questionnaire is completed, the program generates a preliminary pedigree that patients can print, and the SCGPP gets a message communicating that the patient has completed this questionnaire. Therefore, when patients are seen on consultation, providers already have the provisional data and pedigree. During the visit, information is verified and edited as needed, and the finalized pedigree goes live through a hyperlink in the EMR. Every revision results in an updated pedigree visible through the mentioned hyperlink. This process saves a considerable amount of time to the providers and increases clinic efficiency.
Informed consent for the research registry is also fully electronic, with signatures recorded in tablets that transmit the signed document to a secure server.
The necessary team approach
Another essential component of a cancer genetics program like this is the integrated and comprehensive approach to patients. Thus, in our Program, the combined appointments for GI patients with the genetic counselor and the physician leader cover all different aspects of care, and a complete plan is suggested and discussed. Once the initial assessment is finalized and genetic testing results (if ordered) are completed, patients are followed prospectively to ensure that prophylactic and cancer prevention measures are undertaken according to the updated standards of care. Complex cases are discussed with the entire team in the weekly case conference that is always followed by a scientific conference with alternating topics such as journal club, practice improvement, ongoing research projects, and extensive case reviews.
Network integration
Although the needs for cancer genetics can be found in any corner of the map, it is not realistic to believe that services like this can be provided in a consistent fashion without being part of a bigger program umbrella. In our case, Yale’s Smilow Cancer Center charged the SCGPP with the duty to provide high quality and consistent cancer genetics services to the entire network that currently includes a total of 5 affiliated hospitals and 10 care centers. To do so, all cases seen outside the main campus are brought up for discussion in the weekly case conference. Furthermore, counselors distributed throughout the network routinely also see patients in the main office, and when away, they participate in case conference and scientific conference via teleconference or videoconference. All this is considered critical to facilitate a cohesive and state-of-the-art program that extends beyond the main campus. Recently, telemedicine is used to provide consultations directly to patients so the program’s services are brought to the most remote locations. A senior genetic counselor is in charge of the network operations to facilitate all these services and help engage providers in the corresponding facilities. She regularly attends tumor board meetings in the local hospitals to help disseminate knowledge in cancer genetics as well as to assist in the identification of patients who can benefit from referral to the SCGPP.
Surveillance and recall program
Key to the success of a cancer genetics program is successfully coordinating care so preventive tests and measures are performed to decrease cancer risk. The SCGPP aims to be the home for familial and hereditary cancer patients. For these patients, this implies a strong commitment to their needs, with a special emphasis on the appropriate prophylactic and cancer surveillance measures. The registry database provides an extremely useful tool to track scheduled tests and procedures and to generate reminders. The advanced practice registered nurse meticulously follows them and ensures proper completion and review. She follows up on the scheduling of the specific tests, reviews results once these tests are completed, and brings them back to discussion with the physician leader. She also follows up on incomplete tests and helps to bring down potential barriers in the performance of these tests. Another key aspect of her job consists of facilitating the assistance of psychological support or risk reduction through lifestyle changes, such as smoking cessation or weight reduction, to patients in need of such services.
Cancer genetics research
Key to an academic program in cancer genetics like this one is to facilitate the study of familial and syndromic cancers, including aspects such as phenotype characterization or the efficacy of chemopreventive approaches. To accomplish this, a patient registry is essential. Registries are extremely useful tools that facilitate data accrual and analysis. The SCGPP registry is based on the Progeny suite that incorporates not only clinical and pedigree building components but also the genotype and sample management systems (LAB and LIMS). Thus, a fully searchable and robust database and biological sample repository have been created, and all patients are approached about participating in this institutional review board–approved registry.
Cancer prevention in nonfamilial, nonsyndromic cases
Some nongenetic factors such as diet, physical activity, or toxic exposure seem to underlie the important differences seen in CRC incidence around the world.12 Thus, interventions at this level can potentially have a very high impact for cancer prevention in all individuals. In fact, even individuals with genetic mutations that carry a high risk for developing malignancies can see their risk modified by addressing lifestyle/environmental factors.13 Thus, the SCGPP has created tools for assessment and risk stratification that take the mentioned factors into account and create a roadmap for primary prevention. The tools include questionnaires on all environmental exposures, lifestyle factors, and medications the patient is exposed to and that can influence cancer risk. The information is reviewed in a special clinic session, and all services to help modify risk factors are offered to the patient.
Conclusions
There is a clear need for GI cancer genetics services to reach all patients who can benefit from them, and at the same time the field is rapidly growing in complexity. More than ever, these services demand a multidisciplinary approach, with experts leading the care of these patients in a coordinated fashion with the rest of the health care community. However, payers have not fully recognized these complexities, and some critical aspects such as genetic counseling services are not always properly reimbursed. As we shape up the present and future of health care that should be fully personalized and patient-centered, embracing new ways of delivering it, we need to engage all the players and help them understand what this takes and the rewards in the form of better outcomes that will come with it.
References
1. Kastrinos F., Stoffel E.M. History, genetics, and strategies for cancer prevention in Lynch syndrome. Clin Gastroenterol Hepatol. 2014;12:715-27 (quiz e41-e43).
2. Karlitz J.J., Hsieh M.C., Liu Y., et al. Population-based Lynch syndrome screening by microsatellite instability in patients </=50: prevalence, testing determinants, and result availability prior to colon surgery. Am J Gastroenterol. 2015;110:948-55.
3. Llor X. When should we suspect hereditary colorectal cancer syndrome? Clin Gastroenterol Hepatol. 2012;10:363-7.
4. Giardiello F.M., Allen J.I., Axilbund J.E., et al. Guidelines on genetic evaluation and management of Lynch syndrome: a consensus statement by the US Multi-society Task Force on colorectal cancer. Am J Gastroenterol. 2014;109:1159-79.
5. Berera S., Koru-Sengul T., Miao F., et al. Colorectal tumors from different racial and ethnic minorities have similar rates of mismatch repair deficiency. Clin Gastroenterol Hepatol. 2016;14:1163-71.
6. Mvundura M., Grosse S.D., Hampel H., et al. The cost-effectiveness of genetic testing strategies for Lynch syndrome among newly diagnosed patients with colorectal cancer. Genet Med. 2010;12:93-104.
7. Barzi A., Sadeghi S., Kattan M.W., et al. Comparative effectiveness of screening strategies for Lynch syndrome. J Natl Cancer Inst. 2015;107:1-9.
8. Moreira L., Balaguer F., Lindor N., et al. Identification of Lynch syndrome among patients with colorectal cancer. JAMA. 2012;308:1555-65.
9. Stoffel E.M., Kastrinos F. Familial colorectal cancer, beyond Lynch syndrome. Clin Gastroenterol Hepatol. 2014;12:1059-68.
10. Desmond A., Kurian A.W., Gabree M., et al. Clinical actionability of multigene panel testing for hereditary breast and ovarian cancer risk assessment. JAMA Oncol. 2015;1:943-51.
11. Parsons D.W., Roy A., Yang Y., et al. Diagnostic yield of clinical tumor and germline whole-exome sequencing for children with solid tumors. JAMA Oncol. 2016;([Epub ahead of print])
12. Aleksandrova K., Pischon T., Jenab M., et al. Combined impact of healthy lifestyle factors on colorectal cancer: a large European cohort study. BMC Med. 2014;12:168.
13. Movahedi M., Bishop D.T., Macrae F., et al. Obesity, aspirin, and risk of colorectal cancer in carriers of hereditary colorectal cancer: a prospective investigation in the CAPP2 study. J Clin Oncol. 2015;33:3591-7.
Dr. Llor is in the department of medicine and cancer center, Yale University, New Haven, Conn. He discloses no conflicts of interest.
How to sustain a quality improvement effort
In the final of a three-part series about developing and implementing a quality improvement initiative, Dr. Bernstein and his colleagues outline how such a program can be sustained and cemented into a gastroenterology practice. This mini-series has focused on community practices and presented a road map for quality improvement through descriptions of clinical vignettes – specifically focused on improving adenoma detection rates. In multiple other articles within the Toolbox series, we have described how gastroenterologists can measure and improve one of our most important outcome measures – the adenoma detection rate for screening colonoscopy. We all are aware of the Hawthorne effect (that is, observer effect) in which people modify their behavior in response to being measured or observed. The key to sustained quality improvement is to change fundamental practices once the flush of initial success fades.
John I. Allen, MD, MBA, AGAF
Editor in Chief
Series review
In this series, you are a community-based urban general gastroenterologist asked by hospital administration to improve your current group adenoma detection rate (ADR) of 19% to the established target of 25% among each individual endoscopist within the group during a 12-month period.
The team has implemented standardized endoscopist report cards during the past 9 months. At present, ADR has been more than 25% for all practitioners for 4 consecutive months. The quality improvement team meets to determine how to sustain the gains long term.
Sustainability of improved outcomes has been defined as: “When new ways of working and improved outcomes become the norm.”1 This incorporates a number of important concepts. “New ways of working” means that a change has been made in the way care has been provided. This includes interventions such as a new policy, implementation of a checklist, or a new clinical pathway. “Improved outcomes” implies that the result of the intervention has been measured and has demonstrated an improvement. “Become the norm” means that this change has now become a part of standard work and does not need ongoing support to continue.
Although a great deal of literature currently exists that focuses on initiation and implementation of quality improvement (QI) activities, much less has been written on sustaining efforts once the goal has been achieved. A number of reasons have been proposed for this, including stability being typically regarded as less interesting, as well as the research requiring much longer time frames for study.2 However, there is important evidence that suggests that up to 70% of long-term changes in health care organizations ultimately fail.3 This indicates a pressing need for effective strategies to sustain improved outcomes.
Challenges
A number of challenges face the sustainability phase of an intervention.2 First, the initial enthusiasm for a novel intervention wanes after time, often limiting long-term compliance if it has not become part of standard work. Second, the local or national support for a project may have changed as strategic priorities shift. This can result in a loss of leadership support and/or resources. Third, most institutions value novel ideas over a steady state, and focusing on the next initiative offers more career value for managers as compared with maintaining current practices. Finally, it is common for groups to declare victory too soon. This is defined as celebrating the first performance improvement as the final goal instead of it being the first step to long-term success.
Determining readiness for sustainability
The first step in determining readiness for sustaining an improvement is to determine whether there has been an actual improvement to sustain. This means both completing the plan-do-study-act cycles and establishing a true steady state. In addition, it needs to be demonstrated that a sustained change has occurred. The second article in this series addresses these steps in detail.4
The National Health Service (United Kingdom) Improvement Leaders’ Guide to Sustainability and Spread identifies four sets of questions to ask when determining whether a project can enter the sustainability phase.3
1. Is the (intervention) near the final stage of development? If there were room for further changes, would these completely alter the way the solution has been introduced?
2. Are the measurements demonstrating real improvement?
3. Who cares about this improvement? Is the solution representative of the wider views of those involved?
4. What policy or technological changes may render this solution redundant? When might this happen?
Once the answers to these questions have been determined and it is believed that a steady state has been achieved, it is time to move on to sustaining the intervention. Article no. 2 in our series outlines how to know whether an improvement has occurred. Although there is no single metric that can determine a project is in a steady state, it is generally believed that four or five cycles with consistent improvement and without special cause variation, along with an intervention that has been fully established, typically represent a steady state.
ACTION PLAN: For the ADR example, the answers to the questions are as follows:
1. The intervention was developed and finalized through iterative design among the QI team.
2. Performance has been consistently above target among all endoscopists for 4 consecutive months.
3. ADR is an important quality metric to individual endoscopists as well as hospital leadership. Moreover, because there are increasing models tying reimbursement to funding that are based on adherence to quality indicators, ADR will become more important.
4. If hospitals become mandated to provide scorecard data, the intervention may become redundant. However, the measurement and implications of the data still may be relevant to ongoing QI activities.
Interventions supporting sustainability
Sustainability planning is ideally started at the initiation phase of the project. When choosing a target for change, consideration of organizational factors such as strategic priorities, staff engagement, and leadership support are integral to long-term success. Factors influencing the type of intervention developed should include available funding (both long term and short term), existing information technology (IT) resources, and the ability to incorporate into existing workflow. Considering these factors from the outset will help improve a project’s long-term viability.
A number of toolkits have been produced to guide QI teams through the sustainability process. The National Health Service Institute for Innovation and Improvement has produced a comprehensive guide to sustainability.4 The guide provides advice on how to identify opportunities to increase the likelihood of sustainability for your initiative. It is accompanied by a model that can be used to predict success by dividing the factors influencing sustainability into three groups: staff, process, and organization. Each of these has a number of subcategories, and relative significance is attributed to each, with staff factors (clinical leadership engagement, senior leadership engagement, staff involvement in the change, and staff attitudes toward the change) holding the highest weighting. On the basis of the results of the model, the QI team can identify both the likelihood of success as well as opportunities for improvement.
Visual aids are another intervention that promotes sustainability. Visual cues such as posters, buttons, and magnets act as easy reminders for front-line staff. Creating a storyboard at the beginning of the project allows stakeholders to have a broad perspective on both the intervention and sustainability phases.5 Ongoing auditing and reporting of results also encourage long-term compliance. This can take the form of posting results of the intervention in the department on a regular basis as well as reports to senior administration. Regular check-ins with all stakeholders are also encouraged. This can be at a monthly staff meeting or a brief “improvement huddle” on a standing basis.
Factors influencing success
Any discussion of QI work must consider context. An understanding of the system one is working within will allow for optimization of system strengths and avoidance of pitfalls because of weaknesses. A lack of attention to context can lead to an unsuccessful project. This could be due to choosing a focus that is not in line with hospital priorities, a project that is asking staff to take on additional tasks without removing others, or developing a solution that requires funding or IT infrastructure that is not readily available.
Any organization has a number of different settings that need to be considered simultaneously. This is most simply divided into microsystem, mesosystem, and macrosystem. Microsystem is defined as the combination of a small team of people who work together on a regular basis. The mesosystem focuses on the integrated care needs of a particular group or population with the same diseases or conditions and provides support for individual microsystems. The macrosystem forms the infrastructure of the larger organization, providing the systems and governance that define the system.6 In our example, the microsystem is the endoscopy unit, including physicians, nurses, administrative support, and managers. The mesosystem is composed of the endoscopy unit in addition to the Departments of Gastroenterology and Surgery, the hospital IT team, and the Pathology Department. The macrosystem is the hospital, including senior leadership and administration. Another way of thinking about this is the microsystem is the environment most easily influenced by the individual provider, whereas the macrosystem includes the organizational-level factors that need to be taken into consideration when designing an intervention.
A great number of factors have been proposed to influence sustainability. National Health Service Scotland performed a literature review and met with subject matter experts to determine key factors that require consideration when engaging in activities to sustain and spread QI activities. They produced a guide that focused on 10 factors thought to have the greatest influence.6 Although a review of all 10 factors is beyond the scope of this review, we will highlight key ones to consider.
Innovation
The nature of the change greatly influences its likelihood of being sustained. In addition, one must consider the process of the intervention as well as those who will be impacted by the change. Core qualities that predispose to success include the following:7
1. Clear advantage compared with current ways
2. Compatibility/integration with current systems and values
3. Simplicity of the change and its implementation
4. Ease of testing
5. Observability of the change and its impact
This list highlights the point that the plan to sustain an intervention needs to start at the design phase and not once the change has been proven successful. Support among users also influences long-term success. Early adopters are those who embrace the intervention or change. Identifying the early adopters and using their support for positive publicity and momentum are integral in any sustainability effort.
ACTION PLAN: In our example, components of the intervention that would predispose to sustainability include choosing an outcome that is aligned with the hospital’s strategic focus (for example, cancer screening and prevention). ADR is already a measurable outcome at the hospital, which facilitates dissemination of results. Alternatively, some of the resistance to change may be due to the increased work to compile and distribute the scorecards monthly.
Organizational culture
Culture has been most simply defined as “the way we do things around here”.7 The approach of an organization toward QI will clearly impact its long-term viability. On a macrosystem level, interventions should ideally fit within strategic goals and priorities of organizations to garner maximum support. When promoting the intervention, it may be appropriate to focus on the benefits to the individual group (that is, cost savings to senior administration, time saved to front-line staff). Studies have shown that teams that demonstrate a strong teamwork ethic, have a positive attitude toward the intervention, and where all members know and understand their role on the team were more likely to have sustained success.8 In addition, engagement of all key stakeholders early in the process has been correlated with improved long-term outcomes. In a microsystem level, providers can choose to implement the intervention among a well-established team that works well together, ideally where there is a history or prior QI work.
Factors that may make sustaining a QI effort more challenging include interventions that increase time or costs to the organization. Many healthcare organizations may have specific targets set out from their regulatory body. If the intervention lowers the result of one of the targeted outcomes (or does not address those targets at all), it may be met with increased resistance within a system. In cases like this it is integral to use data to demonstrate to senior leadership why this still has tangible benefit to the organization.
ACTION PLAN: In our example, culture can promote sustainability on a microsystem level through reinforcing local success stories. This can be through posting of visual aids in the unit such as posters that display performance or progress boards that chart the status of the intervention. In addition, QI projects can be a regular agenda item at unit meetings, reinforcing their importance to team members.
Leadership
One key component of organizational culture is the influence of leadership. An effective leader will have both technical QI skills and strong interpersonal skills.7 Teams where all members feel comfortable making suggestions or voicing concerns are far more likely to succeed, and it is incumbent on leadership to create this environment. This concept is often termed psychological safety and has been directly linked to the inclusiveness of the leader. Team members with psychological safety are more likely to feel like active participants in the process, and this improves their long-term engagement.7,8 In addition, effective leaders create accountability systems to ensure gains are maintained. These may include regular performance reviews, reminders about the intervention, and assigning responsibility to senior level team members. Finally, celebration of accomplishments reinforces the positive impact of the time and energy invested by members of the team.9 The concept of distributed leadership is another key concept. This acknowledges that for any one intervention, there are a number of formal and informal leadership roles, and these can be filled by a number of different individuals.7
ACTION PLAN: For our ADR example, sustainability can be promoted through effective leadership. On a microsystem level, one option is the implementation of a weekly Improvement Huddle. This is a 10- to 15-minute meeting within the microsystem that is designed to review current performance and anticipate problems. All team members are encouraged to voice any concerns. On the macrosystem level, quarterly reports to senior administration and presentation of process and results at Grand Rounds may contribute to this goal.
Change management
Change management looks at how an organization approaches the new ways of working. This can be on both a social level and a technical level (often termed Organizational Infrastructure). Creating interventions that integrate with existing systems (data collection, workflow) is ideal for sustainability because it can serve to reinforce the change as standard work. In instances where the change does not immediately integrate, organizations can support change by demonstrating flexibility. This includes modification of existing technology to measure the desired outcome, development of new protocols to integrate the modified workflow, or changing job definitions of team members to demonstrate that the intervention is now considered part of daily responsibilities. Ongoing feedback also reinforces maintenance of performance. This can be through performance reviews for staff members as well as providing data to the appropriate audiences to demonstrate sustained gains.7,9
ACTION PLAN: For the ADR example, change management can contribute to sustainability through creation of a sustainable data reporting system that integrates current workflow. This will allow ongoing measurement of key metrics and is integral for long-term viability.
Summary
In this final article of a three-part series directed toward gastroenterologists interested in local QI endeavors, we selectively reviewed concepts surrounding sustainability of QI endeavors. This included determining readiness and understanding the factors that influence long-term success on both a macrosystem and microsystem level. Factors under the direct control of the individual practitioner were highlighted to give examples of specific strategies for successful sustainability.
References
1. Thomas, S., Zahn, D. Sustaining improved outcomes: a toolkit. Available at: http://nyshealthfoundation.org/resources-and-reports/resource/sustaining-improved-outcomes-a-toolkit.
2. Buchanan, D., Fitzgerald, L., Ketley, D., et al. No going back: a review of the literature on sustaining organizational change. Int. J Manag Rev. 2005;7:189-205.
3. Sustainability: model and guide. National Health Service Institute for Innovation and Improvement, Leeds, U.K.; 2007.
4. Improvement leaders’ guide to sustainability and spread. NHS Modernisation Agency. Ipswich, England: Ancient House Printing Group; 2002.
5. Nelson, E.C., Batalden, P.B., Godfrey, M.M. Quality by design: a clinical microsystems approach. Jossey-Bass, San Francisco, Calif; 2007.
6. Available at: http://www.ashpfoundation.org/lean.
7. NHS Scotland Quality Improvement Hub. The spread and sustainability of quality improvement in healthcare. 2014. Available at: http://www.qihub.scot.nhs.uk/knowledge-centre/quality-improvement-topics/spread-and-sustainability.aspx.
8. Healthcare Improvement Scotland. Quality improvement: sustainable in any organizational culture? 2013. Available at: http://www.healthcareimprovementscotland.org/previous_resources/benchmarking_report/quality_improvement_report.aspx.
9. 5 Million Lives Campaign. Getting started kit: rapid response teams. Institute for Healthcare Improvement, Cambridge, MA; 2008 (Available at:) www.ihi.org.
Dr. Bernstein is in the division of gastroenterology, department of medicine, Sunnybrook Health Sciences Centre; Dr. Weizman is at the Mount Sinai Hospital Centre for Inflammatory Bowel Disease, department of medicine, and Institute of Health Policy, Management and Evaluation; Dr. Mosko is in the division of gastroenterology, department of medicine, St. Michael’s Hospital, and the Institute of Health Policy, Management, and Evaluation; Dr. Bollegala is in the division of gastroenterology, department of medicine, Women’s College Hospital; Dr. Brahmania is in the Toronto Center for Liver Diseases, division of gastroenterology, department of medicine, University Health Network; Dr. Liu is in the division of gastroenterology, department of medicine, University Health Network; Dr. Steinhart is at Mount Sinai Hospital Centre for Inflammatory Bowel Disease, department of medicine and Institute of Health Policy, Management, and Evaluation; Dr. Silver is in the division of nephrology, St. Michael’s Hospital; Dr. Nguyen is at Mount Sinai Hospital Centre for Inflammatory Bowel Disease, department of medicine; and Dr. Bell is in the division of internal medicine, department of medicine, Mount Sinai Hospital. All are at the University of Toronto except Dr. Hou, who is at the Houston VA Health Services Research and Development Center of Excellence, Michael DeBakey Veterans Affairs Medical Center, and the section of gastroenterology and hepatology, Baylor College of Medicine, Houston. The authors disclose no conflicts.
The plan-do-study-act cycle and data display
This month’s column is the second in a series of three articles written by a group from Toronto and Houston. The series imagined that a community of gastroenterologists set out to improve the adenoma detection rates of physicians in their practice. The first article described the design and launch of the project. This month, Dr. Bollegala and her colleagues explain the plan-do-study-act (PDSA) cycle of improvement within a small practice. The PDSA cycle is a fundamental component of successful quality improvement initiatives; it allows a group to systematically analyze what works and what doesn’t. The focus of this article is squarely on small community practices (still the majority of gastrointestinal practices nationally), so its relevance is high. PDSA cycles are small, narrowly focused projects that can be accomplished by all as we strive to improve our care of the patients we serve. Next month, we will learn how to embed a quality initiative within our practices so sustained improvement can be seen.
John I. Allen, MD, MBA, AGAF
Editor in Chief
Article 1 of our series focused on the emergence of the adenoma detection rate (ADR) as a quality indicator for colonoscopy-based colorectal cancer screening programs.1 A target ADR of 25% has been established by several national gastroenterology societies and serves as a focus area for those seeking to develop quality improvement (QI) initiatives aimed at reducing the interval incidence of colorectal cancer.2 In this series, you are a community-based urban general gastroenterologist interested in improving your current group ADR of 19% to the established target of 25% for each individual endoscopist within the group over a 12-month period.
This article focuses on a clinician-friendly description of the plan-do-study-act (PDSA) cycle, a key construct within the Model for Improvement framework for QI initiatives. It also describes the importance and key elements of QI data reporting, including the run chart. All core concepts will be framed within the series example of the development of an institutional QI initiative for ADR improvement.
Plan-Do-Study-Act cycle
Conventional scientific research in health care generally is based on large-scale projects, performed over long periods of time and producing aggregate data analyzed through summary statistics. QI-related research, as it relates to PDSA, in contrast, is characterized by smaller-scale projects performed over shorter periods of time, with iterative protocols to accommodate local context and therefore optimize intervention success. As such, the framework for their development, implementation, and continual modification requires a conceptual and methodologic shift.
The PDSA cycle is characterized by four key steps. The first step is to plan. This step involves addressing the following questions: 1) what are we trying to accomplish? (aim); 2) how will we know that a change is an improvement? (measure); and 3) what changes can we make that will lead to improvement? (change). Additional considerations include ensuring that the stated goal is attainable, relevant, and that the timeline is feasible. An important aspect of the plan stage is gaining an understanding for the current local context, key participants and their roles, and areas in which performance is excelling or is challenged. This understanding is critical to conceptually linking the identified problem with its proposed solution. Formulating an impact prediction allows subsequent learning and adaptation.
The second step is to do. This step involves execution of the identified plan over a specified period of time. It also involves rigorous qualitative and quantitative data collection, allowing the research team to assess change and document unexpected events. The identification of an implementation leader or champion to ensure protocol adherence, effective communication among team members, and coordinate accurate data collection can be critical for overall success.
The third step is to study. This step requires evaluating whether a change in the outcome measure has occurred, which intervention was successful, and whether an identified change is sustained over time. It also requires interpretation of change within the local context, specifically with respect to unintended consequences, unanticipated events, and the sustainability of any gains. To interpret study findings appropriately, feedback with involved process members, endoscopists, and/or other stakeholder groups may be necessary. This can be important for explaining the results of each cycle, identifying protocol modifications for future cycles, and optimizing the opportunity for success. Studying the data generated by a QI initiative requires clear and accurate data display and rules for interpretation.
The fourth step is to act. This final step allows team members to reflect on the results generated and decide whether the same intervention should be continued, modified, or changed, thereby incorporating lessons learned from previous PDSA cycles (Figure 1).3
Despite these challenges, the PDSA framework allows for small-scale and fast-paced initiative testing that reduces patient and institutional risk while minimizing the commitment of resources.4,7 Successful cycles improve stakeholder confidence in the probability for success with larger-scale implementation.
In our series example, step 1 of the PDSA cycle, plan, can be described as follows: Aim: increase the ADR of all group endoscopists to 25% over a 12-month period. Measure: Outcome: the proportion of endoscopists at your institution with an ADR greater than 25%; process – withdrawal time; balancing – staff satisfaction, patient satisfaction, and procedure time. Change: Successive cycles will institute the following: audible timers to ensure adequate withdrawal time, publication of an endoscopist-specific composite score, and training to improve inspection technique.8
In step 2 of the PDSA cycle, do, a physician member of the gastroenterology division incorporates QI into their job description and leads a change team charged with PDSA cycle 1. An administrative assistant calculates the endoscopist-specific ADRs for that month. Documentation of related events for this cycle such as unexpected physician absence, delays in polyp histology reporting, and so forth, is performed.
In step 3 of the PDSA cycle, study, the data generated will be represented on a run chart plotting the proportion of endoscopists with an ADR greater than 25% on the y-axis, and time (in monthly intervals) on the x-axis. This will be described in further detail in a later section.
In the final step of the PDSA cycle, act, continuation and modification of the tested changes can be represented as follows.
Displaying data
The documentation, analysis, and interpretation of data generated by multiple PDSA cycles must be displayed accurately and succinctly. The run chart has been developed as a simple technique for identifying nonrandom patterns (that is, signals), which allows QI researchers to determine the impact of each cycle of change and the stability of that change over a given time period.9 This often is contrasted with conventional statistical approaches that aggregate data and perform summary statistical comparisons at static time points. Instead, the run chart allows for an appreciation of the dynamic nature of PDSA-driven process manipulation and resulting outcome changes.
Correct interpretation of the presented data requires an understanding of common cause variation (CCV) and special cause variation (SCV). CCV occurs randomly and is present in all health care processes. It can never be eliminated completely. SCV, in contrast, is the result of external factors that are imposed on normal processes. For example, the introduction of audible timers within endoscopy rooms to ensure adequate withdrawal time may result in an increase in the ADR. The relatively stable ADR measured in both the pre-intervention and postintervention periods are subject to CCV. However, the postintervention increase in ADR is the result of SCV.10
As shown in Figure 2, the horizontal axis shows the time scale and spans the entire duration of the intervention period. The y-axis shows the outcome measure of interest. A horizontal line representing the median is shown.9 A goal line also may be depicted. Annotations to indicate the implementation of change or other important events (such as unintended consequences or unexpected events) also may be added to facilitate data interpretation.
Shift: at least six consecutive data points above or below the median line are needed (points on the median line are skipped).9 To assess a shift appropriately, at least 10 data points are required.
Trend: at least five consecutive data points all increasing in value or all decreasing in value are needed (numerically equivalent points are skipped).9
Runs: a run refers to a series of data points on one side of the median.9 If a random pattern of data points exists on the run chart, there should be an appropriate number of runs on either side of the median. Values outside of this indicate a higher probability of a nonrandom pattern.9,11
Astronomic point: this refers to a data point that subjectively is found to be obviously different from the rest and prompts consideration of the events that led to this.9
Although straightforward to construct and interpret for clinicians without statistical training, the run chart has specific limitations. It is ideal for the display of early data but cannot be used to determine its durability.9 In addition, a run chart does not reflect discrete data with no clear median.
The example run chart in Figure 2 shows that there is a shift in data points from below the median to above the median, ultimately achieving 100% group adherence to the ADR target of greater than 25%. There are only two runs for a total of 12 data points within the 12-month study period, indicating that there is a 5% or less probability that this is a random pattern.11 It appears that our interventions have resulted in incremental improvements in the ADR to exceed the target level in a nonrandom fashion. Although the cumulative effect of these interventions has been successful, it is difficult to predict the durability of this change moving forward. In addition, it would be difficult to select only a single intervention, of the many trialed, that would result in a sustained ADR of 25% or greater.
Summary and next steps
This article selectively reviews the process of change framed by the PDSA cycle. We also discuss the role of data display and interpretation using a run chart. The final article in this series will cover how to sustain change and support a culture of continuous improvement.
References
1. Corley, D.A., Jensen, C.D., Marks, A.R., et al. Adenoma detection rate and risk of colorectal cancer and death. N Engl J Med. 2014;370:1298-306.
2. Cohen, J., Schoenfeld, P., Park, W., et al. Quality indicators for colonoscopy. Gastrointest Endosc. 2015;81:31-53.
3. Module 5: Improvement Cycle. (2013). Available at: http://implementation.fpg.unc.edu/book/export/html/326. Accessed Feb. 1, 2016.
4. Taylor, M.J., McNicholas, C., Nicolay, C., et al. Systematic review of the application of the plan-do-study-act method to improve quality in healthcare. BMJ Qual Saf. 2014;23(4):290-8.
5. Davidoff, F., Batalden, P., Stevens, D. et al. Publication guidelines for quality improvement in health care: evolution of the SQUIRE project. Qual Saf Health Care. 2008;17:i3-9.
6. Ogrinc, G., Mooney, S., Estrada, C., et al. The SQUIRE (standards for Quality Improvement Reporting Excellence) guidelines for quality improvement reporting: explanation and elaboration. Qual Saf Health Care. 2008;17:i13-32.
7. Nelson, E.C., Batalden, B.P., Godfrey, M.M. Quality by design: a clinical microsystems approach. Jossey-Bass, San Francisco; 2007.
8. Coe, S.G.C.J., Diehl, N.N., Wallace, M.B. An endoscopic quality improvement program improves detection of colorectal adenomas. Am J Gastroenterol. 2013;108(2):219-26.
9. Perla, R.J., Provost, L.P., Murray, S.K. The run chart: a simple analytical tool for learning from variation in healthcare processes. BMJ Qual Saf. 2011;20:46-51.
10. Neuhauser, D., Provost, L., Bergman, B. The meaning of variation to healthcare managers, clinical and health-services researchers, and individual patients. BMJ Qual Saf. 2011;20:i36-40.
11. Swed, F.S. Eisenhart, C. Tables for testing randomness of grouping in a sequence of alternatives. Ann Math Statist. 1943;14:66-87
Dr. Bollegala is in the division of gastroenterology, department of medicine, Women’s College Hospital; Dr. Mosko is in the division of gastroenterology, department of medicine, St. Michael’s Hospital, and the Institute of Health Policy, Management, and Evaluation; Dr. Bernstein is in the division of gastroenterology, department of medicine, Sunnybrook Health Sciences Centre; Dr. Brahmania is in the Toronto Center for Liver Diseases, division of gastroenterology, department of medicine, University Health Network; Dr. Liu is in the division of gastroenterology, department of medicine, University Health Network; Dr. Steinhart is at Mount Sinai Hospital Centre for Inflammatory Bowel Disease, department of medicine and Institute of Health Policy, Management, and Evaluation; Dr. Silver is in the division of nephrology, St. Michael’s Hospital; Dr. Bell is in the division of internal medicine, department of medicine, Mount Sinai Hospital; Dr. Nguyen is at Mount Sinai Hospital Centre for Inflammatory Bowel Disease, department of medicine; Dr. Weizman is at the Mount Sinai Hospital Centre for Inflammatory Bowel Disease, department of medicine, and Institute of Health Policy, Management and Evaluation. All are at the University of Toronto. Dr. Patel is in the division of gastroenterology and hepatology, department of medicine, Baylor College of Medicine, Houston. The authors disclose no conflicts.
Launching a quality improvement initiative
This article by Adam Weizman and colleagues is the first of a three-part series that will provide practical advice for practices that wish to develop a quality initiative. The first article, “Launching a quality improvement initiative” describes the infrastructure, personnel, and structure needed to approach an identified problem within a practice (variability in adenoma detection rates). This case-based approach helps us understand the step-by-step approach needed to reduce variability and improve quality. The authors present a plan (road map) in a straightforward and practical way that seems simple, but if followed carefully, leads to success. These articles are rich in resources and link to state-of-the-art advice.
John I. Allen, MD, MBA, AGAF, Special Section Editor
There has been increasing focus on measuring quality indicators in gastroenterology over the past few years. The adenoma detection rate (ADR) has emerged as one of the most important quality indicators because it is supported by robust clinical evidence.1-3 With every 1% increase in ADR, a 3% reduction in interval colorectal cancer has been noted.3 As such, an ADR of 25% has been designated as an important quality target for all endoscopists who perform colorectal cancer screening.1
You work at a community hospital in a large, metropolitan area. Your colleagues in a number of other departments across your hospital have been increasingly interested in quality improvement (QI) and have launched QI interventions, although none in your department. Moreover, there have been reforms in how hospital endoscopy units are funded in your jurisdiction, with a move toward volume-based funding with a quality overlay. In an effort to improve efficiency and better characterize performance, the hospital has been auditing the performance of all endoscopists at your institution over the past year. Among the eight endoscopists who work at your hospital, the overall ADR has been found to be 19%, decreasing to less than the generally accepted benchmark.1
In response to the results of the audit in your unit, you decide that you would like to develop an initiative to improve your group’s ADR.
Forming a quality improvement team
The first step in any QI project is to establish an improvement team. This working group consists of individuals with specific roles who perform interdependent tasks and share a common goal.4 Usually, frontline health care workers who are impacted most by the quality-of-care problem form the foundation of the team. A team lead is identified who will oversee the project. Content experts are also helpful members of the team who may have particular expertise in the clinical domain that will be the focus of the project. In addition, an improvement adviser, an individual with some expertise in QI, is needed on the team. This adviser may be from within your department or from outside. Although they may not possess expertise in the clinical problem you are trying to tackle, they should have skills in QI methodology and process to aid the team. An executive sponsor also needs to be identified. This should be an influential and well-respected individual who holds a senior administrative position at your institution who can help the team overcome barriers and secure resources. Physician engagement is a critical, often-overlooked step in any improvement effort. Regardless of the initiative, physicians continue to have tremendous influence over hospital-based outcomes.5 Identifying a physician champion, a prominent and respected physician at your organization to help spread the importance of your efforts and create a burning platform for change, is helpful. It also is valuable to have a patient on the improvement team to provide unique perspectives that only the end user of health care can convey and to ensure that the project is patient centered, as all improvement efforts should be.6
Improvement framework
Before starting any improvement effort, there are several important considerations that need to be addressed when choosing a quality improvement target.7 It is important to have a good understanding of the burden and severity of the problem. This often requires audit and measuring. For example, although we may think there is a problem with ADR in our endoscopy unit based on a general impression, it is critical to have data to support this suspicion. This is part of a current state analysis (discussed later). It also is important to select a quality-of-care problem that is under you or your group’s direct control. For example, it would be difficult to initiate a quality improvement project aimed at changing the practice of radiology reporting as a gastroenterologist. It is important to pick a problem that is focused and within a narrow scope that is feasible to address and then improve. Consideration of the unintended consequences of an improvement initiative often is overlooked, but needs to be considered because not all that comes out of quality improvement efforts is good. Finally, the likelihood of success of a quality initiative is increased significantly if it can generate momentum and lead to other interventions both within your department and beyond.
There are several specific improvement frameworks that can be used by a team to address a quality-of-care problem and perform a quality improvement project. The framework chosen depends on the type of problem that is being targeted and the training of the individuals on the improvement team. Three of the most commonly used improvement frameworks include the following: 1) Six Sigma; 2) Lean; and 3) Model for Improvement.
Six Sigma
Six Sigma is focused on improvement by reducing variability.8 It is a highly analytic framework relying on statistical analysis and mathematical modeling. It is best suited for projects in which the root cause and contributors to the target problem remain unclear and the aim of the intervention is to reduce variation.
Lean
Lean emphasizes improvement through elimination of waste and classifies all parts of any process as value added and nonvalue added.9 It is estimated that 95% of activities in any health care process are nonvalue added and the objective of Lean is to identify opportunities to simplify and create efficiencies. It is best suited for target problems that directly can be observed and mapped out, for example, process of care, flow, and efficiency of an endoscopy unit.
Model for Improvement
The Model for Improvement has been popularized by the Institute for Healthcare Improvement.10,11 It is well suited for health care teams, and its advantages are its adaptability to many improvement targets and lack of extensive training, consultant support, or statistical training as required by the previous frameworks mentioned earlier. As a result, it is the most commonly used improvement framework.
Using the Model for Improvement
The Model for Improvement is organized around three main questions: 1) What are we trying to accomplish? 2) How will we know that a change is an improvement? and 3) What changes can result in improvement?
Question 1: What are we trying to accomplish?
The first stage using the Model for Improvement is developing a clear project aim. A good aim statement should be specific in defining what measures one is hoping to improve and setting a concrete deadline by which to achieve it.10,11 It should answer the questions of what the team is trying to improve, by how much, and by what date. It is more effective for the target to be an ambitious, stretch goal to ensure the effort is worth the resources and time that will be invested by the team. Not only does a good aim statement serve as the foundation for the project, but it can redirect the team if the improvement effort is getting off track. In the earlier example of improving ADR, an aim statement could be “to increase the ADR of all endoscopists who perform colonoscopy at your hospital to 25% over a 12-month period.”
Question 2: How will we know that a change is an improvement?
This step involves defining measures that will allow you to understand if changes implemented are impacting the system within which your target problem resides and if this represents an improvement. This usually involves continuous, real-time measurement. Outcome measures are clinically relevant outcomes and are the ultimate goal of what the project team is trying to accomplish. In the example of ADR, this could be the proportion of endoscopists at your institution with an ADR greater than 25%. Process measures are relevant to the system within which you are working and your target problem resides. Typically, the intervention that you implement will have impact that is measurable much earlier by process outcomes than outcomes measures, which are usually a downstream effect. As such, an improvement project still may be a success if it shows improvements in process measures only. For example, the proportion of endoscopists measuring withdrawal time would be a process measure in an intervention aimed at improving ADR. In time, improvement in process measures may translate to improvements in the outcome measure. Balancing measures are indicators of unintended consequences of the project. Not all that comes from an improvement effort is necessarily positive. If improvements in certain process measures come at the cost of harms shown by the balancing measures, such as deterioration in staff satisfaction or increase in time per procedure, the improvement project may not be worth continuing.
Importance of understanding the target problem: Current-state analysis
In contrast to classic enumerative research in which the clinical environment can be well controlled, quality improvement work focuses on sampling and intervening upon a less controlled and dynamic process or system with the intent of improving it.10 Just as treatment strategies in clinical medicine are based on diagnostic testing, so too in quality improvement work, the strategy of diagnosing the current state allows for linking the root cause of quality problems with solutions that can induce positive change.
Several common diagnostic tools are used to identify root causes of quality and safety issues. These include the following: 1) process mapping, 2) cause-and-effect diagrams, and 3) Pareto charts.
Process mapping
Process maps are tools used to understand the system that is being studied. A process map is a graphic depiction of the flow through a process, which creates a collaborative awareness of the current state and identifies opportunities for improvement. It is important that multiple individuals who have knowledge of the process in question are involved in its creation. Process maps are created by first establishing the start and end of the process. Second, the high-level steps are included. Third, a more detailed set of steps can be included within each of the high-level steps.
Cause-and-effect diagrams
Cause-and-effect diagrams, also known as Ishikawa or fishbone diagrams, are helpful brainstorming tools used to graphically display and explore potential causes of a target problem. They illustrate that there often are many contributing factors to one underlying problem and the relationship between contributing factors. Classic examples of categories include equipment, environment, materials, methods and process, people, and measurement.10 Figure 1 provides an example of these tools in an effort to improve ADR.
To identify the most important contributors to the target problem and thus where to focus improvement efforts, a Pareto chart, a bar graph that places all defects/causes in the order of the frequency in which they occur, is constructed. The x-axis is a list of possible defects (Figure 1). The y-axis is the frequency with which any one defect is occurring, and the third (x-2) axis is the cumulative frequency. In theory, it is expected that there will be a vital few defects that account for 80% of all occurrences (referred to by some as the 80:20 rule).10, 11 Populating this graph requires measurement, which, as discussed earlier, is the key to understanding any problem. Measurement can be accomplished through direct observation/audit, chart review, and/or multivoting.
Question 3: What changes can result in improvement?
Once the improvement team has defined an aim and established its family of measures, it is time to develop and implement an intervention. Rather than investing time and resources into one intervention that may or may not be successful, it is preferable to perform small change cycles in which the intervention is conducted on a small scale, refined, and either repeated or changed. As a result, most quality improvement projects consist of an iterative process. The Model for Improvement defines four steps that allow the improvement team to perform this: Plan, do, study, act (PDSA).4,10,11 The first two questions listed earlier allowed the improvement team to plan the intervention. The next step, do, involves implementing your project on a small scale, thereby testing your change while collecting continuous measurements. Study involves interpreting your data using both conventional methods and several improvement-specific methods (discussed later) that help answer the question of how will we know that a change is improvement? Finally, act involves making a conclusion about your first PDSA cycle, helping to inform subsequent cycles. This results in a series of small, rapid cycle changes, one building on the next, that lead to implementation of change(s) that ultimately serve to address your improvement problem and your project aim.
A change concept is an approach known to be useful in developing specific changes that result in improvement. Change concepts are used as a starting point to generate change ideas. A number of change concepts spanning nine main categories have been defined by the Associates for Process Improvement,10 including eliminating waste, improving work flow, managing variation, and designing systems to prevent error. For the purpose of improving ADR, your team may choose a few change concepts and ideas based on the diagnostic work-up. For example, the change concept of designing the system to prevent errors through standardizing withdrawal time for all physicians may lead to an improvement in ADR. This then is linked to the change idea of audible timers placed in endoscopy suites to ensure longer withdrawal times.12 The impact of this change would be measured and the next cycle would build on these results.
Summary and next steps
In this first article of the series, the QI team moved forward with their aim to increase ADR. A root cause analysis was undertaken using multiple diagnostic tools including a fishbone diagram and a Pareto chart. Finally, change ideas were generated based on the earlier-described root causes and established change concepts. The next steps involve undertaking PDSA cycles to test change ideas and monitor for improvement.
References
1. Rex, D.K., Schoenfeld, P.S., Cohen, J. et al. Quality indicators for colonoscopy. Gastrointest Endosc. 2015;81:31-53.
2. Rex, D.K., Bond, J.H., Winawer, S. et al. Quality in the technical performance of colonoscopy and the continuous quality improvement process for colonoscopy: recommendations of the U.S. Multi-Society Task Force on Colorectal Cancer. Am J Gastroenterol. 2002;97:1296-308.
3. Corley, D., Jensen, C.D., Marks, A.R. et al. Adenoma detection rate and risk of colorectal cancer and death. N Engl J Med. 2014;370:1298-306.
4. Kotter, J.P. Leading change. Harvard Business Review Press, Boston; 2012
5. Taitz, J.M., Lee, T.H., and Sequist, T.D. A framework for engaging physicians in quality and safety. BMJ Qual Saf. 2012;21:722-8.
6. Carman, K.L., Dardess, P., Maurer, M. et al. Patient and family engagement: a framework for understanding the elements and developing interventions and policies. Health Aff (Millwood). 2013;33:223-31.
7.Ranji, S.R. and Shojania, S.G. Implementing patient safety interventions in your hospital: what to try and what to avoid. Med Clin North Am. 2008;92:275-93.
8. Antony, J. Six Sigma vs Lean: some perspectives from leading academics and practitioners. Int J Product Perform Manage. 2011;60:185-90.
9. Bercaw, R. Taking improvement from the assembly line to healthcare: the application of lean within the healthcare industry. Taylor and Francis, Boca Raton, FL; 2012
10. Langley, G.J., Nolan, K.M., Nolan, T.W. et al. The improvement guide: a practical approach to enhancing organizational performance. Jossey-Bass, San Francisco; 2009
11. Berwick, D.M. A primer on leading the improvement of systems. BMJ. 1996;312:619-22.
12. Corley, D.A., Jensen, C.D., and Marks, A.R. Can we improve adenoma detection rates? A systematic review of intervention studies. Gastrointest Endosc. 2011;74:656-65.
Dr. Weizman is at the Mount Sinai Hospital Centre for Inflammatory Bowel Disease, and Institute of Health Policy, Management and Evaluation, department of medicine; Dr. Mosko is in the division of gastroenterology, St. Michael’s Hospital, department of medicine, and Institute of Health Policy, Management and Evaluation; Dr. Bollegala is in the division of gastroenterology, Women’s College Hospital, department of medicine; Dr. Bernstein is in the division of gastroenterology, Sunnybrook Health Sciences Centre, department of medicine; Dr. Brahmania is at the Toronto Center for Liver Diseases, division of gastroenterology, University Health Network, department of medicine; Dr. Liu is in the division of gastroenterology, University Health Network, department of medicine; Dr. Steinhart is at Mount Sinai Hospital Centre for Inflammatory Bowel Disease, department of medicine, and Institute of Health Policy, Management and Evaluation; Dr. Silver is in the division of nephrology, St. Michael’s Hospital; Dr. Bell is in the division of internal medicine, Mount Sinai Hospital, department of medicine, and Institute of Health Policy, Management and Evaluation; and Dr. Nguyen is at Mount Sinai Hospital Centre for Inflammatory Bowel Disease, department of medicine and Institute of Health Policy, Management and Evaluation; all are at the University of Toronto. Dr. Steinhart is an advisory board member for Abbvie, Janssen, Takeda, Shire, Allergan, Pfizer, Merck, Ferring, and Pharmascience; has received research grants from Abbvie, Amgen, Genentech, Cellgene, Arena Pharmaceuticals, Red Hill Biopharma, Millenium, Roche, and Centocor; and has received speaking honoraria from Abbvie, Janssen, Takeda, Shire, Pfizer, Merck, and Ferring.
The remaining authors declare no conflicts for this article.
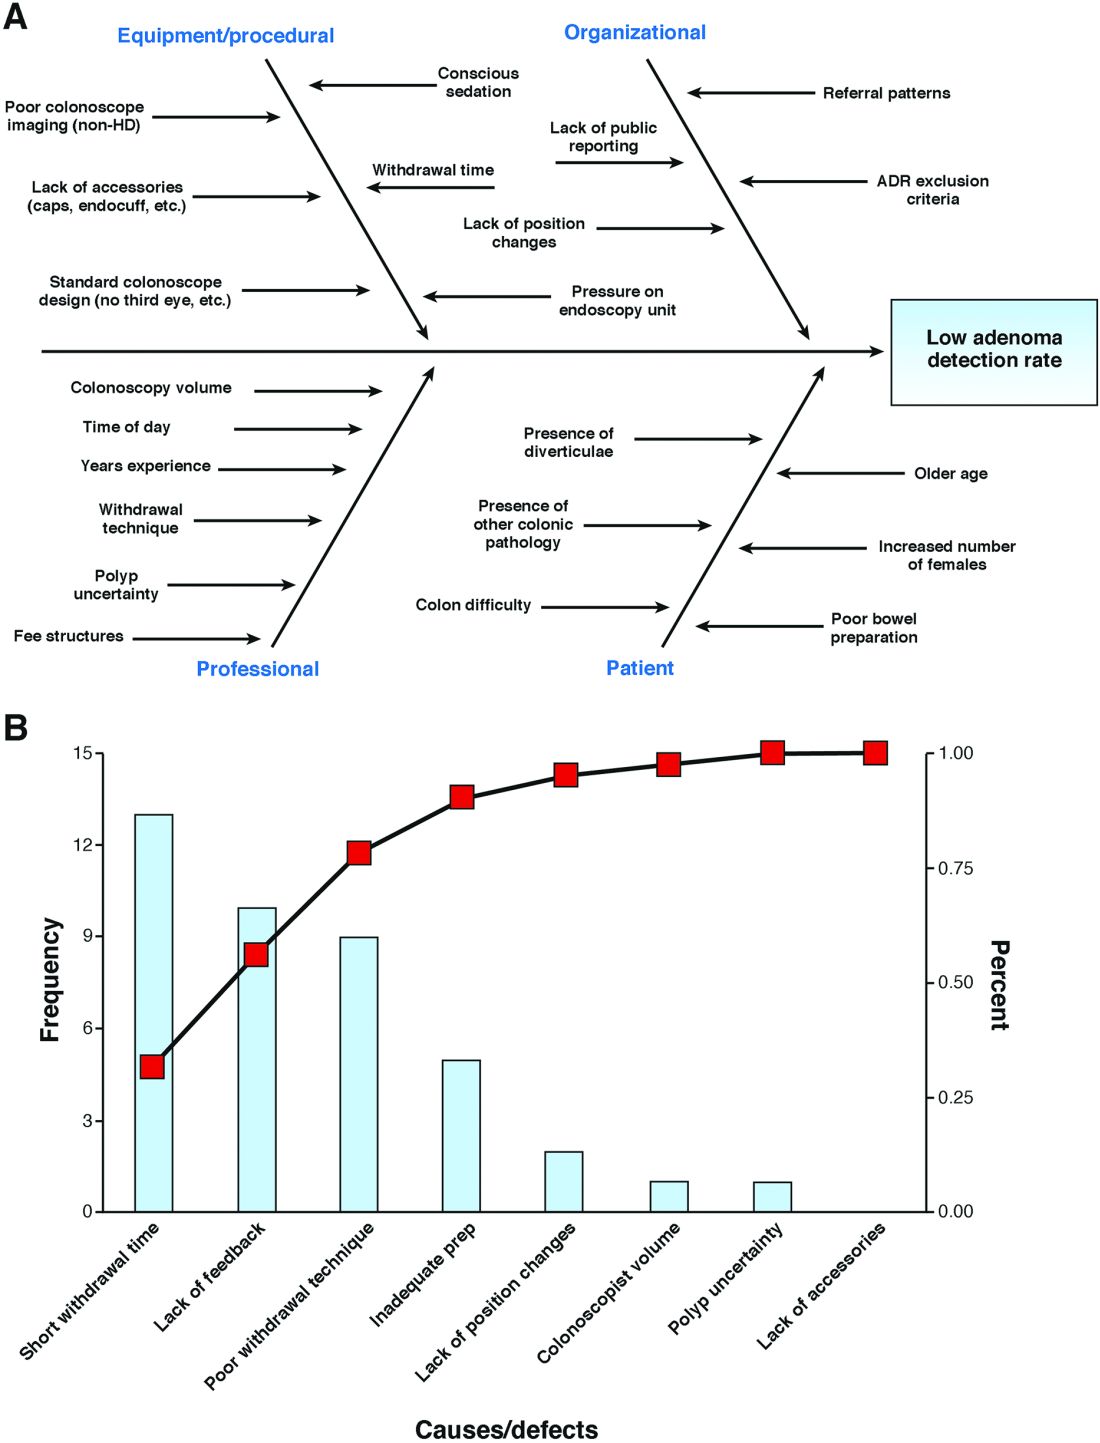
Changing payments, changing practice
The first article during my tenure as editor of the “Practice Management: The Road Ahead” section of Clinical Gastroenterology and Hepatology published in July 2012 (Clin Gastroenterol Hepatol. 2012;10:692-6) outlined anticipated changes in health care delivery, due in large part to mandates or trends contained in the Patient Protection and Affordable Care Act. A second article was published in 2013 (Health care reform 3.0: The road gets bumpy. Clin Gastroenterol Hepatol. 2013;11:1527-8). In this month’s column, Spencer D. Dorn, MD, MPH, MHA, of the University of North Carolina at Chapel Hill, adds a third update with an article focused on alternative payment models. These new reimbursement models are becoming common and will be part of all of our practice strategies in the years to come. No matter what occurs in the 2016 election, the movement from volume- to value-based payment will continue relentlessly, and practices that do not understand how to respond will struggle. We hope these articles will kick-start conversations in your practice.
Fee-for-service (FFS) reimbursement has been criticized for encouraging quantity over quality, favoring procedures over cognitive services, and fragmenting care.1 The landmark Patient Protection and Affordable Care Act (ACA) and more recent Medicare Access and Children’s Health Insurance Program Reauthorization Act (MACRA) modify Medicare’s FFS and encourage alternative payment models (APMs) that better reward value than volume.
Prior articles in this series have identified the specific trends driving gastroenterology practice strategies and business decisions,2 including an increasing need to demonstrate value, an emphasis on improved population health, an increasing number of practices becoming employees of large integrated delivery networks, reduced FFS reimbursements that are more closely linked to performance metrics, and increasing demands for risk-based contracts.3 In this article, I dive more deeply into these last two trends (declining FFS and the rise of APMs) and consider strategies gastroenterology practices can take in response.
Changes in fee for service
The ACA directed the secretary of Health and Human Services to establish a formal process to review potentially misvalued procedure codes. Compared with the pre-ACA fee schedule, the final 2016 Medicare Physician Fee Schedule includes cuts to professional fees for upper endoscopy, endoscopic retrograde cholangiopancreatography, endoscopic ultrasound, and colonoscopy. At the same time, over the past decade, facility fees paid for procedures performed in hospital outpatient departments have increased. Those to ambulatory surgery centers have gradually increased, although they still remain far below pre-2008 levels. Thus, the full economic impact of fee revaluation on an individual gastroenterology practice depends on whether it collects associated facility and ancillary fees.4
In addition, in the 2016 fee schedule, the Centers for Medicare & Medicaid Services described its intention to remove the value of moderate sedation from all gastrointestinal procedures. This is to prevent paying twice for sedation in procedures that involve anesthesiology professionals (i.e., one payment to the endoscopist as part of the overall procedure fee and a separate payment to the anesthesia professional for sedation they provide and bill for separately). The American Medical Association/Specialty Society Relative Value Scale Update Committee, using survey data from the GI specialty societies and other specialties that perform their own moderate sedation, has submitted recommendations for the value of a new set of moderate sedation Current Procedural Terminology codes to the CMS. The agency is expected to provide the specifics on how it will remove moderate sedation from the GI procedure codes in the 2017 Medicare Physician Fee Schedule Proposed Rule. The more that moderate sedation is valued, the less that endoscopic procedures will be valued. Consequently, gastroenterologists who rely on anesthesiology professionals to sedate their patients will generate less revenue per procedure, unless they rearrange contracts with anesthesia providers. Gastroenterologists who perform moderate sedation will not be impacted, because the sum of the value of the new moderate sedation code plus the underlying endoscopic procedure code will equal the original value of the procedure.
Beyond revaluing services, the CMS outlined its rather ambitious goal “to have 85% of all Medicare fee-for-service (FFS) payments tied to quality or value by 2016, and 90% by 2018.”5 Currently this includes the Physician Quality Reporting System (PQRS), which requires gastroenterologists to report performance on either three or more individual PQRS measures or one PQRS measures group (collection of related individual measures) or face a 2% Medicare payment penalty. It also includes the value-based payment modifier, through which by 2017 all practices with better-than-average quality (linked to PQRS measures) and lower costs will receive bonus payments, whereas those with worse-than-average performance (or who choose not to report) will be penalized.
MACRA changes all of this. Starting in 2019, the meaningful use incentive program, PQRS, and value-based payment modifier will be consolidated into the Merit-Based Incentive Payment System (MIPS). Physicians who elect to remain on an FFS tract will receive a 0-100 composite performance score based on quality (30%), resource use (30%), meaningful use (25%), and clinical practice improvement activities (15%). At the start of a performance period, a composite threshold necessary to achieve incentive payments and avoid penalties will be determined. Throughout the performance period, physicians will receive timely feedback on their performance. At year’s end, those below the threshold will face penalties proportionate to their performance (as much as 4% in 2019 and going up to 9% in 2022), those at threshold will not receive a payment adjustment, and those above threshold will receive bonuses proportionate to their performance (although overall payments will be capped at $500 million).
Alternative payment models
The CMS’s ultimate goal is to move beyond FFS and have “30% of Medicare payments tied to quality or value through APMs by the end of 2016 and 50% of payments by the end of 2018.”5 MACRA supports this ambitious goal: Starting in 2019, providers who “sufficiently” participate in APMs will receive 5% across-the-board bonuses. The three main APMs are bundled payments, accountable care organizations (ACOs), and patient-centered medical homes.
A bundled payment is a single fixed price paid to cover services for a specific episode of care. Depending on how an episode is defined, the bundle may encompass all professional fees, facility fees, and medical device and supply costs for a given service, including postacute care and any complications. If costs are reduced beyond the already discounted price of the bundle and quality metrics are achieved, then participants share the savings. Conversely, if costs exceed the bundled payment amount, then participants lose money. Unlike FFS, bundling incentivizes participants to coordinate care, reduce complications and unnecessary services, and cut purchasing costs.
To date, the CMS has launched three bundling programs. The Acute Care Episode Demonstration Project provided hospitals and clinicians a bundled payment to cover orthopedic and cardiovascular procedure–related episodes of care. This program reduced Medicare costs, primarily because the bundle payment was lower than what the sum of individual payments would have been. Providers were able to cope mainly by reducing their surgical implant costs. Second, more than 6,000 providers are currently participating in Medicare’s Bundled Payments for Care Improvement Program. The results of this program have not yet been released. Third, the CMS recently announced the Comprehensive Care for Joint Replacement Program under which hospitals and physicians in 67 metropolitan areas will be required to participate. Mandatory participation signals the CMS’s strong motivation to shift away from FFS. Beyond Medicare, many commercial insurers offer bundled payment programs, primarily for cardiovascular and orthopedic conditions.6 Although these programs are promising, it is technically challenging to define what is in a bundle, and to adequately risk adjust and mitigate random variation in spending for certain episodes of care. Providers are also challenged to find ways to divide payment among participants, coordinate all care, and accept financial risk.7,8 The American Gastroenterological Association recently published a bundled payment framework for screening and surveillance colonoscopy.9 Bundling other gastroenterology services will be more challenging.
Whereas bundled-care programs focus on a discrete service (e.g., knee replacement or colonoscopy), ACOs are integrated groups of providers who jointly assume responsibility for the cost and quality of all care delivered to a defined population. The ACA requires ACOs to have formal legal, leadership, and management structures; care for at least 5,000 Medicare beneficiaries; fulfill certain patient-centeredness criteria; measure and report quality and cost data; and coordinate care. Different payment models incentivize ACOs to reduce costs and improve quality of care. ACOs operating under a one-sided shared savings model receive FFS payments for each service delivered, along with a bonus for reducing costs below a spending target and meeting quality requirements. There are no potential financial penalties. Alternatively, ACOs operating under a two-sided risk-savings model share a greater proportion of cost savings, in exchange for potential financial penalties if the cost of care exceeds target spending.
To date, Medicare-sponsored ACOs have produced mixed results. In 2014 only 92 of the 322 Medicare Shared Savings ACOs were able to reduce spending below a predetermined benchmark by a predetermined amount (2%-3%) while meeting quality scores, thereby earning a bonus ($341 million in total). Similarly, of the original 32 pioneer ACOs, which by definition are more experienced at managing population health and more willing to take on financial risk, 13 dropped out of the program, and in 2014, only 11 generated enough savings to earn a payout ($82 million in total), whereas 5 incurred financial penalties ($9 million in total) for costs exceeding target thresholds.10 In total, after paying out bonuses, the ACO program cost Medicare a net loss of nearly $3 million, far from the $10-$240 million Medicare had previously projected it would save through the ACO program.11 Clearly, ACOs are not a quick fix for all that ails health care. For many ACOs, the major start-up requirements (time, capital investments, and so forth) needed to manage a population may not be worthwhile.12 Nonetheless, the CMS recently launched the Next Generation ACO model through which 21 participating ACOs will assume higher levels of financial risk (possibly capitated payments) in exchange for greater potential rewards. Similarly, beyond Medicare, there are also many Medicaid-sponsored ACOs and hundreds of commercial payer-sponsored ACOs.13
Finally, practices can qualify for APM status without accepting bundled payments or joining an ACO by qualifying as a patient-centered medical home. One option for gastroenterologists and other specialists is the National Committee for Quality Assurance’s patient-centered specialty practice designation, available to practices that successfully demonstrate their ability to track and coordinate care with primary care providers and other specialists, offer timely appointments and responses to telephone and electronic messages, use evidence-based tools to manage care for specific patient populations, develop patient-centered care plans, and measure and improve performance.14
Consolidation
Health insurers are merging to increase scale (and negotiating power), enhance efficiency (reducing administrative costs makes more room for profits), and diversify their businesses. Recently proposed acquisitions will bring “the big five” health insurers to the “big three.” Likewise, health care systems are rapidly acquiring hospitals and physician groups, so much so that today half of all American health care markets are now considered highly concentrated, and none are considered highly competitive.15 Today only 35% of all physicians are independently employed.16 Physicians employed by health systems trade their complete autonomy to offset declining reimbursement, reduce operating expenses (including health information technology costs), improve work-life balance, and mitigate unknown risks.
Proponents contend that these mergers allow health care systems to better coordinate care, improve care experiences, accommodate new payment models, and assemble the building blocks needed to form ACOs and other integrated care models. Critics argue that locally dominant systems drive volume (by tightening referral relationships and gaining new market share) and increase costs (through enhanced negotiating leverage and by reclassifying newly acquired physician practices as part of the hospital, thereby generating facility fees). It is unclear whether consolidation results in better outcomes or simply increases overall costs.17
Strategic imperatives
What should gastroenterologists do? First, recognize that FFS is not going away anytime soon.18 Most APMs are still largely in their experimentation phase, and it remains unclear which models will work and which will be broadly adopted. Still, it is unrealistic to expect FFS to indefinitely persist as the dominant payment model. For some services FFS may no longer be a payment option (e.g., Medicare’s BCPI [Bundled Payments for Care Improvement]). For others, FFS rates may become so unattractive that APMs seem necessary. Finally, APMs may allow some practices to capture a greater proportion of overall clinical revenue (e.g., academic practices that perform endoscopic procedures within hospital outpatient departments) and to develop new models that meaningfully improve care. Today’s gastroenterology practices must therefore operate on two separate tracks: an FFS track that rewards volume (most practices are optimized for this) and an alternative payment track that rewards value (few practices can accommodate these on their own). The degree and speed with which practices should reorient to the alternative payment track depends on the type of practice and the specific local health care market. But even practices operating in slower-to-evolve markets should start preparing for the APMs, no matter how far off in the distance they may seem. I recommend the following six steps:
1. Integrate. To participate in APMs, preserve referral streams, and maintain negotiating leverage with health plans, independent, community-based practices may need to affiliate or merge with other physician groups, or align with or be acquired by a health care system.19 Academic practices are challenged to define their role within health care systems that are rapidly adding primary care practices, and often community gastroenterology practices, too.
2. Collaborate and communicate. To deliver high-value care to populations of patients, gastroenterologists must closely collaborate and clearly communicate with primary care physicians and other specialists. Collaborative care agreements can help guide these relationships.203. Develop new models of care. Patients with more routine GI and liver-related problems may be served more cost effectively by midlevel providers21 or innovative solutions, such as e-consultations.22 Patients with complex, chronic GI and liver diseases may be best served by multidisciplinary care teams (e.g., gastroenterologists alongside midlevel providers, nurses, care managers, psychologists, and/or pharmacists) who use clinical information systems to identify high-risk patients and to encourage evidence-based decision making, and who support patients to self-manage their own conditions.23 Previously infeasible in a purely FFS world, these models are encouraged by APMs.
4. Care for common, costly conditions. Most gastroenterology practices have built robust colorectal cancer screening programs, sometimes at the expense of cognitive-based services. In today’s more accountable world, practices that can effectively manage common, costly conditions, such as inflammatory bowel disease, functional GI disorders, and advanced liver diseases, will be rewarded better than before and will be more highly sought as partners.
5. Understand and contain costs. The timely, accurate data needed to effectively respond to APMs are challenging to come by.19 Individual clinicians and group practices can roughly gauge their costs of care for Medicare beneficiaries, compared with other practices, using CMS Quality Resource Utilization Reports. Local commercial insurers may be willing to share cost profiles with interested practices. Strategies to reduce costs may include shifting clinically appropriate patients to more cost-effective settings (especially important for academic practices that see the bulk of their patients in costly hospital outpatient departments), standardizing endoscopy supplies and devices, using anesthesia services more selectively, and preferentially prescribing generic drugs, among others.
6. Measure and demonstrate value. Despite the inherent limitations of performance measurement,24 it is imperative that practices measure and report the value of care to their patients, community, and payers so that they are preferred partners and not locked out of insurance or referral networks. Improving patient experiences is intrinsically worthwhile25 and also makes good business sense.26
References
1. Miller, H.D. Creating payment systems to accelerate value-driven health care: Issues and options for policy reform. New York: The Commonwealth Fund, 2007.
2. Allen, J.I. The road ahead. Clin Gastroenterol Hepatol. 2012;10:692–6.
3. Allen, J.I. Health care reform 3.0: The road gets bumpy. Clin Gastroenterol Hepatol. 2013;11:1527-8.
4. Dorn, S.D., Vesy C.J. Medicare’s revaluation of gastrointestinal endoscopic procedures: Implications for academic and community-based practices. Clin Gastroenterol Hepatol. 2016 (in press).
5. Burwell, S.M. Setting value-based payment goals: HHS efforts to improve U.S. health care (N Engl J Med. 2015;372:897–9).
6. The Advisory Board Company. Commercial Bundled Payment Tracker, 2016.
7. Mechanic, R.E. Mandatory Medicare bundled payment – is it ready for prime time? N Engl J Med. 2015;373:1291–3.
8. The National Commission on Physician Payment Reform. Physician Payment Report, 2013.
9. Brill, J.V., Jain, R., Margolis, P.S., et al. A bundled payment framework for colonoscopy performed for colorectal cancer screening or surveillance. Gastroenterology. 2014;146:849–53, e9.
10. Evans, M. Few Medicare ACOs earned bonuses in 2014. Mod Healthc (2015). Available at: www.modernhealthcare.com/article/20150825/NEWS/150829922. Accessed Nov. 14, 2015.
11. Rau, J., Gold, J. Medicare yet to save money through heralded medical payment model. Kaiser Health News. Available at: http://khn.org/news/medicare-yet-to-save-money-through-heralded-medical-payment-model. Accessed Nov. 14, 2015.
12. Goldmsith, J., Kaufman, N. Pioneer ACOs: Anatomy of a victory. Health Affairs Blog, 2015.
13. Tu, T., Muhlestein, D., Kocot, S.L., et al. The impact of accountable care: Origins and future of accountable care organizations. Washington, D.C.: Brookings Institution, 2015.
14. NCQA. Patient-centered specialty practice frequently asked questions.
15. Xu, T., Wu, A.W., Makary, M.A. The potential hazards of hospital consolidation: Implications for quality, access, and price. JAMA. 2015;314:1337–8.
16. The Physician’s Foundation. 2014 survey of America’s physicians. Practice patterns & perspectives: The Physician’s Foundation.
17. Tsai, T.C., Jha, A.K. Hospital consolidation, competition, and quality: Is bigger necessarily better? JAMA. 2014;312:29–30.
18. Ginsburg, P.B. Fee-for-service will remain a feature of major payment reforms, requiring more changes in Medicare physician payment. Health Aff (Millwood). 2012;31:1977–83.
19. Friedberg, M.W., Chen, P.G., White, C., et al. Effects of health care payment models on physician practice in the United States. Santa Monica, Calif.: RAND Corp., 2015.
20. Greenberg, J.O., Barnett, M.L., Spinks, M.A., et al. The “medical neighborhood”: Integrating primary and specialty care for ambulatory patients. JAMA Intern Med. 2014;174:454–7.
21. Dorn, S.D. Mid-level providers in gastroenterology. Am J Gastroenterol. 2010;105:246–51.
22. Wasfy, J.H., Rao, S.K., Kalwani, N., et al. Longer term impact of cardiology e-consults. Am Heart J. 2016;173:86–93.
23. Coleman, K., Austin, B.T., Brach, C., et al. Evidence on the chronic care model in the new millennium. Health Aff (Millwood). 2009;28:75–85.
24. Dorn, S.D. Quality measurement in gastroenterology: confessions of a realist. Clin Gastroenterol Hepatol. 2016;14:648–50.
25. Berwick, D.M. Measuring physicians’ quality and performance: adrift on Lake Wobegon. JAMA. 2009;302:2485-6.
26. Browne, K., Roseman, D., Shaller, D., et al. Analysis & commentary. Measuring patient experience as a strategy for improving primary care. Health Aff (Millwood). 2010;29:921–5.
Dr. Dorn is vice chief, division of gastroenterology and hepatology, associate professor of medicine, health policy & management, University of North Carolina at Chapel Hill. He has received honoraria for consulting and presentations on health reform from AbbVie and Olympus.
Practice Management Toolbox: Adapting the patient-centered specialty practice model for populations with cirrhosis
United States health care is moving rapidly from volume- to value-based reimbursement. An essential part of this movement will be the development of alternative payment models where a specific bundle of care (colonoscopy), episode of care (a year of care for attributed Crohn’s patients), or ongoing care of a specialty-centric patient population (patients with cirrhosis) are covered within a contract that links health outcomes, quality of care, and payment together. Gastroenterologists are slowly becoming aware of these concepts. Primary care has its patient-centered medical home and now specialists have a patient-centric specialty practice where patient populations are cared for principally by a specialty practice within a well-defined care delivery structure. Previous columns have illustrated these concepts, and this month, Meier and colleagues provide an excellent definition and example of how practices can participate in this new world order.
John I Allen, M.D., MBA, AGAF, Special Section Editor
The Patient Protection and Affordable Care Act secures access to health insurance coverage for many previously uninsured individuals, while transforming the structure of health care delivery to promote high value care that is coordinated and patient-centered.1 The development of innovative care delivery models is a key feature of this transformation. In turn, patient-centered medical homes (PCMHs) have proliferated in number, with PCMH-related pilot and demonstration projects spanning numerous federal agencies.2
Defining the patient-centered medical home
The concept of the PCMH predates the Patient Protection and Affordable Care Act, with its origins in the American Academy of Pediatrics’ 1967 discussion of the medical home. In 2007, a joint release by the American Academy of Family Physicians, the American Academy of Pediatrics, the American College of Physicians, and the American Osteopathic Association defined the PCMH as “an approach to providing comprehensive primary care for children, youth and adults.” Furthermore, the PCMH would serve as “a health care setting that facilitates partnerships between individual patients, and their personal physicians, and when appropriate, the patient’s family.” Several key principles underscore the PCMH model; the patient has a personal physician, and care is physician-directed at the level of the practice, oriented around the whole person, and coordinated to ensure the highest quality and safety of medical care. The PCMH facilitates enhanced access to care, and the payment structure incentivizes and compensates high-quality care delivery.3
Advent of the patient-centered specialty practice
In 2013 the National Committee for Quality Assurance (NCQA), which operates the Patient Centered Medical Home Recognition program, released a set of standards governing the recognition of the patient-centered specialty practice (PCSP).4 Similar to the PCMH model, the PCSP model places the patient at the center of care delivery. Key functions of the PCSP include placing the patient at the center of care, sharing of information, and coordinating across all practices (specialty and primary) for patients.5 The NCQA outlines six standards for PCSP recognition; these standards focus on planning, management, tracking and coordination of care, performance measurement, performance improvement, referrals, communication to patients, care access, and coordination and management for populations.5
Centering patient care in the specialty practice
With the release of the NCQA PCSP standards, provider groups and regulators should work to identify circumstances under which the PCSP might best operate as an effective model for the populations they serve. For example, in the case of mental illness that is both severe and persistent, the creation of a PCMH may disrupt existing patient-provider relationships, increase fragmentation of medical care, and position poorly equipped providers at the center of a care process that requires greater specialization.6
Drawing from this example, we suggest that select patient populations with advanced chronic liver disease may benefit from the development of patient-centered care models that operate such as a PCSP. This may include patients with compensated cirrhosis and other comorbid illnesses such as diabetes mellitus or depression, populations with active complications of portal hypertension, or patients who await or have received liver transplantation.7,8 We suggest examining the potential value of this model in circumstances where the complexity of patient needs or the sensitivity and vulnerability of the patient circumstance may best be managed by an established, trusted, and specialized provider. In the case of patients with cirrhosis and substance abuse from alcohol, a hybrid specialty model that incorporates addiction medicine, social work, and psychiatry providers in addition to hepatologists and allied health providers may be warranted.7
Designing the patient-centered specialty practice for populations with cirrhosis and liver transplant recipients
Practices and providers should carefully assess the context for PCSP adoption, identifying whether the specialty care model will promote greater efficiency and quality than that realized in the absence of a PCSP model. The PCSP model should align with patient needs, considering factors such as cause of disease, disease stage, comorbidities and complications, and socioeconomic factors. Although the NCQA PCSP standards should guide model development, there are specific needs and complexities of cirrhosis and liver transplant populations that may prove highly relevant in identifying one or more ideal model designs. This may entail development of additional PCSP standards beyond what is recognized by NCQA.
Table 1 outlines key questions providers might address when considering the development of the PCSP in this patient population. We divide these questions into three main categories: 1) understanding the context for PCSP model adoption, 2) identifying opportunities to align the PCSP model with the specific needs of the patient population, and 3) selecting a model design. Incorporating careful consideration of the questions highlighted within each of these categories can help inform practitioners on the merits of various PCSP models.

Understanding the context for patient-centered specialty practice adoption
Drawing from Alakeson et al.,9 we suggest that providers embarking on PCSP model adoption first consider how the quality of care and strength of patient-provider relationships for the target population will improve. The selection of an appropriate patient population is a key determinant in the answer to this question. Focusing specifically on the cirrhosis population, the PCSP may need to be directed toward a disease stage (i.e., decompensated cirrhosis) where the specialist is the most frequent and continuous point of system access. Similarly, the PCSP might yield the greatest gains in quality when access is a function of requiring specialized knowledge in the day-to-day management of care delivery (i.e., compensated liver disease or long-term post liver transplant recipients).
The case for the PCSP may be particularly strong in instances where the primary care provider lacks sufficient knowledge to appropriately manage patient care. For example, treatment of mental and behavioral health conditions that are comorbid with cirrhosis may best be suited to a specialized and established care team that has secured patient trust. Many transplant centers in the United States have explicitly created teams in this regard in the context of regulatory requirements for being a transplant program.10
Identifying opportunities to align the patient-centered specialty practice model with the specific needs of the patient population
Liver transplant and cirrhosis patients exhibit variability in the cause of disease, with genetic, social-behavioral, and other causal mechanisms operating as factors in the expression of disease. Developing a model focused on reduction in the risk of need for transplant might differ from these former two examples in target population and specialist team. A relevant example is with hospital readmissions because multiple studies to date have documented at least a 20% frequency of re-hospitalization within 30 days of index readmission.11,12 Although disease severity indicated by Model for End Stage Liver Disease score explains a significant amount of the variability in risk for readmission, there are other factors including frailty13 and complications from index hospitalization14 that also contribute to 30-day readmission. The use of case management and remote monitoring strategies for patients at risk for hospital readmission is likely to be included in a PCSP focused on reducing inpatient utilization.
Variability in the social and economic context surrounding a patient’s daily life should also factor into model design. In the case of Medicaid coverage, a well-designed model might address discontinuities in specific provider and service access arising from churning in Medicaid eligibility and coverage.
Selecting a model design
Three examples of specialty care medical home designs have been described in the literature including the integrated model concept and two variants of the partnership model design. The integrated model concept provides specialty and primary care in one location, whereas the partnership models include an on-site liaison at the specialty practice, either a nurse practitioner who provides some degree of care and is able to draw from the services from an off-site primary care physician or otherwise an on-site nurse care manager who serves as an information source and advocate.9
We suggest that selection of model design should consider the number of specialty and primary care providers required to construct a comprehensive care team and whether there is reasonable capacity for patients to access comprehensive care in multiple settings. Providing a spectrum of services through separately located but coordinated PCSP and PCMH care models may be practical for some target populations. In other instances, multisite care programs may place an undesirable and impractical burden on patients with complex needs or low health system literacy.
As the field of PCSP model development moves forward, we suggest that providers learn from shared discussions of experience. If appropriate, innovation and shared learning should inform the development of additional standards to ensure that PCSP development for cirrhosis and transplant patients adheres to meaningful quality standards. As is clear from discussion, cirrhosis and liver transplant patients are a diverse group with a range of needs that fall across a spectrum of complexity. The development of well-structured PCSP models may require a high degree of specialization, where model adaptation acknowledges how specific disease-based needs, clinical comorbidities, and external support networks vary across groups.
One suggestion for moving forward is to focus early efforts narrowly on small and highly complex patient groups where the expected value of PCSP is large. This may entail beginning with patient groups whose clinical complexity may otherwise disqualify them from participation in traditional patient-centered care model demonstrations and evaluations. An ideal target population would be patients with decompensated cirrhosis who are ineligible for liver transplantation on the basis of multimorbidity. In addition, specialty providers might consider partnering with state agencies or patient groups in the development, testing, and funding of such programs. These partnerships may help to identify target patient populations with potential to benefit from participation in demonstration projects that innovate through the use of new PCSP model designs.
References
1. Sheen, E., Dorn, S.D., Brill, J.V., et al. Health care reform and the road ahead for gastroenterology. Clin Gastroenterol Hepatol. 2012;10:1062-5.
2. Agency for Healthcare Research and Quality. PCMH activities across federal agencies (Table 1). Available at: http://www.pcmh.ahrq.gov/sites/default/files/attachments/federal-pcmh-activities-table-1.pdf. Accessed May 13, 2015.
3. AAP, AAFP, ACP, and AOA. Joint principles of the patient-centered medical home, March 2007. Available at: http://www.acponline.org/running_practice/delivery_and_payment_models/pcmh/demonstrations/jointprinc_05_17.pdf. Accessed November 24, 2015.
4. Huang, X. Rosenthal, M.B. Transforming specialty practice–the patient-centered medical neighborhood. N Engl J Med. 2014;370:1376-9.
5. National Committee of Quality Assurance. Patient-centered specialty practice recognition: white paper. 2013. Available at: http://www.ncqa.org/Portals/0/Newsroom/2013/PCSP%20Launch/PCSPR%202013%20White%20Paper%203.26.13%20formatted.pdf. Accessed November 24, 2015.
6. National Committee of Quality Assurance. Patient-centered specialty practice frequently asked questions. Available at: http://www.ncqa.org/Programs/Recognition/Practices/PatientCenteredSpecialtyPracticePCSP/PatientCenteredSpecialtyPracticeFAQs.aspx Accessed June 4, 2015.
6. Kanwal, F. Coordinating care in patients with cirrhosis. Clin Gastroenterol Hepatol. 2013;11:859-61.
7. Fortune, B.E., Golus, A., Barsky, C.L., et al. Linking a hepatology clinical service line to quality improvement. Clin Gastroenterol Hepatol. 2015;13:1391-5.
8. Alakeson, V., Frank, R.G., Katz, R.E. Specialty care medical homes for people with severe, persistent mental disorders. Health Affairs. 2010;29:867-73.
9. Talwalkar, J.A. Potential impacts of the Affordable Care Act on the clinical practice of hepatology. Hepatology. 2014;59:1681-7.
9. Volk, M.L., Tocco, R.S., Bazick, J., et al. Hospital readmissions among patients with decompensated cirrhosis. Am J Gastroenterol. 2012;107:247-52.
10. Berman, K., Tandra, S., Forssell, K., et al. Incidence and predictors of 30-day readmission among patients hospitalized for advanced liver disease. Clin Gastroenterol Hepatol. 2011;9:254-9.
11. Tapper, E.B., Finkelstein, D., Mittleman, M.A., et al. Standard assessments of frailty are validated predictors of mortality in hospitalized patients with cirrhosis. Hepatology. 2015;62:584-90.
12. Eappen, S., Lane, B.H., Rosenberg, B., et al. Relationship between occurrence of surgical complications and hospital finances. JAMA. 2013;309:1599-606.
Dr. Meier, Dr. Shah, and Dr. Talwalkar are in the department of health care policy and research, department of health sciences research; Dr. Talwalkar is also in the division of gastroenterology and hepatology and the William von Liebig Center for Transplantation and Regenerative Medicine; Mayo Clinic, Rochester, Minn.
United States health care is moving rapidly from volume- to value-based reimbursement. An essential part of this movement will be the development of alternative payment models where a specific bundle of care (colonoscopy), episode of care (a year of care for attributed Crohn’s patients), or ongoing care of a specialty-centric patient population (patients with cirrhosis) are covered within a contract that links health outcomes, quality of care, and payment together. Gastroenterologists are slowly becoming aware of these concepts. Primary care has its patient-centered medical home and now specialists have a patient-centric specialty practice where patient populations are cared for principally by a specialty practice within a well-defined care delivery structure. Previous columns have illustrated these concepts, and this month, Meier and colleagues provide an excellent definition and example of how practices can participate in this new world order.
John I Allen, M.D., MBA, AGAF, Special Section Editor
The Patient Protection and Affordable Care Act secures access to health insurance coverage for many previously uninsured individuals, while transforming the structure of health care delivery to promote high value care that is coordinated and patient-centered.1 The development of innovative care delivery models is a key feature of this transformation. In turn, patient-centered medical homes (PCMHs) have proliferated in number, with PCMH-related pilot and demonstration projects spanning numerous federal agencies.2
Defining the patient-centered medical home
The concept of the PCMH predates the Patient Protection and Affordable Care Act, with its origins in the American Academy of Pediatrics’ 1967 discussion of the medical home. In 2007, a joint release by the American Academy of Family Physicians, the American Academy of Pediatrics, the American College of Physicians, and the American Osteopathic Association defined the PCMH as “an approach to providing comprehensive primary care for children, youth and adults.” Furthermore, the PCMH would serve as “a health care setting that facilitates partnerships between individual patients, and their personal physicians, and when appropriate, the patient’s family.” Several key principles underscore the PCMH model; the patient has a personal physician, and care is physician-directed at the level of the practice, oriented around the whole person, and coordinated to ensure the highest quality and safety of medical care. The PCMH facilitates enhanced access to care, and the payment structure incentivizes and compensates high-quality care delivery.3
Advent of the patient-centered specialty practice
In 2013 the National Committee for Quality Assurance (NCQA), which operates the Patient Centered Medical Home Recognition program, released a set of standards governing the recognition of the patient-centered specialty practice (PCSP).4 Similar to the PCMH model, the PCSP model places the patient at the center of care delivery. Key functions of the PCSP include placing the patient at the center of care, sharing of information, and coordinating across all practices (specialty and primary) for patients.5 The NCQA outlines six standards for PCSP recognition; these standards focus on planning, management, tracking and coordination of care, performance measurement, performance improvement, referrals, communication to patients, care access, and coordination and management for populations.5
Centering patient care in the specialty practice
With the release of the NCQA PCSP standards, provider groups and regulators should work to identify circumstances under which the PCSP might best operate as an effective model for the populations they serve. For example, in the case of mental illness that is both severe and persistent, the creation of a PCMH may disrupt existing patient-provider relationships, increase fragmentation of medical care, and position poorly equipped providers at the center of a care process that requires greater specialization.6
Drawing from this example, we suggest that select patient populations with advanced chronic liver disease may benefit from the development of patient-centered care models that operate such as a PCSP. This may include patients with compensated cirrhosis and other comorbid illnesses such as diabetes mellitus or depression, populations with active complications of portal hypertension, or patients who await or have received liver transplantation.7,8 We suggest examining the potential value of this model in circumstances where the complexity of patient needs or the sensitivity and vulnerability of the patient circumstance may best be managed by an established, trusted, and specialized provider. In the case of patients with cirrhosis and substance abuse from alcohol, a hybrid specialty model that incorporates addiction medicine, social work, and psychiatry providers in addition to hepatologists and allied health providers may be warranted.7
Designing the patient-centered specialty practice for populations with cirrhosis and liver transplant recipients
Practices and providers should carefully assess the context for PCSP adoption, identifying whether the specialty care model will promote greater efficiency and quality than that realized in the absence of a PCSP model. The PCSP model should align with patient needs, considering factors such as cause of disease, disease stage, comorbidities and complications, and socioeconomic factors. Although the NCQA PCSP standards should guide model development, there are specific needs and complexities of cirrhosis and liver transplant populations that may prove highly relevant in identifying one or more ideal model designs. This may entail development of additional PCSP standards beyond what is recognized by NCQA.
Table 1 outlines key questions providers might address when considering the development of the PCSP in this patient population. We divide these questions into three main categories: 1) understanding the context for PCSP model adoption, 2) identifying opportunities to align the PCSP model with the specific needs of the patient population, and 3) selecting a model design. Incorporating careful consideration of the questions highlighted within each of these categories can help inform practitioners on the merits of various PCSP models.
Understanding the context for patient-centered specialty practice adoption
Drawing from Alakeson et al.,9 we suggest that providers embarking on PCSP model adoption first consider how the quality of care and strength of patient-provider relationships for the target population will improve. The selection of an appropriate patient population is a key determinant in the answer to this question. Focusing specifically on the cirrhosis population, the PCSP may need to be directed toward a disease stage (i.e., decompensated cirrhosis) where the specialist is the most frequent and continuous point of system access. Similarly, the PCSP might yield the greatest gains in quality when access is a function of requiring specialized knowledge in the day-to-day management of care delivery (i.e., compensated liver disease or long-term post liver transplant recipients).
The case for the PCSP may be particularly strong in instances where the primary care provider lacks sufficient knowledge to appropriately manage patient care. For example, treatment of mental and behavioral health conditions that are comorbid with cirrhosis may best be suited to a specialized and established care team that has secured patient trust. Many transplant centers in the United States have explicitly created teams in this regard in the context of regulatory requirements for being a transplant program.10
Identifying opportunities to align the patient-centered specialty practice model with the specific needs of the patient population
Liver transplant and cirrhosis patients exhibit variability in the cause of disease, with genetic, social-behavioral, and other causal mechanisms operating as factors in the expression of disease. Developing a model focused on reduction in the risk of need for transplant might differ from these former two examples in target population and specialist team. A relevant example is with hospital readmissions because multiple studies to date have documented at least a 20% frequency of re-hospitalization within 30 days of index readmission.11,12 Although disease severity indicated by Model for End Stage Liver Disease score explains a significant amount of the variability in risk for readmission, there are other factors including frailty13 and complications from index hospitalization14 that also contribute to 30-day readmission. The use of case management and remote monitoring strategies for patients at risk for hospital readmission is likely to be included in a PCSP focused on reducing inpatient utilization.
Variability in the social and economic context surrounding a patient’s daily life should also factor into model design. In the case of Medicaid coverage, a well-designed model might address discontinuities in specific provider and service access arising from churning in Medicaid eligibility and coverage.
Selecting a model design
Three examples of specialty care medical home designs have been described in the literature including the integrated model concept and two variants of the partnership model design. The integrated model concept provides specialty and primary care in one location, whereas the partnership models include an on-site liaison at the specialty practice, either a nurse practitioner who provides some degree of care and is able to draw from the services from an off-site primary care physician or otherwise an on-site nurse care manager who serves as an information source and advocate.9
We suggest that selection of model design should consider the number of specialty and primary care providers required to construct a comprehensive care team and whether there is reasonable capacity for patients to access comprehensive care in multiple settings. Providing a spectrum of services through separately located but coordinated PCSP and PCMH care models may be practical for some target populations. In other instances, multisite care programs may place an undesirable and impractical burden on patients with complex needs or low health system literacy.
As the field of PCSP model development moves forward, we suggest that providers learn from shared discussions of experience. If appropriate, innovation and shared learning should inform the development of additional standards to ensure that PCSP development for cirrhosis and transplant patients adheres to meaningful quality standards. As is clear from discussion, cirrhosis and liver transplant patients are a diverse group with a range of needs that fall across a spectrum of complexity. The development of well-structured PCSP models may require a high degree of specialization, where model adaptation acknowledges how specific disease-based needs, clinical comorbidities, and external support networks vary across groups.
One suggestion for moving forward is to focus early efforts narrowly on small and highly complex patient groups where the expected value of PCSP is large. This may entail beginning with patient groups whose clinical complexity may otherwise disqualify them from participation in traditional patient-centered care model demonstrations and evaluations. An ideal target population would be patients with decompensated cirrhosis who are ineligible for liver transplantation on the basis of multimorbidity. In addition, specialty providers might consider partnering with state agencies or patient groups in the development, testing, and funding of such programs. These partnerships may help to identify target patient populations with potential to benefit from participation in demonstration projects that innovate through the use of new PCSP model designs.
References
1. Sheen, E., Dorn, S.D., Brill, J.V., et al. Health care reform and the road ahead for gastroenterology. Clin Gastroenterol Hepatol. 2012;10:1062-5.
2. Agency for Healthcare Research and Quality. PCMH activities across federal agencies (Table 1). Available at: http://www.pcmh.ahrq.gov/sites/default/files/attachments/federal-pcmh-activities-table-1.pdf. Accessed May 13, 2015.
3. AAP, AAFP, ACP, and AOA. Joint principles of the patient-centered medical home, March 2007. Available at: http://www.acponline.org/running_practice/delivery_and_payment_models/pcmh/demonstrations/jointprinc_05_17.pdf. Accessed November 24, 2015.
4. Huang, X. Rosenthal, M.B. Transforming specialty practice–the patient-centered medical neighborhood. N Engl J Med. 2014;370:1376-9.
5. National Committee of Quality Assurance. Patient-centered specialty practice recognition: white paper. 2013. Available at: http://www.ncqa.org/Portals/0/Newsroom/2013/PCSP%20Launch/PCSPR%202013%20White%20Paper%203.26.13%20formatted.pdf. Accessed November 24, 2015.
6. National Committee of Quality Assurance. Patient-centered specialty practice frequently asked questions. Available at: http://www.ncqa.org/Programs/Recognition/Practices/PatientCenteredSpecialtyPracticePCSP/PatientCenteredSpecialtyPracticeFAQs.aspx Accessed June 4, 2015.
6. Kanwal, F. Coordinating care in patients with cirrhosis. Clin Gastroenterol Hepatol. 2013;11:859-61.
7. Fortune, B.E., Golus, A., Barsky, C.L., et al. Linking a hepatology clinical service line to quality improvement. Clin Gastroenterol Hepatol. 2015;13:1391-5.
8. Alakeson, V., Frank, R.G., Katz, R.E. Specialty care medical homes for people with severe, persistent mental disorders. Health Affairs. 2010;29:867-73.
9. Talwalkar, J.A. Potential impacts of the Affordable Care Act on the clinical practice of hepatology. Hepatology. 2014;59:1681-7.
9. Volk, M.L., Tocco, R.S., Bazick, J., et al. Hospital readmissions among patients with decompensated cirrhosis. Am J Gastroenterol. 2012;107:247-52.
10. Berman, K., Tandra, S., Forssell, K., et al. Incidence and predictors of 30-day readmission among patients hospitalized for advanced liver disease. Clin Gastroenterol Hepatol. 2011;9:254-9.
11. Tapper, E.B., Finkelstein, D., Mittleman, M.A., et al. Standard assessments of frailty are validated predictors of mortality in hospitalized patients with cirrhosis. Hepatology. 2015;62:584-90.
12. Eappen, S., Lane, B.H., Rosenberg, B., et al. Relationship between occurrence of surgical complications and hospital finances. JAMA. 2013;309:1599-606.
Dr. Meier, Dr. Shah, and Dr. Talwalkar are in the department of health care policy and research, department of health sciences research; Dr. Talwalkar is also in the division of gastroenterology and hepatology and the William von Liebig Center for Transplantation and Regenerative Medicine; Mayo Clinic, Rochester, Minn.
