User login
Clinical Progress Notes: Updates from the 4th Universal Definition of Myocardial Infarction
Elevated serum troponin clearly does not equal myocardial infarction (MI). This was the strong message in the 2018 publication of the Fourth Universal Definition of Myocardial Infarction1 (4UDMI), the first update to the international consensus document since 2012.
Most clinicians have learned how to accurately diagnose the classic Type 1 MI (T1MI) due to atherosclerotic plaque rupture; however, elevated troponin in the absence of T1MI is increasingly common due to more frequent and less discriminate troponin testing.2 Patients with elevated troponin in the absence of T1MI have traditionally created confusion and variability in diagnosis, management, and documentation. Interpretation and management of elevated troponin in the absence of T1MI has become difficult.
In this clinical practice update, we aim to review the updated definition of Type 2 MI (T2MI) and nonischemic myocardial injury (NIMI), since these are the two predominant diagnoses among patients with elevated troponin in the absence of T1MI. We also provide a clinical framework for clinicians to think through elevated serum cardiac troponin levels and identify opportunities for quality improvement around this critical issue.
DEFINITIONS OF MYOCARDIAL INJURY
The presence of an elevated serum troponin level is a critical component in determining the presence of cardiac myocyte injury and possible infarction. Myocardial injury is defined as the presence of serum troponin above the 99th percentile of the upper reference limit (URL), the absolute value of which varies by assay and which applies to traditional and highly sensitive subtypes. Myocardial injury can be confusing to assess, as it can be acute or chronic.
When troponin levels are elevated but stable, this is indicative of chronic (usually nonischemic) myocardial injury, as seen, for example, in patients who have end-stage renal disease. The presence of acute injury requires a change in the troponin value—specifically a rise and/or fall in troponin levels with serial measurements. What constitutes a significant “rise and/or fall” is a matter of some debate and is not precisely defined in the 4UDMI. The percent change in the troponin value over time (relative delta) is listed as part of the criteria for acute injury when the change is greater than or equal to 20%;1 however, clinicians should be aware that absolute delta in troponin (the change in ng/dL) has better performance characteristics3 in diagnosing acute myocardial injury. Regardless of whether clinicians use relative or absolute changes in the serum troponin level, clinical evaluation of patients with acute injury is critical to establishing whether the injury is ischemic (MI) or nonischemic (NIMI). The presence of at least one of the following is necessary to meet the current criteria for myocardial ischemia according to the fourth universal definition: new ischemic symptoms (eg, chest pain, dyspnea, etc.), new ischemic changes in the patient’s electrocardiogram (eg, new ST segment depression in leads II, III, and aVF), or cardiac imaging changes consistent with ischemic injury (eg, new wall motion abnormality in the inferior wall on echocardiography).
Following diagnosis of MI based on elevated troponin and new symptoms or signs, the cause of MI should then be determined. Type 1 MI remains defined as MI caused by atherosclerotic plaque disruption in a patient with coronary artery disease (CAD). Type 2 MI is not caused by plaque disruption but is due to a mismatch between oxygen supply and demand unrelated to acute atherothrombosis. T2MI is an ischemic myocardial injury traceable to some other illness that leads to inadequate myocyte oxygenation. Causes of T2MI are numerous, can overlap with nonischemic injury, and can include severe anemia, septic shock, rapid atrial fibrillation, and coronary dissection. While CAD may be present in patients with T2MI, it is not a requirement, and an increased demand for, or reduced supply of, myocyte oxygen alone can be sufficient to cause MI.
In the absence of clinical signs or symptoms of cardiac ischemia, clinicians should categorize patients as having a nonischemic myocardial injury. There is significant overlap between causes of T2MI and NIMI, for example, sepsis could cause either T2MI or NIMI. What distinguishes these two entities is whether the signs and symptoms for myocardial ischemia as outlined above are present. If these signs or symptoms are present, the diagnosis is T2MI. If no clinical signs or symptoms of ischemia are present, the diagnosis is NIMI. The assessment of the clinician, using all available clinical information, is pivotal. The characteristics of the three major types of myocardial injury are depicted in the Figure.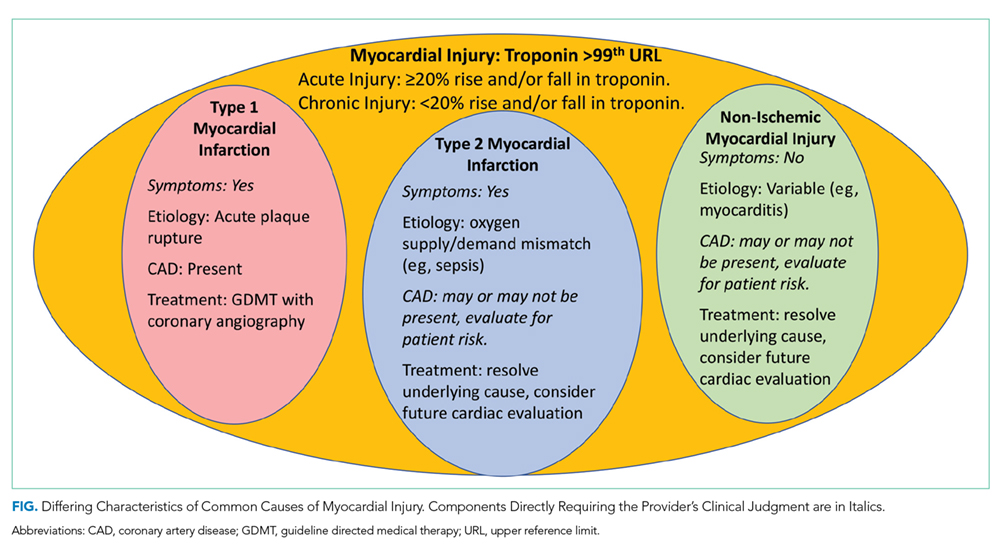
CLINICAL PRACTICE UPDATE
Proper distinction between infarction or injury without infarction is central to proper evaluation, treatment, and eventual documentation in patients with elevated troponin levels. In the case of T2MI and NIMI, identifying what underlying illness is causing the troponin elevation is essential for acute management.
Evaluation
Troponin elevation is associated with an elevated risk for major adverse cardiovascular events, regardless of etiology.4 While patients with suspected T1MI are most often evaluated by coronary angiography, this may not be necessary for patients with T2MI or NIMI. Developing an evaluation strategy for patients with T2MI or NIMI requires understanding the underlying etiology of myocardial injury. In patients with septic shock for example, there are many potential mechanisms for cardiac myocyte injury, many of which are nonischemic (eg, cytokine-mediated).5 Prompt evaluation and treatment of septic shock, therefore, often leads to resolution of cardiac dysfunction, and ischemic evaluation may not be necessary.6 In many cases of T2MI or NIMI, waiting for an acute underlying illness to resolve is necessary before deciding whether ischemic evaluation is appropriate. It is important that this decision is deferred but not forgotten though as patients with T2MI or NIMI may benefit from further cardiac evaluation. There are no society recommendations and minimal evidence to guide this evaluation, but clinical trials testing different evaluation strategies are underway.7 Until an optimal evidence-based evaluation strategy becomes clear, clinicians should focus on two key principles: first, determine and treat the underlying etiology; second, identify patients with traditional risk factors for CAD and consider further evaluation with either coronary angiography or cardiac imaging. Referral to a cardiologist for assistance with the latter issue, especially for challenging or equivocal cases, is encouraged.
Treatment
While T1MI therapies have a strong evidence base with high rates of appropriate treatment, there are relatively few evidence-based therapies for T2MI and NIMI. The benefits of traditional T1MI therapies should be considered in terms of each therapy’s risk-benefit profile. Among patients with T2MI or NIMI in whom atherosclerotic plaque rupture is unlikely, or in whom bleeding risk is high, antithrombotic agents such as unfractionated heparin and dual antiplatelet therapy represent low value and potentially harmful therapies.8 Conversely, patients with multiple risk factors for CAD may benefit from low-risk guideline directed medical therapies such as HMGCoA reductase inhibitors (ie, “statins”). Recent data suggest that lipid-lowering therapies may even be beneficial for preventing T2MI.9
Given the lack of evidence for therapies to treat patients with T2MI or NIMI, clinical judgment remains central to creating an optimal management plan. Clinicians should consider consultation with a cardiologist any time there is ambiguity in whether the diagnosis is T1MI or T2MI. For example, postoperative patients represent a particularly challenging clinical scenario due to the difficulty of assessing ischemic signs and symptoms in the operating room. In this setting, early evaluation by a cardiologist has been shown to improve outcomes.10
Documentation
Documentation of non-ST elevation MI (NSTEMI) for every case of elevated troponin, rather than using the more specific T1MI, T2MI, or NIMI terminology, can have adverse consequences for health systems. From a coding perspective, the terms STEMI and NSTEMI mean T1MI, and the ICD-10 codes used to identify T1MI patients for value-focused programs frequently include patients with T2MI and NIMI due to imprecise documentation.11 When T2MI and NIMI are imprecisely documented as NSTEMI, health systems and clinicians are held to the T1MI care standards. This can negatively skew the performance of a health system or individual clinician because T2MI and NIMI patients have worse outcomes than T1MI patients.4 Inaccurate categorization of patients can lead to inaccurate quality and registry reporting, which may hinder the ability of health systems to monitor and implement quality improvement programs for MI patients. The distinction between T1MI and T2MI in documentation is all the more important now that a new ICD-10 code exists for T2MI (I21.A1), which allows clinicians to more precisely identify these patients, both clinically and administratively, as distinct from T1MI patients.12 While there is no similarly specific ICD-10 code for NIMI, using the appropriate terminology in documentation should prompt coding personnel to use a code for “other abnormal findings of blood chemistry,” reflecting cardiac biomarker elevation (R79.89), rather than using one of the T1MI codes. Clinicians may not be able to determine the etiology of troponin elevation in the initial phase of a hospitalization, but a definitive diagnosis should be documented in the discharge summary.
From the patient perspective, documentation using STEMI and NSTEMI can mislead clinicians, given that this terminology does not specify the underlying cause (ie, plaque rupture or oxygen supply-demand mismatch), potentially leading to delayed initiation of appropriate therapy. Incorrect documentation, using STEMI/NSTEMI language or incorrectly labeling T2MI and NIMI, may lead patients to believe they have had a heart attack when they had myocardial injury instead. This may lead to unnecessary anxiety and change their interactions with the health system. These patients may be started on unnecessary therapies, have inaccurate preoperative evaluations, and be labeled with a preexisting condition for the rest of their lives.
Opportunities for Quality Improvement
Systems-based quality improvement can help to ensure that patients with NIMI and T2MI are labeled appropriately and receive the proper treatment.
CONCLUSIONS
Understanding the definitions of T1MI, T2MI, and NIMI will help clinicians to better identify the appropriate clinical care and consultation strategy for patients with elevated cardiac troponin. There are relatively few published quality improvement initiatives to help guide clinicians through these nuanced distinctions, but there is great potential in such approaches to help clinicians provide the highest value care possible.
Disclosures
No authors have any conflict of interest, financial or otherwise, to declare regarding this study.
Funding
Dr. Levy receives funding from National Institutes of Health (NIH) T32 Training Grant 5T32-HL007822.
1. Thygesen K, Alpert JS, Jaffe AS, et al. Fourth universal definition of myocardial infarction (2018). J Am Coll Cardiol. 2018;72(18):2231-2264. https://doi.org/10.1016/j.jacc.2018.08.1038.
2. Shah ASV, Sandoval Y, Noaman A, et al. Patient selection for high sensitivity cardiac troponin testing and diagnosis of myocardial infarction: prospective cohort study. BMJ. 2017;359:j4788. https://doi.org/10.1136/bmj.j4788.
3. Storrow AB, Nowak RM, Diercks DB, et al. Absolute and relative changes (delta) in troponin I for early diagnosis of myocardial infarction: results of a prospective multicenter trial. Clin Biochem. 2015;48(4-5):260-267. https://doi.org/10.1016/j.clinbiochem.2014.09.012.
4. Sandoval Y, Jaffe AS. Type 2 myocardial infarction. J Am Coll Cardiol. 2019;73(14):1846-1860. https://doi.org/10.1016/j.jacc.2019.02.018.
5. Martin L, Derwall M, Al Zoubi S, et al. The septic heart: current understanding of molecular mechanisms and clinical implications. Chest. 2019;155(2):427-437. https://doi.org/10.1016/j.chest.2018.08.1037.
6. Vallabhajosyula S, Jentzer JC, Geske JB, et al. New-onset heart failure and mortality in hospital survivors of sepsis-related left ventricular dysfunction. Shock. 2018;49(2):144-149. https://doi.org/10.1097/SHK.0000000000000952.
7. Lambrakis K, French JK, Scott IA, et al. The appropriateness of coronary investigation in myocardial injury and type 2 myocardial infarction (ACT-2): a randomized trial design. Am Heart J. 2019;208:11-20. https://doi.org/10.1016/j.ahj.2018.09.016.
8. Morrow A, Ahmad F, Steele C, McEntegart M, Murdoch D. Treating the troponin: adverse consequences of over-treatment of elevated troponin in non-coronary presentations. Scot Med J. 2019;64(1):10-15. https://doi.org/10.1177/0036933018809754.
9. White HD, Steg P, Szarek M, et al. Reduction of type 1 and type 2 myocardial infarctions in patients treated with alirocumab: insights from the ODYSSEY Trial. J Am Coll Cardiol. 2019;73(9):4. https://doi.org/10.1016/S0735-1097(19)30613-8.
10. Hua A, Pattenden H, Leung M, et al. Early cardiology assessment and intervention reduces mortality following myocardial injury after non-cardiac surgery (MINS). J Thorac Dis. 2016;8(5):920-924. https://doi.org/10.21037/jtd.2016.03.55.
11. Díaz-Garzón J, Sandoval Y, Smith S, et al. Discordance between ICD-coded myocardial infarction and diagnosis according to the universal definition of myocardial infarction. Clin Chem. 2017;63(1):415-419. https://doi.org/10.1373/clinchem.2016.263764.
12. Goyal A, Gluckman TJ, Tcheng JE. What’s in a name? The new ICD-10 (10th revision of the International Statistical Classification of Diseases and Related Health Problems) codes and type 2 myocardial infarction. Circulation. 2017;136(13):1180-1182. https://doi.org/10.1161/CIRCULATIONAHA.117.030347.
13. Goyal A GT, Levy AE, Mariani D, et al. Translating the fourth universal definition of myocardial infarction into clinical documentation. Cardiology. 2018:34-36.
Elevated serum troponin clearly does not equal myocardial infarction (MI). This was the strong message in the 2018 publication of the Fourth Universal Definition of Myocardial Infarction1 (4UDMI), the first update to the international consensus document since 2012.
Most clinicians have learned how to accurately diagnose the classic Type 1 MI (T1MI) due to atherosclerotic plaque rupture; however, elevated troponin in the absence of T1MI is increasingly common due to more frequent and less discriminate troponin testing.2 Patients with elevated troponin in the absence of T1MI have traditionally created confusion and variability in diagnosis, management, and documentation. Interpretation and management of elevated troponin in the absence of T1MI has become difficult.
In this clinical practice update, we aim to review the updated definition of Type 2 MI (T2MI) and nonischemic myocardial injury (NIMI), since these are the two predominant diagnoses among patients with elevated troponin in the absence of T1MI. We also provide a clinical framework for clinicians to think through elevated serum cardiac troponin levels and identify opportunities for quality improvement around this critical issue.
DEFINITIONS OF MYOCARDIAL INJURY
The presence of an elevated serum troponin level is a critical component in determining the presence of cardiac myocyte injury and possible infarction. Myocardial injury is defined as the presence of serum troponin above the 99th percentile of the upper reference limit (URL), the absolute value of which varies by assay and which applies to traditional and highly sensitive subtypes. Myocardial injury can be confusing to assess, as it can be acute or chronic.
When troponin levels are elevated but stable, this is indicative of chronic (usually nonischemic) myocardial injury, as seen, for example, in patients who have end-stage renal disease. The presence of acute injury requires a change in the troponin value—specifically a rise and/or fall in troponin levels with serial measurements. What constitutes a significant “rise and/or fall” is a matter of some debate and is not precisely defined in the 4UDMI. The percent change in the troponin value over time (relative delta) is listed as part of the criteria for acute injury when the change is greater than or equal to 20%;1 however, clinicians should be aware that absolute delta in troponin (the change in ng/dL) has better performance characteristics3 in diagnosing acute myocardial injury. Regardless of whether clinicians use relative or absolute changes in the serum troponin level, clinical evaluation of patients with acute injury is critical to establishing whether the injury is ischemic (MI) or nonischemic (NIMI). The presence of at least one of the following is necessary to meet the current criteria for myocardial ischemia according to the fourth universal definition: new ischemic symptoms (eg, chest pain, dyspnea, etc.), new ischemic changes in the patient’s electrocardiogram (eg, new ST segment depression in leads II, III, and aVF), or cardiac imaging changes consistent with ischemic injury (eg, new wall motion abnormality in the inferior wall on echocardiography).
Following diagnosis of MI based on elevated troponin and new symptoms or signs, the cause of MI should then be determined. Type 1 MI remains defined as MI caused by atherosclerotic plaque disruption in a patient with coronary artery disease (CAD). Type 2 MI is not caused by plaque disruption but is due to a mismatch between oxygen supply and demand unrelated to acute atherothrombosis. T2MI is an ischemic myocardial injury traceable to some other illness that leads to inadequate myocyte oxygenation. Causes of T2MI are numerous, can overlap with nonischemic injury, and can include severe anemia, septic shock, rapid atrial fibrillation, and coronary dissection. While CAD may be present in patients with T2MI, it is not a requirement, and an increased demand for, or reduced supply of, myocyte oxygen alone can be sufficient to cause MI.
In the absence of clinical signs or symptoms of cardiac ischemia, clinicians should categorize patients as having a nonischemic myocardial injury. There is significant overlap between causes of T2MI and NIMI, for example, sepsis could cause either T2MI or NIMI. What distinguishes these two entities is whether the signs and symptoms for myocardial ischemia as outlined above are present. If these signs or symptoms are present, the diagnosis is T2MI. If no clinical signs or symptoms of ischemia are present, the diagnosis is NIMI. The assessment of the clinician, using all available clinical information, is pivotal. The characteristics of the three major types of myocardial injury are depicted in the Figure.
CLINICAL PRACTICE UPDATE
Proper distinction between infarction or injury without infarction is central to proper evaluation, treatment, and eventual documentation in patients with elevated troponin levels. In the case of T2MI and NIMI, identifying what underlying illness is causing the troponin elevation is essential for acute management.
Evaluation
Troponin elevation is associated with an elevated risk for major adverse cardiovascular events, regardless of etiology.4 While patients with suspected T1MI are most often evaluated by coronary angiography, this may not be necessary for patients with T2MI or NIMI. Developing an evaluation strategy for patients with T2MI or NIMI requires understanding the underlying etiology of myocardial injury. In patients with septic shock for example, there are many potential mechanisms for cardiac myocyte injury, many of which are nonischemic (eg, cytokine-mediated).5 Prompt evaluation and treatment of septic shock, therefore, often leads to resolution of cardiac dysfunction, and ischemic evaluation may not be necessary.6 In many cases of T2MI or NIMI, waiting for an acute underlying illness to resolve is necessary before deciding whether ischemic evaluation is appropriate. It is important that this decision is deferred but not forgotten though as patients with T2MI or NIMI may benefit from further cardiac evaluation. There are no society recommendations and minimal evidence to guide this evaluation, but clinical trials testing different evaluation strategies are underway.7 Until an optimal evidence-based evaluation strategy becomes clear, clinicians should focus on two key principles: first, determine and treat the underlying etiology; second, identify patients with traditional risk factors for CAD and consider further evaluation with either coronary angiography or cardiac imaging. Referral to a cardiologist for assistance with the latter issue, especially for challenging or equivocal cases, is encouraged.
Treatment
While T1MI therapies have a strong evidence base with high rates of appropriate treatment, there are relatively few evidence-based therapies for T2MI and NIMI. The benefits of traditional T1MI therapies should be considered in terms of each therapy’s risk-benefit profile. Among patients with T2MI or NIMI in whom atherosclerotic plaque rupture is unlikely, or in whom bleeding risk is high, antithrombotic agents such as unfractionated heparin and dual antiplatelet therapy represent low value and potentially harmful therapies.8 Conversely, patients with multiple risk factors for CAD may benefit from low-risk guideline directed medical therapies such as HMGCoA reductase inhibitors (ie, “statins”). Recent data suggest that lipid-lowering therapies may even be beneficial for preventing T2MI.9
Given the lack of evidence for therapies to treat patients with T2MI or NIMI, clinical judgment remains central to creating an optimal management plan. Clinicians should consider consultation with a cardiologist any time there is ambiguity in whether the diagnosis is T1MI or T2MI. For example, postoperative patients represent a particularly challenging clinical scenario due to the difficulty of assessing ischemic signs and symptoms in the operating room. In this setting, early evaluation by a cardiologist has been shown to improve outcomes.10
Documentation
Documentation of non-ST elevation MI (NSTEMI) for every case of elevated troponin, rather than using the more specific T1MI, T2MI, or NIMI terminology, can have adverse consequences for health systems. From a coding perspective, the terms STEMI and NSTEMI mean T1MI, and the ICD-10 codes used to identify T1MI patients for value-focused programs frequently include patients with T2MI and NIMI due to imprecise documentation.11 When T2MI and NIMI are imprecisely documented as NSTEMI, health systems and clinicians are held to the T1MI care standards. This can negatively skew the performance of a health system or individual clinician because T2MI and NIMI patients have worse outcomes than T1MI patients.4 Inaccurate categorization of patients can lead to inaccurate quality and registry reporting, which may hinder the ability of health systems to monitor and implement quality improvement programs for MI patients. The distinction between T1MI and T2MI in documentation is all the more important now that a new ICD-10 code exists for T2MI (I21.A1), which allows clinicians to more precisely identify these patients, both clinically and administratively, as distinct from T1MI patients.12 While there is no similarly specific ICD-10 code for NIMI, using the appropriate terminology in documentation should prompt coding personnel to use a code for “other abnormal findings of blood chemistry,” reflecting cardiac biomarker elevation (R79.89), rather than using one of the T1MI codes. Clinicians may not be able to determine the etiology of troponin elevation in the initial phase of a hospitalization, but a definitive diagnosis should be documented in the discharge summary.
From the patient perspective, documentation using STEMI and NSTEMI can mislead clinicians, given that this terminology does not specify the underlying cause (ie, plaque rupture or oxygen supply-demand mismatch), potentially leading to delayed initiation of appropriate therapy. Incorrect documentation, using STEMI/NSTEMI language or incorrectly labeling T2MI and NIMI, may lead patients to believe they have had a heart attack when they had myocardial injury instead. This may lead to unnecessary anxiety and change their interactions with the health system. These patients may be started on unnecessary therapies, have inaccurate preoperative evaluations, and be labeled with a preexisting condition for the rest of their lives.
Opportunities for Quality Improvement
Systems-based quality improvement can help to ensure that patients with NIMI and T2MI are labeled appropriately and receive the proper treatment.
CONCLUSIONS
Understanding the definitions of T1MI, T2MI, and NIMI will help clinicians to better identify the appropriate clinical care and consultation strategy for patients with elevated cardiac troponin. There are relatively few published quality improvement initiatives to help guide clinicians through these nuanced distinctions, but there is great potential in such approaches to help clinicians provide the highest value care possible.
Disclosures
No authors have any conflict of interest, financial or otherwise, to declare regarding this study.
Funding
Dr. Levy receives funding from National Institutes of Health (NIH) T32 Training Grant 5T32-HL007822.
1. Thygesen K, Alpert JS, Jaffe AS, et al. Fourth universal definition of myocardial infarction (2018). J Am Coll Cardiol. 2018;72(18):2231-2264. https://doi.org/10.1016/j.jacc.2018.08.1038.
2. Shah ASV, Sandoval Y, Noaman A, et al. Patient selection for high sensitivity cardiac troponin testing and diagnosis of myocardial infarction: prospective cohort study. BMJ. 2017;359:j4788. https://doi.org/10.1136/bmj.j4788.
3. Storrow AB, Nowak RM, Diercks DB, et al. Absolute and relative changes (delta) in troponin I for early diagnosis of myocardial infarction: results of a prospective multicenter trial. Clin Biochem. 2015;48(4-5):260-267. https://doi.org/10.1016/j.clinbiochem.2014.09.012.
4. Sandoval Y, Jaffe AS. Type 2 myocardial infarction. J Am Coll Cardiol. 2019;73(14):1846-1860. https://doi.org/10.1016/j.jacc.2019.02.018.
5. Martin L, Derwall M, Al Zoubi S, et al. The septic heart: current understanding of molecular mechanisms and clinical implications. Chest. 2019;155(2):427-437. https://doi.org/10.1016/j.chest.2018.08.1037.
6. Vallabhajosyula S, Jentzer JC, Geske JB, et al. New-onset heart failure and mortality in hospital survivors of sepsis-related left ventricular dysfunction. Shock. 2018;49(2):144-149. https://doi.org/10.1097/SHK.0000000000000952.
7. Lambrakis K, French JK, Scott IA, et al. The appropriateness of coronary investigation in myocardial injury and type 2 myocardial infarction (ACT-2): a randomized trial design. Am Heart J. 2019;208:11-20. https://doi.org/10.1016/j.ahj.2018.09.016.
8. Morrow A, Ahmad F, Steele C, McEntegart M, Murdoch D. Treating the troponin: adverse consequences of over-treatment of elevated troponin in non-coronary presentations. Scot Med J. 2019;64(1):10-15. https://doi.org/10.1177/0036933018809754.
9. White HD, Steg P, Szarek M, et al. Reduction of type 1 and type 2 myocardial infarctions in patients treated with alirocumab: insights from the ODYSSEY Trial. J Am Coll Cardiol. 2019;73(9):4. https://doi.org/10.1016/S0735-1097(19)30613-8.
10. Hua A, Pattenden H, Leung M, et al. Early cardiology assessment and intervention reduces mortality following myocardial injury after non-cardiac surgery (MINS). J Thorac Dis. 2016;8(5):920-924. https://doi.org/10.21037/jtd.2016.03.55.
11. Díaz-Garzón J, Sandoval Y, Smith S, et al. Discordance between ICD-coded myocardial infarction and diagnosis according to the universal definition of myocardial infarction. Clin Chem. 2017;63(1):415-419. https://doi.org/10.1373/clinchem.2016.263764.
12. Goyal A, Gluckman TJ, Tcheng JE. What’s in a name? The new ICD-10 (10th revision of the International Statistical Classification of Diseases and Related Health Problems) codes and type 2 myocardial infarction. Circulation. 2017;136(13):1180-1182. https://doi.org/10.1161/CIRCULATIONAHA.117.030347.
13. Goyal A GT, Levy AE, Mariani D, et al. Translating the fourth universal definition of myocardial infarction into clinical documentation. Cardiology. 2018:34-36.
© 2019 Society of Hospital
Clinical Progress Note: Procalcitonin in the Diagnosis and Management of Community-Acquired Pneumonia in Hospitalized Adults
Community-acquired pneumonia (CAP) accounts for more than 1.5 million adult hospitalizations and 100,000 deaths each year in the United States.1 Antibiotic overuse in the hospital setting is an important contributor to the rise of antibiotic resistance, prompting increased efforts to limit inappropriate antibiotic use in hospitals.2 Procalcitonin, a precursor of the hormone calcitonin, is upregulated in bacterial infections and downregulated in viral infections. The US Food and Drug Administration has approved it as a serum biomarker to assist clinicians with decisions about using antibiotics.3
There is no consensus on how to best use procalcitonin in the management of CAP. We provide a practical update that includes a review of recent literature, added secondary analysis, and expert opinion surrounding the use of procalcitonin in the diagnosis and management of CAP in hospitalized adults.
INITIATION OF ANTIBIOTICS
Initial procalcitonin levels do not sufficiently exclude bacterial etiologies of CAP to withhold antibiotic prescription safely. The largest diagnostic accuracy study of procalcitonin in the diagnosis of CAP was a subanalysis of the Etiology of Pneumonia in the Community Study.4 A total of 1,735 adults hospitalized with CAP received procalcitonin testing along with systematic pathogen testing. The area under the receiver operating characteristic curve for procalcitonin in discriminating bacterial pathogens from viral pathogens was 0.73 (95% CI, 0.69-0.77). A procalcitonin cut-off of 0.1 ng/mL resulted in 80.9% (95% CI, 75.3%-85.7%) sensitivity and 51.6% (95% CI, 46.6%-56.5%) specificity for identification of any bacterial pathogen.
In a secondary analysis of this study, we calculated multilevel likelihood ratios (LRs) for ranges of procalcitonin values to determine the diagnostic accuracy of procalcitonin in distinguishing bacterial from viral etiologies of CAP (Table). Multilevel LRs offer more useful diagnostic information than dichotomizing at specified cut-points.5 A procalcitonin result less than 0.1 ng/mL has a negative LR of 0.4 (95% CI, 0.3-0.5), which is not low enough to rule out bacterial CAP effectively when starting with intermediate or high pretest probability. For a low result (<0.1 ng/mL) to be useful in ruling out bacterial CAP, for example having less than a 10% posttest probability of bacterial CAP, the pretest probability would have to be no greater than 22%. Even then, a 10% posttest probability of bacterial CAP may still be too high for clinicians to withhold initial antibiotics. For procalcitonin values between 0.1 ng/mL and 1.0 ng/mL, the probability of bacterial CAP does not change significantly, with an LR of 1.0 (95% CI, 0.8-1.3). Procalcitonin values up to 5 ng/mL reach a modest positive LR of 2.3 (95% CI, 0.8-4.3). Very high values, such as those >10 ng/mL, yield a positive LR of 5.5 (95% CI, 3.2-9.7), are potentially useful in decisions to initiate antibiotics in situations of very low pretest probability of bacterial CAP. For example, a 9% pretest probability of bacterial CAP is likely below many physicians’ threshold for starting antibiotics. A procalcitonin of 12 ng/mL in this patient would increase the posttest probability to 35%, a value that would prompt many physicians to initiate antibiotics.
Overall, there is insufficient evidence to support the use of procalcitonin as a stand-alone test for ruling out bacterial CAP, limiting its use in withholding antibiotics in patients with suspected bacterial CAP.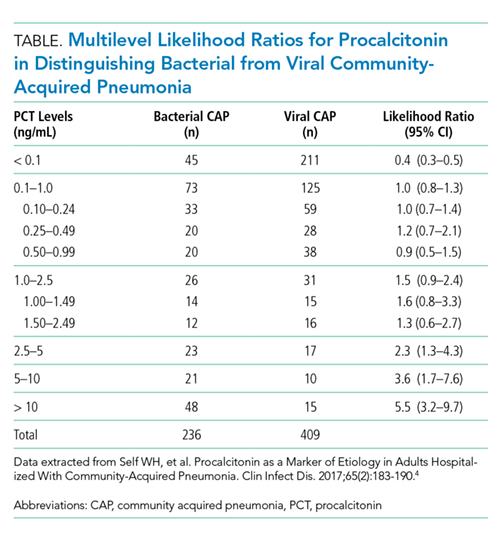
DISCONTINUATION OF ANTIBIOTICS
While initial procalcitonin measurements may not affect the initial antibiotic treatment decision, procalcitonin levels thereafter can guide the duration of therapy. A meta-analysis of procalcitonin-guided treatment in patients with upper or lower respiratory tract infection (LRTI) showed that procalcitonin guidance reduces antibiotic exposure and antibiotic-related adverse effects and improves survival, albeit a small absolute mortality difference of 1.4 percentage points, primarily observed in the intensive care unit setting.6 Most patients included in this meta-analysis were diagnosed with LRTI (91%), and CAP was the predominant subtype of LRTI (43%). The main effect of procalcitonin guidance for patients with CAP was earlier discontinuation of antibiotic treatment. Procalcitonin-guided algorithms in these trials discouraged, or strongly discouraged, antibiotics if procalcitonin was <0.25 ng/mL or <0.1 ng/mL, respectively. In addition, serial procalcitonin measurements were used to guide discontinuation of antibiotics if procalcitonin dropped below 0.25 ng/mL, or by 80% to 90% from the peak value. This approach safely shortened the duration of therapy in patients with CAP.
There are several limitations in the interpretation and generalizability of this meta-analysis. There is large heterogeneity across the included clinical trials in design, procalcitonin protocols, clinical setting, and respiratory infection type, including bronchitis, acute exacerbation of chronic obstructive pulmonary disease (AECOPD), and CAP. Results were consistent only in one moderate- to high-quality randomized trial specifically studying CAP in the inpatient setting.7 Additionally, most of these trials were conducted in Europe. Antibiotic prescribing practices may be different in the US, and prescribing practices on both continents may have changed over the years with greater awareness and appreciation of antibiotic stewardship.
PROCALCITONIN-GUIDED ALGORITHMS
The ProACT trial, the largest randomized, US multicenter trial to evaluate a procalcitonin-based algorithm to assist with antibiotic decision making, included over 1,600 emergency department patients at 14 academic medical centers.8 Procalcitonin guidance in this trial did not reduce antibiotic exposure compared with usual care for patients with suspected LRTI. However, its applicability to the practice of hospitalists and the inpatient setting is limited. First, only 48% of the study participants required hospitalization. Second, this study included all LRTIs, with CAP comprising just 20% of all final diagnoses. Third, the average number of antibiotic days during hospitalization for CAP was short in both groups (3.9 days in the procalcitonin group and 4.1 days in the usual care group). This relatively short antibiotic duration makes it difficult for any intervention to decrease antibiotic days meaningfully.
In a prepost controlled intervention study for inpatients at a single US tertiary care hospital, procalcitonin guidance in hospitalized patients safely reduced antibiotic use in LRTI, specifically for the discontinuation of antibiotics.9 The greatest benefit of procalcitonin guidance in antibiotic discontinuation was found in patients with AECOPD and patients with an admitting diagnosis of CAP, but with mild illness and a low procalcitonin. Although this prepost study suggested a safe reduction of antibiotic use due to implementation of procalcitonin guidance, the lack of randomization and the absence of a contemporaneous control group are important limitations. Given the mixed findings on the effectiveness of procalcitonin guidance for hospitalized CAP patients in the US, further investigation will be needed with large clinical trials in the inpatient setting for CAP.
CONCLUSIONS
There is insufficient evidence to support the use of serum procalcitonin to withhold initial antibiotics in patients with a clinical syndrome consistent with bacterial CAP. However, the literature supports the use of procalcitonin for the early discontinuation of antibiotics for cases in which the probability of bacterial CAP is low, and procalcitonin remains below 0.1 ng/mL (Figure).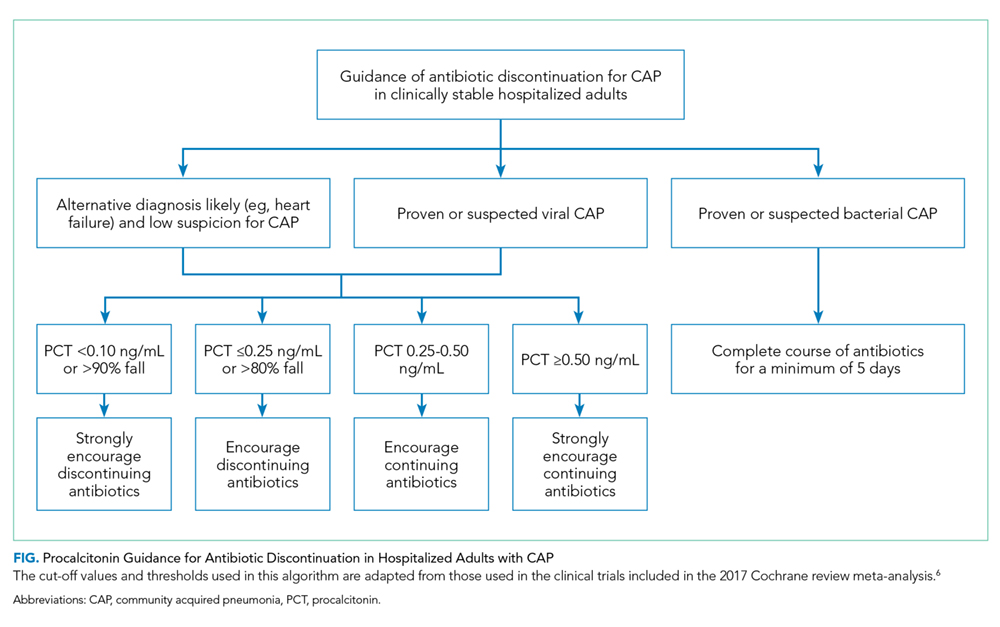
Serial measurements of procalcitonin every one to two days may also be used when clinical uncertainty remains regarding the need for antibiotics. Very low or significantly decreasing procalcitonin levels in patients with CAP and no identified bacterial pathogen likely indicate the infection was not bacterial or was bacterial, but has now been adequately treated with antibiotics. For cases of proven bacterial etiology or high clinical suspicion of bacterial CAP, there is insufficient evidence to recommend the early discontinuation of antibiotics based on procalcitonin levels short of the recommended five-day course according to current guidelines.10 Future clinical trials are needed to determine if procalcitonin guidance can safely decrease the duration of antibiotic therapy for confirmed bacterial CAP to less than five days.
There are discrepancies between the apparent test characteristics of procalcitonin and the recommended antibiotic decisions in many procalcitonin algorithms. For example, algorithms discourage antibiotics when procalcitonin values are 0.1-0.24 ng/mL, and encourage (or even strongly encourage) antibiotic use for higher procalcitonin values of 0.25-1.0 ng/mL. However, the LRs for these ranges are identical and are approximately 1.0 (Table), suggesting that decision-making should be similar across the entire procalcitonin range of 0.1 to 1.0. Future clinical trials should study revised algorithms with different cut-points, including the thresholds found in our secondary analysis of multilevel LRs. Until then, we believe there is insufficient evidence to deviate from current antibiotic decision recommendations at the traditional cut-points.
While procalcitonin is an imperfect biomarker for discriminating bacterial and nonbacterial etiologies of CAP, it may still provide helpful information for the hospitalist in antibiotic decision-making in the same way we apply other commonly used clinical variables such as fever, white blood cell count, band count, and the pattern of infiltrate in chest imaging.
Procalcitonin should be interpreted cautiously in certain populations in which it has not been extensively studied (eg, immunocompromised) or in noninfectious conditions that may elevate procalcitonin, such as major physiologic stress (eg, surgery, trauma, burns) and end-stage renal disease.12-14 Further investigation is needed to determine the efficacy and safety of procalcitonin-guided antibiotic therapy in these populations.
RECOMMENDATIONS
- Based on currently available data, a low procalcitonin value should not be used as a stand-alone test to withhold antibiotics in a patient with CAP.
- Serum procalcitonin measurements may help guide the early discontinuation of antibiotics for patients who the treating clinician judges the risks of bacterial etiology and clinical deterioration to be low.
- Interpret procalcitonin cautiously in immunocompromised patients, undergoing severe physiologic stress, or have underlying end-stage renal disease.
- Serum procalcitonin serves as an adjunct to, rather than a substitute for, clinical judgment.
Disclosures
Dr Choi, Dr Evans, and Dr Glesby have nothing to disclose. Dr Self reports receiving prior research funding from BRAHMS/Thermo-Fisher and BioMerieux for studies on procalcitonin. Dr Self reports personal fees from Inflammatix, grants from Axis Shield, Rapid Pathogen Screening, and BioMerieux, all outside the submitted work. Dr McCarthy reports receiving research funding from Allergan outside the submitted work. Dr Simon reports receiving consulting fees from Roche Diagnostics.
1. Ramirez JA, Wiemken TL, Peyrani P, et al. adults hospitalized with pneumonia in the united states: incidence, epidemiology, and mortality. Clin Infect Dis. 2017;65(11):1806-1812. https://doi.org/10.1093/cid/cix647.
2. Hecker MT, Aron DC, Patel NP, Lehmann MK, Donskey CJ. Unnecessary use of antimicrobials in hospitalized patients: current patterns of misuse with an emphasis on the antianaerobic spectrum of activity. Arch Intern Med. 2003;163(8):972-978. https://doi.org/10.1001/archinte.163.8.972.
3. Rhee C. Using procalcitonin to guide antibiotic therapy. Open Forum Infect Dis. 2017;4(1):ofw249. https://doi.org/10.1093/ofid/ofw249.
4. Self WH, Balk RA, Grijalva CG, et al. Procalcitonin as a marker of etiology in adults hospitalized with community-acquired pneumonia. Clin Infect Dis. 2017;65(2):183-190. https://doi.org/10.1093/cid/cix317.
5. Straus SE, Richardson WS, Glasziou P, Haynes RB. Evidence-Based Medicine: How to Practice and Teach It (4th Edition). Fourth Edition ed. London, England: Elsevier Churchill Livingstone; 2010.
6. Schuetz P, Wirz Y, Sager R, et al. Procalcitonin to initiate or discontinue antibiotics in acute respiratory tract infections. Cochrane Database Syst Rev. 2017;10:CD007498. https://doi.org/10.1164/rccm.200512-1922OC.
7. Christ-Crain M, Stolz D, Bingisser R, et al. Procalcitonin guidance of antibiotic therapy in community-acquired pneumonia: a randomized trial. Am J Respir Crit Care Med. 2006;174(1):84-93. https://doi.org/10.1056/NEJMoa1802670.
8. Huang DT, Yealy DM, Filbin MR, et al. Procalcitonin-guided use of antibiotics for lower respiratory tract infection. N Engl J Med. 2018;379(3):236-249. https://doi.org/10.1056/NEJMoa1802670
10. Townsend J, Adams V, Galiatsatos P, et al. Procalcitonin-guided antibiotic therapy reduces antibiotic use for lower respiratory tract infections in a United States medical center: results of a clinical trial. Open Forum Infect Dis. 2018;5(12):ofy327. https://doi.org/10.1093/ofid/ofy327.
11. Mandell LA, Wunderink RG, Anzueto A, et al. Infectious Diseases Society of America/American Thoracic Society consensus guidelines on the management of community-acquired pneumonia in adults. Clin Infect Dis. 2007;44 Suppl 2:S27-S72. https://doi.org/10.1086/511159.
12. Seoane L, Pértega S, Galeiras R, Astola I, Bouza T. Procalcitonin in the burn unit and the diagnosis of infection. Burns. 2014;40(2):223-229. https://doi.org/10.1016/j.burns.2013.11.018.
13. Dahaba AA, Rehak PH, List WF. Procalcitonin and C-reactive protein plasma concentrations in nonseptic uremic patients undergoing hemodialysis. Intensive Care Med. 2003;29(4):579-583. https://doi.org/10.1007/s00134-003-1664-8.
14. Ghabra H, White W, Townsend M, Boysen P, Nossaman B. Use of biomarkers in the prediction of culture-proven infection in the surgical intensive care unit. J Crit Care. 2019;49:149-154. https://doi.org/10.1016/j.jcrc.2018.10.023.
15. Hoshino K, Irie Y, Mizunuma M, Kawano K, Kitamura T, Ishikura H. Incidence of elevated procalcitonin and presepsin levels after severe trauma: a pilot cohort study. Anaesth Intensive Care. 2017;45(5):600-604. https://doi.org/10.1177/0310057X1704500510.
Community-acquired pneumonia (CAP) accounts for more than 1.5 million adult hospitalizations and 100,000 deaths each year in the United States.1 Antibiotic overuse in the hospital setting is an important contributor to the rise of antibiotic resistance, prompting increased efforts to limit inappropriate antibiotic use in hospitals.2 Procalcitonin, a precursor of the hormone calcitonin, is upregulated in bacterial infections and downregulated in viral infections. The US Food and Drug Administration has approved it as a serum biomarker to assist clinicians with decisions about using antibiotics.3
There is no consensus on how to best use procalcitonin in the management of CAP. We provide a practical update that includes a review of recent literature, added secondary analysis, and expert opinion surrounding the use of procalcitonin in the diagnosis and management of CAP in hospitalized adults.
INITIATION OF ANTIBIOTICS
Initial procalcitonin levels do not sufficiently exclude bacterial etiologies of CAP to withhold antibiotic prescription safely. The largest diagnostic accuracy study of procalcitonin in the diagnosis of CAP was a subanalysis of the Etiology of Pneumonia in the Community Study.4 A total of 1,735 adults hospitalized with CAP received procalcitonin testing along with systematic pathogen testing. The area under the receiver operating characteristic curve for procalcitonin in discriminating bacterial pathogens from viral pathogens was 0.73 (95% CI, 0.69-0.77). A procalcitonin cut-off of 0.1 ng/mL resulted in 80.9% (95% CI, 75.3%-85.7%) sensitivity and 51.6% (95% CI, 46.6%-56.5%) specificity for identification of any bacterial pathogen.
In a secondary analysis of this study, we calculated multilevel likelihood ratios (LRs) for ranges of procalcitonin values to determine the diagnostic accuracy of procalcitonin in distinguishing bacterial from viral etiologies of CAP (Table). Multilevel LRs offer more useful diagnostic information than dichotomizing at specified cut-points.5 A procalcitonin result less than 0.1 ng/mL has a negative LR of 0.4 (95% CI, 0.3-0.5), which is not low enough to rule out bacterial CAP effectively when starting with intermediate or high pretest probability. For a low result (<0.1 ng/mL) to be useful in ruling out bacterial CAP, for example having less than a 10% posttest probability of bacterial CAP, the pretest probability would have to be no greater than 22%. Even then, a 10% posttest probability of bacterial CAP may still be too high for clinicians to withhold initial antibiotics. For procalcitonin values between 0.1 ng/mL and 1.0 ng/mL, the probability of bacterial CAP does not change significantly, with an LR of 1.0 (95% CI, 0.8-1.3). Procalcitonin values up to 5 ng/mL reach a modest positive LR of 2.3 (95% CI, 0.8-4.3). Very high values, such as those >10 ng/mL, yield a positive LR of 5.5 (95% CI, 3.2-9.7), are potentially useful in decisions to initiate antibiotics in situations of very low pretest probability of bacterial CAP. For example, a 9% pretest probability of bacterial CAP is likely below many physicians’ threshold for starting antibiotics. A procalcitonin of 12 ng/mL in this patient would increase the posttest probability to 35%, a value that would prompt many physicians to initiate antibiotics.
Overall, there is insufficient evidence to support the use of procalcitonin as a stand-alone test for ruling out bacterial CAP, limiting its use in withholding antibiotics in patients with suspected bacterial CAP.
DISCONTINUATION OF ANTIBIOTICS
While initial procalcitonin measurements may not affect the initial antibiotic treatment decision, procalcitonin levels thereafter can guide the duration of therapy. A meta-analysis of procalcitonin-guided treatment in patients with upper or lower respiratory tract infection (LRTI) showed that procalcitonin guidance reduces antibiotic exposure and antibiotic-related adverse effects and improves survival, albeit a small absolute mortality difference of 1.4 percentage points, primarily observed in the intensive care unit setting.6 Most patients included in this meta-analysis were diagnosed with LRTI (91%), and CAP was the predominant subtype of LRTI (43%). The main effect of procalcitonin guidance for patients with CAP was earlier discontinuation of antibiotic treatment. Procalcitonin-guided algorithms in these trials discouraged, or strongly discouraged, antibiotics if procalcitonin was <0.25 ng/mL or <0.1 ng/mL, respectively. In addition, serial procalcitonin measurements were used to guide discontinuation of antibiotics if procalcitonin dropped below 0.25 ng/mL, or by 80% to 90% from the peak value. This approach safely shortened the duration of therapy in patients with CAP.
There are several limitations in the interpretation and generalizability of this meta-analysis. There is large heterogeneity across the included clinical trials in design, procalcitonin protocols, clinical setting, and respiratory infection type, including bronchitis, acute exacerbation of chronic obstructive pulmonary disease (AECOPD), and CAP. Results were consistent only in one moderate- to high-quality randomized trial specifically studying CAP in the inpatient setting.7 Additionally, most of these trials were conducted in Europe. Antibiotic prescribing practices may be different in the US, and prescribing practices on both continents may have changed over the years with greater awareness and appreciation of antibiotic stewardship.
PROCALCITONIN-GUIDED ALGORITHMS
The ProACT trial, the largest randomized, US multicenter trial to evaluate a procalcitonin-based algorithm to assist with antibiotic decision making, included over 1,600 emergency department patients at 14 academic medical centers.8 Procalcitonin guidance in this trial did not reduce antibiotic exposure compared with usual care for patients with suspected LRTI. However, its applicability to the practice of hospitalists and the inpatient setting is limited. First, only 48% of the study participants required hospitalization. Second, this study included all LRTIs, with CAP comprising just 20% of all final diagnoses. Third, the average number of antibiotic days during hospitalization for CAP was short in both groups (3.9 days in the procalcitonin group and 4.1 days in the usual care group). This relatively short antibiotic duration makes it difficult for any intervention to decrease antibiotic days meaningfully.
In a prepost controlled intervention study for inpatients at a single US tertiary care hospital, procalcitonin guidance in hospitalized patients safely reduced antibiotic use in LRTI, specifically for the discontinuation of antibiotics.9 The greatest benefit of procalcitonin guidance in antibiotic discontinuation was found in patients with AECOPD and patients with an admitting diagnosis of CAP, but with mild illness and a low procalcitonin. Although this prepost study suggested a safe reduction of antibiotic use due to implementation of procalcitonin guidance, the lack of randomization and the absence of a contemporaneous control group are important limitations. Given the mixed findings on the effectiveness of procalcitonin guidance for hospitalized CAP patients in the US, further investigation will be needed with large clinical trials in the inpatient setting for CAP.
CONCLUSIONS
There is insufficient evidence to support the use of serum procalcitonin to withhold initial antibiotics in patients with a clinical syndrome consistent with bacterial CAP. However, the literature supports the use of procalcitonin for the early discontinuation of antibiotics for cases in which the probability of bacterial CAP is low, and procalcitonin remains below 0.1 ng/mL (Figure).
Serial measurements of procalcitonin every one to two days may also be used when clinical uncertainty remains regarding the need for antibiotics. Very low or significantly decreasing procalcitonin levels in patients with CAP and no identified bacterial pathogen likely indicate the infection was not bacterial or was bacterial, but has now been adequately treated with antibiotics. For cases of proven bacterial etiology or high clinical suspicion of bacterial CAP, there is insufficient evidence to recommend the early discontinuation of antibiotics based on procalcitonin levels short of the recommended five-day course according to current guidelines.10 Future clinical trials are needed to determine if procalcitonin guidance can safely decrease the duration of antibiotic therapy for confirmed bacterial CAP to less than five days.
There are discrepancies between the apparent test characteristics of procalcitonin and the recommended antibiotic decisions in many procalcitonin algorithms. For example, algorithms discourage antibiotics when procalcitonin values are 0.1-0.24 ng/mL, and encourage (or even strongly encourage) antibiotic use for higher procalcitonin values of 0.25-1.0 ng/mL. However, the LRs for these ranges are identical and are approximately 1.0 (Table), suggesting that decision-making should be similar across the entire procalcitonin range of 0.1 to 1.0. Future clinical trials should study revised algorithms with different cut-points, including the thresholds found in our secondary analysis of multilevel LRs. Until then, we believe there is insufficient evidence to deviate from current antibiotic decision recommendations at the traditional cut-points.
While procalcitonin is an imperfect biomarker for discriminating bacterial and nonbacterial etiologies of CAP, it may still provide helpful information for the hospitalist in antibiotic decision-making in the same way we apply other commonly used clinical variables such as fever, white blood cell count, band count, and the pattern of infiltrate in chest imaging.
Procalcitonin should be interpreted cautiously in certain populations in which it has not been extensively studied (eg, immunocompromised) or in noninfectious conditions that may elevate procalcitonin, such as major physiologic stress (eg, surgery, trauma, burns) and end-stage renal disease.12-14 Further investigation is needed to determine the efficacy and safety of procalcitonin-guided antibiotic therapy in these populations.
RECOMMENDATIONS
- Based on currently available data, a low procalcitonin value should not be used as a stand-alone test to withhold antibiotics in a patient with CAP.
- Serum procalcitonin measurements may help guide the early discontinuation of antibiotics for patients who the treating clinician judges the risks of bacterial etiology and clinical deterioration to be low.
- Interpret procalcitonin cautiously in immunocompromised patients, undergoing severe physiologic stress, or have underlying end-stage renal disease.
- Serum procalcitonin serves as an adjunct to, rather than a substitute for, clinical judgment.
Disclosures
Dr Choi, Dr Evans, and Dr Glesby have nothing to disclose. Dr Self reports receiving prior research funding from BRAHMS/Thermo-Fisher and BioMerieux for studies on procalcitonin. Dr Self reports personal fees from Inflammatix, grants from Axis Shield, Rapid Pathogen Screening, and BioMerieux, all outside the submitted work. Dr McCarthy reports receiving research funding from Allergan outside the submitted work. Dr Simon reports receiving consulting fees from Roche Diagnostics.
1. Ramirez JA, Wiemken TL, Peyrani P, et al. adults hospitalized with pneumonia in the united states: incidence, epidemiology, and mortality. Clin Infect Dis. 2017;65(11):1806-1812. https://doi.org/10.1093/cid/cix647.
2. Hecker MT, Aron DC, Patel NP, Lehmann MK, Donskey CJ. Unnecessary use of antimicrobials in hospitalized patients: current patterns of misuse with an emphasis on the antianaerobic spectrum of activity. Arch Intern Med. 2003;163(8):972-978. https://doi.org/10.1001/archinte.163.8.972.
3. Rhee C. Using procalcitonin to guide antibiotic therapy. Open Forum Infect Dis. 2017;4(1):ofw249. https://doi.org/10.1093/ofid/ofw249.
4. Self WH, Balk RA, Grijalva CG, et al. Procalcitonin as a marker of etiology in adults hospitalized with community-acquired pneumonia. Clin Infect Dis. 2017;65(2):183-190. https://doi.org/10.1093/cid/cix317.
5. Straus SE, Richardson WS, Glasziou P, Haynes RB. Evidence-Based Medicine: How to Practice and Teach It (4th Edition). Fourth Edition ed. London, England: Elsevier Churchill Livingstone; 2010.
6. Schuetz P, Wirz Y, Sager R, et al. Procalcitonin to initiate or discontinue antibiotics in acute respiratory tract infections. Cochrane Database Syst Rev. 2017;10:CD007498. https://doi.org/10.1164/rccm.200512-1922OC.
7. Christ-Crain M, Stolz D, Bingisser R, et al. Procalcitonin guidance of antibiotic therapy in community-acquired pneumonia: a randomized trial. Am J Respir Crit Care Med. 2006;174(1):84-93. https://doi.org/10.1056/NEJMoa1802670.
8. Huang DT, Yealy DM, Filbin MR, et al. Procalcitonin-guided use of antibiotics for lower respiratory tract infection. N Engl J Med. 2018;379(3):236-249. https://doi.org/10.1056/NEJMoa1802670
10. Townsend J, Adams V, Galiatsatos P, et al. Procalcitonin-guided antibiotic therapy reduces antibiotic use for lower respiratory tract infections in a United States medical center: results of a clinical trial. Open Forum Infect Dis. 2018;5(12):ofy327. https://doi.org/10.1093/ofid/ofy327.
11. Mandell LA, Wunderink RG, Anzueto A, et al. Infectious Diseases Society of America/American Thoracic Society consensus guidelines on the management of community-acquired pneumonia in adults. Clin Infect Dis. 2007;44 Suppl 2:S27-S72. https://doi.org/10.1086/511159.
12. Seoane L, Pértega S, Galeiras R, Astola I, Bouza T. Procalcitonin in the burn unit and the diagnosis of infection. Burns. 2014;40(2):223-229. https://doi.org/10.1016/j.burns.2013.11.018.
13. Dahaba AA, Rehak PH, List WF. Procalcitonin and C-reactive protein plasma concentrations in nonseptic uremic patients undergoing hemodialysis. Intensive Care Med. 2003;29(4):579-583. https://doi.org/10.1007/s00134-003-1664-8.
14. Ghabra H, White W, Townsend M, Boysen P, Nossaman B. Use of biomarkers in the prediction of culture-proven infection in the surgical intensive care unit. J Crit Care. 2019;49:149-154. https://doi.org/10.1016/j.jcrc.2018.10.023.
15. Hoshino K, Irie Y, Mizunuma M, Kawano K, Kitamura T, Ishikura H. Incidence of elevated procalcitonin and presepsin levels after severe trauma: a pilot cohort study. Anaesth Intensive Care. 2017;45(5):600-604. https://doi.org/10.1177/0310057X1704500510.
© 2019 Society of Hospital Medicine
Methodological Progress Note: Group Level Assessment
Group Level Assessment (GLA) is a qualitative research methodology designed to enable groups of stakeholders to generate and evaluate data in participatory sessions.1 It has been used in diverse health-related settings for multiple research purposes, including needs/resource assessment, program evaluation, quality improvement, intervention development, feasibility/acceptability testing, knowledge generation, and prioritization.2-6 Unlike traditional qualitative research methods in which participants provide data and researchers analyze it, GLA uses a seven-step structured process (Table) that actively involves a large group of stakeholders in the generation, interpretation, and synthesis of data and allows salient themes to be identified from stakeholders’ perspectives.7 GLA deliverables include a set of action items that are relevant to the target issue and representative of the collective view of stakeholders. In this issue of the Journal of Hospital Medicine, Choe and colleagues used GLA methodology to identify the perspectives of pediatric medical providers and interpreters with regard to the use of interpreter services for hospitalized children having limited English proficiency (LEP).8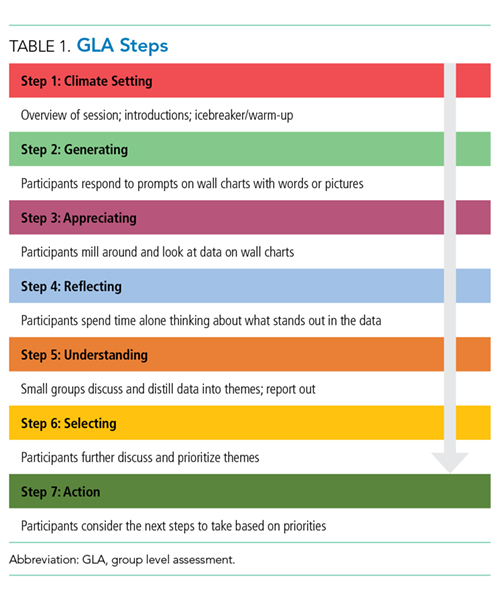
Each individual GLA session is intended for a group of 15-60 stakeholders. Ideally, a GLA session is scheduled for approximately three hours with a skilled facilitator guiding the group through the steps of the session.1 Depending on the study scope and research questions, modifications to GLA can be made when engaging fewer stakeholders, conducting the GLA across several shorter sessions with the same group, or conducting multiple sessions with different stakeholder groups wherein results are integrated across the groups.1
APPLICATION OF GLA
Stakeholder Recruitment
GLAs are designed to bring diverse groups together to be able to generate and evaluate ideas collectively, which in turn helps to reduce potential power differentials between or among participants. Depending on the research question(s), relevant stakeholders may include local community residents, patients, caregivers, community leaders, practitioners, providers, community-based organizations, and even CEOs. The use of purposeful sampling techniques can obtain a diverse group of stakeholders, thus helping ensure a wide range of ideas and perspectives. Choe and colleagues used flyers and announcements at staff meetings to recruit physicians, nursing staff, and interpreters who were subsequently assigned to GLA sessions to ensure engagement from a range of stakeholder roles at each session.8
Session Logistics
Strategies to create an open, equitable atmosphere in GLA sessions include role-based assigning of individuals to specific groups, avoiding introductions that emphasize status, pre-education for any leaders and supervisors about the participatory and equitable nature of GLA, and minimizing cliques and overly dominant voices throughout the session. Stakeholders who take part in activities in a GLA session typically receive an incentive for participating. Additional supports such as food and childcare may be considered. GLA sessions involving children may require providing the young participants assistance in writing their responses and/or the use of additional facilitators to keep the small groups on track.5 Interpreters and facilitators can be incorporated into GLA sessions to assist stakeholders who may need assistance with understanding and responding to prompts, such as language interpretation and translation services.
Prompt Development
Similar to the development of questions for interview and focus group guides, creating effective prompts is a critical component of data collection in GLA. Prompts are statements worded as incomplete or fill-in-the-blank sentences that should be open ended to allow participants to respond with their own thoughts and experiences. Prompts that resemble the beginning of a sentence (eg, “The biggest challenge we face is…”) encourage honest reflection rather than questions that can make participants feel like they are being evaluated. We recommend varying the number of prompts based on the group size: approximately one chart and prompt per person attending, with a maximum of 35 prompts at one session.1 This allows for sufficient variability in the responses generated without being overwhelming or too time-consuming. For example, Choe et al. developed a pool of 51 unique prompts addressing their research questions and then used 15-32 prompts in each GLA session, depending on the number of participants. 8 Prompts should be written with some purposeful redundancy, targeting the research question from several angles. The emphasis should be on the content’s alignment with the research questions rather than the actual wording of the prompts as a way of ensuring that the generated data is both valid and useful.
Prompts should also vary in format, style (eg, different color markers, pictures, fonts, etc.), and placement on each flip chart page. An individual flip chart can include multiple related prompts: for example, “split-halves” in two columns or rows (ie, the best part/worst part). Taken as a whole, the flip charts and accompanying prompts create different lenses for gathering participant perspectives on the research questions. See Appendix Table for suggested prompt characteristics and examples from a hypothetical study related to pediatric healthcare.
GLA prompt development will ideally occur in collaboration with an advisory team comprised of representative members from each of the stakeholder groups. Using a participatory research approach in the research design and preparation phases ensures that GLA prompts are understandable and relevant to participants and are able to appropriately capture the underlying purpose of the study.
Description of the Seven Steps in GLA
In step one, climate setting, the facilitator provides an overview of the session, including a description of the GLA rationale and process. Typically, an icebreaker or brief introduction activity is conducted. Step two, generating, is a hallmark step of GLA in which participants walk around and respond to prompts prewritten on flip charts hung on walls in a large room. Participants use markers and respond to each prompt by either providing a unique comment and/or corroborating an existing comment by adding a checkmark or star. During this step, organizers typically play music and encourage participants to enjoy food, chat with fellow participants, and leisurely move from prompt to prompt in any order. Step three, appreciating, is a brief interim step where participants take a “gallery walk” and view responses written on the charts.
In step four, reflecting, participants reflect on the data and briefly write down their thoughts about the responses generated in the session. In step five, understanding, smaller groups synthesize responses across a subset of charts and report their findings to the larger group. Depending on the size and composition of the larger group, small groups of four to seven people are formed or assigned. Each small group is assigned a subset of approximately four to six charts. Using thematic analysis, participants look for relationships among the responses on their assigned charts, referring to individual responses as evidence for the main findings. Groups will take notes on the charts, circle key phrases, or draw arrows to show relationships in the data and thereafter develop themes. As each small group reports their findings, the facilitator will keep a running list of generated themes, ideally in the participants’ own words. Step six, selecting, involves participants discussing, further synthesizing, and prioritizing data. Step six can occur as a facilitated large group discussion or in a form in which participants can remain in the same small groups from step five and work together to complete this further step. Themes across all of the small groups are consolidated and developed into overarching themes. Step seven, action, includes planning the next steps to address priorities.
Data Analysis
Analyzing the data generated through a GLA is an iterative process incorporated into steps three to seven as described above and often continues after the GLA session is complete. Step seven can be scheduled as a separate action-planning session depending on time constraints and the study goals. This final step moves the group toward interpretation and dissemination as themes are prioritized and used to drive action steps toward a programmatic, policy, or community change. In some studies, themes will be aggregated across multiple GLAs to integrate the findings from several sessions. This step is sometimes completed with a smaller group of stakeholders, an advisory board, or the research team.
Complementary Data and Synthesis
Research teams often collect additional sources of data that are later used to analyze and interpret the initial stakeholder-developed findings (ie, demographic surveys) and to identify priority areas. Field notes, photographs of completed charts, and recorded participant quotes can also be incorporated into the thematic analysis. Small and large group discussions could be audio recorded and transcribed to capture participants’ individual comments and interpretations. In Choe et al. the team recorded detailed notes, including quotations from participants, and collected a demographic survey. After each GLA session, Choe and colleagues compiled all of the stakeholder-driven findings to develop an overarching set of themes related to communication with LEP families and priority areas that could inform subsequent action. Similar to the qualitative validation strategy of member checking, the authors shared and revised this overarching set of themes in discussion with stakeholders to ensure that participant ideas were adequately and accurately represented.8
STRENGTHS OF GLA
Compared to traditional qualitative methods such as one-on-one interviews and focus groups, GLA is designed for large groups and is used to promote active engagement of diverse stakeholders in the participatory process. Unlike many other qualitative methods, GLA provides a stakeholder-driven, structured format to elicit diverse stakeholder viewpoints in the moment and build consensus in a participatory manner about priorities and subsequent actions. The progression of the GLA process is collaborative, with stakeholders generating, analyzing, and prioritizing data from their own perspectives. In a focus group or one-on-one interviews, researchers would conduct the analysis after the audio recordings were transcribed. In GLA, stakeholders conduct a thematic analysis in real time, an aspect that adds the stakeholder perspective to analysis of the findings, interpretation, and implications. GLA offers a fun and interactive experience that can build a sense of community among participants (eg, walking around, impromptu conversation, working in small groups, sharing perspectives on the same issue from different vantage points, etc.). GLA is a versatile, flexible methodology that can be used to address different research objectives, be modified for use with various size groups, and be adapted based on the needs and characteristics of stakeholders (eg, children, people with disabilities, etc.).1 When used in recruitment, GLA is designed to include stakeholders representing different roles and levels of a system. GLA can be particularly useful when engaging underserved communities in research because the process is nonthreatening and promotive of shared perspectives and decision-making. Importantly, the final step of GLA provides interested stakeholders with a way to stay involved in the research through prioritization and action.
LIMITATIONS OF GLA
Like other self-report research methods, GLA relies on stakeholder comfort and willingness to share “public data.”1 Thus, controversial or sensitive issues may not be brought forth. Since the final themes of GLA are consensus based in terms of what the group of stakeholders finds to be most important, nuances and outlier data can be missed. Successfully conducting a GLA requires a skilled, flexible facilitator who can manage group dynamics while also balancing the structure of the seven-step process, promoting an open and equitable environment, and ensuring the research process remains rigorous. Large groups can be more difficult for facilitators to manage especially when there are power differentials, conflict, and hidden agendas among stakeholders. The large group design, multiple steps of GLA, and participatory atmosphere with music and food can be off-putting for some stakeholders who find the process too noisy, overwhelming, or unstructured. In addition, large groups can be challenging to schedule at times and to find locations that are convenient for stakeholders.
WHY DID THE AUTHORS USE GLA?
Compared to researcher-driven qualitative methods that can be resource-intensive and are limited by researcher perspective, GLA emphasizes the contextual, “lived” expertise of stakeholders and relies on them in real time to identify and prioritize matters relevant to the participants. The participatory process of GLA promotes stakeholder buy-in and builds on the collective wisdom of the stakeholder group. This is ideally seen in Choe et al.’s study where GLA offered the researchers a structured qualitative methodology that engaged a large number of medical providers and interpreters to identify effective practices that should ultimately enhance communication with families of hospitalized LEP children.
Disclosures
The authors have nothing to disclose.
1. Vaughn LM, Lohmueller M. Calling all stakeholders: group-level assessment (GLA)—a qualitative and participatory method for large groups. Eval Rev. 2014;38(4):336-355. https:// doi.org/10.1177/0193841X14544903.
2. Gosdin CH, Vaughn L. Perceptions of physician bedside handoff with nurse and family involvement. Hosp Pediatr. 2012;2(1):34-38. https://doi.org/10.1542/hpeds.2011-0008-2
3. Graham KE, Schellinger AR, Vaughn LM. Developing strategies for positive change: transitioning foster youth to adulthood. Child Youth Serv Rev. 2015;54:71-79. https://doi.org/10.1016/j.childyouth.2015.04.014
4. Schondelmeyer AC, Jenkins AM, Allison B, et al. Factors influencing use of continuous physiologic monitors for hospitalized pediatric patients. Hosp Pediatr. 2019;9(6):423-428. https://doi.org/10.1542/hpeds.2019-0007
5. Vaughn LM, Jacquez F, Zhao J, Lang M. Partnering with students to explore the health needs of an ethnically diverse, low-resource school: an innovative large group assessment approach. Fam Community Health. 2011;34(1):72-84. https://doi.org/10.1097/FCH.0b013e3181fded12
6. Vaughn LM. Group level assessment: a large group method for identifying primary issues and needs within a community. Sage Journals. 2014;38:336-355. https://doi.org/10.4135/978144627305014541626
7. Vaughn LM. Psychology and culture: thinking, feeling and behaving in a global context. 2nd ed. New York, NY: Taylor & Francis; 2019.
8. Choe A, Unaka N, Schondelmeyer AC, Bignall, RW, Vilvens H, Thomson J. Inpatient communication barriers and drivers when caring for children with limited English proficiency [published online ahead of print July 24, 2019]. J Hosp Med. https://doi.org/10.12788/jhm.3240.
Group Level Assessment (GLA) is a qualitative research methodology designed to enable groups of stakeholders to generate and evaluate data in participatory sessions.1 It has been used in diverse health-related settings for multiple research purposes, including needs/resource assessment, program evaluation, quality improvement, intervention development, feasibility/acceptability testing, knowledge generation, and prioritization.2-6 Unlike traditional qualitative research methods in which participants provide data and researchers analyze it, GLA uses a seven-step structured process (Table) that actively involves a large group of stakeholders in the generation, interpretation, and synthesis of data and allows salient themes to be identified from stakeholders’ perspectives.7 GLA deliverables include a set of action items that are relevant to the target issue and representative of the collective view of stakeholders. In this issue of the Journal of Hospital Medicine, Choe and colleagues used GLA methodology to identify the perspectives of pediatric medical providers and interpreters with regard to the use of interpreter services for hospitalized children having limited English proficiency (LEP).8
Each individual GLA session is intended for a group of 15-60 stakeholders. Ideally, a GLA session is scheduled for approximately three hours with a skilled facilitator guiding the group through the steps of the session.1 Depending on the study scope and research questions, modifications to GLA can be made when engaging fewer stakeholders, conducting the GLA across several shorter sessions with the same group, or conducting multiple sessions with different stakeholder groups wherein results are integrated across the groups.1
APPLICATION OF GLA
Stakeholder Recruitment
GLAs are designed to bring diverse groups together to be able to generate and evaluate ideas collectively, which in turn helps to reduce potential power differentials between or among participants. Depending on the research question(s), relevant stakeholders may include local community residents, patients, caregivers, community leaders, practitioners, providers, community-based organizations, and even CEOs. The use of purposeful sampling techniques can obtain a diverse group of stakeholders, thus helping ensure a wide range of ideas and perspectives. Choe and colleagues used flyers and announcements at staff meetings to recruit physicians, nursing staff, and interpreters who were subsequently assigned to GLA sessions to ensure engagement from a range of stakeholder roles at each session.8
Session Logistics
Strategies to create an open, equitable atmosphere in GLA sessions include role-based assigning of individuals to specific groups, avoiding introductions that emphasize status, pre-education for any leaders and supervisors about the participatory and equitable nature of GLA, and minimizing cliques and overly dominant voices throughout the session. Stakeholders who take part in activities in a GLA session typically receive an incentive for participating. Additional supports such as food and childcare may be considered. GLA sessions involving children may require providing the young participants assistance in writing their responses and/or the use of additional facilitators to keep the small groups on track.5 Interpreters and facilitators can be incorporated into GLA sessions to assist stakeholders who may need assistance with understanding and responding to prompts, such as language interpretation and translation services.
Prompt Development
Similar to the development of questions for interview and focus group guides, creating effective prompts is a critical component of data collection in GLA. Prompts are statements worded as incomplete or fill-in-the-blank sentences that should be open ended to allow participants to respond with their own thoughts and experiences. Prompts that resemble the beginning of a sentence (eg, “The biggest challenge we face is…”) encourage honest reflection rather than questions that can make participants feel like they are being evaluated. We recommend varying the number of prompts based on the group size: approximately one chart and prompt per person attending, with a maximum of 35 prompts at one session.1 This allows for sufficient variability in the responses generated without being overwhelming or too time-consuming. For example, Choe et al. developed a pool of 51 unique prompts addressing their research questions and then used 15-32 prompts in each GLA session, depending on the number of participants. 8 Prompts should be written with some purposeful redundancy, targeting the research question from several angles. The emphasis should be on the content’s alignment with the research questions rather than the actual wording of the prompts as a way of ensuring that the generated data is both valid and useful.
Prompts should also vary in format, style (eg, different color markers, pictures, fonts, etc.), and placement on each flip chart page. An individual flip chart can include multiple related prompts: for example, “split-halves” in two columns or rows (ie, the best part/worst part). Taken as a whole, the flip charts and accompanying prompts create different lenses for gathering participant perspectives on the research questions. See Appendix Table for suggested prompt characteristics and examples from a hypothetical study related to pediatric healthcare.
GLA prompt development will ideally occur in collaboration with an advisory team comprised of representative members from each of the stakeholder groups. Using a participatory research approach in the research design and preparation phases ensures that GLA prompts are understandable and relevant to participants and are able to appropriately capture the underlying purpose of the study.
Description of the Seven Steps in GLA
In step one, climate setting, the facilitator provides an overview of the session, including a description of the GLA rationale and process. Typically, an icebreaker or brief introduction activity is conducted. Step two, generating, is a hallmark step of GLA in which participants walk around and respond to prompts prewritten on flip charts hung on walls in a large room. Participants use markers and respond to each prompt by either providing a unique comment and/or corroborating an existing comment by adding a checkmark or star. During this step, organizers typically play music and encourage participants to enjoy food, chat with fellow participants, and leisurely move from prompt to prompt in any order. Step three, appreciating, is a brief interim step where participants take a “gallery walk” and view responses written on the charts.
In step four, reflecting, participants reflect on the data and briefly write down their thoughts about the responses generated in the session. In step five, understanding, smaller groups synthesize responses across a subset of charts and report their findings to the larger group. Depending on the size and composition of the larger group, small groups of four to seven people are formed or assigned. Each small group is assigned a subset of approximately four to six charts. Using thematic analysis, participants look for relationships among the responses on their assigned charts, referring to individual responses as evidence for the main findings. Groups will take notes on the charts, circle key phrases, or draw arrows to show relationships in the data and thereafter develop themes. As each small group reports their findings, the facilitator will keep a running list of generated themes, ideally in the participants’ own words. Step six, selecting, involves participants discussing, further synthesizing, and prioritizing data. Step six can occur as a facilitated large group discussion or in a form in which participants can remain in the same small groups from step five and work together to complete this further step. Themes across all of the small groups are consolidated and developed into overarching themes. Step seven, action, includes planning the next steps to address priorities.
Data Analysis
Analyzing the data generated through a GLA is an iterative process incorporated into steps three to seven as described above and often continues after the GLA session is complete. Step seven can be scheduled as a separate action-planning session depending on time constraints and the study goals. This final step moves the group toward interpretation and dissemination as themes are prioritized and used to drive action steps toward a programmatic, policy, or community change. In some studies, themes will be aggregated across multiple GLAs to integrate the findings from several sessions. This step is sometimes completed with a smaller group of stakeholders, an advisory board, or the research team.
Complementary Data and Synthesis
Research teams often collect additional sources of data that are later used to analyze and interpret the initial stakeholder-developed findings (ie, demographic surveys) and to identify priority areas. Field notes, photographs of completed charts, and recorded participant quotes can also be incorporated into the thematic analysis. Small and large group discussions could be audio recorded and transcribed to capture participants’ individual comments and interpretations. In Choe et al. the team recorded detailed notes, including quotations from participants, and collected a demographic survey. After each GLA session, Choe and colleagues compiled all of the stakeholder-driven findings to develop an overarching set of themes related to communication with LEP families and priority areas that could inform subsequent action. Similar to the qualitative validation strategy of member checking, the authors shared and revised this overarching set of themes in discussion with stakeholders to ensure that participant ideas were adequately and accurately represented.8
STRENGTHS OF GLA
Compared to traditional qualitative methods such as one-on-one interviews and focus groups, GLA is designed for large groups and is used to promote active engagement of diverse stakeholders in the participatory process. Unlike many other qualitative methods, GLA provides a stakeholder-driven, structured format to elicit diverse stakeholder viewpoints in the moment and build consensus in a participatory manner about priorities and subsequent actions. The progression of the GLA process is collaborative, with stakeholders generating, analyzing, and prioritizing data from their own perspectives. In a focus group or one-on-one interviews, researchers would conduct the analysis after the audio recordings were transcribed. In GLA, stakeholders conduct a thematic analysis in real time, an aspect that adds the stakeholder perspective to analysis of the findings, interpretation, and implications. GLA offers a fun and interactive experience that can build a sense of community among participants (eg, walking around, impromptu conversation, working in small groups, sharing perspectives on the same issue from different vantage points, etc.). GLA is a versatile, flexible methodology that can be used to address different research objectives, be modified for use with various size groups, and be adapted based on the needs and characteristics of stakeholders (eg, children, people with disabilities, etc.).1 When used in recruitment, GLA is designed to include stakeholders representing different roles and levels of a system. GLA can be particularly useful when engaging underserved communities in research because the process is nonthreatening and promotive of shared perspectives and decision-making. Importantly, the final step of GLA provides interested stakeholders with a way to stay involved in the research through prioritization and action.
LIMITATIONS OF GLA
Like other self-report research methods, GLA relies on stakeholder comfort and willingness to share “public data.”1 Thus, controversial or sensitive issues may not be brought forth. Since the final themes of GLA are consensus based in terms of what the group of stakeholders finds to be most important, nuances and outlier data can be missed. Successfully conducting a GLA requires a skilled, flexible facilitator who can manage group dynamics while also balancing the structure of the seven-step process, promoting an open and equitable environment, and ensuring the research process remains rigorous. Large groups can be more difficult for facilitators to manage especially when there are power differentials, conflict, and hidden agendas among stakeholders. The large group design, multiple steps of GLA, and participatory atmosphere with music and food can be off-putting for some stakeholders who find the process too noisy, overwhelming, or unstructured. In addition, large groups can be challenging to schedule at times and to find locations that are convenient for stakeholders.
WHY DID THE AUTHORS USE GLA?
Compared to researcher-driven qualitative methods that can be resource-intensive and are limited by researcher perspective, GLA emphasizes the contextual, “lived” expertise of stakeholders and relies on them in real time to identify and prioritize matters relevant to the participants. The participatory process of GLA promotes stakeholder buy-in and builds on the collective wisdom of the stakeholder group. This is ideally seen in Choe et al.’s study where GLA offered the researchers a structured qualitative methodology that engaged a large number of medical providers and interpreters to identify effective practices that should ultimately enhance communication with families of hospitalized LEP children.
Disclosures
The authors have nothing to disclose.
1. Vaughn LM, Lohmueller M. Calling all stakeholders: group-level assessment (GLA)—a qualitative and participatory method for large groups. Eval Rev. 2014;38(4):336-355. https:// doi.org/10.1177/0193841X14544903.
2. Gosdin CH, Vaughn L. Perceptions of physician bedside handoff with nurse and family involvement. Hosp Pediatr. 2012;2(1):34-38. https://doi.org/10.1542/hpeds.2011-0008-2
3. Graham KE, Schellinger AR, Vaughn LM. Developing strategies for positive change: transitioning foster youth to adulthood. Child Youth Serv Rev. 2015;54:71-79. https://doi.org/10.1016/j.childyouth.2015.04.014
4. Schondelmeyer AC, Jenkins AM, Allison B, et al. Factors influencing use of continuous physiologic monitors for hospitalized pediatric patients. Hosp Pediatr. 2019;9(6):423-428. https://doi.org/10.1542/hpeds.2019-0007
5. Vaughn LM, Jacquez F, Zhao J, Lang M. Partnering with students to explore the health needs of an ethnically diverse, low-resource school: an innovative large group assessment approach. Fam Community Health. 2011;34(1):72-84. https://doi.org/10.1097/FCH.0b013e3181fded12
6. Vaughn LM. Group level assessment: a large group method for identifying primary issues and needs within a community. Sage Journals. 2014;38:336-355. https://doi.org/10.4135/978144627305014541626
7. Vaughn LM. Psychology and culture: thinking, feeling and behaving in a global context. 2nd ed. New York, NY: Taylor & Francis; 2019.
8. Choe A, Unaka N, Schondelmeyer AC, Bignall, RW, Vilvens H, Thomson J. Inpatient communication barriers and drivers when caring for children with limited English proficiency [published online ahead of print July 24, 2019]. J Hosp Med. https://doi.org/10.12788/jhm.3240.
© 2019 Society of Hospital Medicine
Clinical Progress Note: Pediatric Acute Kidney Injury
Acute kidney injury (AKI) occurs in 5%-30% of noncritically ill hospitalized children.1 Initially thought to be simply a symptom of more severe pathologies, it is now recognized that AKI independently increases mortality and is associated with the development of chronic kidney disease (CKD), even in children.2 The wide acceptance of the Kidney Disease Improving Global Outcome (KDIGO) diagnostic criteria has enabled a more uniform definition of AKI from both clinical and research perspectives.2 A better understanding of the pathophysiology and risk factors for AKI has led to new methods for early detection and prevention efforts. While serum creatinine (SCr) was historically one of the sole markers of AKI, novel biomarkers can facilitate earlier diagnosis of AKI, identify subclinical AKI, and guide clinical management. This clinical practice update addresses the latest clinical advances in risk assessment, diagnosis, and prevention of pediatric AKI, with a focus on AKI biomarkers.
DIAGNOSIS, BIOMARKERS, AND DEFINITION
Several sets of criteria have been used to diagnose AKI. The KDIGO classification, based on a systematic review of the literature and developed through expert consensus, is the current recommended definition.3 Increasing AKI stage, as defined by the KDIGO classification, is associated with increased mortality, the need for renal replacement therapy, length of stay, and CKD, thus underscoring the importance of accurate classification.3 Stage 1 AKI is defined by a rise in SCr of ≥0.3 mg/dL,1.5-1.9 times the baseline SCr, or urine output <0.5 ml/kg/h for six to 12 hours; stage 2 by a rise of ≥2.0-2.9 times the baseline SCr or urine output <0.5 ml/kg/h for >12 hours; and stage 3 by a rise of ≥4.0 mg/dL, ≥three times the baseline SCr, initiation of renal replacement therapy, urine output <0.3 ml/kg/h for ≥24 hours, or anuria ≥12 hours. However, these criteria rely on SCr, which is a suboptimal marker of renal dysfunction, as it rises only once the glomerular filtration rate (GFR) has already decreased, in some cases by as much as 50%. Additionally, interpretation of SCr in the diagnosis of AKI requires a prior Scr measurement to determine the magnitude of change from the baseline value, which is often lacking in children. To mitigate this limitation, different formulas exist to estimate a baseline SCr value based on height or age, an approach that assumes patients have preexisting normal renal function.
The limitations of SCr have led to interest in identifying more accurate biomarkers of AKI. Although many candidates have been identified, we will limit our discussion to those currently available for clinical use: serum cystatin C, urine neutrophil gelatinase-associated lipocalin (NGAL), urine TIMP-2, and urine IGFBP7 (Table).4-8 While urine NGAL and cystatin C are measured individually, TIMP-2 and IGFBP7 are measured on the same panel and the product of their multiplied values is used for clinical guidance. While each of these biomarkers have good predictive accuracy for AKI when used independently, their combined use increases the accuracy of AKI diagnosis. These biomarkers can be divided into broad categories based on their utility as either functional markers or markers of injury.6 Serum cystatin C is a functional marker and as such can be used to estimate GFR more accurately than SCr.9 Comparatively, urine NGAL is a marker of renal injury, while TIMP2 and IGFBP7 are markers of renal stress. These markers are not useful in estimating GFR, but rather aid in the prediction and diagnosis of AKI (Figure). Despite the limitations of SCr, these biomarkers have yet to be incorporated into the diagnostic criteria. They have, however, helped to refine our understanding of the pathophysiology of AKI.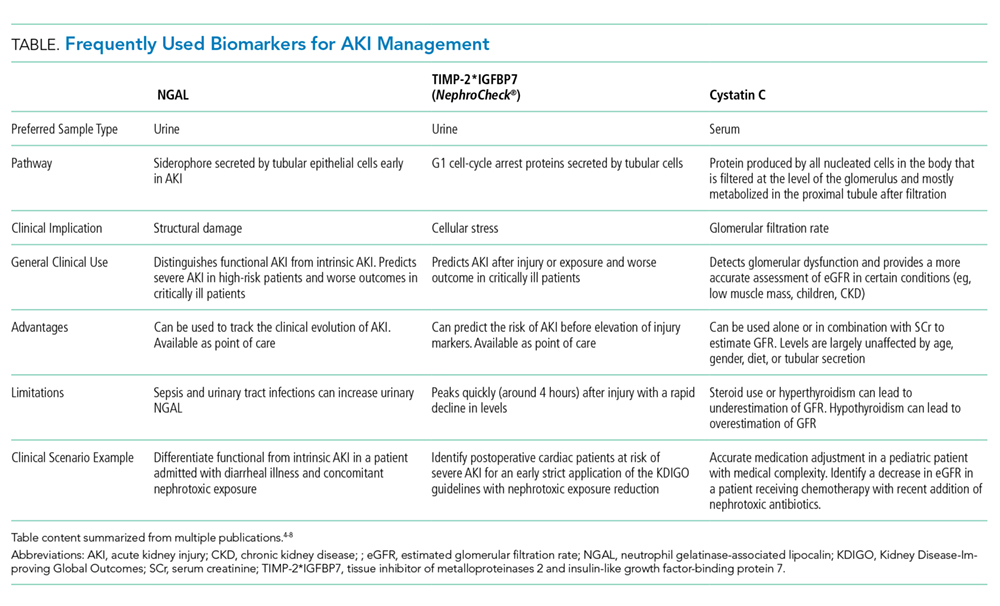
AKI has classically been divided into three categories based on the etiology of injury, namely prerenal azotemia, intrinsic renal disease, and postrenal causes. The discovery of new biomarkers adds nuance to the classification of AKI. Two groups of biomarkers are particularly helpful in this regard: markers of structural injury (eg, NGAL) and functional markers (eg, cystatin C). The combination of these biomarkers with SCr has refined the categories of AKI (Figure). For example, NGAL can accurately distinguish between a rise in SCr due to functional AKI, previously referred to as prerenal azotemia, and a rise in SCr due to intrinsic kidney injury. An elevation of structural injury biomarkers in the absence of a significant rise in SCr is referred to as subclinical AKI. Patients with subclinical AKI have worse outcomes than those without AKI but better outcomes than patients with AKI with elevation of both SCr and NGAL (Figure).2,6 Time to resolution of AKI further refines our ability to predict prognosis and outcomes. Transient AKI, defined as resolution within 48 hours, is associated with a better prognosis than persistent AKI. Renal dysfunction lasting more than seven days but less than 90 days is referred to as acute kidney disease (AKD). While both transient AKI and AKD represent different entities on the continuum between AKI and CKD, further research is needed to better elucidate these classifications.2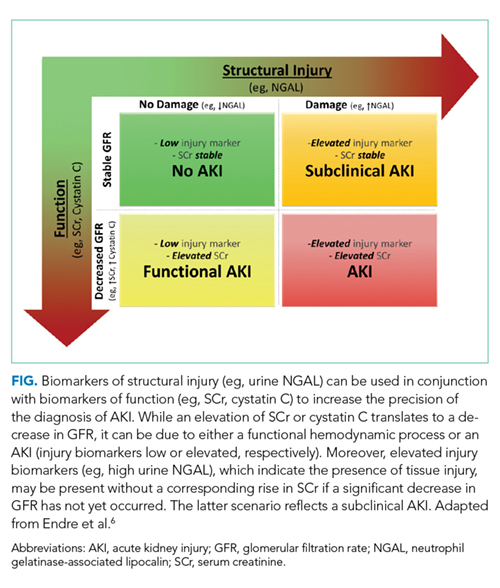
RISK STRATIFICATION
The renal angina index (RAI) identifies critically ill children at high risk for AKI. The RAI combines traditional markers of AKI, such as a change in estimated creatinine clearance and fluid overload, with patient factors, including need for ventilation, inotropic support, and history of transplantation (solid organ or bone marrow) to identify those patients who are at high risk for severe AKI. Patients identified as high risk by the patient factors component of the RAI have a much lower threshold for both a decrease in creatinine clearance and fluid overload to be considered at risk for severe AKI, as these early signs are more likely to reflect an early impending severe AKI in this high-risk group. Conversely, patients that do not meet these patient factors are more likely to simply have a transient or functional AKI, and therefore have a higher threshold for both a change in creatinine clearance and fluid overload in order to be considered at high risk for severe AKI.
The RAI has been validated in the critical care setting as a method to predict severe AKI at day three of admission to the pediatric intensive care unit, with a negative predictive value of 92%-99% when the score is negative in the first 12 hours.10 In selected high-risk patients (RAI ≥ 8), biomarkers become even more reliable for AKI prediction (eg, injury markers have an excellent area under the receiver operating characteristic curve (AUC) of 0.97 for severe AKI prediction in this high-risk group).11 While only validated for critically ill patients, the concept of renal angina is still applicable in the complex populations managed by hospitalists who practice outside of the intensive care unit setting. Early signs of renal dysfunction (eg, rising SCr, fluid overload ≥5%) in patients with risk factors (see below) should prompt a thorough evaluation, including urinalysis, daily SCr, nephrotoxin avoidance, and tissue injury biomarkers, if available.
The risk factors for AKI are numerous and tend to potentiate one another. The most frequent predisposing comorbidities include CKD, heart failure or congenital heart diseases, transplantation (bone marrow or solid organs), and diabetes. Disease-related factors include sepsis, cardiac surgery, cardio-pulmonary bypass, mechanical ventilation, and vasopressor use. Potentially modifiable factors include hypovolemia and multiple nephrotoxic exposures. 2,3
Nephrotoxic medications are now among the most common causes of AKI in hospitalized children.12 Approximately 80% of children are exposed to at least one nephrotoxin during an inpatient admission.12 Exposure to a single nephrotoxic medication is sufficient to place a child at risk of AKI, and each additional nephrotoxin further increases the risk.12 While some drugs are routinely recognized to be nephrotoxic (eg, ibuprofen), others are commonly overlooked, notably certain antibiotics (eg, cefotaxime, ceftazidime, cefuroxime, nafcillin, and piperacillin) and anticonvulsants (eg, zonisamide).12 Furthermore, the combination of multiple nephrotoxins can potentiate the risk of AKI. For example, the combination of vancomycin and piperacillin/tazobactam increases the risk of AKI by 3.4 times compared with the combination of vancomycin with another antipseudomonal beta-lactam antibiotic.13
Adequate monitoring, including daily SCr measurements and risk awareness, are critical as nephrotoxin-associated AKI can be easily missed in the absence of routine SCr monitoring, especially since these children are typically nonoliguric12. Quality improvement efforts focused on obtaining daily SCr in patients exposed to either three or more nephrotoxins or three days of either aminoglycoside or vancomycin, even without concomitant exposure to other nephrotoxins, have shown success in decreasing both the number of nephrotoxins and the rate of nephrotoxin-associated AKI.12
While a significant injury cannot always be avoided, a mindful clinical approach and management can help to prevent some complications of AKI. An awareness of fluid status is critical, as fluid overload greater than 10% of the patient’s weight independently increases the risk of mortality in both adults and children.14 To assess the risk of AKI progression and potential failure of conservative management with diuretics, a furosemide stress test (FST) is an easy, safe, and accessible functional assessment of tubular reserve in a patient without intravascular depletion.15 A growing body of literature in adults shows that FST-responders are less likely to progress to stage 3 AKI or need renal replacement therapy than nonresponders.15 The FST is currently being investigated and standardized in children.
CONCLUSION
Research in AKI has made significant strides over the last few years. Nevertheless, many areas of research remain to be explored (eg, the impact of IV fluid type in the pediatric population, AKD characterization and impact on CKD development). AKI is common, associated with significant morbidity and mortality and, in some instances, preventable. While no targeted therapeutic options are currently under investigation, recent advances allow for better identification of high-risk patients and offer opportunities for impactful preventive approaches. Thoughtful use of nephrotoxic medications, early identification of patients at high risk for AKI, and accurate diagnosis and appropriate management of AKI are the recommended best practice.
Disclosures
The authors have nothing to disclose.
1. McGregor TL, Jones DP, Wang L, et al. Acute kidney injury incidence in noncritically ill hospitalized children, adolescents, and young adults: a retrospective observational study. Am J Kidney Dis. 2016;67(3):384-390. https://doi.org/10.1053/j.ajkd.2015.07.019.
2. Chawla LS, Bellomo R, Bihorac A, et al. Acute kidney disease and renal recovery: consensus report of the Acute Disease Quality Initiative (ADQI) 16 Workgroup. Nat Rev Nephrol. 2017;13(4):241-257. https://doi.org/10.1038/nrneph.2017.2.
3. Khwaja A. KDIGO clinical practice guidelines for acute kidney injury. Nephron Clin Pract. 2012;120(4):179-184. https://doi.org/10.1159/000339789.
4. Filho LT, Grande AJ, Colonetti T, Della ÉSP, da Rosa MI. Accuracy of neutrophil gelatinase-associated lipocalin for acute kidney injury diagnosis in children: systematic review and meta-analysis. Pediatr Nephrol. 2017;32(10):1979-1988. https://doi.org/10.1007/s00467-017-3704-6.
5. Levey AS, Inker LA. Assessment of glomerular filtration rate in health and disease: a state of the art review. Clin Pharmacol Ther. 2017;102(3):405-419. https://doi.org/10.1002/cpt.729.
6. Endre ZH, Kellum JA, Di Somma S, et al. Differential diagnosis of AKI in clinical practice by functional and damage biomarkers: workgroup statements from the tenth Acute Dialysis Quality Initiative Consensus Conference. Contrib Nephrol. 2013;182:30-44. https://doi.org/10.1159/000349964.
7. Su LJ, Li YM, Kellum JA, Peng ZY. Predictive value of cell cycle arrest biomarkers for cardiac surgery-associated acute kidney injury: a meta-analysis. Br J Anaesth. 2018;121(2):350-357. https://doi.org/10.1016/j.bja.2018.02.069.
8. Westhoff JH, Tönshoff B, Waldherr S, et al. Urinary tissue inhibitor of metalloproteinase-2 (TIMP-2) · insulin-like growth factor-binding protein 7 (IGFBP7) predicts adverse outcome in pediatric acute kidney injury. PLoS One. 2015;10(11):1-16. https://doi.org/10.1371/journal.pone.0143628.
9. Berg UB, Nyman U, Bäck R, et al. New standardized cystatin C and creatinine GFR equations in children validated with inulin clearance. Pediatr Nephrol. 2015;30(8):1317-1326. https://doi.org/10.1007/s00467-015-3060-3.
10. Chawla LS, Goldstein SL, Kellum JA, Ronco C. Renal angina: concept and development of pretest probability assessment in acute kidney injury. Crit Care. 2015;19(1):93. https://doi.org/10.1186/s13054-015-0779-y.
11. Menon S, Goldstein SL, Mottes T, et al. Urinary biomarker incorporation into the renal angina index early in intensive care unit admission optimizes acute kidney injury prediction in critically ill children: a prospective cohort study. Nephrol Dial Transplant. 2016;31(4):586-594. https://doi.org/10.1093/ndt/gfv457.
12. Goldstein SL, Mottes T, Simpson K, et al. A sustained quality improvement program reduces nephrotoxic medication-associated acute kidney injury. Kidney Int. 2016;90(1):212-221. https://doi.org/10.1016/j.kint.2016.03.031.
13. Downes KJ, Cowden C, Laskin BL, et al. Association of acute kidney injury with concomitant vancomycin and piperacillin/tazobactam treatment among hospitalized children. JAMA Pediatr. 2017;19146:e173219-e173219. https://doi.org/10.1001/JAMAPEDIATRICS.2017.3219.
14. Naipaul A, Jefferson LS, Goldstein SL, Loftis LL, Zappitelli M, Arikan AA. Fluid overload is associated with impaired oxygenation and morbidity in critically ill children*. Pediatr Crit Care Med. 2011;13(3):253-258. https://doi.org/10.1097/pcc.0b013e31822882a3.
15. Lumlertgul N, Peerapornratana S, Trakarnvanich T, et al. Early versus standard initiation of renal replacement therapy in furosemide stress test non-responsive acute kidney injury patients (the FST trial). Crit Care. 2018;22(1):1-9. https://doi.org/10.1186/s13054-018-2021-1.
Acute kidney injury (AKI) occurs in 5%-30% of noncritically ill hospitalized children.1 Initially thought to be simply a symptom of more severe pathologies, it is now recognized that AKI independently increases mortality and is associated with the development of chronic kidney disease (CKD), even in children.2 The wide acceptance of the Kidney Disease Improving Global Outcome (KDIGO) diagnostic criteria has enabled a more uniform definition of AKI from both clinical and research perspectives.2 A better understanding of the pathophysiology and risk factors for AKI has led to new methods for early detection and prevention efforts. While serum creatinine (SCr) was historically one of the sole markers of AKI, novel biomarkers can facilitate earlier diagnosis of AKI, identify subclinical AKI, and guide clinical management. This clinical practice update addresses the latest clinical advances in risk assessment, diagnosis, and prevention of pediatric AKI, with a focus on AKI biomarkers.
DIAGNOSIS, BIOMARKERS, AND DEFINITION
Several sets of criteria have been used to diagnose AKI. The KDIGO classification, based on a systematic review of the literature and developed through expert consensus, is the current recommended definition.3 Increasing AKI stage, as defined by the KDIGO classification, is associated with increased mortality, the need for renal replacement therapy, length of stay, and CKD, thus underscoring the importance of accurate classification.3 Stage 1 AKI is defined by a rise in SCr of ≥0.3 mg/dL,1.5-1.9 times the baseline SCr, or urine output <0.5 ml/kg/h for six to 12 hours; stage 2 by a rise of ≥2.0-2.9 times the baseline SCr or urine output <0.5 ml/kg/h for >12 hours; and stage 3 by a rise of ≥4.0 mg/dL, ≥three times the baseline SCr, initiation of renal replacement therapy, urine output <0.3 ml/kg/h for ≥24 hours, or anuria ≥12 hours. However, these criteria rely on SCr, which is a suboptimal marker of renal dysfunction, as it rises only once the glomerular filtration rate (GFR) has already decreased, in some cases by as much as 50%. Additionally, interpretation of SCr in the diagnosis of AKI requires a prior Scr measurement to determine the magnitude of change from the baseline value, which is often lacking in children. To mitigate this limitation, different formulas exist to estimate a baseline SCr value based on height or age, an approach that assumes patients have preexisting normal renal function.
The limitations of SCr have led to interest in identifying more accurate biomarkers of AKI. Although many candidates have been identified, we will limit our discussion to those currently available for clinical use: serum cystatin C, urine neutrophil gelatinase-associated lipocalin (NGAL), urine TIMP-2, and urine IGFBP7 (Table).4-8 While urine NGAL and cystatin C are measured individually, TIMP-2 and IGFBP7 are measured on the same panel and the product of their multiplied values is used for clinical guidance. While each of these biomarkers have good predictive accuracy for AKI when used independently, their combined use increases the accuracy of AKI diagnosis. These biomarkers can be divided into broad categories based on their utility as either functional markers or markers of injury.6 Serum cystatin C is a functional marker and as such can be used to estimate GFR more accurately than SCr.9 Comparatively, urine NGAL is a marker of renal injury, while TIMP2 and IGFBP7 are markers of renal stress. These markers are not useful in estimating GFR, but rather aid in the prediction and diagnosis of AKI (Figure). Despite the limitations of SCr, these biomarkers have yet to be incorporated into the diagnostic criteria. They have, however, helped to refine our understanding of the pathophysiology of AKI.
AKI has classically been divided into three categories based on the etiology of injury, namely prerenal azotemia, intrinsic renal disease, and postrenal causes. The discovery of new biomarkers adds nuance to the classification of AKI. Two groups of biomarkers are particularly helpful in this regard: markers of structural injury (eg, NGAL) and functional markers (eg, cystatin C). The combination of these biomarkers with SCr has refined the categories of AKI (Figure). For example, NGAL can accurately distinguish between a rise in SCr due to functional AKI, previously referred to as prerenal azotemia, and a rise in SCr due to intrinsic kidney injury. An elevation of structural injury biomarkers in the absence of a significant rise in SCr is referred to as subclinical AKI. Patients with subclinical AKI have worse outcomes than those without AKI but better outcomes than patients with AKI with elevation of both SCr and NGAL (Figure).2,6 Time to resolution of AKI further refines our ability to predict prognosis and outcomes. Transient AKI, defined as resolution within 48 hours, is associated with a better prognosis than persistent AKI. Renal dysfunction lasting more than seven days but less than 90 days is referred to as acute kidney disease (AKD). While both transient AKI and AKD represent different entities on the continuum between AKI and CKD, further research is needed to better elucidate these classifications.2
RISK STRATIFICATION
The renal angina index (RAI) identifies critically ill children at high risk for AKI. The RAI combines traditional markers of AKI, such as a change in estimated creatinine clearance and fluid overload, with patient factors, including need for ventilation, inotropic support, and history of transplantation (solid organ or bone marrow) to identify those patients who are at high risk for severe AKI. Patients identified as high risk by the patient factors component of the RAI have a much lower threshold for both a decrease in creatinine clearance and fluid overload to be considered at risk for severe AKI, as these early signs are more likely to reflect an early impending severe AKI in this high-risk group. Conversely, patients that do not meet these patient factors are more likely to simply have a transient or functional AKI, and therefore have a higher threshold for both a change in creatinine clearance and fluid overload in order to be considered at high risk for severe AKI.
The RAI has been validated in the critical care setting as a method to predict severe AKI at day three of admission to the pediatric intensive care unit, with a negative predictive value of 92%-99% when the score is negative in the first 12 hours.10 In selected high-risk patients (RAI ≥ 8), biomarkers become even more reliable for AKI prediction (eg, injury markers have an excellent area under the receiver operating characteristic curve (AUC) of 0.97 for severe AKI prediction in this high-risk group).11 While only validated for critically ill patients, the concept of renal angina is still applicable in the complex populations managed by hospitalists who practice outside of the intensive care unit setting. Early signs of renal dysfunction (eg, rising SCr, fluid overload ≥5%) in patients with risk factors (see below) should prompt a thorough evaluation, including urinalysis, daily SCr, nephrotoxin avoidance, and tissue injury biomarkers, if available.
The risk factors for AKI are numerous and tend to potentiate one another. The most frequent predisposing comorbidities include CKD, heart failure or congenital heart diseases, transplantation (bone marrow or solid organs), and diabetes. Disease-related factors include sepsis, cardiac surgery, cardio-pulmonary bypass, mechanical ventilation, and vasopressor use. Potentially modifiable factors include hypovolemia and multiple nephrotoxic exposures. 2,3
Nephrotoxic medications are now among the most common causes of AKI in hospitalized children.12 Approximately 80% of children are exposed to at least one nephrotoxin during an inpatient admission.12 Exposure to a single nephrotoxic medication is sufficient to place a child at risk of AKI, and each additional nephrotoxin further increases the risk.12 While some drugs are routinely recognized to be nephrotoxic (eg, ibuprofen), others are commonly overlooked, notably certain antibiotics (eg, cefotaxime, ceftazidime, cefuroxime, nafcillin, and piperacillin) and anticonvulsants (eg, zonisamide).12 Furthermore, the combination of multiple nephrotoxins can potentiate the risk of AKI. For example, the combination of vancomycin and piperacillin/tazobactam increases the risk of AKI by 3.4 times compared with the combination of vancomycin with another antipseudomonal beta-lactam antibiotic.13
Adequate monitoring, including daily SCr measurements and risk awareness, are critical as nephrotoxin-associated AKI can be easily missed in the absence of routine SCr monitoring, especially since these children are typically nonoliguric12. Quality improvement efforts focused on obtaining daily SCr in patients exposed to either three or more nephrotoxins or three days of either aminoglycoside or vancomycin, even without concomitant exposure to other nephrotoxins, have shown success in decreasing both the number of nephrotoxins and the rate of nephrotoxin-associated AKI.12
While a significant injury cannot always be avoided, a mindful clinical approach and management can help to prevent some complications of AKI. An awareness of fluid status is critical, as fluid overload greater than 10% of the patient’s weight independently increases the risk of mortality in both adults and children.14 To assess the risk of AKI progression and potential failure of conservative management with diuretics, a furosemide stress test (FST) is an easy, safe, and accessible functional assessment of tubular reserve in a patient without intravascular depletion.15 A growing body of literature in adults shows that FST-responders are less likely to progress to stage 3 AKI or need renal replacement therapy than nonresponders.15 The FST is currently being investigated and standardized in children.
CONCLUSION
Research in AKI has made significant strides over the last few years. Nevertheless, many areas of research remain to be explored (eg, the impact of IV fluid type in the pediatric population, AKD characterization and impact on CKD development). AKI is common, associated with significant morbidity and mortality and, in some instances, preventable. While no targeted therapeutic options are currently under investigation, recent advances allow for better identification of high-risk patients and offer opportunities for impactful preventive approaches. Thoughtful use of nephrotoxic medications, early identification of patients at high risk for AKI, and accurate diagnosis and appropriate management of AKI are the recommended best practice.
Disclosures
The authors have nothing to disclose.
1. McGregor TL, Jones DP, Wang L, et al. Acute kidney injury incidence in noncritically ill hospitalized children, adolescents, and young adults: a retrospective observational study. Am J Kidney Dis. 2016;67(3):384-390. https://doi.org/10.1053/j.ajkd.2015.07.019.
2. Chawla LS, Bellomo R, Bihorac A, et al. Acute kidney disease and renal recovery: consensus report of the Acute Disease Quality Initiative (ADQI) 16 Workgroup. Nat Rev Nephrol. 2017;13(4):241-257. https://doi.org/10.1038/nrneph.2017.2.
3. Khwaja A. KDIGO clinical practice guidelines for acute kidney injury. Nephron Clin Pract. 2012;120(4):179-184. https://doi.org/10.1159/000339789.
4. Filho LT, Grande AJ, Colonetti T, Della ÉSP, da Rosa MI. Accuracy of neutrophil gelatinase-associated lipocalin for acute kidney injury diagnosis in children: systematic review and meta-analysis. Pediatr Nephrol. 2017;32(10):1979-1988. https://doi.org/10.1007/s00467-017-3704-6.
5. Levey AS, Inker LA. Assessment of glomerular filtration rate in health and disease: a state of the art review. Clin Pharmacol Ther. 2017;102(3):405-419. https://doi.org/10.1002/cpt.729.
6. Endre ZH, Kellum JA, Di Somma S, et al. Differential diagnosis of AKI in clinical practice by functional and damage biomarkers: workgroup statements from the tenth Acute Dialysis Quality Initiative Consensus Conference. Contrib Nephrol. 2013;182:30-44. https://doi.org/10.1159/000349964.
7. Su LJ, Li YM, Kellum JA, Peng ZY. Predictive value of cell cycle arrest biomarkers for cardiac surgery-associated acute kidney injury: a meta-analysis. Br J Anaesth. 2018;121(2):350-357. https://doi.org/10.1016/j.bja.2018.02.069.
8. Westhoff JH, Tönshoff B, Waldherr S, et al. Urinary tissue inhibitor of metalloproteinase-2 (TIMP-2) · insulin-like growth factor-binding protein 7 (IGFBP7) predicts adverse outcome in pediatric acute kidney injury. PLoS One. 2015;10(11):1-16. https://doi.org/10.1371/journal.pone.0143628.
9. Berg UB, Nyman U, Bäck R, et al. New standardized cystatin C and creatinine GFR equations in children validated with inulin clearance. Pediatr Nephrol. 2015;30(8):1317-1326. https://doi.org/10.1007/s00467-015-3060-3.
10. Chawla LS, Goldstein SL, Kellum JA, Ronco C. Renal angina: concept and development of pretest probability assessment in acute kidney injury. Crit Care. 2015;19(1):93. https://doi.org/10.1186/s13054-015-0779-y.
11. Menon S, Goldstein SL, Mottes T, et al. Urinary biomarker incorporation into the renal angina index early in intensive care unit admission optimizes acute kidney injury prediction in critically ill children: a prospective cohort study. Nephrol Dial Transplant. 2016;31(4):586-594. https://doi.org/10.1093/ndt/gfv457.
12. Goldstein SL, Mottes T, Simpson K, et al. A sustained quality improvement program reduces nephrotoxic medication-associated acute kidney injury. Kidney Int. 2016;90(1):212-221. https://doi.org/10.1016/j.kint.2016.03.031.
13. Downes KJ, Cowden C, Laskin BL, et al. Association of acute kidney injury with concomitant vancomycin and piperacillin/tazobactam treatment among hospitalized children. JAMA Pediatr. 2017;19146:e173219-e173219. https://doi.org/10.1001/JAMAPEDIATRICS.2017.3219.
14. Naipaul A, Jefferson LS, Goldstein SL, Loftis LL, Zappitelli M, Arikan AA. Fluid overload is associated with impaired oxygenation and morbidity in critically ill children*. Pediatr Crit Care Med. 2011;13(3):253-258. https://doi.org/10.1097/pcc.0b013e31822882a3.
15. Lumlertgul N, Peerapornratana S, Trakarnvanich T, et al. Early versus standard initiation of renal replacement therapy in furosemide stress test non-responsive acute kidney injury patients (the FST trial). Crit Care. 2018;22(1):1-9. https://doi.org/10.1186/s13054-018-2021-1.
© 2019 Society of Hospital Medicine
Methods for Research Evidence Synthesis: The Scoping Review Approach
Research evidence synthesis involves the aggregation of available information using well-defined and transparent methods to search, summarize, and interpret a body of literature, frequently following a systematic review approach. A scoping review is a relatively new approach to evidence synthesis and differs from systematic reviews in its purpose and aims.1 The purpose of a scoping review is to provide an overview of the available research evidence without producing a summary answer to a discrete research question.2 Scoping reviews can be useful for answering broad questions, such as “What information has been presented on this topic in the literature?” and for gathering and assessing information prior to conducting a systematic review.1
In this issue of the Journal of Hospital Medicine, Fan et al. used a scoping review to identify information available in the literature on contributors to loss and theft of controlled drugs in hospitals and the safeguards that have been suggested to address these diversions.3 The authors followed Arksey and O’Malley’s framework for scoping reviews and the PRISMA-ScR (Preferred Reporting Items for Systematic reviews and Meta-Analyses extension for Scoping Reviews) checklist in reporting findings.2,4
PURPOSE OF A SCOPING REVIEW
Scoping reviews describe existing literature and other sources of information commonly include findings from a range of different study designs and methods.5 The broad scope of the collected information makes using formal meta-analytic methods difficult, if not impossible. Results of a scoping review often focus on the range of content identified, and quantitative assessment is often limited to a tally of the number of sources reporting a particular issue or recommendation. In contrast, systematic reviews commonly select the information sources by requiring specific study types, such as randomized controlled trials, and imposing quality standards, such as adequate allocation concealment, and place their emphasis on synthesizing data to address a specific research question. (Table) By focusing on specific studies, the synthesis component in a systematic review often takes the form of a meta-analysis in which the results of multiple scientific studies are combined to develop a summary conclusion, such as a common effect estimate, along with an evaluation of its heterogeneity across studies.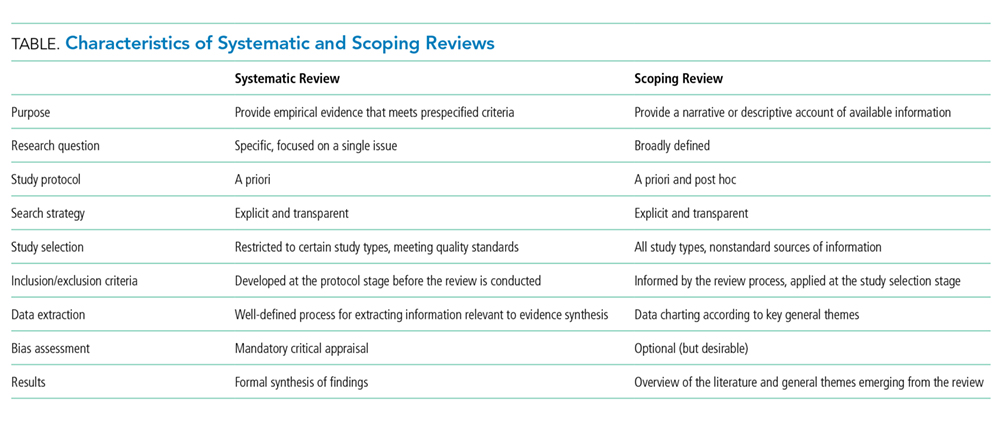
A scoping review can be a particularly useful approach when the information on a topic has not been comprehensively reviewed or is complex and diverse.6 Munn et al. proposed several objectives that can be achieved utilizing the scoping review framework, including identifying types of existing evidence in a given field, clarifying key concepts or definitions in the literature, surveying how research is conducted on a certain topic, identifying key characteristics related to a certain topic, and identifying knowledge gaps.1 When choosing to use a scoping review approach, it is important that the objective of the review align with the review’s indication or purpose.
METHODOLOGICAL FRAMEWORK OF SCOPING REVIEWS
Scoping reviews, like systematic reviews, require comprehensive and structured searches of the literature to maximize the capture of relevant information, provide reproducible results, and decrease potential bias from flawed implementations. The methodological framework for scoping reviews was developed by Arksey and O’Malley1 and further refined by Levac et al.7 and the Joanna Briggs Institute.6,8 Arksey and O’Malley’s framework for scoping reviews consists of the following six steps:
- Step 1: Identify the research question—the research question should be clearly defined and usually broad in scope to provide extensive coverage.
- Step 2: Identify relevant studies—the search strategy should be thorough and broad in scope and typically include electronic databases, reference lists, hand searches, and gray literature (ie, substantive or scholarly information that has not been formally published and often is not peer-reviewed), including conference abstracts, presentations, regulatory data, working papers, and patents.
- Step 3: Study selection—the study selection process can include post hoc, or modified, inclusion and exclusion criteria as new ideas emerge during the process of gathering and reviewing information.
- Step 4: Chart the data—the data extraction process in a scoping review is called data charting and involves the use of a data charting form to extract the relevant information from the reviewed literature.
- Step 5: Collate, summarize, and report the results—the description of the scope of the literature is commonly presented in tables and charts according to key themes.
- Optional Step 6: Consultation exercise—in this optional step, stakeholders outside the study review team are invited to provide their insights to inform and validate findings from the scoping review.
Since the number of studies included in a scoping review can be substantial, several study team members may participate in the review process. When multiple reviewers are employed, the team ought to conduct a calibration exercise at each step of the review process to ensure adequate interrater agreement. In addition, the PRISMA-ScR guidelines should be followed when reporting findings from scoping reviews to facilitate complete, transparent, and consistent reporting in the literature.4
LIMITATIONS OF THE SCOPING REVIEW APPROACH
The scoping review approach has several limitations. Scoping reviews do not formally evaluate the quality of evidence and often gather information from a wide range of study designs and methods. By design, the number of studies included in the review process can be sizable. Thus, a large study team is typically needed to screen the large number of studies and other sources for potential inclusion in the scoping review. Because scoping reviews provide a descriptive account of available information, this often leads to broad, less defined searches that require multiple structured strategies focused on alternative sets of themes. Hand searching the literature is therefore necessary to ensure the validity of this process. Scoping reviews do not provide a synthesized result or answer to a specific question, but rather provide an overview of the available literature. Even though statements regarding the quality of evidence and formal synthesis are avoided, the scoping review approach is not necessarily easier or faster than the systematic review approach. Scoping reviews require a substantial amount of time to complete due to the wide coverage of the search implicit in the approach.
Like other studies, scoping reviews are at risk for bias from different sources. Critical appraisal of the risk of bias in scoping reviews is not considered mandatory, but some scoping reviews may include a bias assessment. Even if bias is not formally assessed, that does not mean that bias does not exist. For example, selection bias may occur if the scoping review does not identify all available data on a topic and the resulting descriptive account of available information is flawed.
WHY DID THE AUTHORS USE THE SCOPING REVIEW METHOD?
Fan et al. used the scoping review approach to examine the available information on contributors to and safeguards against controlled-drug losses and theft (drug diversion) in the hospital setting.3 The authors addressed the following questions: (1) “What clinical units, health professions, or stages of the medication-use process are commonly discussed?” (2) “What are the identified contributors to diversion in hospitals?” and (3) “What safeguards to prevent or detect diversion in hospitals have been described?” Part of the rationale for using a scoping review approach was to permit the inclusion of a wide range of sources falling outside the typical peer-reviewed article. The authors comment that the stigmatized topic of drug diversion frequently falls outside the peer-reviewed literature and emphasize the importance of including such sources as conferences, news articles, and legal reports. The search strategy included electronic research databases, such as Web of Science, as well as an extensive gray literature search. Multiple reviewers were included in the process and a calibration exercise was conducted to ensure consistency in the selection of articles and to improve interrater agreement. The scoping review identified contributors to controlled-drug diversion and suggested safeguards to address them in the hospital setting.
OTHER CONSIDERATIONS
Methodological approaches to evidence synthesis vary, and new methods continue to emerge to meet different research objectives, including evidence mapping,9 concept analysis,10 rapid reviews,11 and others.12 Choosing the right approach may not be straightforward. Researchers may need to seek guidance from methodologists, including epidemiologists, statisticians, and information specialists, when choosing an appropriate review approach to ensure that the review methods are suitable for the objectives of the review.
Disclosures
The authors have no conflicts of interest to disclose.
Financial Disclosures
The authors have no financial relationships relevant to this article to disclose.
1. Munn Z, Peters M, Stern C, Tufanaru C, McArthur A, Aromataris E. Systematic review or scoping review? Guidance for authors when choosing between a systematic or scoping review approach. BMC Med Res Methodol. 2018;18:143. doi: 10.1186/s12874-018-0611-x PubMed
2. Arksey H, O’Malley L. Scoping Studies: towards a methodological framework. Int J Soc Res Methodol. 2005;8(1):19-32. doi: 10.1080/1364557032000119616
3. Fan M, Tscheng D, Hamilton M, Hyland B, Reding R, Trbovich P. Diversion of controlled drugs in hospitals: a scoping review of contributors and safeguards [published online ahead of print June 12, 2019]. J Hosp Med. 2019. doi: 10.12788/jhm.3228 PubMed
4. Tricco AC, Lillie E, Zarin W, et al. PRISMA Extension for Scoping Reviews (PRISMA-ScR): Checklist and Explanation. Ann Intern Med. 2018;169(7):467-473. doi: 10.7326/M18-0850 PubMed
5. Davis K, Drey N, Gould D. What are scoping studies? A review of the nursing literature. Int J Nurs Stud. 2009;46(10):1386-1400. doi: 10.1016/j.ijnurstu.2009.02.010. PubMed
6. Peters MD, Godfrey CM, Khalil H, McInerney P, Parker D, Soares CB. Guidance for conducting systematic scoping reviews. Int J Evid Based Healthc. 2015;13(3):141-146. doi: 10.1097/XEB.0000000000000050. PubMed
7. Levac D, Colquhoun H, O’Brien KK. Scoping studies: advancing the methodology. Implement Sci. 2010;5(1):69. doi: 10.1186/1748-5908-5-69. PubMed
8. Peters MDJ, Godfrey C, McInerney P, Baldini Soares C, Khalil H, Parker D. Scoping reviews. In: Aromataris E, Munn Z, eds. Joanna Briggs Institute Reviewer’s Manual. Adelaide, Australia: Joanna Briggs Inst; 2017. Available from https://reviewersmanual.joannabriggs.org/
9. Hetrick SE, Parker AG, Callahan P, Purcell R. Evidence mapping: illustrating an emerging methodology to improve evidence-based practice in youth mental health. J Eval Clin Pract. 2010;16(6):1025-1030. doi: 10.1111/j.1365-2753.2008.01112.x. PubMed
10. Ream E, Richardson A. Fatigue: a concept analysis. Int J Nurs Stud. 1996;33(5):519-529. doi: 10.1016/0020-7489(96)00004-1. PubMed
11. Tricco AC, Antony J, Zarin W, et al. A scoping review of rapid review methods. BMC Med. 2015;13(1):224. doi: 10.1186/s12916-015-0465-6. PubMed
12. Grant MJ, Booth A. A typology of reviews: an analysis of 14 review types and associated methodologies. Health Info Libr J. 2009;26(2):91-108. doi: 10.1111/j.1471-1842.2009.00848.x. PubMed
Research evidence synthesis involves the aggregation of available information using well-defined and transparent methods to search, summarize, and interpret a body of literature, frequently following a systematic review approach. A scoping review is a relatively new approach to evidence synthesis and differs from systematic reviews in its purpose and aims.1 The purpose of a scoping review is to provide an overview of the available research evidence without producing a summary answer to a discrete research question.2 Scoping reviews can be useful for answering broad questions, such as “What information has been presented on this topic in the literature?” and for gathering and assessing information prior to conducting a systematic review.1
In this issue of the Journal of Hospital Medicine, Fan et al. used a scoping review to identify information available in the literature on contributors to loss and theft of controlled drugs in hospitals and the safeguards that have been suggested to address these diversions.3 The authors followed Arksey and O’Malley’s framework for scoping reviews and the PRISMA-ScR (Preferred Reporting Items for Systematic reviews and Meta-Analyses extension for Scoping Reviews) checklist in reporting findings.2,4
PURPOSE OF A SCOPING REVIEW
Scoping reviews describe existing literature and other sources of information commonly include findings from a range of different study designs and methods.5 The broad scope of the collected information makes using formal meta-analytic methods difficult, if not impossible. Results of a scoping review often focus on the range of content identified, and quantitative assessment is often limited to a tally of the number of sources reporting a particular issue or recommendation. In contrast, systematic reviews commonly select the information sources by requiring specific study types, such as randomized controlled trials, and imposing quality standards, such as adequate allocation concealment, and place their emphasis on synthesizing data to address a specific research question. (Table) By focusing on specific studies, the synthesis component in a systematic review often takes the form of a meta-analysis in which the results of multiple scientific studies are combined to develop a summary conclusion, such as a common effect estimate, along with an evaluation of its heterogeneity across studies.
A scoping review can be a particularly useful approach when the information on a topic has not been comprehensively reviewed or is complex and diverse.6 Munn et al. proposed several objectives that can be achieved utilizing the scoping review framework, including identifying types of existing evidence in a given field, clarifying key concepts or definitions in the literature, surveying how research is conducted on a certain topic, identifying key characteristics related to a certain topic, and identifying knowledge gaps.1 When choosing to use a scoping review approach, it is important that the objective of the review align with the review’s indication or purpose.
METHODOLOGICAL FRAMEWORK OF SCOPING REVIEWS
Scoping reviews, like systematic reviews, require comprehensive and structured searches of the literature to maximize the capture of relevant information, provide reproducible results, and decrease potential bias from flawed implementations. The methodological framework for scoping reviews was developed by Arksey and O’Malley1 and further refined by Levac et al.7 and the Joanna Briggs Institute.6,8 Arksey and O’Malley’s framework for scoping reviews consists of the following six steps:
- Step 1: Identify the research question—the research question should be clearly defined and usually broad in scope to provide extensive coverage.
- Step 2: Identify relevant studies—the search strategy should be thorough and broad in scope and typically include electronic databases, reference lists, hand searches, and gray literature (ie, substantive or scholarly information that has not been formally published and often is not peer-reviewed), including conference abstracts, presentations, regulatory data, working papers, and patents.
- Step 3: Study selection—the study selection process can include post hoc, or modified, inclusion and exclusion criteria as new ideas emerge during the process of gathering and reviewing information.
- Step 4: Chart the data—the data extraction process in a scoping review is called data charting and involves the use of a data charting form to extract the relevant information from the reviewed literature.
- Step 5: Collate, summarize, and report the results—the description of the scope of the literature is commonly presented in tables and charts according to key themes.
- Optional Step 6: Consultation exercise—in this optional step, stakeholders outside the study review team are invited to provide their insights to inform and validate findings from the scoping review.
Since the number of studies included in a scoping review can be substantial, several study team members may participate in the review process. When multiple reviewers are employed, the team ought to conduct a calibration exercise at each step of the review process to ensure adequate interrater agreement. In addition, the PRISMA-ScR guidelines should be followed when reporting findings from scoping reviews to facilitate complete, transparent, and consistent reporting in the literature.4
LIMITATIONS OF THE SCOPING REVIEW APPROACH
The scoping review approach has several limitations. Scoping reviews do not formally evaluate the quality of evidence and often gather information from a wide range of study designs and methods. By design, the number of studies included in the review process can be sizable. Thus, a large study team is typically needed to screen the large number of studies and other sources for potential inclusion in the scoping review. Because scoping reviews provide a descriptive account of available information, this often leads to broad, less defined searches that require multiple structured strategies focused on alternative sets of themes. Hand searching the literature is therefore necessary to ensure the validity of this process. Scoping reviews do not provide a synthesized result or answer to a specific question, but rather provide an overview of the available literature. Even though statements regarding the quality of evidence and formal synthesis are avoided, the scoping review approach is not necessarily easier or faster than the systematic review approach. Scoping reviews require a substantial amount of time to complete due to the wide coverage of the search implicit in the approach.
Like other studies, scoping reviews are at risk for bias from different sources. Critical appraisal of the risk of bias in scoping reviews is not considered mandatory, but some scoping reviews may include a bias assessment. Even if bias is not formally assessed, that does not mean that bias does not exist. For example, selection bias may occur if the scoping review does not identify all available data on a topic and the resulting descriptive account of available information is flawed.
WHY DID THE AUTHORS USE THE SCOPING REVIEW METHOD?
Fan et al. used the scoping review approach to examine the available information on contributors to and safeguards against controlled-drug losses and theft (drug diversion) in the hospital setting.3 The authors addressed the following questions: (1) “What clinical units, health professions, or stages of the medication-use process are commonly discussed?” (2) “What are the identified contributors to diversion in hospitals?” and (3) “What safeguards to prevent or detect diversion in hospitals have been described?” Part of the rationale for using a scoping review approach was to permit the inclusion of a wide range of sources falling outside the typical peer-reviewed article. The authors comment that the stigmatized topic of drug diversion frequently falls outside the peer-reviewed literature and emphasize the importance of including such sources as conferences, news articles, and legal reports. The search strategy included electronic research databases, such as Web of Science, as well as an extensive gray literature search. Multiple reviewers were included in the process and a calibration exercise was conducted to ensure consistency in the selection of articles and to improve interrater agreement. The scoping review identified contributors to controlled-drug diversion and suggested safeguards to address them in the hospital setting.
OTHER CONSIDERATIONS
Methodological approaches to evidence synthesis vary, and new methods continue to emerge to meet different research objectives, including evidence mapping,9 concept analysis,10 rapid reviews,11 and others.12 Choosing the right approach may not be straightforward. Researchers may need to seek guidance from methodologists, including epidemiologists, statisticians, and information specialists, when choosing an appropriate review approach to ensure that the review methods are suitable for the objectives of the review.
Disclosures
The authors have no conflicts of interest to disclose.
Financial Disclosures
The authors have no financial relationships relevant to this article to disclose.
1. Munn Z, Peters M, Stern C, Tufanaru C, McArthur A, Aromataris E. Systematic review or scoping review? Guidance for authors when choosing between a systematic or scoping review approach. BMC Med Res Methodol. 2018;18:143. doi: 10.1186/s12874-018-0611-x PubMed
2. Arksey H, O’Malley L. Scoping Studies: towards a methodological framework. Int J Soc Res Methodol. 2005;8(1):19-32. doi: 10.1080/1364557032000119616
3. Fan M, Tscheng D, Hamilton M, Hyland B, Reding R, Trbovich P. Diversion of controlled drugs in hospitals: a scoping review of contributors and safeguards [published online ahead of print June 12, 2019]. J Hosp Med. 2019. doi: 10.12788/jhm.3228 PubMed
4. Tricco AC, Lillie E, Zarin W, et al. PRISMA Extension for Scoping Reviews (PRISMA-ScR): Checklist and Explanation. Ann Intern Med. 2018;169(7):467-473. doi: 10.7326/M18-0850 PubMed
5. Davis K, Drey N, Gould D. What are scoping studies? A review of the nursing literature. Int J Nurs Stud. 2009;46(10):1386-1400. doi: 10.1016/j.ijnurstu.2009.02.010. PubMed
6. Peters MD, Godfrey CM, Khalil H, McInerney P, Parker D, Soares CB. Guidance for conducting systematic scoping reviews. Int J Evid Based Healthc. 2015;13(3):141-146. doi: 10.1097/XEB.0000000000000050. PubMed
7. Levac D, Colquhoun H, O’Brien KK. Scoping studies: advancing the methodology. Implement Sci. 2010;5(1):69. doi: 10.1186/1748-5908-5-69. PubMed
8. Peters MDJ, Godfrey C, McInerney P, Baldini Soares C, Khalil H, Parker D. Scoping reviews. In: Aromataris E, Munn Z, eds. Joanna Briggs Institute Reviewer’s Manual. Adelaide, Australia: Joanna Briggs Inst; 2017. Available from https://reviewersmanual.joannabriggs.org/
9. Hetrick SE, Parker AG, Callahan P, Purcell R. Evidence mapping: illustrating an emerging methodology to improve evidence-based practice in youth mental health. J Eval Clin Pract. 2010;16(6):1025-1030. doi: 10.1111/j.1365-2753.2008.01112.x. PubMed
10. Ream E, Richardson A. Fatigue: a concept analysis. Int J Nurs Stud. 1996;33(5):519-529. doi: 10.1016/0020-7489(96)00004-1. PubMed
11. Tricco AC, Antony J, Zarin W, et al. A scoping review of rapid review methods. BMC Med. 2015;13(1):224. doi: 10.1186/s12916-015-0465-6. PubMed
12. Grant MJ, Booth A. A typology of reviews: an analysis of 14 review types and associated methodologies. Health Info Libr J. 2009;26(2):91-108. doi: 10.1111/j.1471-1842.2009.00848.x. PubMed
© 2019 Society of Hospital Medicine