RESULTS
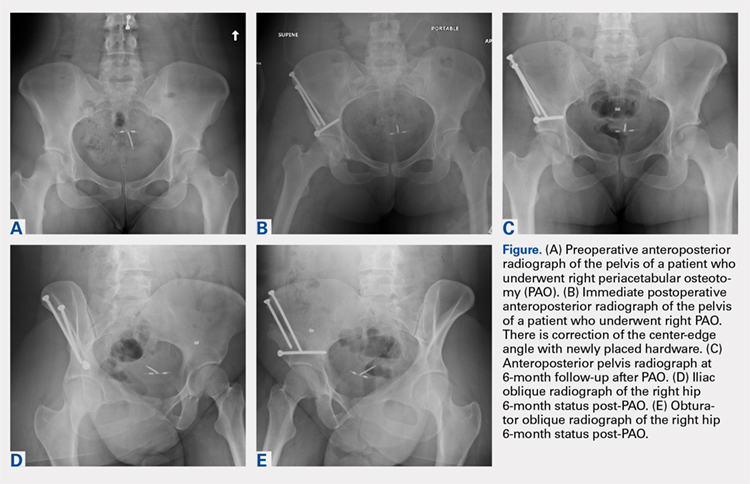
A total of 80 hips in 73 patients underwent PAO with adequate perioperative follow-up and records in the inclusion period. Figures A-E represent a patient pre-procedure, immediately post procedure, and 6 months after successful PAO. The average age was 27.5 years (12.8-43.6 years), and the average BMI was 26.8 (18.7-52.2). Four patients had diabetes, 8 were smokers, and 10 had undergone previous surgeries including arthroscopic labral débridement, 3 open reduction with Salter osteotomy, 3 open reduction with internal fixation of a femoral neck fracture, 1 core decompression for femoral head osteonecrosis, 3 subtrochanteric osteotomy and subsequent non-union treated with cephalomedullary nailing, and 1 previous PAO requiring revision.1
There were 11 perioperative complications in 10 patients (12.5%). The majority of these were infection (n = 10). Overall complications categorized by BMI are summarized in Table 1. Age was similar in patients with complications (27.4 ± 8.8 years) and those without (27.5 ± 8.2 years) (P = .99). Patients with complications had significantly higher BMI than those without (30.9.3 ± 9.5, 26.2 ± 5.6) (P = .03). There was no effect of concomitant procedures on the complication rate. Of the patients who had complications, 60% (6/10) had concomitant procedures, vs 63% (44/70) of those who had no complications (P = .86) Two of 4 patients with diabetes mellitus developed complications, both of which were wound infections. One of these required incision and débridement. There were no perioperative complications in any of the 7 smokers.
Table 1. Complications in Low- and High-BMI Patients | ||||
Complications | Total | BMI <30 | BMI >30 | |
Infection | 10 | 4 | 6 | |
Superficial | 8 | 4 | 4 | |
Deep | 2 | 0 | 2 | |
Long screw | 1 | 1 | 0 | |
Total | 13 | 5 | 6 | |
Abbreviation: BMI, body mass index.
Twenty hips were in the high-BMI (>30) and 60 were in the low-BMI (<30) patient groups. There were 6 total perioperative complications in the high-BMI group (30%) and 5 in the low-BMI group (8%). The most common complications in the low-BMI group were superficial infections.4 There were 6 total complications in the high-BMI group: 2 deep and 4 superficial infections. There were 3 reoperations (5%) in the low-BMI group during the perioperative period. Two patients underwent successful débridement and irrigation of a superficial wound, and 1 patient required removal of a prominent screw. There were 3 reoperations in the high-BMI group, all of which were débridement and irrigations for wound infections. The rate of wound dehiscence and wound infection was significantly higher in high-BMI patients (30% [6/20]) than in low-BMI patients (8.3% [4/60]) (P = .006). The mean estimated blood loss in the high-BMI group was greater at 923.75 mL vs 779.25 mL in the low-BMI patients; however, this did not reach statistical significance (P = .350). Seventy percent (14/20) of patients who were obese had concomitant procedures vs 60% (36/60) of those who had normal BMI (P = .42 by chi-square analysis). There was no difference in estimated blood loss in patients who underwent concomitant procedures (Table 2).
Table 2. Average Estimated Blood Loss (mL) | |||
Average EBL | BMI <30 | BMI >30 | |
Concomitant procedure | 765 | 759 | 779 |
No concomitant procedure | 900 | 810 | 1263 |
Total | 815 | 779 | 924 |
Abbreviations: BMI, body mass index; EBL, estimated blood loss.
Preoperative pain scores improved from 4.9 (range, 0-10) to 1.9 (range, 0-6) in the high-BMI group and 4.2 (range, 0-10) to 1.2 (range, 0-6) in the low-BMI group (P = .260). The preoperative center-edge angle in the high-BMI group improved from 6.63° ± 6.5° to 28.53° ± 6.7°, and the Tönnis angle from 24.96° ± 6.3° to 10.06° ± 7.7°. In the low-BMI group the center-edge angle improved from 10.53° ± 11.77° to 27.07° ± 13.9°, and the Tönnis angle from 19.00° ± 10.3° to 2.79° ± 8.3°. There was no difference in postoperative center-edge angle between the high-BMI and low-BMI groups (P = .66). There was a trend toward significance in the postoperative Tönnis angle between the high-BMI and low-BMI groups (P = .051).
Continue to: DISCUSSION...

