User login
Policy in Clinical Practice: Choosing Post-Acute Care in the New Decade
CLINICAL SCENARIO
A 70-year-old woman with Medicare insurance and a history of mild dementia and chronic bronchiectasis was hospitalized for acute respiratory failure due to influenza. She was treated in the intensive care unit (ICU) for 2 days, received mechanical ventilation, and was subsequently extubated and weaned to high-flow nasal cannula (HFNC) at 8 liters of oxygen per minute and noninvasive ventilation at bedtime. She had otherwise stable cognition and required no other medical or nursing therapies. For recovery, she was referred to a
BACKGROUND AND HISTORY
In 2018, 44% of hospitalized patients with fee-for-service Medicare (herein referred to as Medicare) were discharged to PAC, accounting for nearly $60 billion in annual Medicare spending.1 PAC includes four levels of care—home health agencies (HHAs), SNFs, inpatient rehabilitation facilities (IRFs), and LTACHs—which vary in intensity and complexity of the medical, skilled nursing, and rehabilitative services they provide; use separate reimbursement systems; employ different quality metrics; and have different regulatory requirements (Table 1). Because hospitalists care for the majority of these patients and commonly serve in leadership roles for transitions of care and PAC use, PAC policy is important, as it has direct implications on discharge patterns and the quality and nature of patient care after discharge.
HHAs, the most commonly used PAC setting, provide skilled nursing or therapy to homebound beneficiaries.1 HHAs were historically reimbursed a standardized 60-day episode payment based on casemix, which was highly dependent on the number of therapy visits provided, with extremely little contribution from nontherapy services, such as skilled nursing and home health aide visits.2
SNFs, which comprise nearly half of PAC spending, provide short-term skilled nursing and rehabilitative services following hospitalization. SNFs are reimbursed on a per diem basis by Medicare, with reimbursement historically determined by the intensity of the dominant service furnished to the patient—either nursing, ancillary care (which includes medications, supplies/equipment, and diagnostic testing), or rehabilitation.3 Due to strong financial incentives, payment for more than 90% of SNF days was based solely on rehabilitation therapy furnished, with 33% of SNF patients receiving ultra-high rehabilitation (>720 minutes/week),3
IRFs provide intensive rehabilitation to patients who are able to participate in at least 3 hours of multidisciplinary therapy per day.1 IRF admissions are paid a bundled rate by Medicare based on the patient’s primary reason for rehabilitation, their age, and their level of functioning and cognition.
LTACHs, the most intensive and expensive PAC setting, care for patients with a range of complex hospital-level care needs, including intravenous (IV) infusions, complex wound care, and respiratory support. Since 2002, the only requirements for LTACHs have been to meet Medicare’s requirements for hospital accreditation and maintain an average length of stay of 25 days for their population.5 LTACH stays are paid a bundled rate by Medicare based on diagnosis.
POLICIES IN CLINICAL PRACTICE
Due to considerable variation in PAC use, with concerns that similar patients can be treated in different PAC settings,6,7 the

For HHAs and SNFs, CMS implemented new payment models to better align payment with patients’ care needs rather than the provision of rehabilitation therapy.1 For SNFs, the Patient
Driven Payment Model (PDPM) was implemented October 1, 2019, and for HHAs, the Patient-Driven Groupings Model (PDGM) was implemented January 1, 2020. These policies increase payment for patients who have nursing or ancillary care needs, such as IV medications, wound care, and respiratory support. For example, the per diem payment to SNFs is projected to increase 10% to 30% for patients needing dialysis, IV medications, wound care, and respiratory support, such as tracheostomy care.8 These policies also increase payment for patients with greater severity and complexity, such as patients with severe cognitive impairment and multimorbidity. Importantly, these policies pay HHAs and SNFs based on patients’ clinical needs and not solely based on the amount of rehabilitation therapy delivered, which could increase both the number and complexity of patients that SNFs accept.
To discourage LTACH use by patients who are unlikely to benefit from this level of care, CMS fully implemented the
COMMENTARY AND RECOMMENDATIONS
Historically, PAC payment policy has not properly incentivized the appropriate amount of care to be delivered in the appropriate setting.9 The recent HHA, SNF, and LTACH policy changes not only shift the discharge of patients across PAC settings, but also change the amount and type of care that occurs at each PAC site (Table 2). The potential benefit of these new policies is that they will help to align the right level of PAC with patients’ needs by discouraging inappropriate use and unnecessary services.

In terms of broader payment reform, the four PAC settings are still fragmented, with little effort to unify payment, regulation, and quality across the PAC continuum. As required by the Improving Medicare Post-Acute Care Transformation (IMPACT) Act of 2014, we would encourage the adoption of a unified PAC payment system that spans the four settings, with payments based on patient characteristics and needs rather than site of service.12 This type of reform would also harmonize regulation and quality measurement and reward payments across settings. Currently, CMS is standardizing patient assessment data and quality metrics across the four PAC settings. Given the COVID-19 pandemic, the transition to a unified PAC payment system is likely several years away.
WHAT SHOULD I TELL MY PATIENT?
For our patient who was transferred to an LTACH after referrals to SNFs were denied, PAC options now differ following these major PAC policy reforms, and SNF transfer would be an option. This is because SNFs will receive higher payment for providing respiratory support under the PDPM, and LTACHs will receive considerably lower reimbursement because the patient did not have a qualifying ICU stay or require prolonged mechanical ventilation. Furthermore, hospitals participating in accountable care organizations would achieve greater savings, given that LTACHs cost at least three times as much as SNFs for comparable diagnoses.
Instead of referring this patient to a LTACH, the care team (hospitalist, discharge navigator, and case manager) should inform and educate the patient about discharge options to SNFs for weaning from respiratory support. To help patients and caregivers choose a facility, the discharge planning team should provide data about the quality of SNFs (eg, CMS Star Ratings scores) instead of simply providing a list of names and locations.13,14
CONCLUSION
Recent major PAC policy changes will change where hospitals discharge medically complex patients and the services they will receive at these PAC settings. Historically, reduction in PAC use has been a key source for savings in alternative payment models that encourage value over volume, such as accountable care organizations and episode-based (“bundled”) payment models.15 We anticipate these PAC policy changes are a step in the right direction to further enable hospitals to achieve value by more closely aligning PAC incentives with patients’ needs.
1. Report to the Congress: Medicare Payment Policy. Medicare Payment Advisory Commision; 2020. http://www.medpac.gov/docs/default-source/reports/mar20_entirereport_sec.pdf?sfvrsn=0
2. Medicare and Medicaid Programs; CY 2020 Home Health Prospective Payment System Rate Update; Home Health Value-Based Purchasing Model; Home Heatlh Quality Reporting Requirements; and Home Infusion Therapy Requirements. Fed Regist. 2019;84(217):60478-60646. To be codified at 42 CFR Parts 409, 414, 484, and 486. https://www.govinfo.gov/content/pkg/FR-2019-11-08/pdf/2019-24026.pdf
3. Medicare Program; Prospective Payment System and Consolidated Billing for Skilled Nursing Facilities (SNF) Final Rule for FY 2019, SNF Value-Based Purchasing Program, and SNF Quality Reporting Program. Fed Regist. 2018;83(153):39162-39290. To be codified at 42 CFR Parts 411, 413, and 424. https://www.govinfo.gov/content/pkg/FR-2018-08-08/pdf/2018-16570.pdf
4. Weaver C, Mathews AW, McGinty T. How Medicare rewards copious nursing-home therapy. Wall Street Journal. Updated August 16, 2015. Accessed October 13, 2020. https://www.wsj.com/articles/how-medicare-rewards-copious-nursing-home-therapy-1439778701
5. Eskildsen MA. Long-term acute care: a review of the literature. J Am Geriatr Soc. 2007;55(5):775-779. https://doi.org/10.1111/j.1532-5415.2007.01162.x
6. Newhouse JP, Garber AM. Geographic variation in health care spending in the United States: insights from an Institute of Medicine report. JAMA. 2013;310(12):1227-1228. https://doi.org/10.1001/jama.2013.278139
7. Makam AN, Nguyen OK, Xuan L, Miller ME, Goodwin JS, Halm EA. Factors associated with variation in long-term acute care hospital vs skilled nursing facility use among hospitalized older adults. JAMA Intern Med. 2018;178(3):399-405. https://doi.org/10.1001/jamainternmed.2017.8467
8. Skilled Nursing Facilities Payment Models Research Technical Report. Acumen; 2017. https://www.cms.gov/Medicare/Medicare-Fee-for-Service-Payment/SNFPPS/Downloads/SNF_Payment_Models_Research_Technical_Report201704.pdf
9. Ackerly DC, Grabowski DC. Post-acute care reform—beyond the ACA. New Engl J Med. 2014;370(8):689-691. https://doi.org/10.1056/NEJMp1315350
10. Span P. A change in Medicare has therapists alarmed. New York Times. November 29, 2019. Accessed September 16, 2020. https://www.nytimes.com/2019/11/29/health/new-old-age-medicare-physical-therapy.html
11. Graham J. Why home health care is suddenly harder to come by for Medicare patients. Kaiser Health News (KHN). February 3, 2020. Accessed September 16, 2020. https://khn.org/news/why-home-health-care-is-suddenly-harder-to-come-by-for-medicare-patients/
12. Medicare Payment Advisory Commision. Implementing a unified payment system for post-acute care. In: Report to the Congress: Medicare and the Health Care Delivery System. Medicare Payment Advisory Commision; 2017:chap 1. http://www.medpac.gov/docs/default-source/reports/jun17_ch1.pdf?sfvrsn=0
13. Nazir A, Little MO, Arling GW. More than just location: helping patients and families select an appropriate skilled nursing facility. Ann Long Term Care: Clin Care Aging. 2014;22(11):30-34. Published online August 12, 2014. https://www.managedhealthcareconnect.com/articles/more-just-location-helping-patients-and-families-select-appropriate-skilled-nursing
14. Tyler DA, Gadbois EA, McHugh JP, Shield RR, Winblad U, Mor V. Patients are not given quality-of-care data about skilled nursing facilities when discharged from hospitals. Health Aff (Millwood). 2017;36(8):1385-1391. https://doi.org/10.1377/hlthaff.2017.0155
15. Barnett ML, Mehrotra A, Grabowski DC. Postacute care—the piggy bank for savings in alternative payment models? New Engl J Med. 2019;381(4):302-303. https://doi.org/10.1056/NEJMp1901896
CLINICAL SCENARIO
A 70-year-old woman with Medicare insurance and a history of mild dementia and chronic bronchiectasis was hospitalized for acute respiratory failure due to influenza. She was treated in the intensive care unit (ICU) for 2 days, received mechanical ventilation, and was subsequently extubated and weaned to high-flow nasal cannula (HFNC) at 8 liters of oxygen per minute and noninvasive ventilation at bedtime. She had otherwise stable cognition and required no other medical or nursing therapies. For recovery, she was referred to a
BACKGROUND AND HISTORY
In 2018, 44% of hospitalized patients with fee-for-service Medicare (herein referred to as Medicare) were discharged to PAC, accounting for nearly $60 billion in annual Medicare spending.1 PAC includes four levels of care—home health agencies (HHAs), SNFs, inpatient rehabilitation facilities (IRFs), and LTACHs—which vary in intensity and complexity of the medical, skilled nursing, and rehabilitative services they provide; use separate reimbursement systems; employ different quality metrics; and have different regulatory requirements (Table 1). Because hospitalists care for the majority of these patients and commonly serve in leadership roles for transitions of care and PAC use, PAC policy is important, as it has direct implications on discharge patterns and the quality and nature of patient care after discharge.
HHAs, the most commonly used PAC setting, provide skilled nursing or therapy to homebound beneficiaries.1 HHAs were historically reimbursed a standardized 60-day episode payment based on casemix, which was highly dependent on the number of therapy visits provided, with extremely little contribution from nontherapy services, such as skilled nursing and home health aide visits.2
SNFs, which comprise nearly half of PAC spending, provide short-term skilled nursing and rehabilitative services following hospitalization. SNFs are reimbursed on a per diem basis by Medicare, with reimbursement historically determined by the intensity of the dominant service furnished to the patient—either nursing, ancillary care (which includes medications, supplies/equipment, and diagnostic testing), or rehabilitation.3 Due to strong financial incentives, payment for more than 90% of SNF days was based solely on rehabilitation therapy furnished, with 33% of SNF patients receiving ultra-high rehabilitation (>720 minutes/week),3
IRFs provide intensive rehabilitation to patients who are able to participate in at least 3 hours of multidisciplinary therapy per day.1 IRF admissions are paid a bundled rate by Medicare based on the patient’s primary reason for rehabilitation, their age, and their level of functioning and cognition.
LTACHs, the most intensive and expensive PAC setting, care for patients with a range of complex hospital-level care needs, including intravenous (IV) infusions, complex wound care, and respiratory support. Since 2002, the only requirements for LTACHs have been to meet Medicare’s requirements for hospital accreditation and maintain an average length of stay of 25 days for their population.5 LTACH stays are paid a bundled rate by Medicare based on diagnosis.
POLICIES IN CLINICAL PRACTICE
Due to considerable variation in PAC use, with concerns that similar patients can be treated in different PAC settings,6,7 the
For HHAs and SNFs, CMS implemented new payment models to better align payment with patients’ care needs rather than the provision of rehabilitation therapy.1 For SNFs, the Patient
Driven Payment Model (PDPM) was implemented October 1, 2019, and for HHAs, the Patient-Driven Groupings Model (PDGM) was implemented January 1, 2020. These policies increase payment for patients who have nursing or ancillary care needs, such as IV medications, wound care, and respiratory support. For example, the per diem payment to SNFs is projected to increase 10% to 30% for patients needing dialysis, IV medications, wound care, and respiratory support, such as tracheostomy care.8 These policies also increase payment for patients with greater severity and complexity, such as patients with severe cognitive impairment and multimorbidity. Importantly, these policies pay HHAs and SNFs based on patients’ clinical needs and not solely based on the amount of rehabilitation therapy delivered, which could increase both the number and complexity of patients that SNFs accept.
To discourage LTACH use by patients who are unlikely to benefit from this level of care, CMS fully implemented the
COMMENTARY AND RECOMMENDATIONS
Historically, PAC payment policy has not properly incentivized the appropriate amount of care to be delivered in the appropriate setting.9 The recent HHA, SNF, and LTACH policy changes not only shift the discharge of patients across PAC settings, but also change the amount and type of care that occurs at each PAC site (Table 2). The potential benefit of these new policies is that they will help to align the right level of PAC with patients’ needs by discouraging inappropriate use and unnecessary services.
In terms of broader payment reform, the four PAC settings are still fragmented, with little effort to unify payment, regulation, and quality across the PAC continuum. As required by the Improving Medicare Post-Acute Care Transformation (IMPACT) Act of 2014, we would encourage the adoption of a unified PAC payment system that spans the four settings, with payments based on patient characteristics and needs rather than site of service.12 This type of reform would also harmonize regulation and quality measurement and reward payments across settings. Currently, CMS is standardizing patient assessment data and quality metrics across the four PAC settings. Given the COVID-19 pandemic, the transition to a unified PAC payment system is likely several years away.
WHAT SHOULD I TELL MY PATIENT?
For our patient who was transferred to an LTACH after referrals to SNFs were denied, PAC options now differ following these major PAC policy reforms, and SNF transfer would be an option. This is because SNFs will receive higher payment for providing respiratory support under the PDPM, and LTACHs will receive considerably lower reimbursement because the patient did not have a qualifying ICU stay or require prolonged mechanical ventilation. Furthermore, hospitals participating in accountable care organizations would achieve greater savings, given that LTACHs cost at least three times as much as SNFs for comparable diagnoses.
Instead of referring this patient to a LTACH, the care team (hospitalist, discharge navigator, and case manager) should inform and educate the patient about discharge options to SNFs for weaning from respiratory support. To help patients and caregivers choose a facility, the discharge planning team should provide data about the quality of SNFs (eg, CMS Star Ratings scores) instead of simply providing a list of names and locations.13,14
CONCLUSION
Recent major PAC policy changes will change where hospitals discharge medically complex patients and the services they will receive at these PAC settings. Historically, reduction in PAC use has been a key source for savings in alternative payment models that encourage value over volume, such as accountable care organizations and episode-based (“bundled”) payment models.15 We anticipate these PAC policy changes are a step in the right direction to further enable hospitals to achieve value by more closely aligning PAC incentives with patients’ needs.
1. Report to the Congress: Medicare Payment Policy. Medicare Payment Advisory Commision; 2020. http://www.medpac.gov/docs/default-source/reports/mar20_entirereport_sec.pdf?sfvrsn=0
2. Medicare and Medicaid Programs; CY 2020 Home Health Prospective Payment System Rate Update; Home Health Value-Based Purchasing Model; Home Heatlh Quality Reporting Requirements; and Home Infusion Therapy Requirements. Fed Regist. 2019;84(217):60478-60646. To be codified at 42 CFR Parts 409, 414, 484, and 486. https://www.govinfo.gov/content/pkg/FR-2019-11-08/pdf/2019-24026.pdf
3. Medicare Program; Prospective Payment System and Consolidated Billing for Skilled Nursing Facilities (SNF) Final Rule for FY 2019, SNF Value-Based Purchasing Program, and SNF Quality Reporting Program. Fed Regist. 2018;83(153):39162-39290. To be codified at 42 CFR Parts 411, 413, and 424. https://www.govinfo.gov/content/pkg/FR-2018-08-08/pdf/2018-16570.pdf
4. Weaver C, Mathews AW, McGinty T. How Medicare rewards copious nursing-home therapy. Wall Street Journal. Updated August 16, 2015. Accessed October 13, 2020. https://www.wsj.com/articles/how-medicare-rewards-copious-nursing-home-therapy-1439778701
5. Eskildsen MA. Long-term acute care: a review of the literature. J Am Geriatr Soc. 2007;55(5):775-779. https://doi.org/10.1111/j.1532-5415.2007.01162.x
6. Newhouse JP, Garber AM. Geographic variation in health care spending in the United States: insights from an Institute of Medicine report. JAMA. 2013;310(12):1227-1228. https://doi.org/10.1001/jama.2013.278139
7. Makam AN, Nguyen OK, Xuan L, Miller ME, Goodwin JS, Halm EA. Factors associated with variation in long-term acute care hospital vs skilled nursing facility use among hospitalized older adults. JAMA Intern Med. 2018;178(3):399-405. https://doi.org/10.1001/jamainternmed.2017.8467
8. Skilled Nursing Facilities Payment Models Research Technical Report. Acumen; 2017. https://www.cms.gov/Medicare/Medicare-Fee-for-Service-Payment/SNFPPS/Downloads/SNF_Payment_Models_Research_Technical_Report201704.pdf
9. Ackerly DC, Grabowski DC. Post-acute care reform—beyond the ACA. New Engl J Med. 2014;370(8):689-691. https://doi.org/10.1056/NEJMp1315350
10. Span P. A change in Medicare has therapists alarmed. New York Times. November 29, 2019. Accessed September 16, 2020. https://www.nytimes.com/2019/11/29/health/new-old-age-medicare-physical-therapy.html
11. Graham J. Why home health care is suddenly harder to come by for Medicare patients. Kaiser Health News (KHN). February 3, 2020. Accessed September 16, 2020. https://khn.org/news/why-home-health-care-is-suddenly-harder-to-come-by-for-medicare-patients/
12. Medicare Payment Advisory Commision. Implementing a unified payment system for post-acute care. In: Report to the Congress: Medicare and the Health Care Delivery System. Medicare Payment Advisory Commision; 2017:chap 1. http://www.medpac.gov/docs/default-source/reports/jun17_ch1.pdf?sfvrsn=0
13. Nazir A, Little MO, Arling GW. More than just location: helping patients and families select an appropriate skilled nursing facility. Ann Long Term Care: Clin Care Aging. 2014;22(11):30-34. Published online August 12, 2014. https://www.managedhealthcareconnect.com/articles/more-just-location-helping-patients-and-families-select-appropriate-skilled-nursing
14. Tyler DA, Gadbois EA, McHugh JP, Shield RR, Winblad U, Mor V. Patients are not given quality-of-care data about skilled nursing facilities when discharged from hospitals. Health Aff (Millwood). 2017;36(8):1385-1391. https://doi.org/10.1377/hlthaff.2017.0155
15. Barnett ML, Mehrotra A, Grabowski DC. Postacute care—the piggy bank for savings in alternative payment models? New Engl J Med. 2019;381(4):302-303. https://doi.org/10.1056/NEJMp1901896
© 2021 Society of Hospital Medicine
Improving Respiratory Rate Accuracy in the Hospital: A Quality Improvement Initiative
Respiratory rate (RR) is an essential vital sign that is routinely measured for hospitalized adults. It is a strong predictor of adverse events.1,2 Therefore, RR is a key component of several widely used risk prediction scores, including the systemic inflammatory response syndrome (SIRS).3
Despite its clinical utility, RR is inaccurately measured.4-7 One reason for the inaccurate measurement of RR is that RR measurement, in contrast to that of other vital signs, is not automated. The gold-standard technique for measuring RR is the visual assessment of a resting patient. Thus, RR measurement is perceived as time-consuming. Clinical staff instead frequently approximate RR through brief observation.8-11
Given its clinical importance and widespread inaccuracy, we conducted a quality improvement (QI) initiative to improve RR accuracy.
METHODS
Design and Setting
We conducted an interdisciplinary QI initiative by using the plan–do–study–act (PDSA) methodology from July 2017 to February 2018. The initiative was set in a single adult 28-bed medical inpatient unit of a large, urban, safety-net hospital consisting of general internal medicine and hematology/oncology patients. Routine vital sign measurements on this unit occur at four- or six-hour intervals per physician orders and are performed by patient-care assistants (PCAs) who are nonregistered nursing support staff. PCAs use a vital signs cart equipped with automated tools to measure vital signs except for RR, which is manually assessed. PCAs are trained on vital sign measurements during a two-day onboarding orientation and four to six weeks of on-the-job training by experienced PCAs. PCAs are directly supervised by nursing operations managers. Formal continuing education programs for PCAs or performance audits of their clinical duties did not exist prior to our QI initiative.
Intervention
Intervention development addressing several important barriers and workflow inefficiencies was based on the direct observation of PCA workflow and information gathering by engaging stakeholders, including PCAs, nursing operations management, nursing leadership, and hospital administration (PDSA cycles 1-7 in Table). Our modified PCA vital sign workflow incorporated RR measurement during the approximate 30 seconds needed to complete automated blood pressure measurement as previously described.12 Nursing administration purchased three stopwatches (each $5 US) to attach to vital signs carts. One investigator (NK) participated in two monthly one-hour meetings, and three investigators (NK, KB, and SD) participated in 19 daily 15-minute huddles to conduct stakeholder engagement and educate and retrain PCAs on proper technique (total of 6.75 hours).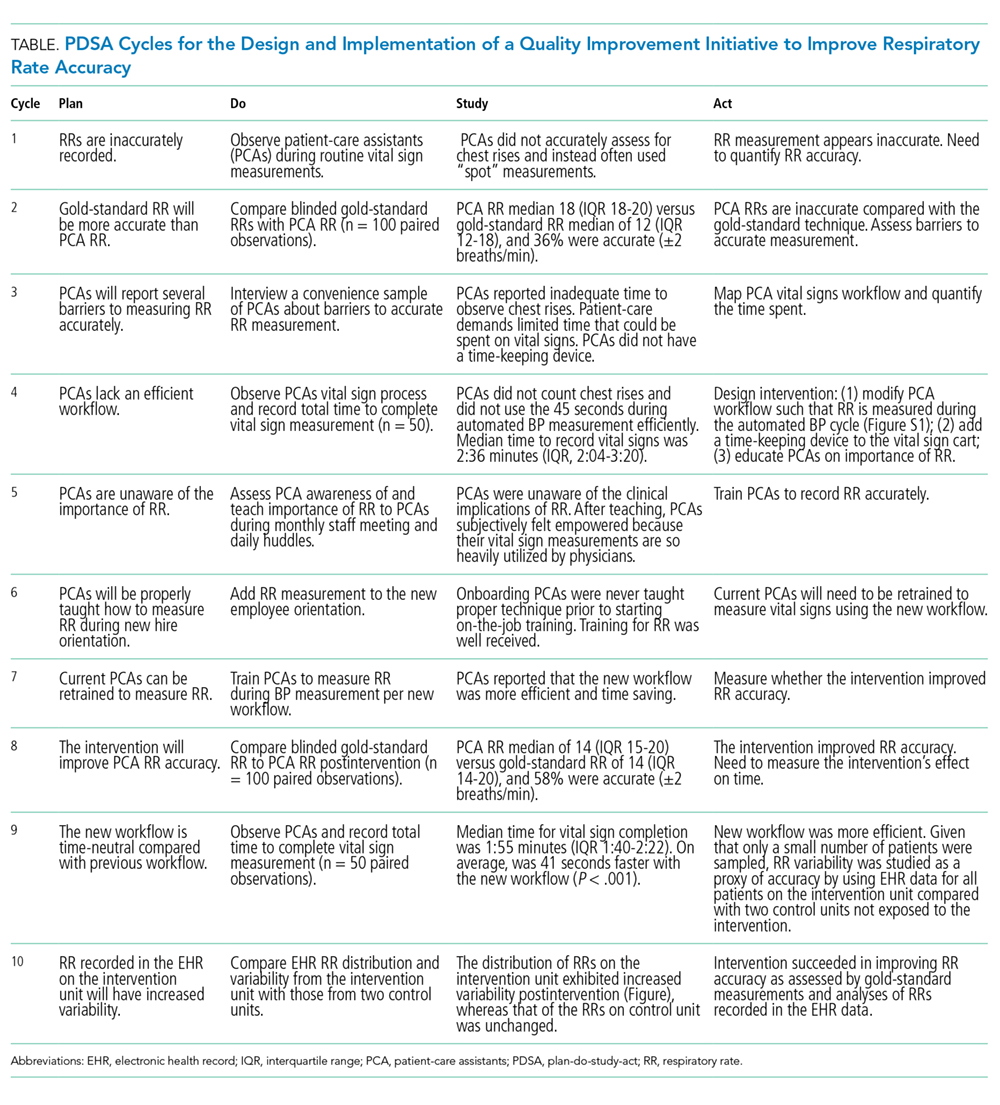
Evaluation
The primary aim of this QI initiative was to improve RR accuracy, which was evaluated using two distinct but complementary analyses: the prospective comparison of PCA-recorded RRs with gold-standard recorded RRs and the retrospective comparison of RRs recorded in electronic health records (EHR) on the intervention unit versus two control units. The secondary aims were to examine time to complete vital sign measurement and to assess whether the intervention was associated with a reduction in the incidence of SIRS specifically due to tachypnea.
Respiratory Rate Accuracy
PCA-recorded RRs were considered accurate if the RR was within ±2 breaths of a gold-standard RR measurement performed by a trained study member (NK or KB). We conducted gold-standard RR measurements for 100 observations pre- and postintervention within 30 minutes of PCA measurement to avoid Hawthorne bias.
We assessed the variability of recorded RRs in the EHR for all patients in the intervention unit as a proxy for accuracy. We hypothesized on the basis of prior research that improving the accuracy of RR measurement would increase the variability and normality of distribution in RRs.13 This is an approach that we have employed previously.7 The EHR cohort included consecutive hospitalizations by patients who were admitted to either the intervention unit or to one of two nonintervention general medicine inpatient units that served as concurrent controls. We grouped hospitalizations into a preintervention phase from March 1, 2017-July 22, 2017, a planning phase from July 23, 2017-December 3, 2017, and a postintervention phase from December 21, 2017-February 28, 2018. Hospitalizations during the two-week teaching phase from December 3, 2017-December 21, 2017 were excluded. We excluded vital signs obtained in the emergency department or in a location different from the patient’s admission unit. We qualitatively assessed RR distribution using histograms as we have done previously.7
We examined the distributions of RRs recorded in the EHR before and after intervention by individual PCAs on the intervention floor to assess for fidelity and adherence in the PCA uptake of the intervention.
Time
We compared the time to complete vital sign measurement among convenience samples of 50 unique observations pre- and postintervention using the Wilcoxon rank sum test.
SIRS Incidence
Since we hypothesized that improved RR accuracy would reduce falsely elevated RRs but have no impact on the other three SIRS criteria, we assessed changes in tachypnea-specific SIRS incidence, which was defined a priori as the presence of exactly two concurrent SIRS criteria, one of which was an elevated RR.3 We examined changes using a difference-in-differences approach with three different units of analysis (per vital sign measurement, hospital-day, and hospitalization; see footnote for Appendix Table 1 for methodological details. All analyses were conducted using STATA 12.0 (StataCorp, College Station, Texas).
RESULTS
Respiratory Rate Accuracy
Prior to the intervention, the median PCA RR was 18 (IQR 18-20) versus 12 (IQR 12-18) for the gold-standard RR (Appendix Figure 1), with only 36% of PCA measurements considered accurate. After the intervention, the median PCA-recorded RR was 14 (IQR 15-20) versus 14 (IQR 14-20) for the gold-standard RR and a RR accuracy of 58% (P < .001).
For our analyses on RR distribution using EHR data, we included 143,447 unique RRs (Appendix Table 2). After the intervention, the normality of the distribution of RRs on the intervention unit had increased, whereas those of RRs on the control units remained qualitatively similar pre- and postintervention (Appendix Figure 2).
Notable differences existed among the 11 individual PCAs (Figure) despite observing increased variability in PCA-recorded RRs postintervention. Some PCAs (numbers 2, 7, and 10) shifted their narrow RR interquartile range lower by several breaths/minute, whereas most other PCAs had a reduced median RR and widened interquartile range.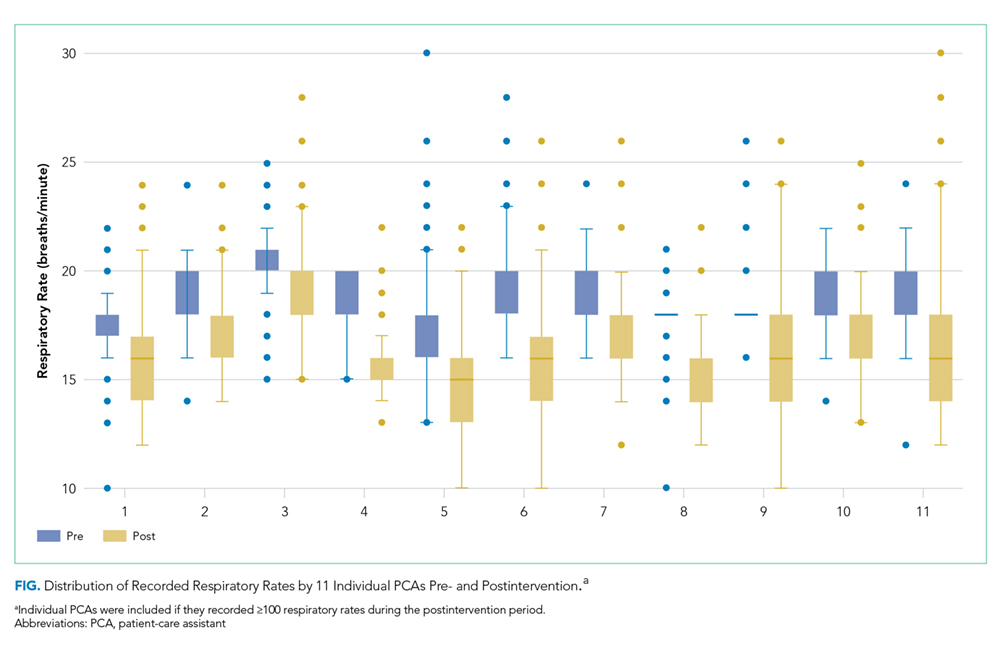
Time
Before the intervention, the median time to complete vital sign measurements was 2:36 (IQR 2:04-3:20). After the intervention, the time to complete vital signs decreased to 1:55 (IQR, 1:40-2:22; P < .001), which was 41 less seconds on average per vital sign set.
SIRS Incidence
The intervention was associated with a 3.3% reduction (95% CI, –6.4% to –0.005%) in tachypnea-specific SIRS incidence per hospital-day and a 7.8% reduction (95% CI, –13.5% to –2.2%) per hospitalization (Appendix Table 1). We also observed a modest reduction in overall SIRS incidence after the intervention (2.9% less per vital sign check, 4.6% less per hospital-day, and 3.2% less per hospitalization), although these reductions were not statistically significant.
DISCUSSION
Our QI initiative improved the absolute RR accuracy by 22%, saved PCAs 41 seconds on average per vital sign measurement, and decreased the absolute proportion of hospitalizations with tachypnea-specific SIRS by 7.8%. Our intervention is a novel, interdisciplinary, low-cost, low-effort, low-tech approach that addressed known challenges to accurate RR measurement,8,9,11 as well as the key barriers identified in our initial PDSA cycles. Our approach includes adding a time-keeping device to vital sign carts and standardizing a PCA vital sign workflow with increased efficiency. Lastly, this intervention is potentially scalable because stakeholder engagement, education, and retraining of the entire PCA staff for the unit required only 6.75 hours.
While our primary goal was to improve RR accuracy, our QI initiative also improved vital sign efficiency. By extrapolating our findings to an eight-hour PCA shift caring for eight patients who require vital sign checks every four hours, we estimated that our intervention would save approximately 16:24 minutes per PCA shift. This newfound time could be repurposed for other patient-care tasks or could be spent ensuring the accuracy of other vital signs given that accurate monitoring may be neglected because of time constraints.11 Additionally, the improvement in RR accuracy reduced falsely elevated RRs and thus lowered SIRS incidence specifically due to tachypnea. Given that EHR-based sepsis alerts are often based on SIRS criteria, improved RR accuracy may also improve alarm fatigue by reducing the rate of false-positive alerts.14
This initiative is not without limitations. Generalizability to other hospitals and even other units within the same hospital is uncertain. However, because this initiative was conducted within a safety-net hospital, we anticipate at least similar, if not increased, success in better-resourced hospitals. Second, the long-term durability of our intervention is unclear, although EHR RR variability remained steady for two months after our intervention (data not shown).
To ensure long-term sustainability and further improve RR accuracy, future PDSA cycles could include electing a PCA “vital signs champion” to reiterate the importance of RRs in clinical decision-making and ensure adherence to the modified workflow. Nursing champions act as persuasive change agents that disseminate and implement healthcare change,15 which may also be true of PCA champions. Additionally, future PDSA cycles can obviate the need for labor-intensive manual audits by leveraging EHR-based auditing to target education and retraining interventions to PCAs with minimal RR variability to optimize workflow adherence.
In conclusion, through a multipronged QI initiative we improved RR accuracy, increased the efficiency of vital sign measurement, and decreased SIRS incidence specifically due to tachypnea by reducing the number of falsely elevated RRs. This novel, low-cost, low-effort, low-tech approach can readily be implemented and disseminated in hospital inpatient settings.
Acknowledgments
The authors would like to acknowledge the meaningful contributions of Mr. Sudarshaan Pathak, RN, Ms. Shirly Koduvathu, RN, and Ms. Judy Herrington MSN, RN in this multidisciplinary initiative. We thank Mr. Christopher McKintosh, RN for his support in data acquisition. Lastly, the authors would like to acknowledge all of the patient-care assistants involved in this QI initiative.
Disclosures
Dr. Makam reports grants from NIA/NIH, during the conduct of the study. All other authors have nothing to disclose.
Funding
This work is supported in part by the Agency for Healthcare Research and Quality-funded UT Southwestern Center for Patient-Centered Outcomes Research (R24HS022418). OKN is funded by the National Heart, Lung, and Blood Institute (K23HL133441), and ANM is funded by the National Institute on Aging (K23AG052603).
1. Fieselmann JF, Hendryx MS, Helms CM, Wakefield DS. Respiratory rate predicts cardiopulmonary arrest for internal medicine inpatients. J Gen Intern Med. 1993;8(7):354-360. https://doi.org/10.1007/BF02600071.
2. Hodgetts TJ, Kenward G, Vlachonikolis IG, Payne S, Castle N. The identification of risk factors for cardiac arrest and formulation of activation criteria to alert a medical emergency team. Resuscitation. 2002;54(2):125-131. https://doi.org/10.1016/S0300-9572(02)00100-4.
3. Bone RC, Sibbald WJ, Sprung CL. The ACCP-SCCM consensus conference on sepsis and organ failure. Chest. 1992;101(6):1481-1483.
4. Lovett PB, Buchwald JM, Sturmann K, Bijur P. The vexatious vital: neither clinical measurements by nurses nor an electronic monitor provides accurate measurements of respiratory rate in triage. Ann Emerg Med. 2005;45(1):68-76. https://doi.org/10.1016/j.annemergmed.2004.06.016.
5. Chen J, Hillman K, Bellomo R, et al. The impact of introducing medical emergency team system on the documentations of vital signs. Resuscitation. 2009;80(1):35-43. https://doi.org/10.1016/j.resuscitation.2008.10.009.
6. Leuvan CH, Mitchell I. Missed opportunities? An observational study of vital sign measurements. Crit Care Resusc. 2008;10(2):111-115.
7. Badawy J, Nguyen OK, Clark C, Halm EA, Makam AN. Is everyone really breathing 20 times a minute? Assessing epidemiology and variation in recorded respiratory rate in hospitalised adults. BMJ Qual Saf. 2017;26(10):832-836. https://doi.org/10.1136/bmjqs-2017-006671.
8. Chua WL, Mackey S, Ng EK, Liaw SY. Front line nurses’ experiences with deteriorating ward patients: a qualitative study. Int Nurs Rev. 2013;60(4):501-509. https://doi.org/10.1111/inr.12061.
9. De Meester K, Van Bogaert P, Clarke SP, Bossaert L. In-hospital mortality after serious adverse events on medical and surgical nursing units: a mixed methods study. J Clin Nurs. 2013;22(15-16):2308-2317. https://doi.org/10.1111/j.1365-2702.2012.04154.x.
10. Cheng AC, Black JF, Buising KL. Respiratory rate: the neglected vital sign. Med J Aust. 2008;189(9):531. https://doi.org/10.5694/j.1326-5377.2008.tb02163.x.
11. Mok W, Wang W, Cooper S, Ang EN, Liaw SY. Attitudes towards vital signs monitoring in the detection of clinical deterioration: scale development and survey of ward nurses. Int J Qual Health Care. 2015;27(3):207-213. https://doi.org/10.1093/intqhc/mzv019.
12. Keshvani N, Berger K, Nguyen OK, Makam AN. Roadmap for improving the accuracy of respiratory rate measurements. BMJ Qual Saf. 2018;27(8):e5. https://doi.org/10.1136/bmjqs-2017-007516.
13. Semler MW, Stover DG, Copland AP, et al. Flash mob research: a single-day, multicenter, resident-directed study of respiratory rate. Chest. 2013;143(6):1740-1744. https://doi.org/10.1378/chest.12-1837.
14. Makam AN, Nguyen OK, Auerbach AD. Diagnostic accuracy and effectiveness of automated electronic sepsis alert systems: a systematic review. J Hosp Med. 2015;10(6):396-402. https://doi.org/10.1002/jhm.2347.
15. Ploeg J, Skelly J, Rowan M, et al. The role of nursing best practice champions in diffusing practice guidelines: a mixed methods study. Worldviews Evid Based Nurs. 2010;7(4):238-251. https://doi.org/10.1111/j.1741-6787.2010.00202.x.
Respiratory rate (RR) is an essential vital sign that is routinely measured for hospitalized adults. It is a strong predictor of adverse events.1,2 Therefore, RR is a key component of several widely used risk prediction scores, including the systemic inflammatory response syndrome (SIRS).3
Despite its clinical utility, RR is inaccurately measured.4-7 One reason for the inaccurate measurement of RR is that RR measurement, in contrast to that of other vital signs, is not automated. The gold-standard technique for measuring RR is the visual assessment of a resting patient. Thus, RR measurement is perceived as time-consuming. Clinical staff instead frequently approximate RR through brief observation.8-11
Given its clinical importance and widespread inaccuracy, we conducted a quality improvement (QI) initiative to improve RR accuracy.
METHODS
Design and Setting
We conducted an interdisciplinary QI initiative by using the plan–do–study–act (PDSA) methodology from July 2017 to February 2018. The initiative was set in a single adult 28-bed medical inpatient unit of a large, urban, safety-net hospital consisting of general internal medicine and hematology/oncology patients. Routine vital sign measurements on this unit occur at four- or six-hour intervals per physician orders and are performed by patient-care assistants (PCAs) who are nonregistered nursing support staff. PCAs use a vital signs cart equipped with automated tools to measure vital signs except for RR, which is manually assessed. PCAs are trained on vital sign measurements during a two-day onboarding orientation and four to six weeks of on-the-job training by experienced PCAs. PCAs are directly supervised by nursing operations managers. Formal continuing education programs for PCAs or performance audits of their clinical duties did not exist prior to our QI initiative.
Intervention
Intervention development addressing several important barriers and workflow inefficiencies was based on the direct observation of PCA workflow and information gathering by engaging stakeholders, including PCAs, nursing operations management, nursing leadership, and hospital administration (PDSA cycles 1-7 in Table). Our modified PCA vital sign workflow incorporated RR measurement during the approximate 30 seconds needed to complete automated blood pressure measurement as previously described.12 Nursing administration purchased three stopwatches (each $5 US) to attach to vital signs carts. One investigator (NK) participated in two monthly one-hour meetings, and three investigators (NK, KB, and SD) participated in 19 daily 15-minute huddles to conduct stakeholder engagement and educate and retrain PCAs on proper technique (total of 6.75 hours).
Evaluation
The primary aim of this QI initiative was to improve RR accuracy, which was evaluated using two distinct but complementary analyses: the prospective comparison of PCA-recorded RRs with gold-standard recorded RRs and the retrospective comparison of RRs recorded in electronic health records (EHR) on the intervention unit versus two control units. The secondary aims were to examine time to complete vital sign measurement and to assess whether the intervention was associated with a reduction in the incidence of SIRS specifically due to tachypnea.
Respiratory Rate Accuracy
PCA-recorded RRs were considered accurate if the RR was within ±2 breaths of a gold-standard RR measurement performed by a trained study member (NK or KB). We conducted gold-standard RR measurements for 100 observations pre- and postintervention within 30 minutes of PCA measurement to avoid Hawthorne bias.
We assessed the variability of recorded RRs in the EHR for all patients in the intervention unit as a proxy for accuracy. We hypothesized on the basis of prior research that improving the accuracy of RR measurement would increase the variability and normality of distribution in RRs.13 This is an approach that we have employed previously.7 The EHR cohort included consecutive hospitalizations by patients who were admitted to either the intervention unit or to one of two nonintervention general medicine inpatient units that served as concurrent controls. We grouped hospitalizations into a preintervention phase from March 1, 2017-July 22, 2017, a planning phase from July 23, 2017-December 3, 2017, and a postintervention phase from December 21, 2017-February 28, 2018. Hospitalizations during the two-week teaching phase from December 3, 2017-December 21, 2017 were excluded. We excluded vital signs obtained in the emergency department or in a location different from the patient’s admission unit. We qualitatively assessed RR distribution using histograms as we have done previously.7
We examined the distributions of RRs recorded in the EHR before and after intervention by individual PCAs on the intervention floor to assess for fidelity and adherence in the PCA uptake of the intervention.
Time
We compared the time to complete vital sign measurement among convenience samples of 50 unique observations pre- and postintervention using the Wilcoxon rank sum test.
SIRS Incidence
Since we hypothesized that improved RR accuracy would reduce falsely elevated RRs but have no impact on the other three SIRS criteria, we assessed changes in tachypnea-specific SIRS incidence, which was defined a priori as the presence of exactly two concurrent SIRS criteria, one of which was an elevated RR.3 We examined changes using a difference-in-differences approach with three different units of analysis (per vital sign measurement, hospital-day, and hospitalization; see footnote for Appendix Table 1 for methodological details. All analyses were conducted using STATA 12.0 (StataCorp, College Station, Texas).
RESULTS
Respiratory Rate Accuracy
Prior to the intervention, the median PCA RR was 18 (IQR 18-20) versus 12 (IQR 12-18) for the gold-standard RR (Appendix Figure 1), with only 36% of PCA measurements considered accurate. After the intervention, the median PCA-recorded RR was 14 (IQR 15-20) versus 14 (IQR 14-20) for the gold-standard RR and a RR accuracy of 58% (P < .001).
For our analyses on RR distribution using EHR data, we included 143,447 unique RRs (Appendix Table 2). After the intervention, the normality of the distribution of RRs on the intervention unit had increased, whereas those of RRs on the control units remained qualitatively similar pre- and postintervention (Appendix Figure 2).
Notable differences existed among the 11 individual PCAs (Figure) despite observing increased variability in PCA-recorded RRs postintervention. Some PCAs (numbers 2, 7, and 10) shifted their narrow RR interquartile range lower by several breaths/minute, whereas most other PCAs had a reduced median RR and widened interquartile range.
Time
Before the intervention, the median time to complete vital sign measurements was 2:36 (IQR 2:04-3:20). After the intervention, the time to complete vital signs decreased to 1:55 (IQR, 1:40-2:22; P < .001), which was 41 less seconds on average per vital sign set.
SIRS Incidence
The intervention was associated with a 3.3% reduction (95% CI, –6.4% to –0.005%) in tachypnea-specific SIRS incidence per hospital-day and a 7.8% reduction (95% CI, –13.5% to –2.2%) per hospitalization (Appendix Table 1). We also observed a modest reduction in overall SIRS incidence after the intervention (2.9% less per vital sign check, 4.6% less per hospital-day, and 3.2% less per hospitalization), although these reductions were not statistically significant.
DISCUSSION
Our QI initiative improved the absolute RR accuracy by 22%, saved PCAs 41 seconds on average per vital sign measurement, and decreased the absolute proportion of hospitalizations with tachypnea-specific SIRS by 7.8%. Our intervention is a novel, interdisciplinary, low-cost, low-effort, low-tech approach that addressed known challenges to accurate RR measurement,8,9,11 as well as the key barriers identified in our initial PDSA cycles. Our approach includes adding a time-keeping device to vital sign carts and standardizing a PCA vital sign workflow with increased efficiency. Lastly, this intervention is potentially scalable because stakeholder engagement, education, and retraining of the entire PCA staff for the unit required only 6.75 hours.
While our primary goal was to improve RR accuracy, our QI initiative also improved vital sign efficiency. By extrapolating our findings to an eight-hour PCA shift caring for eight patients who require vital sign checks every four hours, we estimated that our intervention would save approximately 16:24 minutes per PCA shift. This newfound time could be repurposed for other patient-care tasks or could be spent ensuring the accuracy of other vital signs given that accurate monitoring may be neglected because of time constraints.11 Additionally, the improvement in RR accuracy reduced falsely elevated RRs and thus lowered SIRS incidence specifically due to tachypnea. Given that EHR-based sepsis alerts are often based on SIRS criteria, improved RR accuracy may also improve alarm fatigue by reducing the rate of false-positive alerts.14
This initiative is not without limitations. Generalizability to other hospitals and even other units within the same hospital is uncertain. However, because this initiative was conducted within a safety-net hospital, we anticipate at least similar, if not increased, success in better-resourced hospitals. Second, the long-term durability of our intervention is unclear, although EHR RR variability remained steady for two months after our intervention (data not shown).
To ensure long-term sustainability and further improve RR accuracy, future PDSA cycles could include electing a PCA “vital signs champion” to reiterate the importance of RRs in clinical decision-making and ensure adherence to the modified workflow. Nursing champions act as persuasive change agents that disseminate and implement healthcare change,15 which may also be true of PCA champions. Additionally, future PDSA cycles can obviate the need for labor-intensive manual audits by leveraging EHR-based auditing to target education and retraining interventions to PCAs with minimal RR variability to optimize workflow adherence.
In conclusion, through a multipronged QI initiative we improved RR accuracy, increased the efficiency of vital sign measurement, and decreased SIRS incidence specifically due to tachypnea by reducing the number of falsely elevated RRs. This novel, low-cost, low-effort, low-tech approach can readily be implemented and disseminated in hospital inpatient settings.
Acknowledgments
The authors would like to acknowledge the meaningful contributions of Mr. Sudarshaan Pathak, RN, Ms. Shirly Koduvathu, RN, and Ms. Judy Herrington MSN, RN in this multidisciplinary initiative. We thank Mr. Christopher McKintosh, RN for his support in data acquisition. Lastly, the authors would like to acknowledge all of the patient-care assistants involved in this QI initiative.
Disclosures
Dr. Makam reports grants from NIA/NIH, during the conduct of the study. All other authors have nothing to disclose.
Funding
This work is supported in part by the Agency for Healthcare Research and Quality-funded UT Southwestern Center for Patient-Centered Outcomes Research (R24HS022418). OKN is funded by the National Heart, Lung, and Blood Institute (K23HL133441), and ANM is funded by the National Institute on Aging (K23AG052603).
1. Fieselmann JF, Hendryx MS, Helms CM, Wakefield DS. Respiratory rate predicts cardiopulmonary arrest for internal medicine inpatients. J Gen Intern Med. 1993;8(7):354-360. https://doi.org/10.1007/BF02600071.
2. Hodgetts TJ, Kenward G, Vlachonikolis IG, Payne S, Castle N. The identification of risk factors for cardiac arrest and formulation of activation criteria to alert a medical emergency team. Resuscitation. 2002;54(2):125-131. https://doi.org/10.1016/S0300-9572(02)00100-4.
3. Bone RC, Sibbald WJ, Sprung CL. The ACCP-SCCM consensus conference on sepsis and organ failure. Chest. 1992;101(6):1481-1483.
4. Lovett PB, Buchwald JM, Sturmann K, Bijur P. The vexatious vital: neither clinical measurements by nurses nor an electronic monitor provides accurate measurements of respiratory rate in triage. Ann Emerg Med. 2005;45(1):68-76. https://doi.org/10.1016/j.annemergmed.2004.06.016.
5. Chen J, Hillman K, Bellomo R, et al. The impact of introducing medical emergency team system on the documentations of vital signs. Resuscitation. 2009;80(1):35-43. https://doi.org/10.1016/j.resuscitation.2008.10.009.
6. Leuvan CH, Mitchell I. Missed opportunities? An observational study of vital sign measurements. Crit Care Resusc. 2008;10(2):111-115.
7. Badawy J, Nguyen OK, Clark C, Halm EA, Makam AN. Is everyone really breathing 20 times a minute? Assessing epidemiology and variation in recorded respiratory rate in hospitalised adults. BMJ Qual Saf. 2017;26(10):832-836. https://doi.org/10.1136/bmjqs-2017-006671.
8. Chua WL, Mackey S, Ng EK, Liaw SY. Front line nurses’ experiences with deteriorating ward patients: a qualitative study. Int Nurs Rev. 2013;60(4):501-509. https://doi.org/10.1111/inr.12061.
9. De Meester K, Van Bogaert P, Clarke SP, Bossaert L. In-hospital mortality after serious adverse events on medical and surgical nursing units: a mixed methods study. J Clin Nurs. 2013;22(15-16):2308-2317. https://doi.org/10.1111/j.1365-2702.2012.04154.x.
10. Cheng AC, Black JF, Buising KL. Respiratory rate: the neglected vital sign. Med J Aust. 2008;189(9):531. https://doi.org/10.5694/j.1326-5377.2008.tb02163.x.
11. Mok W, Wang W, Cooper S, Ang EN, Liaw SY. Attitudes towards vital signs monitoring in the detection of clinical deterioration: scale development and survey of ward nurses. Int J Qual Health Care. 2015;27(3):207-213. https://doi.org/10.1093/intqhc/mzv019.
12. Keshvani N, Berger K, Nguyen OK, Makam AN. Roadmap for improving the accuracy of respiratory rate measurements. BMJ Qual Saf. 2018;27(8):e5. https://doi.org/10.1136/bmjqs-2017-007516.
13. Semler MW, Stover DG, Copland AP, et al. Flash mob research: a single-day, multicenter, resident-directed study of respiratory rate. Chest. 2013;143(6):1740-1744. https://doi.org/10.1378/chest.12-1837.
14. Makam AN, Nguyen OK, Auerbach AD. Diagnostic accuracy and effectiveness of automated electronic sepsis alert systems: a systematic review. J Hosp Med. 2015;10(6):396-402. https://doi.org/10.1002/jhm.2347.
15. Ploeg J, Skelly J, Rowan M, et al. The role of nursing best practice champions in diffusing practice guidelines: a mixed methods study. Worldviews Evid Based Nurs. 2010;7(4):238-251. https://doi.org/10.1111/j.1741-6787.2010.00202.x.
© 2019 Society of Hospital Medicine