User login
Patient Acuity Rating
Recently released Accreditation Council for Graduate Medical Education (ACGME) recommendations, set to take effect in 2011, place further limits on resident duty hours, which are expected to result in additional handoffs of patients between inpatient providers.1 The increase in these handoffs following the prior set of ACGME recommendations in 2003 has been cited as a potential etiology for the underwhelming effects of the duty hour restrictions on patient outcomes, whereby the benefits of well‐rested physicians are theorized to be offset by increased harm associated with discontinuous care, especially in high‐risk patients.2 In 2007, an Institute of Medicine committee on the topic recommended improving handovers to make the transfer of patient responsibility and information more effective and less error prone.3
Several strategies have been proposed, but an ideal way to quickly transfer complex medical information on numerous patients remains to be identified. A standardized metric of a patient's risk level, if accurate, has the potential to summarize how stable or unstable a patient might be. We hypothesized that clinicians would be able to quantify their judgments regarding the stability of their inpatients and that this measure would correlate with impending clinical deterioration as determined by cardiac arrest or intensive care unit (ICU) transfer within the next 24 hours.
METHODS
Study Design
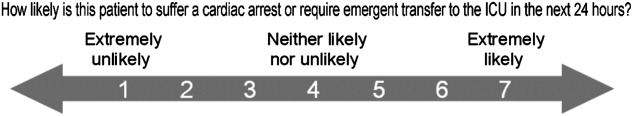
We developed the Patient Acuity Rating (PAR), a 7‐point Likert scale to quantify clinician judgment regarding the stability of inpatients outside the ICU, and conducted a prospective study of its diagnostic accuracy for predicting impending clinical deterioration in an academic tertiary care hospital. Providers were prospectively surveyed once per call‐cycle, on the day after patient admission, and asked to rate each of their patients on their likelihood of suffering a cardiac arrest or being transferred to the ICU. The scale was anchored at both ends, with a PAR of 1 corresponding to extreme unlikelihood of suffering a cardiac arrest or requiring emergent ICU transfer within the next 24 hours, and a PAR of 7 corresponding with extreme likelihood (Figure 1). A score of 4 suggested neither likely nor unlikely to experience an event. No further anchors were provided.
Study Setting and Participants
This study was conducted at The University of Chicago Medical Center, an academic, tertiary care facility with approximately 600 inpatient beds. Subjects involved both the clinicians who provided PAR scores and the patients upon whom the PAR scores and outcomes were based. The clinicians included internal medicine interns, residents, and attending physicians, as well as midlevel providers (nurse practitioners or physician assistants). Clinicians were eligible for inclusion if they cared for patients on one of nine adult ward services between January and June 2008. They were included in the study if they consented to participate. Housestaff, with medicine attending supervision, covered patients on seven general medicine services, while midlevel practitioners, also with medicine attending supervision, covered patients on two hepatology and transplant services.
Providers were independently surveyed once per call‐cycle (every 2 to 4 days depending on the service) by study personnel regarding each of their patients, and instructed not to consult with other members of the team regarding their PAR score assignments. All patients for whom a participating clinician provided a PAR score were included in the analysis. Clinician subjects were carefully surveyed at the end of their work day, just prior to, or immediately following, their handover to the cross‐covering physician, so as to minimize the risk that they might alter their plan and transfer a patient to the ICU based on the PAR score.
Data Analysis
PAR scores were entered into a database (Excel, Microsoft Corporation, Redmond, WA) and then linked to patient demographic and outcome data obtained from hospital administrative databases. Weighted kappa statistics were used to evaluate inter‐rater reliability. Ordinal trend testing was used to correlate the PAR with patient outcomes by provider. In addition, receiver operator characteristics (ROC) curves were constructed, and area under the curve (AUC) calculated and compared among providers using paired chi‐squared statistics. Sensitivities and specificities were determined for each theoretical PAR cutoff. Clustered multivariate logistic regression was used to adjust for provider, service, and individual patient. All calculations were performed using a statistical software application (Stata, College Station, TX).
Approval
The study protocol, consent, and data collection mechanisms were approved by the Institutional Review Board of the University of Chicago Medical Center. Waiver of consent provisions were used for patients on the basis of minimal harm and general impracticability, while a written consent process was used for patient care providers. Collection of patient information was designed to comply with the Health Insurance Portability and Accountability Act of 1996 regulations.
RESULTS
During the study period, 140/159 (88.1%) eligible clinicians consented to participate. Of these clinicians, 45 (32.1%) were intern physicians, 40 (28.6%) were resident physicians, 51 (36.4%) were attending physicians, and 4 (2.9%) were midlevel providers. They provided PAR scores on 1663 distinct patients over the course of 2019 separate admissions. Table 1 shows the patient and admission demographics grouped by the type of medical service: general medicine teaching or multispecialty non‐teaching. Severity of illness assignments were determined using All Patient Refined Diagnosis Related Group (APR‐DRG) methodology, which incorporates features such as principle diagnosis at admission, co‐morbidities, complications during admission, age, and gender.4, 5 The multispecialty patients were more likely to be male, have a higher severity of illness, and die during the hospitalization, when compared to general medicine patients.
| Characteristic | General Medicine Teaching Services | Multispecialty Non‐Teaching Services | P‐Value |
|---|---|---|---|
| |||
| Patients (n) | 1,373 | 290 | NA |
| Admissions (n) | 1,660 | 359 | NA |
| Age, mean (SD) years | 57 (21) | 57 (13) | 0.73 |
| Women, n (%) | 1,006 (61) | 173 (48) | <0.001 |
| Race, n (%) | <0.001 | ||
| White | 203 (12) | 133 (37) | |
| Black | 1,129 (68) | 125 (35) | |
| Hispanic | 26 (2) | 34 (9) | |
| Asian | 11 (1) | 10 (3) | |
| Other/unknown | 291 (18) | 57 (16) | |
| Severity of illness, n (%) | <0.001 | ||
| Minor | 121 (7) | 2 (1) | |
| Moderate | 461 (28) | 44 (12) | |
| Major | 677 (41) | 179 (50) | |
| Extreme | 329 (20) | 123 (34) | |
| N/A | 77 (4) | 11 (3) | |
| Discharged home, n (%) | 1,347 (81) | 282 (79) | 0.25 |
| Expired (not hospice), n (%) | 25 (2) | 28 (8) | <0.001 |
A total of 6034 individual PAR scores from 3419 patient‐days were obtained, which represented a response rate of 74.3%. The average PAR was 2.9 1.4. Table 2 shows the inter‐rater reliability between providers. Weighted kappa statistics ranged from 0.32 (for interns and attendings) to 0.43 (for midlevels and attendings), representing moderate inter‐rater reliability. No comparison was made between midlevel providers and interns or residents, as these participants never cared for the same patients on the same day.
| Provider Pair | Observations (n) | Agreement (%) | Weighted Kappa |
|---|---|---|---|
| Interns vs residents | 1,006 | 87.1 | 0.42 |
| Residents vs attendings | 1,012 | 82.5 | 0.35 |
| Interns vs attendings | 1,026 | 84.4 | 0.32 |
| Midlevels vs attendings | 208 | 85.0 | 0.43 |
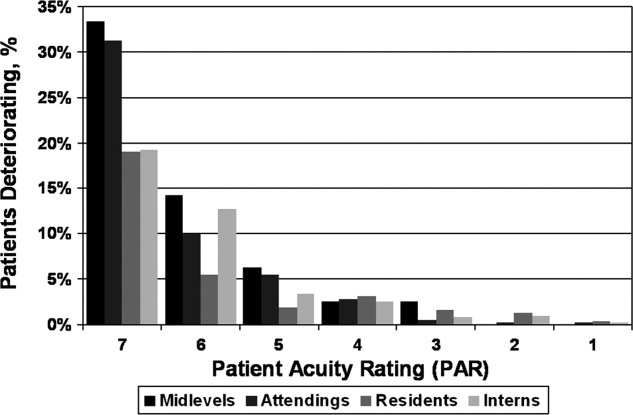
Seventy‐four of the 3419 patient‐days (2.2%) ended in cardiac arrest or unplanned ICU transfer. The distribution of clinical deterioration by average PAR, along with sensitivity and specificity values, are shown in Table 3. Using a cutoff value of 5 yielded a sensitivity of 62.2% and a specificity of 84.6%. Lowering the threshold to 4 increased the sensitivity to 82.4% but decreased the specificity to 68.3%. This corresponded with a combined AUC of 0.82 [95% CI 0.77, 0.87] (Table 4). Provider‐specific AUC values ranged from a low of 0.69 [95% CI 0.59, 0.78] for residents to a high of 0.84 [95% CI 0.78, 0.90] for attendings on general medicine (P = 0.01). The remaining values were not statistically different from one another. Figure 2 shows the provider‐specific percentage of patients deteriorating by PAR. The risk of clinical deterioration decreased in logarithmic fashion as the PAR decreased for all provider types (P < 0.001). These results were confirmed using multivariate logistic regression adjusting for provider, service, and individual patient (data not shown). In addition, we found no significant differences in AUC values between attendings in terms of years in practice or specialty, however, the study was not powered to detect such differences.
| PAR | All Patients (n) | Decompensating Patients (n) | Sensitivity (%) | Specificity (%) |
|---|---|---|---|---|
| 7 | 40 | 12 | 16.2 | 99.2 |
| 6 | 184 | 30 | 40.5 | 95.4 |
| 5 | 561 | 46 | 62.2 | 84.6 |
| 4 | 1,120 | 61 | 82.4 | 68.3 |
| 3 | 2,044 | 69 | 93.2 | 41.0 |
| 2 | 3,005 | 73 | 98.6 | 12.3 |
| 1 | 3,419 | 74 | 100.0 | 0.0 |
| Service | Provider | Observations (n) | PAR, median (IQR) | AUROC (95% CI) |
|---|---|---|---|---|
| ||||
| General medicine | Interns | 1,567 | 3 (2‐4) | 0.79 (0.70, 0.88) |
| General medicine | Residents | 1,611 | 3 (2‐4) | 0.69 (0.59, 0.78)* |
| General medicine | Attendings | 1,791 | 3 (2‐4) | 0.84 (0.78, 0.90)* |
| Multispecialty | Attendings | 823 | 3 (2‐4) | 0.88 (0.79, 0.97) |
| Multispecialty | Midlevels | 242 | 3 (2‐4) | 0.80 (0.64, 0.95) |
| Combined | All | 3,419 | 3 (2‐4) | 0.82 (0.77, 0.87) |
DISCUSSION
Physicians frequently depend on subjective judgments in their decision making.6 However, these judgments are difficult to communicate succinctly and hard to compare among clinicians. We have developed a simple tool for quantifying provider judgment, which yields moderate inter‐rater reliability, and good accuracy in predicting which floor patients may suffer cardiac arrest or emergent ICU transfer in the next 24 hours at an academic medical center.
Physicians routinely use written sign‐outs to convey important information to covering physicians during the handoff process, with the result being loss of information and decreased communication.7, 8 A recent study found that sign‐outs are frequently lacking comprehensive data, with the least commonly conveyed information being the patient's current clinical condition.9 The PAR has the potential to improve clinician handoffs by succinctly summarizing a patient's risk level. This need is made even more pressing by the ACGME's new resident duty hour restrictions and impending further increase in handoffs, a known correlate with inpatient morbidity and mortality.10 The PAR could be added to the sign‐out and updated nightly to readily summarize the judgments of the primary inpatient providers for the covering physician who has little, if any, personal knowledge of the patient at hand.
While ours is the first to examine the correlation between physician judgment and clinical deterioration on the floors, several studies have evaluated the accuracy of clinical judgment in predicting mortality of critically ill hospitalized patients. In the study to understand prognoses and preferences for outcomes and risks of treatments (SUPPORT), for example, physicians accurately predicted 180‐day mortality of ICU patients with an AUC of 0.78.11 Similar studies in the neonatal intensive care setting revealed greater than 80% predictive ability to identify those patients who would be intubated or fail to survive.12 These intuitive judgments have faired well when compared to previously validated ICU‐based physiologic scoring systems, such as the Acute Physiology, Age, Chronic Health Evaluation (APACHE) system. A meta‐analysis of studies which compared physician intuition to various physiologic scoring systems found intuition to be significantly better at predicting ICU mortality with an AUC of 0.85 compared to 0.63, P = 0.002.13
Physiology‐based scoring systems, relying on routine vital signs, have been developed for non‐ICU inpatients. Smith and colleagues14 recently conducted a systematic review and identified 33 distinct scoring systems, which they independently validated on a single data set for the ability of the admission score to predict overall hospital mortality. The resulting AUC values ranged from 0.66 to 0.78.14 In a prospective study, Kho and colleagues used an electronic medical record (EMR) to generate real‐time risk scores for use in surveillance rounds by their Rapid Response Team (RRT).15 Their scoring system relied on systolic blood pressure, heart rate, respiratory rate, temperature, oxygen saturation, age, and body mass index. The resulting score yielded an AUC of 0.72, with a sensitivity of 88% and specificity of 48% using a cutoff of 3, or 34% and 86% using a cutoff of 5, for predicting code call, cardiopulmonary arrest, or transfer to an ICU. Similar to the latter study, using the PAR for RRT surveillance would allow an institution to set its threshold according to available resources. For example, the team could first evaluate all the patients with a PAR score of 7, followed by those who received a score of 6 and so on. Using the data from the current study, evaluating all the patients with scores of 5, 6, or 7 would require assessing 16% of the patients in order to identify 62% of the events. Adding patients with a score of 4 would require assessing one‐third of the floor patients, but would identify 82% of subsequent deteriorations.
Although the objective nature of physiology‐based scoring systems makes them very appealing, they have two significant limitations. The first is that these scoring systems either require manual vital sign data entry and score calculation, which can be labor intensive and impractical, or technological solutions such as an EMR, which are costly and therefore cannot be applied broadly to all hospitalized patients. In fact, in a recent survey of U.S. hospitals, only 1.5% were found to have a comprehensive EMR on all units.16 Additionally, they are limited by the quality of the data input. This is particularly true for the case of respiratory rate and mental status, which are frequently unreliably measured and documented in current practice.17, 18 The PAR score has the benefit of being readily generated in minimal time by a broad range of providers, as we have demonstrated.
Furthermore, it is well known that vital signs do not capture the full clinical picture, which is why most RRT activation criteria include a vague catch‐all trigger for provider worry or concern.19, 20 Interestingly, this trigger is frequently one of the top cited reasons for activating the RRT,21, 22 and is missed by any automated track‐and‐trigger scoring system which relies only on quantitative clinical assessments such as vital signs. The PAR allows this concern to be quantified, either for addition to a physiology‐based track‐and‐trigger system, or for use on its own, as we have done here.
It is interesting to note that, in this study, attending physician judgment was most predictive and resident judgment the least. One explanation may be that clinical judgment optimally requires both experience and at‐the‐bedside data. While attendings have the most experience, the amount of time interns spend at the bedside collecting data may offset their relative inexperience.23, 24 In contrast, residents generally spend less time at the bedside than interns and have only marginally more experience,25 suggesting that either strong clinical experience or a good amount of time at the bedside are required for the best assessments of risk. This is supported by the close agreement between the attendings and midlevels, who likely spend a comparable amount of time at the bedside as interns.
There are several imitations to this study. First, there may be respondent bias in those who chose to participate and the days in which they provided scores. We would expect this bias to work against the null hypothesis if providers with better clinical judgment were more inclined to participate, and were less likely to provide scores when they were very busy, and thus may have had less time to assess patients. However, the enrollment and response rates were quite good (88% and 74%, respectively) which likely mitigates against this bias. Another limitation is that the study was conducted at a single institution, and only on medical patients, which may limit its generalizability to other institutions and patient populations. Also, intern performance during this January through June period may not reflect their performance earlier in their training year. In addition, we did not have physiologic data available for the patients, and thus were not able to compare the PAR directly to a physiology‐based scoring system. Finally, it is theoretically possible that a provider could decide on the PAR and then transfer the patient to the ICU based on their score. However, we carefully surveyed physicians and nurse practitioners at the time of sign‐out, when they had finished their clinical work for the day, to minimize this risk. We also instructed providers not to share their PAR score with the covering physicians to avoid introduction of bias on the part of the cross‐covering physician.
This was a pilot study designed to measure the correlation between PAR scores and patient outcomes. The PAR has the potential to be added to any handoff system as a way to convey individual severity of illness for patients. In addition, it has the potential for use in risk stratifying patients for interventions, such as increased vital sign monitoring or heightened surveillance by cross‐covering physicians or Rapid Response Teams. One could imagine instructing interns to have a low threshold of concern for patients with high PAR scores, and even formalizing procedures for rounding on such patients a second time during the day or overnight, when on call. Future studies will be required to test its use in clinical practice, which would ideally include a randomized‐controlled trial.
We conclude that clinical judgment regarding floor patient stability is quantifiable in a readily obtained, low‐technology score that has moderate inter‐rater reliability and a good ability to distinguish patients who will suffer a cardiac arrest or require ICU transfer within the next 24 hours. Due to its simple and easy to administer nature, the PAR has the potential to be a useful tool for efficiently conveying complex assessments from one member of the healthcare team to another, thereby improving handoffs and identifying patients at risk of clinical deterioration who might benefit from earlier intervention.
Acknowledgements
The authors are grateful for the support and dedication of the residents, faculty, and staff in the Department of Medicine at the University of Chicago, without whom this study would not have been possible. They also thank Trevor C. Yuen for statistical support, David Beiser, MD, MS, and Kenneth Rasinski, PhD, for scientific advice, Kate Weaver for expert administrative support and Deborah Walsh, RN, MS, Jefferson Cua, and Amanda Schmitz for assistance with data collection.
- Accreditation Council for Graduate Medical Education (ACGME).Task Force on Quality Care and Professionalism.Proposed standards: common program requirements.2007. Available at: http://acgme‐2010standards.org/pdf/Proposed_Standards.pdf. Accessed August 16,year="2010"2010.
- ,,, et al.Association of workload of on‐call medical interns with on‐call sleep duration, shift duration, and participation in educational activities.JAMA.2008;300(10):1146–1153.
- Institute of Medicine (IOM).Committee on Optimizing Graduate Medical Trainee (Resident) Hours and Work Schedules to Improve Patient Safety.Report brief on resident duty hours: enhancing sleep, supervision, and safety.Washington, DC:National Academy Press;2008. Available at: http://www.iom.edu/∼/media/Files/Report%20Files/2008/Resident‐Duty‐Hours/residency%20hours%20revised% 20for%20web.pdf. Accessed August 16,year="2010"2010.
- ,,,,.Determining benchmarks for evaluation and management coding in an academic division of general surgery.J Am Coll Surg.2004;199(1):124–130.
- .Applying the 3M all patient refined diagnosis related groups grouper to measure inpatient severity in the VA.Med Care.2003;41(6):103–110.
- ,,.Non‐analytical models of clinical reasoning: the role of experience.Med Educ.2007;41(12):1140–1145.
- ,,,,.Communication failures in patient sign‐out and suggestions for improvement: a critical incident analysis.Qual Saf Health Care.2005;14(6):401–407.
- .Fumbled handoffs: one dropped ball after another.Ann Intern Med.2005;142(5):352–358.
- ,,,,.What are covering doctors told about their patients? Analysis of sign‐out among internal medicine house staff.Qual Saf Health Care.2009;18(4):248–255.
- ,,,,.Does housestaff discontinuity of care increase the risk for preventable adverse events?Ann Intern Med.1994;121(11):866–872.
- ,,, et al.The SUPPORT prognostic model—objective estimates of survival for seriously ill hospitalized adults.Ann Intern Med.1995;122(3):191–203.
- ,,,,,.Serial assessment of mortality in the neonatal intensive care unit by algorithm and intuition: certainty, uncertainty, and informed consent.Pediatrics.2002;109(5):878–886.
- ,,, et al.Mortality predictions in the intensive care unit: comparing physicians with scoring systems.Crit Care Med.2006;34(3):878–885.
- ,,,.Review and performance evaluation of aggregate weighted ‘track and trigger’ systems.Resuscitation.2008;77(2):170–179.
- ,,, et al.Utility of commonly captured data from an EHR to identify hospitalized patients at risk for clinical deterioration.AMIA Annu Symp Proc.2007:404–408.
- ,,, et al.Use of electronic health records in U.S. hospitals.N Engl J Med.2009;360(16):1628–1638.
- ,,,.The vexatious vital: neither clinical measurements by nurses nor an electronic monitor provides accurate measurements of respiratory rate in triage.Ann Emerg Med.2005;45(1):68–76.
- ,,,.Detection and documentation of dementia and delirium in acute geriatric wards.Gen Hosp Psychiatry.2004;26(1):31–35.
- ,,,,.Redefining in‐hospital resuscitation: the concept of the medical emergency team.Resuscitation.2001;48(2):105–110.
- ,,,,.The identification of risk factors for cardiac arrest and formulation of activation criteria to alert a medical emergency team.Resuscitation.2002;54(2):125–131.
- ,,, et al.Implementation of a medical emergency team in a large pediatric teaching hospital prevents respiratory and cardiopulmonary arrests outside the intensive care unit.Pediatr Crit Care Med.2007;8(3):236–246.
- ,,,,.Reduction of paediatric in‐patient cardiac arrest and death with a medical emergency team: preliminary results.Arch Dis Child.2005;90(11):1148–1152.
- ,,.Time analysis of a general medicine service: results from a random work sampling study.J Gen Intern Med.1994;9(5):272–277.
- ,,, et al.The on‐call experience of interns in internal medicine. Medical Education Task Force of Henry Ford Hospital.Arch Intern Med.1990;150(11):2294–2297.
- ,,,,,.Analyzing the time and value of housestaff inpatient work.J Gen Intern Med.1998;13(8):534–540.
Recently released Accreditation Council for Graduate Medical Education (ACGME) recommendations, set to take effect in 2011, place further limits on resident duty hours, which are expected to result in additional handoffs of patients between inpatient providers.1 The increase in these handoffs following the prior set of ACGME recommendations in 2003 has been cited as a potential etiology for the underwhelming effects of the duty hour restrictions on patient outcomes, whereby the benefits of well‐rested physicians are theorized to be offset by increased harm associated with discontinuous care, especially in high‐risk patients.2 In 2007, an Institute of Medicine committee on the topic recommended improving handovers to make the transfer of patient responsibility and information more effective and less error prone.3
Several strategies have been proposed, but an ideal way to quickly transfer complex medical information on numerous patients remains to be identified. A standardized metric of a patient's risk level, if accurate, has the potential to summarize how stable or unstable a patient might be. We hypothesized that clinicians would be able to quantify their judgments regarding the stability of their inpatients and that this measure would correlate with impending clinical deterioration as determined by cardiac arrest or intensive care unit (ICU) transfer within the next 24 hours.
METHODS
Study Design
We developed the Patient Acuity Rating (PAR), a 7‐point Likert scale to quantify clinician judgment regarding the stability of inpatients outside the ICU, and conducted a prospective study of its diagnostic accuracy for predicting impending clinical deterioration in an academic tertiary care hospital. Providers were prospectively surveyed once per call‐cycle, on the day after patient admission, and asked to rate each of their patients on their likelihood of suffering a cardiac arrest or being transferred to the ICU. The scale was anchored at both ends, with a PAR of 1 corresponding to extreme unlikelihood of suffering a cardiac arrest or requiring emergent ICU transfer within the next 24 hours, and a PAR of 7 corresponding with extreme likelihood (Figure 1). A score of 4 suggested neither likely nor unlikely to experience an event. No further anchors were provided.
Study Setting and Participants
This study was conducted at The University of Chicago Medical Center, an academic, tertiary care facility with approximately 600 inpatient beds. Subjects involved both the clinicians who provided PAR scores and the patients upon whom the PAR scores and outcomes were based. The clinicians included internal medicine interns, residents, and attending physicians, as well as midlevel providers (nurse practitioners or physician assistants). Clinicians were eligible for inclusion if they cared for patients on one of nine adult ward services between January and June 2008. They were included in the study if they consented to participate. Housestaff, with medicine attending supervision, covered patients on seven general medicine services, while midlevel practitioners, also with medicine attending supervision, covered patients on two hepatology and transplant services.
Providers were independently surveyed once per call‐cycle (every 2 to 4 days depending on the service) by study personnel regarding each of their patients, and instructed not to consult with other members of the team regarding their PAR score assignments. All patients for whom a participating clinician provided a PAR score were included in the analysis. Clinician subjects were carefully surveyed at the end of their work day, just prior to, or immediately following, their handover to the cross‐covering physician, so as to minimize the risk that they might alter their plan and transfer a patient to the ICU based on the PAR score.
Data Analysis
PAR scores were entered into a database (Excel, Microsoft Corporation, Redmond, WA) and then linked to patient demographic and outcome data obtained from hospital administrative databases. Weighted kappa statistics were used to evaluate inter‐rater reliability. Ordinal trend testing was used to correlate the PAR with patient outcomes by provider. In addition, receiver operator characteristics (ROC) curves were constructed, and area under the curve (AUC) calculated and compared among providers using paired chi‐squared statistics. Sensitivities and specificities were determined for each theoretical PAR cutoff. Clustered multivariate logistic regression was used to adjust for provider, service, and individual patient. All calculations were performed using a statistical software application (Stata, College Station, TX).
Approval
The study protocol, consent, and data collection mechanisms were approved by the Institutional Review Board of the University of Chicago Medical Center. Waiver of consent provisions were used for patients on the basis of minimal harm and general impracticability, while a written consent process was used for patient care providers. Collection of patient information was designed to comply with the Health Insurance Portability and Accountability Act of 1996 regulations.
RESULTS
During the study period, 140/159 (88.1%) eligible clinicians consented to participate. Of these clinicians, 45 (32.1%) were intern physicians, 40 (28.6%) were resident physicians, 51 (36.4%) were attending physicians, and 4 (2.9%) were midlevel providers. They provided PAR scores on 1663 distinct patients over the course of 2019 separate admissions. Table 1 shows the patient and admission demographics grouped by the type of medical service: general medicine teaching or multispecialty non‐teaching. Severity of illness assignments were determined using All Patient Refined Diagnosis Related Group (APR‐DRG) methodology, which incorporates features such as principle diagnosis at admission, co‐morbidities, complications during admission, age, and gender.4, 5 The multispecialty patients were more likely to be male, have a higher severity of illness, and die during the hospitalization, when compared to general medicine patients.
| Characteristic | General Medicine Teaching Services | Multispecialty Non‐Teaching Services | P‐Value |
|---|---|---|---|
| |||
| Patients (n) | 1,373 | 290 | NA |
| Admissions (n) | 1,660 | 359 | NA |
| Age, mean (SD) years | 57 (21) | 57 (13) | 0.73 |
| Women, n (%) | 1,006 (61) | 173 (48) | <0.001 |
| Race, n (%) | <0.001 | ||
| White | 203 (12) | 133 (37) | |
| Black | 1,129 (68) | 125 (35) | |
| Hispanic | 26 (2) | 34 (9) | |
| Asian | 11 (1) | 10 (3) | |
| Other/unknown | 291 (18) | 57 (16) | |
| Severity of illness, n (%) | <0.001 | ||
| Minor | 121 (7) | 2 (1) | |
| Moderate | 461 (28) | 44 (12) | |
| Major | 677 (41) | 179 (50) | |
| Extreme | 329 (20) | 123 (34) | |
| N/A | 77 (4) | 11 (3) | |
| Discharged home, n (%) | 1,347 (81) | 282 (79) | 0.25 |
| Expired (not hospice), n (%) | 25 (2) | 28 (8) | <0.001 |
A total of 6034 individual PAR scores from 3419 patient‐days were obtained, which represented a response rate of 74.3%. The average PAR was 2.9 1.4. Table 2 shows the inter‐rater reliability between providers. Weighted kappa statistics ranged from 0.32 (for interns and attendings) to 0.43 (for midlevels and attendings), representing moderate inter‐rater reliability. No comparison was made between midlevel providers and interns or residents, as these participants never cared for the same patients on the same day.
| Provider Pair | Observations (n) | Agreement (%) | Weighted Kappa |
|---|---|---|---|
| Interns vs residents | 1,006 | 87.1 | 0.42 |
| Residents vs attendings | 1,012 | 82.5 | 0.35 |
| Interns vs attendings | 1,026 | 84.4 | 0.32 |
| Midlevels vs attendings | 208 | 85.0 | 0.43 |
Seventy‐four of the 3419 patient‐days (2.2%) ended in cardiac arrest or unplanned ICU transfer. The distribution of clinical deterioration by average PAR, along with sensitivity and specificity values, are shown in Table 3. Using a cutoff value of 5 yielded a sensitivity of 62.2% and a specificity of 84.6%. Lowering the threshold to 4 increased the sensitivity to 82.4% but decreased the specificity to 68.3%. This corresponded with a combined AUC of 0.82 [95% CI 0.77, 0.87] (Table 4). Provider‐specific AUC values ranged from a low of 0.69 [95% CI 0.59, 0.78] for residents to a high of 0.84 [95% CI 0.78, 0.90] for attendings on general medicine (P = 0.01). The remaining values were not statistically different from one another. Figure 2 shows the provider‐specific percentage of patients deteriorating by PAR. The risk of clinical deterioration decreased in logarithmic fashion as the PAR decreased for all provider types (P < 0.001). These results were confirmed using multivariate logistic regression adjusting for provider, service, and individual patient (data not shown). In addition, we found no significant differences in AUC values between attendings in terms of years in practice or specialty, however, the study was not powered to detect such differences.
| PAR | All Patients (n) | Decompensating Patients (n) | Sensitivity (%) | Specificity (%) |
|---|---|---|---|---|
| 7 | 40 | 12 | 16.2 | 99.2 |
| 6 | 184 | 30 | 40.5 | 95.4 |
| 5 | 561 | 46 | 62.2 | 84.6 |
| 4 | 1,120 | 61 | 82.4 | 68.3 |
| 3 | 2,044 | 69 | 93.2 | 41.0 |
| 2 | 3,005 | 73 | 98.6 | 12.3 |
| 1 | 3,419 | 74 | 100.0 | 0.0 |
| Service | Provider | Observations (n) | PAR, median (IQR) | AUROC (95% CI) |
|---|---|---|---|---|
| ||||
| General medicine | Interns | 1,567 | 3 (2‐4) | 0.79 (0.70, 0.88) |
| General medicine | Residents | 1,611 | 3 (2‐4) | 0.69 (0.59, 0.78)* |
| General medicine | Attendings | 1,791 | 3 (2‐4) | 0.84 (0.78, 0.90)* |
| Multispecialty | Attendings | 823 | 3 (2‐4) | 0.88 (0.79, 0.97) |
| Multispecialty | Midlevels | 242 | 3 (2‐4) | 0.80 (0.64, 0.95) |
| Combined | All | 3,419 | 3 (2‐4) | 0.82 (0.77, 0.87) |
DISCUSSION
Physicians frequently depend on subjective judgments in their decision making.6 However, these judgments are difficult to communicate succinctly and hard to compare among clinicians. We have developed a simple tool for quantifying provider judgment, which yields moderate inter‐rater reliability, and good accuracy in predicting which floor patients may suffer cardiac arrest or emergent ICU transfer in the next 24 hours at an academic medical center.
Physicians routinely use written sign‐outs to convey important information to covering physicians during the handoff process, with the result being loss of information and decreased communication.7, 8 A recent study found that sign‐outs are frequently lacking comprehensive data, with the least commonly conveyed information being the patient's current clinical condition.9 The PAR has the potential to improve clinician handoffs by succinctly summarizing a patient's risk level. This need is made even more pressing by the ACGME's new resident duty hour restrictions and impending further increase in handoffs, a known correlate with inpatient morbidity and mortality.10 The PAR could be added to the sign‐out and updated nightly to readily summarize the judgments of the primary inpatient providers for the covering physician who has little, if any, personal knowledge of the patient at hand.
While ours is the first to examine the correlation between physician judgment and clinical deterioration on the floors, several studies have evaluated the accuracy of clinical judgment in predicting mortality of critically ill hospitalized patients. In the study to understand prognoses and preferences for outcomes and risks of treatments (SUPPORT), for example, physicians accurately predicted 180‐day mortality of ICU patients with an AUC of 0.78.11 Similar studies in the neonatal intensive care setting revealed greater than 80% predictive ability to identify those patients who would be intubated or fail to survive.12 These intuitive judgments have faired well when compared to previously validated ICU‐based physiologic scoring systems, such as the Acute Physiology, Age, Chronic Health Evaluation (APACHE) system. A meta‐analysis of studies which compared physician intuition to various physiologic scoring systems found intuition to be significantly better at predicting ICU mortality with an AUC of 0.85 compared to 0.63, P = 0.002.13
Physiology‐based scoring systems, relying on routine vital signs, have been developed for non‐ICU inpatients. Smith and colleagues14 recently conducted a systematic review and identified 33 distinct scoring systems, which they independently validated on a single data set for the ability of the admission score to predict overall hospital mortality. The resulting AUC values ranged from 0.66 to 0.78.14 In a prospective study, Kho and colleagues used an electronic medical record (EMR) to generate real‐time risk scores for use in surveillance rounds by their Rapid Response Team (RRT).15 Their scoring system relied on systolic blood pressure, heart rate, respiratory rate, temperature, oxygen saturation, age, and body mass index. The resulting score yielded an AUC of 0.72, with a sensitivity of 88% and specificity of 48% using a cutoff of 3, or 34% and 86% using a cutoff of 5, for predicting code call, cardiopulmonary arrest, or transfer to an ICU. Similar to the latter study, using the PAR for RRT surveillance would allow an institution to set its threshold according to available resources. For example, the team could first evaluate all the patients with a PAR score of 7, followed by those who received a score of 6 and so on. Using the data from the current study, evaluating all the patients with scores of 5, 6, or 7 would require assessing 16% of the patients in order to identify 62% of the events. Adding patients with a score of 4 would require assessing one‐third of the floor patients, but would identify 82% of subsequent deteriorations.
Although the objective nature of physiology‐based scoring systems makes them very appealing, they have two significant limitations. The first is that these scoring systems either require manual vital sign data entry and score calculation, which can be labor intensive and impractical, or technological solutions such as an EMR, which are costly and therefore cannot be applied broadly to all hospitalized patients. In fact, in a recent survey of U.S. hospitals, only 1.5% were found to have a comprehensive EMR on all units.16 Additionally, they are limited by the quality of the data input. This is particularly true for the case of respiratory rate and mental status, which are frequently unreliably measured and documented in current practice.17, 18 The PAR score has the benefit of being readily generated in minimal time by a broad range of providers, as we have demonstrated.
Furthermore, it is well known that vital signs do not capture the full clinical picture, which is why most RRT activation criteria include a vague catch‐all trigger for provider worry or concern.19, 20 Interestingly, this trigger is frequently one of the top cited reasons for activating the RRT,21, 22 and is missed by any automated track‐and‐trigger scoring system which relies only on quantitative clinical assessments such as vital signs. The PAR allows this concern to be quantified, either for addition to a physiology‐based track‐and‐trigger system, or for use on its own, as we have done here.
It is interesting to note that, in this study, attending physician judgment was most predictive and resident judgment the least. One explanation may be that clinical judgment optimally requires both experience and at‐the‐bedside data. While attendings have the most experience, the amount of time interns spend at the bedside collecting data may offset their relative inexperience.23, 24 In contrast, residents generally spend less time at the bedside than interns and have only marginally more experience,25 suggesting that either strong clinical experience or a good amount of time at the bedside are required for the best assessments of risk. This is supported by the close agreement between the attendings and midlevels, who likely spend a comparable amount of time at the bedside as interns.
There are several imitations to this study. First, there may be respondent bias in those who chose to participate and the days in which they provided scores. We would expect this bias to work against the null hypothesis if providers with better clinical judgment were more inclined to participate, and were less likely to provide scores when they were very busy, and thus may have had less time to assess patients. However, the enrollment and response rates were quite good (88% and 74%, respectively) which likely mitigates against this bias. Another limitation is that the study was conducted at a single institution, and only on medical patients, which may limit its generalizability to other institutions and patient populations. Also, intern performance during this January through June period may not reflect their performance earlier in their training year. In addition, we did not have physiologic data available for the patients, and thus were not able to compare the PAR directly to a physiology‐based scoring system. Finally, it is theoretically possible that a provider could decide on the PAR and then transfer the patient to the ICU based on their score. However, we carefully surveyed physicians and nurse practitioners at the time of sign‐out, when they had finished their clinical work for the day, to minimize this risk. We also instructed providers not to share their PAR score with the covering physicians to avoid introduction of bias on the part of the cross‐covering physician.
This was a pilot study designed to measure the correlation between PAR scores and patient outcomes. The PAR has the potential to be added to any handoff system as a way to convey individual severity of illness for patients. In addition, it has the potential for use in risk stratifying patients for interventions, such as increased vital sign monitoring or heightened surveillance by cross‐covering physicians or Rapid Response Teams. One could imagine instructing interns to have a low threshold of concern for patients with high PAR scores, and even formalizing procedures for rounding on such patients a second time during the day or overnight, when on call. Future studies will be required to test its use in clinical practice, which would ideally include a randomized‐controlled trial.
We conclude that clinical judgment regarding floor patient stability is quantifiable in a readily obtained, low‐technology score that has moderate inter‐rater reliability and a good ability to distinguish patients who will suffer a cardiac arrest or require ICU transfer within the next 24 hours. Due to its simple and easy to administer nature, the PAR has the potential to be a useful tool for efficiently conveying complex assessments from one member of the healthcare team to another, thereby improving handoffs and identifying patients at risk of clinical deterioration who might benefit from earlier intervention.
Acknowledgements
The authors are grateful for the support and dedication of the residents, faculty, and staff in the Department of Medicine at the University of Chicago, without whom this study would not have been possible. They also thank Trevor C. Yuen for statistical support, David Beiser, MD, MS, and Kenneth Rasinski, PhD, for scientific advice, Kate Weaver for expert administrative support and Deborah Walsh, RN, MS, Jefferson Cua, and Amanda Schmitz for assistance with data collection.
- Accreditation Council for Graduate Medical Education (ACGME).Task Force on Quality Care and Professionalism.Proposed standards: common program requirements.2007. Available at: http://acgme‐2010standards.org/pdf/Proposed_Standards.pdf. Accessed August 16,year="2010"2010.
- ,,, et al.Association of workload of on‐call medical interns with on‐call sleep duration, shift duration, and participation in educational activities.JAMA.2008;300(10):1146–1153.
- Institute of Medicine (IOM).Committee on Optimizing Graduate Medical Trainee (Resident) Hours and Work Schedules to Improve Patient Safety.Report brief on resident duty hours: enhancing sleep, supervision, and safety.Washington, DC:National Academy Press;2008. Available at: http://www.iom.edu/∼/media/Files/Report%20Files/2008/Resident‐Duty‐Hours/residency%20hours%20revised% 20for%20web.pdf. Accessed August 16,year="2010"2010.
- ,,,,.Determining benchmarks for evaluation and management coding in an academic division of general surgery.J Am Coll Surg.2004;199(1):124–130.
- .Applying the 3M all patient refined diagnosis related groups grouper to measure inpatient severity in the VA.Med Care.2003;41(6):103–110.
- ,,.Non‐analytical models of clinical reasoning: the role of experience.Med Educ.2007;41(12):1140–1145.
- ,,,,.Communication failures in patient sign‐out and suggestions for improvement: a critical incident analysis.Qual Saf Health Care.2005;14(6):401–407.
- .Fumbled handoffs: one dropped ball after another.Ann Intern Med.2005;142(5):352–358.
- ,,,,.What are covering doctors told about their patients? Analysis of sign‐out among internal medicine house staff.Qual Saf Health Care.2009;18(4):248–255.
- ,,,,.Does housestaff discontinuity of care increase the risk for preventable adverse events?Ann Intern Med.1994;121(11):866–872.
- ,,, et al.The SUPPORT prognostic model—objective estimates of survival for seriously ill hospitalized adults.Ann Intern Med.1995;122(3):191–203.
- ,,,,,.Serial assessment of mortality in the neonatal intensive care unit by algorithm and intuition: certainty, uncertainty, and informed consent.Pediatrics.2002;109(5):878–886.
- ,,, et al.Mortality predictions in the intensive care unit: comparing physicians with scoring systems.Crit Care Med.2006;34(3):878–885.
- ,,,.Review and performance evaluation of aggregate weighted ‘track and trigger’ systems.Resuscitation.2008;77(2):170–179.
- ,,, et al.Utility of commonly captured data from an EHR to identify hospitalized patients at risk for clinical deterioration.AMIA Annu Symp Proc.2007:404–408.
- ,,, et al.Use of electronic health records in U.S. hospitals.N Engl J Med.2009;360(16):1628–1638.
- ,,,.The vexatious vital: neither clinical measurements by nurses nor an electronic monitor provides accurate measurements of respiratory rate in triage.Ann Emerg Med.2005;45(1):68–76.
- ,,,.Detection and documentation of dementia and delirium in acute geriatric wards.Gen Hosp Psychiatry.2004;26(1):31–35.
- ,,,,.Redefining in‐hospital resuscitation: the concept of the medical emergency team.Resuscitation.2001;48(2):105–110.
- ,,,,.The identification of risk factors for cardiac arrest and formulation of activation criteria to alert a medical emergency team.Resuscitation.2002;54(2):125–131.
- ,,, et al.Implementation of a medical emergency team in a large pediatric teaching hospital prevents respiratory and cardiopulmonary arrests outside the intensive care unit.Pediatr Crit Care Med.2007;8(3):236–246.
- ,,,,.Reduction of paediatric in‐patient cardiac arrest and death with a medical emergency team: preliminary results.Arch Dis Child.2005;90(11):1148–1152.
- ,,.Time analysis of a general medicine service: results from a random work sampling study.J Gen Intern Med.1994;9(5):272–277.
- ,,, et al.The on‐call experience of interns in internal medicine. Medical Education Task Force of Henry Ford Hospital.Arch Intern Med.1990;150(11):2294–2297.
- ,,,,,.Analyzing the time and value of housestaff inpatient work.J Gen Intern Med.1998;13(8):534–540.
Copyright © 2011 Society of Hospital Medicine
