User login
Patient Acuity Rating
Recently released Accreditation Council for Graduate Medical Education (ACGME) recommendations, set to take effect in 2011, place further limits on resident duty hours, which are expected to result in additional handoffs of patients between inpatient providers.1 The increase in these handoffs following the prior set of ACGME recommendations in 2003 has been cited as a potential etiology for the underwhelming effects of the duty hour restrictions on patient outcomes, whereby the benefits of well‐rested physicians are theorized to be offset by increased harm associated with discontinuous care, especially in high‐risk patients.2 In 2007, an Institute of Medicine committee on the topic recommended improving handovers to make the transfer of patient responsibility and information more effective and less error prone.3
Several strategies have been proposed, but an ideal way to quickly transfer complex medical information on numerous patients remains to be identified. A standardized metric of a patient's risk level, if accurate, has the potential to summarize how stable or unstable a patient might be. We hypothesized that clinicians would be able to quantify their judgments regarding the stability of their inpatients and that this measure would correlate with impending clinical deterioration as determined by cardiac arrest or intensive care unit (ICU) transfer within the next 24 hours.
METHODS
Study Design
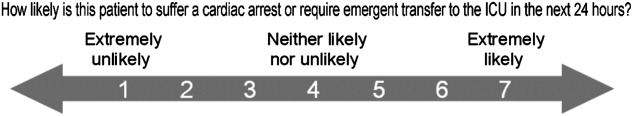
We developed the Patient Acuity Rating (PAR), a 7‐point Likert scale to quantify clinician judgment regarding the stability of inpatients outside the ICU, and conducted a prospective study of its diagnostic accuracy for predicting impending clinical deterioration in an academic tertiary care hospital. Providers were prospectively surveyed once per call‐cycle, on the day after patient admission, and asked to rate each of their patients on their likelihood of suffering a cardiac arrest or being transferred to the ICU. The scale was anchored at both ends, with a PAR of 1 corresponding to extreme unlikelihood of suffering a cardiac arrest or requiring emergent ICU transfer within the next 24 hours, and a PAR of 7 corresponding with extreme likelihood (Figure 1). A score of 4 suggested neither likely nor unlikely to experience an event. No further anchors were provided.
Study Setting and Participants
This study was conducted at The University of Chicago Medical Center, an academic, tertiary care facility with approximately 600 inpatient beds. Subjects involved both the clinicians who provided PAR scores and the patients upon whom the PAR scores and outcomes were based. The clinicians included internal medicine interns, residents, and attending physicians, as well as midlevel providers (nurse practitioners or physician assistants). Clinicians were eligible for inclusion if they cared for patients on one of nine adult ward services between January and June 2008. They were included in the study if they consented to participate. Housestaff, with medicine attending supervision, covered patients on seven general medicine services, while midlevel practitioners, also with medicine attending supervision, covered patients on two hepatology and transplant services.
Providers were independently surveyed once per call‐cycle (every 2 to 4 days depending on the service) by study personnel regarding each of their patients, and instructed not to consult with other members of the team regarding their PAR score assignments. All patients for whom a participating clinician provided a PAR score were included in the analysis. Clinician subjects were carefully surveyed at the end of their work day, just prior to, or immediately following, their handover to the cross‐covering physician, so as to minimize the risk that they might alter their plan and transfer a patient to the ICU based on the PAR score.
Data Analysis
PAR scores were entered into a database (Excel, Microsoft Corporation, Redmond, WA) and then linked to patient demographic and outcome data obtained from hospital administrative databases. Weighted kappa statistics were used to evaluate inter‐rater reliability. Ordinal trend testing was used to correlate the PAR with patient outcomes by provider. In addition, receiver operator characteristics (ROC) curves were constructed, and area under the curve (AUC) calculated and compared among providers using paired chi‐squared statistics. Sensitivities and specificities were determined for each theoretical PAR cutoff. Clustered multivariate logistic regression was used to adjust for provider, service, and individual patient. All calculations were performed using a statistical software application (Stata, College Station, TX).
Approval
The study protocol, consent, and data collection mechanisms were approved by the Institutional Review Board of the University of Chicago Medical Center. Waiver of consent provisions were used for patients on the basis of minimal harm and general impracticability, while a written consent process was used for patient care providers. Collection of patient information was designed to comply with the Health Insurance Portability and Accountability Act of 1996 regulations.
RESULTS
During the study period, 140/159 (88.1%) eligible clinicians consented to participate. Of these clinicians, 45 (32.1%) were intern physicians, 40 (28.6%) were resident physicians, 51 (36.4%) were attending physicians, and 4 (2.9%) were midlevel providers. They provided PAR scores on 1663 distinct patients over the course of 2019 separate admissions. Table 1 shows the patient and admission demographics grouped by the type of medical service: general medicine teaching or multispecialty non‐teaching. Severity of illness assignments were determined using All Patient Refined Diagnosis Related Group (APR‐DRG) methodology, which incorporates features such as principle diagnosis at admission, co‐morbidities, complications during admission, age, and gender.4, 5 The multispecialty patients were more likely to be male, have a higher severity of illness, and die during the hospitalization, when compared to general medicine patients.
| Characteristic | General Medicine Teaching Services | Multispecialty Non‐Teaching Services | P‐Value |
|---|---|---|---|
| |||
| Patients (n) | 1,373 | 290 | NA |
| Admissions (n) | 1,660 | 359 | NA |
| Age, mean (SD) years | 57 (21) | 57 (13) | 0.73 |
| Women, n (%) | 1,006 (61) | 173 (48) | <0.001 |
| Race, n (%) | <0.001 | ||
| White | 203 (12) | 133 (37) | |
| Black | 1,129 (68) | 125 (35) | |
| Hispanic | 26 (2) | 34 (9) | |
| Asian | 11 (1) | 10 (3) | |
| Other/unknown | 291 (18) | 57 (16) | |
| Severity of illness, n (%) | <0.001 | ||
| Minor | 121 (7) | 2 (1) | |
| Moderate | 461 (28) | 44 (12) | |
| Major | 677 (41) | 179 (50) | |
| Extreme | 329 (20) | 123 (34) | |
| N/A | 77 (4) | 11 (3) | |
| Discharged home, n (%) | 1,347 (81) | 282 (79) | 0.25 |
| Expired (not hospice), n (%) | 25 (2) | 28 (8) | <0.001 |
A total of 6034 individual PAR scores from 3419 patient‐days were obtained, which represented a response rate of 74.3%. The average PAR was 2.9 1.4. Table 2 shows the inter‐rater reliability between providers. Weighted kappa statistics ranged from 0.32 (for interns and attendings) to 0.43 (for midlevels and attendings), representing moderate inter‐rater reliability. No comparison was made between midlevel providers and interns or residents, as these participants never cared for the same patients on the same day.
| Provider Pair | Observations (n) | Agreement (%) | Weighted Kappa |
|---|---|---|---|
| Interns vs residents | 1,006 | 87.1 | 0.42 |
| Residents vs attendings | 1,012 | 82.5 | 0.35 |
| Interns vs attendings | 1,026 | 84.4 | 0.32 |
| Midlevels vs attendings | 208 | 85.0 | 0.43 |
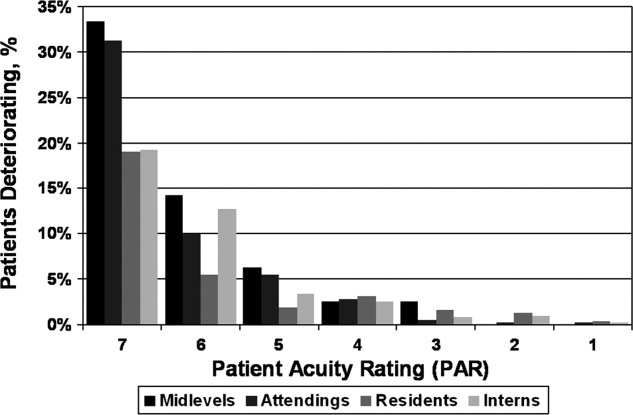
Seventy‐four of the 3419 patient‐days (2.2%) ended in cardiac arrest or unplanned ICU transfer. The distribution of clinical deterioration by average PAR, along with sensitivity and specificity values, are shown in Table 3. Using a cutoff value of 5 yielded a sensitivity of 62.2% and a specificity of 84.6%. Lowering the threshold to 4 increased the sensitivity to 82.4% but decreased the specificity to 68.3%. This corresponded with a combined AUC of 0.82 [95% CI 0.77, 0.87] (Table 4). Provider‐specific AUC values ranged from a low of 0.69 [95% CI 0.59, 0.78] for residents to a high of 0.84 [95% CI 0.78, 0.90] for attendings on general medicine (P = 0.01). The remaining values were not statistically different from one another. Figure 2 shows the provider‐specific percentage of patients deteriorating by PAR. The risk of clinical deterioration decreased in logarithmic fashion as the PAR decreased for all provider types (P < 0.001). These results were confirmed using multivariate logistic regression adjusting for provider, service, and individual patient (data not shown). In addition, we found no significant differences in AUC values between attendings in terms of years in practice or specialty, however, the study was not powered to detect such differences.
| PAR | All Patients (n) | Decompensating Patients (n) | Sensitivity (%) | Specificity (%) |
|---|---|---|---|---|
| 7 | 40 | 12 | 16.2 | 99.2 |
| 6 | 184 | 30 | 40.5 | 95.4 |
| 5 | 561 | 46 | 62.2 | 84.6 |
| 4 | 1,120 | 61 | 82.4 | 68.3 |
| 3 | 2,044 | 69 | 93.2 | 41.0 |
| 2 | 3,005 | 73 | 98.6 | 12.3 |
| 1 | 3,419 | 74 | 100.0 | 0.0 |
| Service | Provider | Observations (n) | PAR, median (IQR) | AUROC (95% CI) |
|---|---|---|---|---|
| ||||
| General medicine | Interns | 1,567 | 3 (2‐4) | 0.79 (0.70, 0.88) |
| General medicine | Residents | 1,611 | 3 (2‐4) | 0.69 (0.59, 0.78)* |
| General medicine | Attendings | 1,791 | 3 (2‐4) | 0.84 (0.78, 0.90)* |
| Multispecialty | Attendings | 823 | 3 (2‐4) | 0.88 (0.79, 0.97) |
| Multispecialty | Midlevels | 242 | 3 (2‐4) | 0.80 (0.64, 0.95) |
| Combined | All | 3,419 | 3 (2‐4) | 0.82 (0.77, 0.87) |
DISCUSSION
Physicians frequently depend on subjective judgments in their decision making.6 However, these judgments are difficult to communicate succinctly and hard to compare among clinicians. We have developed a simple tool for quantifying provider judgment, which yields moderate inter‐rater reliability, and good accuracy in predicting which floor patients may suffer cardiac arrest or emergent ICU transfer in the next 24 hours at an academic medical center.
Physicians routinely use written sign‐outs to convey important information to covering physicians during the handoff process, with the result being loss of information and decreased communication.7, 8 A recent study found that sign‐outs are frequently lacking comprehensive data, with the least commonly conveyed information being the patient's current clinical condition.9 The PAR has the potential to improve clinician handoffs by succinctly summarizing a patient's risk level. This need is made even more pressing by the ACGME's new resident duty hour restrictions and impending further increase in handoffs, a known correlate with inpatient morbidity and mortality.10 The PAR could be added to the sign‐out and updated nightly to readily summarize the judgments of the primary inpatient providers for the covering physician who has little, if any, personal knowledge of the patient at hand.
While ours is the first to examine the correlation between physician judgment and clinical deterioration on the floors, several studies have evaluated the accuracy of clinical judgment in predicting mortality of critically ill hospitalized patients. In the study to understand prognoses and preferences for outcomes and risks of treatments (SUPPORT), for example, physicians accurately predicted 180‐day mortality of ICU patients with an AUC of 0.78.11 Similar studies in the neonatal intensive care setting revealed greater than 80% predictive ability to identify those patients who would be intubated or fail to survive.12 These intuitive judgments have faired well when compared to previously validated ICU‐based physiologic scoring systems, such as the Acute Physiology, Age, Chronic Health Evaluation (APACHE) system. A meta‐analysis of studies which compared physician intuition to various physiologic scoring systems found intuition to be significantly better at predicting ICU mortality with an AUC of 0.85 compared to 0.63, P = 0.002.13
Physiology‐based scoring systems, relying on routine vital signs, have been developed for non‐ICU inpatients. Smith and colleagues14 recently conducted a systematic review and identified 33 distinct scoring systems, which they independently validated on a single data set for the ability of the admission score to predict overall hospital mortality. The resulting AUC values ranged from 0.66 to 0.78.14 In a prospective study, Kho and colleagues used an electronic medical record (EMR) to generate real‐time risk scores for use in surveillance rounds by their Rapid Response Team (RRT).15 Their scoring system relied on systolic blood pressure, heart rate, respiratory rate, temperature, oxygen saturation, age, and body mass index. The resulting score yielded an AUC of 0.72, with a sensitivity of 88% and specificity of 48% using a cutoff of 3, or 34% and 86% using a cutoff of 5, for predicting code call, cardiopulmonary arrest, or transfer to an ICU. Similar to the latter study, using the PAR for RRT surveillance would allow an institution to set its threshold according to available resources. For example, the team could first evaluate all the patients with a PAR score of 7, followed by those who received a score of 6 and so on. Using the data from the current study, evaluating all the patients with scores of 5, 6, or 7 would require assessing 16% of the patients in order to identify 62% of the events. Adding patients with a score of 4 would require assessing one‐third of the floor patients, but would identify 82% of subsequent deteriorations.
Although the objective nature of physiology‐based scoring systems makes them very appealing, they have two significant limitations. The first is that these scoring systems either require manual vital sign data entry and score calculation, which can be labor intensive and impractical, or technological solutions such as an EMR, which are costly and therefore cannot be applied broadly to all hospitalized patients. In fact, in a recent survey of U.S. hospitals, only 1.5% were found to have a comprehensive EMR on all units.16 Additionally, they are limited by the quality of the data input. This is particularly true for the case of respiratory rate and mental status, which are frequently unreliably measured and documented in current practice.17, 18 The PAR score has the benefit of being readily generated in minimal time by a broad range of providers, as we have demonstrated.
Furthermore, it is well known that vital signs do not capture the full clinical picture, which is why most RRT activation criteria include a vague catch‐all trigger for provider worry or concern.19, 20 Interestingly, this trigger is frequently one of the top cited reasons for activating the RRT,21, 22 and is missed by any automated track‐and‐trigger scoring system which relies only on quantitative clinical assessments such as vital signs. The PAR allows this concern to be quantified, either for addition to a physiology‐based track‐and‐trigger system, or for use on its own, as we have done here.
It is interesting to note that, in this study, attending physician judgment was most predictive and resident judgment the least. One explanation may be that clinical judgment optimally requires both experience and at‐the‐bedside data. While attendings have the most experience, the amount of time interns spend at the bedside collecting data may offset their relative inexperience.23, 24 In contrast, residents generally spend less time at the bedside than interns and have only marginally more experience,25 suggesting that either strong clinical experience or a good amount of time at the bedside are required for the best assessments of risk. This is supported by the close agreement between the attendings and midlevels, who likely spend a comparable amount of time at the bedside as interns.
There are several imitations to this study. First, there may be respondent bias in those who chose to participate and the days in which they provided scores. We would expect this bias to work against the null hypothesis if providers with better clinical judgment were more inclined to participate, and were less likely to provide scores when they were very busy, and thus may have had less time to assess patients. However, the enrollment and response rates were quite good (88% and 74%, respectively) which likely mitigates against this bias. Another limitation is that the study was conducted at a single institution, and only on medical patients, which may limit its generalizability to other institutions and patient populations. Also, intern performance during this January through June period may not reflect their performance earlier in their training year. In addition, we did not have physiologic data available for the patients, and thus were not able to compare the PAR directly to a physiology‐based scoring system. Finally, it is theoretically possible that a provider could decide on the PAR and then transfer the patient to the ICU based on their score. However, we carefully surveyed physicians and nurse practitioners at the time of sign‐out, when they had finished their clinical work for the day, to minimize this risk. We also instructed providers not to share their PAR score with the covering physicians to avoid introduction of bias on the part of the cross‐covering physician.
This was a pilot study designed to measure the correlation between PAR scores and patient outcomes. The PAR has the potential to be added to any handoff system as a way to convey individual severity of illness for patients. In addition, it has the potential for use in risk stratifying patients for interventions, such as increased vital sign monitoring or heightened surveillance by cross‐covering physicians or Rapid Response Teams. One could imagine instructing interns to have a low threshold of concern for patients with high PAR scores, and even formalizing procedures for rounding on such patients a second time during the day or overnight, when on call. Future studies will be required to test its use in clinical practice, which would ideally include a randomized‐controlled trial.
We conclude that clinical judgment regarding floor patient stability is quantifiable in a readily obtained, low‐technology score that has moderate inter‐rater reliability and a good ability to distinguish patients who will suffer a cardiac arrest or require ICU transfer within the next 24 hours. Due to its simple and easy to administer nature, the PAR has the potential to be a useful tool for efficiently conveying complex assessments from one member of the healthcare team to another, thereby improving handoffs and identifying patients at risk of clinical deterioration who might benefit from earlier intervention.
Acknowledgements
The authors are grateful for the support and dedication of the residents, faculty, and staff in the Department of Medicine at the University of Chicago, without whom this study would not have been possible. They also thank Trevor C. Yuen for statistical support, David Beiser, MD, MS, and Kenneth Rasinski, PhD, for scientific advice, Kate Weaver for expert administrative support and Deborah Walsh, RN, MS, Jefferson Cua, and Amanda Schmitz for assistance with data collection.
- Accreditation Council for Graduate Medical Education (ACGME).Task Force on Quality Care and Professionalism.Proposed standards: common program requirements.2007. Available at: http://acgme‐2010standards.org/pdf/Proposed_Standards.pdf. Accessed August 16,year="2010"2010.
- ,,, et al.Association of workload of on‐call medical interns with on‐call sleep duration, shift duration, and participation in educational activities.JAMA.2008;300(10):1146–1153.
- Institute of Medicine (IOM).Committee on Optimizing Graduate Medical Trainee (Resident) Hours and Work Schedules to Improve Patient Safety.Report brief on resident duty hours: enhancing sleep, supervision, and safety.Washington, DC:National Academy Press;2008. Available at: http://www.iom.edu/∼/media/Files/Report%20Files/2008/Resident‐Duty‐Hours/residency%20hours%20revised% 20for%20web.pdf. Accessed August 16,year="2010"2010.
- ,,,,.Determining benchmarks for evaluation and management coding in an academic division of general surgery.J Am Coll Surg.2004;199(1):124–130.
- .Applying the 3M all patient refined diagnosis related groups grouper to measure inpatient severity in the VA.Med Care.2003;41(6):103–110.
- ,,.Non‐analytical models of clinical reasoning: the role of experience.Med Educ.2007;41(12):1140–1145.
- ,,,,.Communication failures in patient sign‐out and suggestions for improvement: a critical incident analysis.Qual Saf Health Care.2005;14(6):401–407.
- .Fumbled handoffs: one dropped ball after another.Ann Intern Med.2005;142(5):352–358.
- ,,,,.What are covering doctors told about their patients? Analysis of sign‐out among internal medicine house staff.Qual Saf Health Care.2009;18(4):248–255.
- ,,,,.Does housestaff discontinuity of care increase the risk for preventable adverse events?Ann Intern Med.1994;121(11):866–872.
- ,,, et al.The SUPPORT prognostic model—objective estimates of survival for seriously ill hospitalized adults.Ann Intern Med.1995;122(3):191–203.
- ,,,,,.Serial assessment of mortality in the neonatal intensive care unit by algorithm and intuition: certainty, uncertainty, and informed consent.Pediatrics.2002;109(5):878–886.
- ,,, et al.Mortality predictions in the intensive care unit: comparing physicians with scoring systems.Crit Care Med.2006;34(3):878–885.
- ,,,.Review and performance evaluation of aggregate weighted ‘track and trigger’ systems.Resuscitation.2008;77(2):170–179.
- ,,, et al.Utility of commonly captured data from an EHR to identify hospitalized patients at risk for clinical deterioration.AMIA Annu Symp Proc.2007:404–408.
- ,,, et al.Use of electronic health records in U.S. hospitals.N Engl J Med.2009;360(16):1628–1638.
- ,,,.The vexatious vital: neither clinical measurements by nurses nor an electronic monitor provides accurate measurements of respiratory rate in triage.Ann Emerg Med.2005;45(1):68–76.
- ,,,.Detection and documentation of dementia and delirium in acute geriatric wards.Gen Hosp Psychiatry.2004;26(1):31–35.
- ,,,,.Redefining in‐hospital resuscitation: the concept of the medical emergency team.Resuscitation.2001;48(2):105–110.
- ,,,,.The identification of risk factors for cardiac arrest and formulation of activation criteria to alert a medical emergency team.Resuscitation.2002;54(2):125–131.
- ,,, et al.Implementation of a medical emergency team in a large pediatric teaching hospital prevents respiratory and cardiopulmonary arrests outside the intensive care unit.Pediatr Crit Care Med.2007;8(3):236–246.
- ,,,,.Reduction of paediatric in‐patient cardiac arrest and death with a medical emergency team: preliminary results.Arch Dis Child.2005;90(11):1148–1152.
- ,,.Time analysis of a general medicine service: results from a random work sampling study.J Gen Intern Med.1994;9(5):272–277.
- ,,, et al.The on‐call experience of interns in internal medicine. Medical Education Task Force of Henry Ford Hospital.Arch Intern Med.1990;150(11):2294–2297.
- ,,,,,.Analyzing the time and value of housestaff inpatient work.J Gen Intern Med.1998;13(8):534–540.
Recently released Accreditation Council for Graduate Medical Education (ACGME) recommendations, set to take effect in 2011, place further limits on resident duty hours, which are expected to result in additional handoffs of patients between inpatient providers.1 The increase in these handoffs following the prior set of ACGME recommendations in 2003 has been cited as a potential etiology for the underwhelming effects of the duty hour restrictions on patient outcomes, whereby the benefits of well‐rested physicians are theorized to be offset by increased harm associated with discontinuous care, especially in high‐risk patients.2 In 2007, an Institute of Medicine committee on the topic recommended improving handovers to make the transfer of patient responsibility and information more effective and less error prone.3
Several strategies have been proposed, but an ideal way to quickly transfer complex medical information on numerous patients remains to be identified. A standardized metric of a patient's risk level, if accurate, has the potential to summarize how stable or unstable a patient might be. We hypothesized that clinicians would be able to quantify their judgments regarding the stability of their inpatients and that this measure would correlate with impending clinical deterioration as determined by cardiac arrest or intensive care unit (ICU) transfer within the next 24 hours.
METHODS
Study Design
We developed the Patient Acuity Rating (PAR), a 7‐point Likert scale to quantify clinician judgment regarding the stability of inpatients outside the ICU, and conducted a prospective study of its diagnostic accuracy for predicting impending clinical deterioration in an academic tertiary care hospital. Providers were prospectively surveyed once per call‐cycle, on the day after patient admission, and asked to rate each of their patients on their likelihood of suffering a cardiac arrest or being transferred to the ICU. The scale was anchored at both ends, with a PAR of 1 corresponding to extreme unlikelihood of suffering a cardiac arrest or requiring emergent ICU transfer within the next 24 hours, and a PAR of 7 corresponding with extreme likelihood (Figure 1). A score of 4 suggested neither likely nor unlikely to experience an event. No further anchors were provided.
Study Setting and Participants
This study was conducted at The University of Chicago Medical Center, an academic, tertiary care facility with approximately 600 inpatient beds. Subjects involved both the clinicians who provided PAR scores and the patients upon whom the PAR scores and outcomes were based. The clinicians included internal medicine interns, residents, and attending physicians, as well as midlevel providers (nurse practitioners or physician assistants). Clinicians were eligible for inclusion if they cared for patients on one of nine adult ward services between January and June 2008. They were included in the study if they consented to participate. Housestaff, with medicine attending supervision, covered patients on seven general medicine services, while midlevel practitioners, also with medicine attending supervision, covered patients on two hepatology and transplant services.
Providers were independently surveyed once per call‐cycle (every 2 to 4 days depending on the service) by study personnel regarding each of their patients, and instructed not to consult with other members of the team regarding their PAR score assignments. All patients for whom a participating clinician provided a PAR score were included in the analysis. Clinician subjects were carefully surveyed at the end of their work day, just prior to, or immediately following, their handover to the cross‐covering physician, so as to minimize the risk that they might alter their plan and transfer a patient to the ICU based on the PAR score.
Data Analysis
PAR scores were entered into a database (Excel, Microsoft Corporation, Redmond, WA) and then linked to patient demographic and outcome data obtained from hospital administrative databases. Weighted kappa statistics were used to evaluate inter‐rater reliability. Ordinal trend testing was used to correlate the PAR with patient outcomes by provider. In addition, receiver operator characteristics (ROC) curves were constructed, and area under the curve (AUC) calculated and compared among providers using paired chi‐squared statistics. Sensitivities and specificities were determined for each theoretical PAR cutoff. Clustered multivariate logistic regression was used to adjust for provider, service, and individual patient. All calculations were performed using a statistical software application (Stata, College Station, TX).
Approval
The study protocol, consent, and data collection mechanisms were approved by the Institutional Review Board of the University of Chicago Medical Center. Waiver of consent provisions were used for patients on the basis of minimal harm and general impracticability, while a written consent process was used for patient care providers. Collection of patient information was designed to comply with the Health Insurance Portability and Accountability Act of 1996 regulations.
RESULTS
During the study period, 140/159 (88.1%) eligible clinicians consented to participate. Of these clinicians, 45 (32.1%) were intern physicians, 40 (28.6%) were resident physicians, 51 (36.4%) were attending physicians, and 4 (2.9%) were midlevel providers. They provided PAR scores on 1663 distinct patients over the course of 2019 separate admissions. Table 1 shows the patient and admission demographics grouped by the type of medical service: general medicine teaching or multispecialty non‐teaching. Severity of illness assignments were determined using All Patient Refined Diagnosis Related Group (APR‐DRG) methodology, which incorporates features such as principle diagnosis at admission, co‐morbidities, complications during admission, age, and gender.4, 5 The multispecialty patients were more likely to be male, have a higher severity of illness, and die during the hospitalization, when compared to general medicine patients.
| Characteristic | General Medicine Teaching Services | Multispecialty Non‐Teaching Services | P‐Value |
|---|---|---|---|
| |||
| Patients (n) | 1,373 | 290 | NA |
| Admissions (n) | 1,660 | 359 | NA |
| Age, mean (SD) years | 57 (21) | 57 (13) | 0.73 |
| Women, n (%) | 1,006 (61) | 173 (48) | <0.001 |
| Race, n (%) | <0.001 | ||
| White | 203 (12) | 133 (37) | |
| Black | 1,129 (68) | 125 (35) | |
| Hispanic | 26 (2) | 34 (9) | |
| Asian | 11 (1) | 10 (3) | |
| Other/unknown | 291 (18) | 57 (16) | |
| Severity of illness, n (%) | <0.001 | ||
| Minor | 121 (7) | 2 (1) | |
| Moderate | 461 (28) | 44 (12) | |
| Major | 677 (41) | 179 (50) | |
| Extreme | 329 (20) | 123 (34) | |
| N/A | 77 (4) | 11 (3) | |
| Discharged home, n (%) | 1,347 (81) | 282 (79) | 0.25 |
| Expired (not hospice), n (%) | 25 (2) | 28 (8) | <0.001 |
A total of 6034 individual PAR scores from 3419 patient‐days were obtained, which represented a response rate of 74.3%. The average PAR was 2.9 1.4. Table 2 shows the inter‐rater reliability between providers. Weighted kappa statistics ranged from 0.32 (for interns and attendings) to 0.43 (for midlevels and attendings), representing moderate inter‐rater reliability. No comparison was made between midlevel providers and interns or residents, as these participants never cared for the same patients on the same day.
| Provider Pair | Observations (n) | Agreement (%) | Weighted Kappa |
|---|---|---|---|
| Interns vs residents | 1,006 | 87.1 | 0.42 |
| Residents vs attendings | 1,012 | 82.5 | 0.35 |
| Interns vs attendings | 1,026 | 84.4 | 0.32 |
| Midlevels vs attendings | 208 | 85.0 | 0.43 |
Seventy‐four of the 3419 patient‐days (2.2%) ended in cardiac arrest or unplanned ICU transfer. The distribution of clinical deterioration by average PAR, along with sensitivity and specificity values, are shown in Table 3. Using a cutoff value of 5 yielded a sensitivity of 62.2% and a specificity of 84.6%. Lowering the threshold to 4 increased the sensitivity to 82.4% but decreased the specificity to 68.3%. This corresponded with a combined AUC of 0.82 [95% CI 0.77, 0.87] (Table 4). Provider‐specific AUC values ranged from a low of 0.69 [95% CI 0.59, 0.78] for residents to a high of 0.84 [95% CI 0.78, 0.90] for attendings on general medicine (P = 0.01). The remaining values were not statistically different from one another. Figure 2 shows the provider‐specific percentage of patients deteriorating by PAR. The risk of clinical deterioration decreased in logarithmic fashion as the PAR decreased for all provider types (P < 0.001). These results were confirmed using multivariate logistic regression adjusting for provider, service, and individual patient (data not shown). In addition, we found no significant differences in AUC values between attendings in terms of years in practice or specialty, however, the study was not powered to detect such differences.
| PAR | All Patients (n) | Decompensating Patients (n) | Sensitivity (%) | Specificity (%) |
|---|---|---|---|---|
| 7 | 40 | 12 | 16.2 | 99.2 |
| 6 | 184 | 30 | 40.5 | 95.4 |
| 5 | 561 | 46 | 62.2 | 84.6 |
| 4 | 1,120 | 61 | 82.4 | 68.3 |
| 3 | 2,044 | 69 | 93.2 | 41.0 |
| 2 | 3,005 | 73 | 98.6 | 12.3 |
| 1 | 3,419 | 74 | 100.0 | 0.0 |
| Service | Provider | Observations (n) | PAR, median (IQR) | AUROC (95% CI) |
|---|---|---|---|---|
| ||||
| General medicine | Interns | 1,567 | 3 (2‐4) | 0.79 (0.70, 0.88) |
| General medicine | Residents | 1,611 | 3 (2‐4) | 0.69 (0.59, 0.78)* |
| General medicine | Attendings | 1,791 | 3 (2‐4) | 0.84 (0.78, 0.90)* |
| Multispecialty | Attendings | 823 | 3 (2‐4) | 0.88 (0.79, 0.97) |
| Multispecialty | Midlevels | 242 | 3 (2‐4) | 0.80 (0.64, 0.95) |
| Combined | All | 3,419 | 3 (2‐4) | 0.82 (0.77, 0.87) |
DISCUSSION
Physicians frequently depend on subjective judgments in their decision making.6 However, these judgments are difficult to communicate succinctly and hard to compare among clinicians. We have developed a simple tool for quantifying provider judgment, which yields moderate inter‐rater reliability, and good accuracy in predicting which floor patients may suffer cardiac arrest or emergent ICU transfer in the next 24 hours at an academic medical center.
Physicians routinely use written sign‐outs to convey important information to covering physicians during the handoff process, with the result being loss of information and decreased communication.7, 8 A recent study found that sign‐outs are frequently lacking comprehensive data, with the least commonly conveyed information being the patient's current clinical condition.9 The PAR has the potential to improve clinician handoffs by succinctly summarizing a patient's risk level. This need is made even more pressing by the ACGME's new resident duty hour restrictions and impending further increase in handoffs, a known correlate with inpatient morbidity and mortality.10 The PAR could be added to the sign‐out and updated nightly to readily summarize the judgments of the primary inpatient providers for the covering physician who has little, if any, personal knowledge of the patient at hand.
While ours is the first to examine the correlation between physician judgment and clinical deterioration on the floors, several studies have evaluated the accuracy of clinical judgment in predicting mortality of critically ill hospitalized patients. In the study to understand prognoses and preferences for outcomes and risks of treatments (SUPPORT), for example, physicians accurately predicted 180‐day mortality of ICU patients with an AUC of 0.78.11 Similar studies in the neonatal intensive care setting revealed greater than 80% predictive ability to identify those patients who would be intubated or fail to survive.12 These intuitive judgments have faired well when compared to previously validated ICU‐based physiologic scoring systems, such as the Acute Physiology, Age, Chronic Health Evaluation (APACHE) system. A meta‐analysis of studies which compared physician intuition to various physiologic scoring systems found intuition to be significantly better at predicting ICU mortality with an AUC of 0.85 compared to 0.63, P = 0.002.13
Physiology‐based scoring systems, relying on routine vital signs, have been developed for non‐ICU inpatients. Smith and colleagues14 recently conducted a systematic review and identified 33 distinct scoring systems, which they independently validated on a single data set for the ability of the admission score to predict overall hospital mortality. The resulting AUC values ranged from 0.66 to 0.78.14 In a prospective study, Kho and colleagues used an electronic medical record (EMR) to generate real‐time risk scores for use in surveillance rounds by their Rapid Response Team (RRT).15 Their scoring system relied on systolic blood pressure, heart rate, respiratory rate, temperature, oxygen saturation, age, and body mass index. The resulting score yielded an AUC of 0.72, with a sensitivity of 88% and specificity of 48% using a cutoff of 3, or 34% and 86% using a cutoff of 5, for predicting code call, cardiopulmonary arrest, or transfer to an ICU. Similar to the latter study, using the PAR for RRT surveillance would allow an institution to set its threshold according to available resources. For example, the team could first evaluate all the patients with a PAR score of 7, followed by those who received a score of 6 and so on. Using the data from the current study, evaluating all the patients with scores of 5, 6, or 7 would require assessing 16% of the patients in order to identify 62% of the events. Adding patients with a score of 4 would require assessing one‐third of the floor patients, but would identify 82% of subsequent deteriorations.
Although the objective nature of physiology‐based scoring systems makes them very appealing, they have two significant limitations. The first is that these scoring systems either require manual vital sign data entry and score calculation, which can be labor intensive and impractical, or technological solutions such as an EMR, which are costly and therefore cannot be applied broadly to all hospitalized patients. In fact, in a recent survey of U.S. hospitals, only 1.5% were found to have a comprehensive EMR on all units.16 Additionally, they are limited by the quality of the data input. This is particularly true for the case of respiratory rate and mental status, which are frequently unreliably measured and documented in current practice.17, 18 The PAR score has the benefit of being readily generated in minimal time by a broad range of providers, as we have demonstrated.
Furthermore, it is well known that vital signs do not capture the full clinical picture, which is why most RRT activation criteria include a vague catch‐all trigger for provider worry or concern.19, 20 Interestingly, this trigger is frequently one of the top cited reasons for activating the RRT,21, 22 and is missed by any automated track‐and‐trigger scoring system which relies only on quantitative clinical assessments such as vital signs. The PAR allows this concern to be quantified, either for addition to a physiology‐based track‐and‐trigger system, or for use on its own, as we have done here.
It is interesting to note that, in this study, attending physician judgment was most predictive and resident judgment the least. One explanation may be that clinical judgment optimally requires both experience and at‐the‐bedside data. While attendings have the most experience, the amount of time interns spend at the bedside collecting data may offset their relative inexperience.23, 24 In contrast, residents generally spend less time at the bedside than interns and have only marginally more experience,25 suggesting that either strong clinical experience or a good amount of time at the bedside are required for the best assessments of risk. This is supported by the close agreement between the attendings and midlevels, who likely spend a comparable amount of time at the bedside as interns.
There are several imitations to this study. First, there may be respondent bias in those who chose to participate and the days in which they provided scores. We would expect this bias to work against the null hypothesis if providers with better clinical judgment were more inclined to participate, and were less likely to provide scores when they were very busy, and thus may have had less time to assess patients. However, the enrollment and response rates were quite good (88% and 74%, respectively) which likely mitigates against this bias. Another limitation is that the study was conducted at a single institution, and only on medical patients, which may limit its generalizability to other institutions and patient populations. Also, intern performance during this January through June period may not reflect their performance earlier in their training year. In addition, we did not have physiologic data available for the patients, and thus were not able to compare the PAR directly to a physiology‐based scoring system. Finally, it is theoretically possible that a provider could decide on the PAR and then transfer the patient to the ICU based on their score. However, we carefully surveyed physicians and nurse practitioners at the time of sign‐out, when they had finished their clinical work for the day, to minimize this risk. We also instructed providers not to share their PAR score with the covering physicians to avoid introduction of bias on the part of the cross‐covering physician.
This was a pilot study designed to measure the correlation between PAR scores and patient outcomes. The PAR has the potential to be added to any handoff system as a way to convey individual severity of illness for patients. In addition, it has the potential for use in risk stratifying patients for interventions, such as increased vital sign monitoring or heightened surveillance by cross‐covering physicians or Rapid Response Teams. One could imagine instructing interns to have a low threshold of concern for patients with high PAR scores, and even formalizing procedures for rounding on such patients a second time during the day or overnight, when on call. Future studies will be required to test its use in clinical practice, which would ideally include a randomized‐controlled trial.
We conclude that clinical judgment regarding floor patient stability is quantifiable in a readily obtained, low‐technology score that has moderate inter‐rater reliability and a good ability to distinguish patients who will suffer a cardiac arrest or require ICU transfer within the next 24 hours. Due to its simple and easy to administer nature, the PAR has the potential to be a useful tool for efficiently conveying complex assessments from one member of the healthcare team to another, thereby improving handoffs and identifying patients at risk of clinical deterioration who might benefit from earlier intervention.
Acknowledgements
The authors are grateful for the support and dedication of the residents, faculty, and staff in the Department of Medicine at the University of Chicago, without whom this study would not have been possible. They also thank Trevor C. Yuen for statistical support, David Beiser, MD, MS, and Kenneth Rasinski, PhD, for scientific advice, Kate Weaver for expert administrative support and Deborah Walsh, RN, MS, Jefferson Cua, and Amanda Schmitz for assistance with data collection.
- Accreditation Council for Graduate Medical Education (ACGME).Task Force on Quality Care and Professionalism.Proposed standards: common program requirements.2007. Available at: http://acgme‐2010standards.org/pdf/Proposed_Standards.pdf. Accessed August 16,year="2010"2010.
- ,,, et al.Association of workload of on‐call medical interns with on‐call sleep duration, shift duration, and participation in educational activities.JAMA.2008;300(10):1146–1153.
- Institute of Medicine (IOM).Committee on Optimizing Graduate Medical Trainee (Resident) Hours and Work Schedules to Improve Patient Safety.Report brief on resident duty hours: enhancing sleep, supervision, and safety.Washington, DC:National Academy Press;2008. Available at: http://www.iom.edu/∼/media/Files/Report%20Files/2008/Resident‐Duty‐Hours/residency%20hours%20revised% 20for%20web.pdf. Accessed August 16,year="2010"2010.
- ,,,,.Determining benchmarks for evaluation and management coding in an academic division of general surgery.J Am Coll Surg.2004;199(1):124–130.
- .Applying the 3M all patient refined diagnosis related groups grouper to measure inpatient severity in the VA.Med Care.2003;41(6):103–110.
- ,,.Non‐analytical models of clinical reasoning: the role of experience.Med Educ.2007;41(12):1140–1145.
- ,,,,.Communication failures in patient sign‐out and suggestions for improvement: a critical incident analysis.Qual Saf Health Care.2005;14(6):401–407.
- .Fumbled handoffs: one dropped ball after another.Ann Intern Med.2005;142(5):352–358.
- ,,,,.What are covering doctors told about their patients? Analysis of sign‐out among internal medicine house staff.Qual Saf Health Care.2009;18(4):248–255.
- ,,,,.Does housestaff discontinuity of care increase the risk for preventable adverse events?Ann Intern Med.1994;121(11):866–872.
- ,,, et al.The SUPPORT prognostic model—objective estimates of survival for seriously ill hospitalized adults.Ann Intern Med.1995;122(3):191–203.
- ,,,,,.Serial assessment of mortality in the neonatal intensive care unit by algorithm and intuition: certainty, uncertainty, and informed consent.Pediatrics.2002;109(5):878–886.
- ,,, et al.Mortality predictions in the intensive care unit: comparing physicians with scoring systems.Crit Care Med.2006;34(3):878–885.
- ,,,.Review and performance evaluation of aggregate weighted ‘track and trigger’ systems.Resuscitation.2008;77(2):170–179.
- ,,, et al.Utility of commonly captured data from an EHR to identify hospitalized patients at risk for clinical deterioration.AMIA Annu Symp Proc.2007:404–408.
- ,,, et al.Use of electronic health records in U.S. hospitals.N Engl J Med.2009;360(16):1628–1638.
- ,,,.The vexatious vital: neither clinical measurements by nurses nor an electronic monitor provides accurate measurements of respiratory rate in triage.Ann Emerg Med.2005;45(1):68–76.
- ,,,.Detection and documentation of dementia and delirium in acute geriatric wards.Gen Hosp Psychiatry.2004;26(1):31–35.
- ,,,,.Redefining in‐hospital resuscitation: the concept of the medical emergency team.Resuscitation.2001;48(2):105–110.
- ,,,,.The identification of risk factors for cardiac arrest and formulation of activation criteria to alert a medical emergency team.Resuscitation.2002;54(2):125–131.
- ,,, et al.Implementation of a medical emergency team in a large pediatric teaching hospital prevents respiratory and cardiopulmonary arrests outside the intensive care unit.Pediatr Crit Care Med.2007;8(3):236–246.
- ,,,,.Reduction of paediatric in‐patient cardiac arrest and death with a medical emergency team: preliminary results.Arch Dis Child.2005;90(11):1148–1152.
- ,,.Time analysis of a general medicine service: results from a random work sampling study.J Gen Intern Med.1994;9(5):272–277.
- ,,, et al.The on‐call experience of interns in internal medicine. Medical Education Task Force of Henry Ford Hospital.Arch Intern Med.1990;150(11):2294–2297.
- ,,,,,.Analyzing the time and value of housestaff inpatient work.J Gen Intern Med.1998;13(8):534–540.
Copyright © 2011 Society of Hospital Medicine

Seniors Report Post‐Discharge Problems
Recently, there has been an increased focus on improving communication during care transitions for older patients as they leave the hospital. One reason for this focus is the increasing utilization of hospitalists, or hospital‐based physicians, caring for patients in the United States.1 As a result, many primary care physicians (PCPs) no longer care for their patients while in the hospital and may not be informed of their patients' hospitalization.2 Additionally, with an emphasis on shorter lengths of hospital stay, more extensive post‐discharge follow‐up is often warranted for patients, which often becomes the responsibility of a patient's PCP. Recently 6 societies (American College of Physicians, Society of General Internal Medicine, Society of Hospital Medicine, American Geriatrics Society, American College of Emergency Physicians, and Society of Academic Emergency Medicine) have recommended that a patient's PCP is notified during all steps in care transitions and that patient‐centered approaches are employed.3 Despite the increased need for improved inpatient‐ambulatory care transitions, the communication between hospitalists and PCPs has been characterized as being poor and ineffective.4 Prior studies have shown that PCPs are not aware of test results that require follow‐up, may not receive timely or high quality discharge materials, and have an overall poor perception of the quality of communication.46 Ensuring adequate communication is considered important due to the increased risk of adverse events that patients experience after discharge from the hospital.79 Furthermore, recent studies have shown that patients are often able to identify and report adverse events that would not be detected by medical record review alone.10, 11 Eliciting patient perspectives on their experiences after discharge and their expectations of communication between PCPs and hospital physicians can help clinical teams design more patient‐centered solutions for care transitions.
The aim of this study is to report older patients' experiences with problems after hospital discharge and their understanding and expectation of communication between hospital physicians and their PCP. We also explored the relationship between patient experiences and whether their PCPs were aware of their hospitalization.
Methods
Study Design
Patients were recruited for this study from February 2008 to July 2008 using the University of Chicago Hospitalist Study, a large ongoing study that interviews hospitalized patients regarding quality of care.1 Two enrollment strategies were used; in order to oversample frail elders, all patients who were defined to be vulnerable elders using the VES‐13, based on age, self‐rated health, and physical function are asked to consent to surveying their PCP about their admission.12 In addition, every tenth hospitalized patient (with medical record number ending in 5) was asked to consent to have his or her PCP surveyed about communication regarding their admission. Patients who could not name a PCP or those patients who named a physician who denied caring for that patient were excluded. The study was approved by the University of Chicago Institutional Review Board.
Inpatient Interview and Chart Review
Within 48 hours of hospitalization, patients were approached by trained research assistants and first asked to complete the telephone version of the Mini‐Mental Status Exam.13 For those patients who scored a 17 or below on this 22‐point instrument, a proxy was approached to consent to the study and complete the interview protocol. Patients or their proxies then completed an inpatient interview to ascertain age, sex, self‐reported race, income, education and place of residence (home, nursing home). Patients were also asked if their PCP is affiliated with the University of Chicago and whether they had been hospitalized in the year prior to admission. Chart reviews were conducted for calculation of length of stay and location of discharge was also obtained (ie, rehabilitation, home, nursing home).
Two‐Week Post‐Discharge Phone Interview
To ascertain patient reports of problems after discharge, we conducted telephone interviews of eligible patients and/or their proxies 2 weeks after discharge. During the telephone interviews, each patient was asked 12 open‐ended questions to facilitate the reporting of events. Interviews were conducted by trained research assistants, who were blinded to whether the PCP was aware of a patient's hospitalization. Questions focused on the patient's perception of the quality and extent of communication that occurred between his or her identified PCP and the inpatient physician who provided his or her care while hospitalized. For example, the patient was asked if his or her PCP was aware of the hospitalization and if so, the patient was also asked: Do you know who told your regular doctor? Patients were asked about their perception of their PCP's knowledge of their clinical course.
Because we were interested in understanding problems after discharge, we used critical incident technique to solicit the patient's experience with these events. This technique was initially developed to study aviation accidents and can broaden our understanding of rare and poorly observed events by using subjective reports of an individual's own experience.14, 15 From the literature, we a priori identified post‐discharge problems including difficulties with follow‐up tests or appointments, medication changes, and readmission. Thus, we asked each patient, Did anything bad or inconvenient happen following your hospital stay, such as problems with new medications, missing a test, going back to the hospital. The interviews were audio‐taped and transcribed for analysis.
PCP Surveys
To supplement the patient‐reported data and to complete our understanding of what communication did or did not take place, the PCP of each enrolled patient was faxed a survey that ascertained PCP awareness of the hospitalization using the yes or no response to the question Were you aware that your patient had been hospitalized? For those patients who successfully completed the interview, PCPs who had not responded to the fax were also called by telephone to ascertain whether they were aware of the hospitalization, when they became aware (during or post hospitalization) and how they came to be aware.
Data Analysis
The qualitative analysis of the patient interview data was performed using Atlas.ti 5.2 (Berlin) software program. The deductive approach was used for post‐discharge problems that had been characterized in prior literature, such as problems with follow up tests, medications, medical errors, and risk of rehospitalization.2, 16 The constant comparative method was used for the emergence of new codes.17 With this inductive method, the interviews were coded with no a priori assumptions, and each incident was characterized during the initial coding process. The incidents were then compared between the interviews to integrate them into themes and categories. This initial coding scheme was developed by a team (VA, JF, MP) from a sample of 5 transcripts. Using these newly emerged codes, the scheme was then applied to the rest of the transcripts (MP). Two new codes emerged from the deductive approach, negative emotions and patient empowerment, which are discussed in detail in the results.
Quantitative data were analyzed using Stata 10.0 (College Station, TX) software. Descriptive statistics were used to tabulate the frequency and percentage that patients reported a post‐discharge problem. A post‐discharge problem was defined by the patient reporting confusion or having problems at discharge with medications, follow‐up tests or appointments. The frequency and percentage for PCP‐reported awareness of the hospitalization was also tabulated. A Fisher's exact test was used to examine the association between post‐discharge problems and PCP awareness of hospitalization. Similar tests were performed to assess the association between new codes and post‐discharge problems. To assess for responder bias, responders and nonresponders were compared using chi‐square tests and t‐tests, where appropriate, to assess for differences in age, race, gender, education, income, admission in the past 12 months, residence, PCP location, mental status, length of stay, and discharge status.
Results
Of the 114 eligible patients recruited between February and July 2008, 64 patient interviews were completed (56%). The average patient age was 73 years. Most patients were female (69%), African American (70%), live at home (75%), and have a PCP located at the University of Chicago (70%). There were also several who were low income (23% below a median yearly income of $15,000), and did not attend any college (52%). These patients had an average length of stay of 5.3 days, nearly half (48%) having been hospitalized in the past year, and 6 patients (9%) required a proxy to complete the interview (Table 1). There were no significant differences between responders and nonresponders with respect to race, gender, education, income, admission in the past 12 months, residence, PCP location, mental status, length of stay, or discharge status. Responders were more likely to be older than nonresponders (73 years [95% confidence interval {CI} 6976 years] vs. 63 years for nonresponders [95% CI 5769 years]; [P < 0.01]).
Forty‐two percent (27) of patients reported experiencing a post‐discharge problem. These 27 patients reported 42 distinct problems, each of which fell into 1 of 5 broad categories (Table 2). The most common of these were patients having difficulty obtaining follow‐up tests or appointments. These patients either had delay in getting, or were unable to get, follow‐up appointments, or follow‐up tests and test results. There were also many patients who needed reevaluation and thus, were either readmitted to the hospital or had to return to the Emergency Department. Another major category was those who had problems getting medication or therapy. For example, one of (the patients) treatment medswas very hard to find and it delayed us giving her her meds. Others reported they were not properly prepared for discharge. Most of these patients did not receive proper discharge materials which then caused other issues. As one proxy reported, The services were supposed to be provided for (the patient) through her social worker, no one has been informed to her being discharged or her being sent home. We have not gotten any services. Lastly, a few patients reported having hospital complications, such as post‐procedural complications, or questions, such as diagnosis questions.0
| Patient Characteristics (n = 64) | n (%) |
|---|---|
| |
| Mean age (year), mean (SD) | 73 15 |
| Female sex | 44 (69) |
| African American | 45 (70) |
| Mini Mental Status Exam score, mean (SD) | 19 5.8 |
| Proxy used for interview | 6 (9) |
| Length of Stay, mean days (SD) | 5.3 6.1 |
| On‐site PCP (University of Chicago) | 45 (70) |
| Hospitalized in the year prior to admission | 31(48) |
| Income | |
| <$15,000 | 15 (23) |
| >$15,000 | 15 (23) |
| Don't know or refused | 34 (53) |
| Residence | |
| Own house or apartment | 48 (75) |
| Relative or friend house or apartment | 6 (9) |
| Nursing home, group home, long term care home | 10 (16) |
| Education | |
| No college | 33 (52) |
| At least some college | 25 (39) |
| Not sure or do not know | 6 (9) |
| Category (n) | Sub‐Category (n) | Representative Incident (Patient) |
|---|---|---|
| ||
| Difficulty obtaining follow‐up (12) | Appointment issues (8) | I had an earlier (follow‐up appointment) with (my PCP) but by me staying at my daughter's I didn't have access to a car. |
| Test issues (4) | I was in a very weakened state, so I was scared to get on the bus by myself (for the appointment for the chest x‐ray)..I'm going to try (to reschedule), because I can't seem to get the phone number. | |
| Needed re‐evaluation (10) | Readmission (7) | They let me come home, and then that morning they said when I got my house I was on the floor. And so that's why I had to go back to the hospital. |
| Return to ER or clinic (3) | I went back to the emergency room after a few weeks of course. | |
| Problems getting treatments (8) | Medication (7) | I had problems getting my medications because they tell me that the medication was so high, but anyway, I didn't get some of my medications. |
| Therapy (1) | I gave (my insurance company) the information sent the information they wanted to them and we thought everything was settledwe wasn't having any problems until I got hospitalized and came home and started trying to get my oxygen. | |
| Not prepared for discharge (8) | Discharge material issues (6) | I needed a copy of his discharge papers from the hospital for insurance purposesThey didn't give me a discharge paper. |
| Not ready to go home (2) | I told them I wasn't ready to leave, they told me I had to go. | |
| Ongoing problem or question after hospitalization (4) | Post‐procedural problem (3) | Now they're finding out all this bleeding but they don't know where I'm bleeding from. |
| Diagnosis questions (1) | I was diagnoseda long time ago and I went 8 years with this death sentence hanging over my headshe ran a battery of tests and they all came up negativenow they're coming up with the fact that I do have hepatitis C. | |
Patients were often uncertain of whether and how communication between the inpatient physician and PCP (Table 3) took place. One patient said, I don't know what the procedure is as far as giving him the message. Does she fax it to him? I don't know She told me that she was going to call and inform him on everything that happened. I don't know anything from there. The second most commonly expressed perception was from patients who assumed good communication had taken place between his or her physicians. This assumption was grounded in a belief that good communication naturally occurred between physicians. For example 1 patient expressed: (doctors) let the other doctors in too. That's the way to take care of stuff. Lastly, many patients expressed the feeling that their physicians were obligated to communicate with each other. As 1 patient reported, I think that they should have let (my PCP) know that I was in the hospital.
| Category (n) | Sub‐Category (n) | Representative Incident (Patient) |
|---|---|---|
| ||
| Patient Perceptions of inpatient physician communication with PCP (80) | Uncertainty or confusion about the communication (63) | I don't know if they spoke to each other over the phone or if they had any kind of communication. |
| Assumption of good communication (24) | Well I thought by me going to the hospital the doctors would let them know I was there because they all doctors. | |
| Obligation to communicate with PCP (16) | I think they should because there are two doctors who are attending me and they should have communication with each other. | |
Two new themes emerged from the inductive analysis (Table 4). Forty‐five percent of patients reported experiencing negative emotions. These negative emotions were most often expressed as frustration or confusion. For example, 1 patient expressed confusion by saying, When I usually have lab work done I have prescription signedmaybe they changed the way of doing it. Now the pharmacy called me. But I'm supposed to have a note or something. Patients who reported a post‐discharge problem were more likely to report negative emotions (67% vs. 26%, P < 0.01). Feelings of empowerment were reported by 31% of patients. Empowerment was expressed most often as the patient being proactive in communicating with the PCP. One patient reported, We informed (my PCP) and we filled in all of the information that we wanted him to know about. Empowerment was also expressed as being proactive in advocating for communication between the inpatient team and the PCP (Table 3). Some patients expressed feeling empowered through the support of a third party, such as a home nurse. In addition, patients who have a third party advocate are more likely to report being empowered. Empowerment was expressed by 26% of patients with no third party advocate compared with 71% of patients with a third party advocate (P = 0.02).
| Category (n) | Sub‐Category (n) | Representative Incident (Patient) |
|---|---|---|
| ||
| Negative emotions (43) | Frustration (28) | you don't have any decision in your own healthcare at all. I think that's terrible. |
| Confusion (15) | there were all sorts of other tests that different doctors whom I never even knew why they wanted to do these things. | |
| Patient empowerment (24) | Patient proactive in physician communication (19) | I made certain that everybody let (PCP) know exactly what I was doing the whole time I was in and out and all of that (63457) I took it upon myself to call (PCP). |
| Has a third party advocate (8) | The only reason [home follow‐up services] found out is because her nurse was concerned enough to call and keep inquiring about how she was doing. | |
| Patient proactive in his or her own healthcare (5) | I am not scared of the doctors and scared to speak up, especially when it comes to my body and my health. | |
From our sample of patients who completed a 2‐week post‐discharge interview, we were able to obtain PCP surveys for 40 (63%) of these patients (Figure 1). Thirty percent (12) of PCPs reported being unaware of the hospitalization. In all but 4 cases, PCPs had communicated with the medical team during hospitalization. Examining the association between PCP knowledge and patient reported post‐discharge problems showed that patients whose PCPs were not aware of the hospitalization were 2 times more likely to report a post‐discharge problem. A post‐discharge problem was reported by 67% of patients whose PCP was not aware of the hospitalization, while a post‐discharge problem was reported by 32% of patients whose PCP was aware (P < 0.05). Six patients reported returning to the ED or being readmitted. Four patients (33%) of PCPs who were unaware of hospitalization reported returning for reevaluation whereas 7% (n = 2) of patients whose PCP was aware of hospitalization reported returning for evaluation (P = 0.055). Interestingly, patients whose PCPs were not aware of the hospitalization reported feeling more empowered (58%) than those patients whose PCP were aware of the hospitalization (21%, P = 0.03). Because of possible confounding (patient report of problems post‐discharge problems may be affected by PCP awareness of hospitalization), we examined whether patients whose PCPs were aware of their hospitalization differed from those that did not. Patients whose PCPs were aware of their hospitalization were often older (75 vs. 69 years old), white (80% white vs. 65% nonwhite) and female (75% female vs. 54% male). While this small sample size prohibits examining for statistical significance, the magnitude of these differences suggests the need for a larger study to examine patient predictors of PCP awareness of hospitalization.
Discussion
In this sample of frail, older hospitalized patients, nearly half reported at least 1 post‐discharge problem. Most patients have perceptions of what communication did or did not take place between their physicians. While most do not understand the communication process, many expect good communication to occur, and feel that physicians are obligated to communicate with each other. However, patients' perceptions of communication highlight that patient expectations are far from the actual practice in some cases. Nearly half of patients reported feeling negative emotions, such as confusion and frustration, and patients were more likely to experience negative emotions when they also reported a post‐discharge problem. One‐third of patients reported feeling empowered. Empowerment was associated with having a third party who helped advocate for them. Paradoxically, patients whose PCP were not aware of their hospitalization were more likely to feel empowered. Lastly, more patients reported a post‐discharge problem when their PCP was not aware of the hospitalization.
Because this is predominantly a qualitative observational study, it is important to consider the mechanism for these findings since we cannot assume causal relationships. The association of negative emotions, like confusion and frustration, with post‐discharge problems could be explained due to additional stress of the problem itself or that a distressed frame of mind is associated with reporting more problems that may have been overlooked otherwise. In addition, the association between patient empowerment and lack of PCP awareness could be due to the fact that patients are forced to assume a more proactive role in contacting their PCP if they feel that their PCP was not aware. It is equally possible that PCP communication is selectively initiated by hospital physicians when the patients are least empowered. For example, our comparison of demographics for patients whose PCP was aware versus those that were not do suggest that patient characteristics might play a role in whether a patient's PCP is contacted. The association between a third party advocate and patient empowerment is likely explained as the third party is able to keep the patient informed and empowered.
This study has implications for efforts to design a more patient‐centered care transition for hospitalized older patients. First, patients and their proxies should be advocates for good communication to avoid the risks of care transitions. Prior interventions such as use of coaches to boost patient empowerment have had positive results for hospitalized older patients. Moreover, hospitals should keep in mind that problems after discharge are common and are linked to negative emotions, which may lower patient satisfaction or increase liability risk. Similarly, these findings also highlight the importance of keeping PCPs aware of patient hospitalization. For example, PCPs that are aware of hospitalization are better prepared to properly follow‐up on medications, tests, and appointments. The PCP can also help to better prepare the patient for discharge and ease the transition for the patient.
There are several limitations to our study. First and foremost, our small sample size limits our ability to examine statistical significance. This study was part of a short planning grant to design interventions to improve communication with PCPs during hospitalization. Efforts are currently underway to design a communication solution and educational intervention to highlight the importance of contacting PCPs during hospitalization. Because these patients were hospitalized on the teaching service, the resident with the guidance of the teaching attending is responsible for communicating with the PCP. The teaching attending was either a generalist, hospitalist, or specialist who routinely had no a priori relationship with patients prior to the hospitalization. Only 53% of patients were reached by telephone which raises the concern for nonresponse bias. Our low response rate highlights the challenge of doing this type of work with recently discharge patients in low income, underserved areas. In comparing responders and nonresponders, the only difference between the 2 groups was that responders were more likely to be older. One possible reason for this difference may be that older people are more likely to be at home and easier to contact over the phone. Similarly, since data were collected through interviews and adverse events were discussed, these results are subject to recall bias. Efforts were made to reduce this by calling within 2 to 3 weeks after discharge. Lastly, these findings are limited by generalizability. All the patients included in this study were from the University of Chicago Medical Center, which serves largely underserved, African American patients. The experiences of these patients may be unique to this site. In addition, we only studied patients who had a PCP, excluding a population of patients that are at inherent risk due to lack of a coordinating physician to guide ongoing care.
In conclusion, this study suggests that many frail, older patients reported experiencing a post‐discharge problem and patients whose PCPs did not know about their admission were more likely to report a post‐discharge problem. Systematic interventions to improve communications with PCPs during patient care transitions in and out of the hospital are needed.
Acknowledgements
The authors thank Ms. Meryl Prochaska for her research assistance and manuscript preparation.
- , , , et al.Effects of physician experience on costs and outcomes on an academic general medicine service: results of a trial of hospitalists.Ann Intern Med.2002;137(11):866–874.
- , .The Hospitalist Movement 5 Years Later.JAMA.2002;287(4):487–494.
- , , , et al.Transitions of Care Consensus Policy Statement American College of Physicians‐Society of General Internal Medicine‐Society of Hospital Medicine‐American Geriatrics Society‐American College of Emergency Physicians‐Society of Academic Emergency Medicine.J Gen Intern Med.2009;24(8):971–976.
- , , , , , .Deficits in Communication and information transfer between hospital‐based and primary care physicians: implications for patient safety and continuity of care.JAMA.2007;297(8):831–841.
- , , , et al.Patient safety concerns arising from test results that return after hospital discharge.Ann Intern Med.2005;143(2):121–131.
- , , , .Maintaining continuity of care: a look at the quality of communication between Ontario emergency departments and community physicians.CJEM.2005;7(3):155–161.
- , , , , .Adverse drug events occuring following hospital discharge.J Gen Intern Med.2005;20(4):317–323.
- , , , , , .Electronically screening discharge summaries for adverse medical events.J Am Med Infrom Assoc.2003;10(4):339–350.
- , , , , .The incidence and severity of adverse events affecting patients after discharge from the hospital.Ann Intern Med.2003;138:161–167.
- , , , et al.Comparing patient‐reported hospital adverse events with the medical record review: do patients know something that hospitals do not?Ann Intern Med.2005;149(2):100–108.
- , , , et al.What can hospitalized patients tell us about adverse events? Learning from the patient‐reported incidents.J Gen Intern Med.2005;20(9):830–836.
- , , , et al.The Vulnerable Elders Survey: a tool for identifying vulnerable older people in the community.J Am Geriatr Soc.2001;49:1691–1699.
- , , , .Validation of a telephone version of the mini‐mental state examination.J Am Geriatr Soc.1992;40(7):697–702.
- .The critical incident technique.Psychol Bull.1954;51(4):327–359.
- .The critical incident technique in service research.J Serv Res.2004;7:65–89.
- , , , .Medical errors related to discontinuity of care from an inpatient to an outpatient setting.J Gen Intern Med.2003;18:646–651.
- .A Purposeful approach to the constant comparative method in the analysis of qualitative interviews.Qual Quant2002;36:3392–3340.
Recently, there has been an increased focus on improving communication during care transitions for older patients as they leave the hospital. One reason for this focus is the increasing utilization of hospitalists, or hospital‐based physicians, caring for patients in the United States.1 As a result, many primary care physicians (PCPs) no longer care for their patients while in the hospital and may not be informed of their patients' hospitalization.2 Additionally, with an emphasis on shorter lengths of hospital stay, more extensive post‐discharge follow‐up is often warranted for patients, which often becomes the responsibility of a patient's PCP. Recently 6 societies (American College of Physicians, Society of General Internal Medicine, Society of Hospital Medicine, American Geriatrics Society, American College of Emergency Physicians, and Society of Academic Emergency Medicine) have recommended that a patient's PCP is notified during all steps in care transitions and that patient‐centered approaches are employed.3 Despite the increased need for improved inpatient‐ambulatory care transitions, the communication between hospitalists and PCPs has been characterized as being poor and ineffective.4 Prior studies have shown that PCPs are not aware of test results that require follow‐up, may not receive timely or high quality discharge materials, and have an overall poor perception of the quality of communication.46 Ensuring adequate communication is considered important due to the increased risk of adverse events that patients experience after discharge from the hospital.79 Furthermore, recent studies have shown that patients are often able to identify and report adverse events that would not be detected by medical record review alone.10, 11 Eliciting patient perspectives on their experiences after discharge and their expectations of communication between PCPs and hospital physicians can help clinical teams design more patient‐centered solutions for care transitions.
The aim of this study is to report older patients' experiences with problems after hospital discharge and their understanding and expectation of communication between hospital physicians and their PCP. We also explored the relationship between patient experiences and whether their PCPs were aware of their hospitalization.
Methods
Study Design
Patients were recruited for this study from February 2008 to July 2008 using the University of Chicago Hospitalist Study, a large ongoing study that interviews hospitalized patients regarding quality of care.1 Two enrollment strategies were used; in order to oversample frail elders, all patients who were defined to be vulnerable elders using the VES‐13, based on age, self‐rated health, and physical function are asked to consent to surveying their PCP about their admission.12 In addition, every tenth hospitalized patient (with medical record number ending in 5) was asked to consent to have his or her PCP surveyed about communication regarding their admission. Patients who could not name a PCP or those patients who named a physician who denied caring for that patient were excluded. The study was approved by the University of Chicago Institutional Review Board.
Inpatient Interview and Chart Review
Within 48 hours of hospitalization, patients were approached by trained research assistants and first asked to complete the telephone version of the Mini‐Mental Status Exam.13 For those patients who scored a 17 or below on this 22‐point instrument, a proxy was approached to consent to the study and complete the interview protocol. Patients or their proxies then completed an inpatient interview to ascertain age, sex, self‐reported race, income, education and place of residence (home, nursing home). Patients were also asked if their PCP is affiliated with the University of Chicago and whether they had been hospitalized in the year prior to admission. Chart reviews were conducted for calculation of length of stay and location of discharge was also obtained (ie, rehabilitation, home, nursing home).
Two‐Week Post‐Discharge Phone Interview
To ascertain patient reports of problems after discharge, we conducted telephone interviews of eligible patients and/or their proxies 2 weeks after discharge. During the telephone interviews, each patient was asked 12 open‐ended questions to facilitate the reporting of events. Interviews were conducted by trained research assistants, who were blinded to whether the PCP was aware of a patient's hospitalization. Questions focused on the patient's perception of the quality and extent of communication that occurred between his or her identified PCP and the inpatient physician who provided his or her care while hospitalized. For example, the patient was asked if his or her PCP was aware of the hospitalization and if so, the patient was also asked: Do you know who told your regular doctor? Patients were asked about their perception of their PCP's knowledge of their clinical course.
Because we were interested in understanding problems after discharge, we used critical incident technique to solicit the patient's experience with these events. This technique was initially developed to study aviation accidents and can broaden our understanding of rare and poorly observed events by using subjective reports of an individual's own experience.14, 15 From the literature, we a priori identified post‐discharge problems including difficulties with follow‐up tests or appointments, medication changes, and readmission. Thus, we asked each patient, Did anything bad or inconvenient happen following your hospital stay, such as problems with new medications, missing a test, going back to the hospital. The interviews were audio‐taped and transcribed for analysis.
PCP Surveys
To supplement the patient‐reported data and to complete our understanding of what communication did or did not take place, the PCP of each enrolled patient was faxed a survey that ascertained PCP awareness of the hospitalization using the yes or no response to the question Were you aware that your patient had been hospitalized? For those patients who successfully completed the interview, PCPs who had not responded to the fax were also called by telephone to ascertain whether they were aware of the hospitalization, when they became aware (during or post hospitalization) and how they came to be aware.
Data Analysis
The qualitative analysis of the patient interview data was performed using Atlas.ti 5.2 (Berlin) software program. The deductive approach was used for post‐discharge problems that had been characterized in prior literature, such as problems with follow up tests, medications, medical errors, and risk of rehospitalization.2, 16 The constant comparative method was used for the emergence of new codes.17 With this inductive method, the interviews were coded with no a priori assumptions, and each incident was characterized during the initial coding process. The incidents were then compared between the interviews to integrate them into themes and categories. This initial coding scheme was developed by a team (VA, JF, MP) from a sample of 5 transcripts. Using these newly emerged codes, the scheme was then applied to the rest of the transcripts (MP). Two new codes emerged from the deductive approach, negative emotions and patient empowerment, which are discussed in detail in the results.
Quantitative data were analyzed using Stata 10.0 (College Station, TX) software. Descriptive statistics were used to tabulate the frequency and percentage that patients reported a post‐discharge problem. A post‐discharge problem was defined by the patient reporting confusion or having problems at discharge with medications, follow‐up tests or appointments. The frequency and percentage for PCP‐reported awareness of the hospitalization was also tabulated. A Fisher's exact test was used to examine the association between post‐discharge problems and PCP awareness of hospitalization. Similar tests were performed to assess the association between new codes and post‐discharge problems. To assess for responder bias, responders and nonresponders were compared using chi‐square tests and t‐tests, where appropriate, to assess for differences in age, race, gender, education, income, admission in the past 12 months, residence, PCP location, mental status, length of stay, and discharge status.
Results
Of the 114 eligible patients recruited between February and July 2008, 64 patient interviews were completed (56%). The average patient age was 73 years. Most patients were female (69%), African American (70%), live at home (75%), and have a PCP located at the University of Chicago (70%). There were also several who were low income (23% below a median yearly income of $15,000), and did not attend any college (52%). These patients had an average length of stay of 5.3 days, nearly half (48%) having been hospitalized in the past year, and 6 patients (9%) required a proxy to complete the interview (Table 1). There were no significant differences between responders and nonresponders with respect to race, gender, education, income, admission in the past 12 months, residence, PCP location, mental status, length of stay, or discharge status. Responders were more likely to be older than nonresponders (73 years [95% confidence interval {CI} 6976 years] vs. 63 years for nonresponders [95% CI 5769 years]; [P < 0.01]).
Forty‐two percent (27) of patients reported experiencing a post‐discharge problem. These 27 patients reported 42 distinct problems, each of which fell into 1 of 5 broad categories (Table 2). The most common of these were patients having difficulty obtaining follow‐up tests or appointments. These patients either had delay in getting, or were unable to get, follow‐up appointments, or follow‐up tests and test results. There were also many patients who needed reevaluation and thus, were either readmitted to the hospital or had to return to the Emergency Department. Another major category was those who had problems getting medication or therapy. For example, one of (the patients) treatment medswas very hard to find and it delayed us giving her her meds. Others reported they were not properly prepared for discharge. Most of these patients did not receive proper discharge materials which then caused other issues. As one proxy reported, The services were supposed to be provided for (the patient) through her social worker, no one has been informed to her being discharged or her being sent home. We have not gotten any services. Lastly, a few patients reported having hospital complications, such as post‐procedural complications, or questions, such as diagnosis questions.0
| Patient Characteristics (n = 64) | n (%) |
|---|---|
| |
| Mean age (year), mean (SD) | 73 15 |
| Female sex | 44 (69) |
| African American | 45 (70) |
| Mini Mental Status Exam score, mean (SD) | 19 5.8 |
| Proxy used for interview | 6 (9) |
| Length of Stay, mean days (SD) | 5.3 6.1 |
| On‐site PCP (University of Chicago) | 45 (70) |
| Hospitalized in the year prior to admission | 31(48) |
| Income | |
| <$15,000 | 15 (23) |
| >$15,000 | 15 (23) |
| Don't know or refused | 34 (53) |
| Residence | |
| Own house or apartment | 48 (75) |
| Relative or friend house or apartment | 6 (9) |
| Nursing home, group home, long term care home | 10 (16) |
| Education | |
| No college | 33 (52) |
| At least some college | 25 (39) |
| Not sure or do not know | 6 (9) |
| Category (n) | Sub‐Category (n) | Representative Incident (Patient) |
|---|---|---|
| ||
| Difficulty obtaining follow‐up (12) | Appointment issues (8) | I had an earlier (follow‐up appointment) with (my PCP) but by me staying at my daughter's I didn't have access to a car. |
| Test issues (4) | I was in a very weakened state, so I was scared to get on the bus by myself (for the appointment for the chest x‐ray)..I'm going to try (to reschedule), because I can't seem to get the phone number. | |
| Needed re‐evaluation (10) | Readmission (7) | They let me come home, and then that morning they said when I got my house I was on the floor. And so that's why I had to go back to the hospital. |
| Return to ER or clinic (3) | I went back to the emergency room after a few weeks of course. | |
| Problems getting treatments (8) | Medication (7) | I had problems getting my medications because they tell me that the medication was so high, but anyway, I didn't get some of my medications. |
| Therapy (1) | I gave (my insurance company) the information sent the information they wanted to them and we thought everything was settledwe wasn't having any problems until I got hospitalized and came home and started trying to get my oxygen. | |
| Not prepared for discharge (8) | Discharge material issues (6) | I needed a copy of his discharge papers from the hospital for insurance purposesThey didn't give me a discharge paper. |
| Not ready to go home (2) | I told them I wasn't ready to leave, they told me I had to go. | |
| Ongoing problem or question after hospitalization (4) | Post‐procedural problem (3) | Now they're finding out all this bleeding but they don't know where I'm bleeding from. |
| Diagnosis questions (1) | I was diagnoseda long time ago and I went 8 years with this death sentence hanging over my headshe ran a battery of tests and they all came up negativenow they're coming up with the fact that I do have hepatitis C. | |
Patients were often uncertain of whether and how communication between the inpatient physician and PCP (Table 3) took place. One patient said, I don't know what the procedure is as far as giving him the message. Does she fax it to him? I don't know She told me that she was going to call and inform him on everything that happened. I don't know anything from there. The second most commonly expressed perception was from patients who assumed good communication had taken place between his or her physicians. This assumption was grounded in a belief that good communication naturally occurred between physicians. For example 1 patient expressed: (doctors) let the other doctors in too. That's the way to take care of stuff. Lastly, many patients expressed the feeling that their physicians were obligated to communicate with each other. As 1 patient reported, I think that they should have let (my PCP) know that I was in the hospital.
| Category (n) | Sub‐Category (n) | Representative Incident (Patient) |
|---|---|---|
| ||
| Patient Perceptions of inpatient physician communication with PCP (80) | Uncertainty or confusion about the communication (63) | I don't know if they spoke to each other over the phone or if they had any kind of communication. |
| Assumption of good communication (24) | Well I thought by me going to the hospital the doctors would let them know I was there because they all doctors. | |
| Obligation to communicate with PCP (16) | I think they should because there are two doctors who are attending me and they should have communication with each other. | |
Two new themes emerged from the inductive analysis (Table 4). Forty‐five percent of patients reported experiencing negative emotions. These negative emotions were most often expressed as frustration or confusion. For example, 1 patient expressed confusion by saying, When I usually have lab work done I have prescription signedmaybe they changed the way of doing it. Now the pharmacy called me. But I'm supposed to have a note or something. Patients who reported a post‐discharge problem were more likely to report negative emotions (67% vs. 26%, P < 0.01). Feelings of empowerment were reported by 31% of patients. Empowerment was expressed most often as the patient being proactive in communicating with the PCP. One patient reported, We informed (my PCP) and we filled in all of the information that we wanted him to know about. Empowerment was also expressed as being proactive in advocating for communication between the inpatient team and the PCP (Table 3). Some patients expressed feeling empowered through the support of a third party, such as a home nurse. In addition, patients who have a third party advocate are more likely to report being empowered. Empowerment was expressed by 26% of patients with no third party advocate compared with 71% of patients with a third party advocate (P = 0.02).
| Category (n) | Sub‐Category (n) | Representative Incident (Patient) |
|---|---|---|
| ||
| Negative emotions (43) | Frustration (28) | you don't have any decision in your own healthcare at all. I think that's terrible. |
| Confusion (15) | there were all sorts of other tests that different doctors whom I never even knew why they wanted to do these things. | |
| Patient empowerment (24) | Patient proactive in physician communication (19) | I made certain that everybody let (PCP) know exactly what I was doing the whole time I was in and out and all of that (63457) I took it upon myself to call (PCP). |
| Has a third party advocate (8) | The only reason [home follow‐up services] found out is because her nurse was concerned enough to call and keep inquiring about how she was doing. | |
| Patient proactive in his or her own healthcare (5) | I am not scared of the doctors and scared to speak up, especially when it comes to my body and my health. | |
From our sample of patients who completed a 2‐week post‐discharge interview, we were able to obtain PCP surveys for 40 (63%) of these patients (Figure 1). Thirty percent (12) of PCPs reported being unaware of the hospitalization. In all but 4 cases, PCPs had communicated with the medical team during hospitalization. Examining the association between PCP knowledge and patient reported post‐discharge problems showed that patients whose PCPs were not aware of the hospitalization were 2 times more likely to report a post‐discharge problem. A post‐discharge problem was reported by 67% of patients whose PCP was not aware of the hospitalization, while a post‐discharge problem was reported by 32% of patients whose PCP was aware (P < 0.05). Six patients reported returning to the ED or being readmitted. Four patients (33%) of PCPs who were unaware of hospitalization reported returning for reevaluation whereas 7% (n = 2) of patients whose PCP was aware of hospitalization reported returning for evaluation (P = 0.055). Interestingly, patients whose PCPs were not aware of the hospitalization reported feeling more empowered (58%) than those patients whose PCP were aware of the hospitalization (21%, P = 0.03). Because of possible confounding (patient report of problems post‐discharge problems may be affected by PCP awareness of hospitalization), we examined whether patients whose PCPs were aware of their hospitalization differed from those that did not. Patients whose PCPs were aware of their hospitalization were often older (75 vs. 69 years old), white (80% white vs. 65% nonwhite) and female (75% female vs. 54% male). While this small sample size prohibits examining for statistical significance, the magnitude of these differences suggests the need for a larger study to examine patient predictors of PCP awareness of hospitalization.
Discussion
In this sample of frail, older hospitalized patients, nearly half reported at least 1 post‐discharge problem. Most patients have perceptions of what communication did or did not take place between their physicians. While most do not understand the communication process, many expect good communication to occur, and feel that physicians are obligated to communicate with each other. However, patients' perceptions of communication highlight that patient expectations are far from the actual practice in some cases. Nearly half of patients reported feeling negative emotions, such as confusion and frustration, and patients were more likely to experience negative emotions when they also reported a post‐discharge problem. One‐third of patients reported feeling empowered. Empowerment was associated with having a third party who helped advocate for them. Paradoxically, patients whose PCP were not aware of their hospitalization were more likely to feel empowered. Lastly, more patients reported a post‐discharge problem when their PCP was not aware of the hospitalization.
Because this is predominantly a qualitative observational study, it is important to consider the mechanism for these findings since we cannot assume causal relationships. The association of negative emotions, like confusion and frustration, with post‐discharge problems could be explained due to additional stress of the problem itself or that a distressed frame of mind is associated with reporting more problems that may have been overlooked otherwise. In addition, the association between patient empowerment and lack of PCP awareness could be due to the fact that patients are forced to assume a more proactive role in contacting their PCP if they feel that their PCP was not aware. It is equally possible that PCP communication is selectively initiated by hospital physicians when the patients are least empowered. For example, our comparison of demographics for patients whose PCP was aware versus those that were not do suggest that patient characteristics might play a role in whether a patient's PCP is contacted. The association between a third party advocate and patient empowerment is likely explained as the third party is able to keep the patient informed and empowered.
This study has implications for efforts to design a more patient‐centered care transition for hospitalized older patients. First, patients and their proxies should be advocates for good communication to avoid the risks of care transitions. Prior interventions such as use of coaches to boost patient empowerment have had positive results for hospitalized older patients. Moreover, hospitals should keep in mind that problems after discharge are common and are linked to negative emotions, which may lower patient satisfaction or increase liability risk. Similarly, these findings also highlight the importance of keeping PCPs aware of patient hospitalization. For example, PCPs that are aware of hospitalization are better prepared to properly follow‐up on medications, tests, and appointments. The PCP can also help to better prepare the patient for discharge and ease the transition for the patient.
There are several limitations to our study. First and foremost, our small sample size limits our ability to examine statistical significance. This study was part of a short planning grant to design interventions to improve communication with PCPs during hospitalization. Efforts are currently underway to design a communication solution and educational intervention to highlight the importance of contacting PCPs during hospitalization. Because these patients were hospitalized on the teaching service, the resident with the guidance of the teaching attending is responsible for communicating with the PCP. The teaching attending was either a generalist, hospitalist, or specialist who routinely had no a priori relationship with patients prior to the hospitalization. Only 53% of patients were reached by telephone which raises the concern for nonresponse bias. Our low response rate highlights the challenge of doing this type of work with recently discharge patients in low income, underserved areas. In comparing responders and nonresponders, the only difference between the 2 groups was that responders were more likely to be older. One possible reason for this difference may be that older people are more likely to be at home and easier to contact over the phone. Similarly, since data were collected through interviews and adverse events were discussed, these results are subject to recall bias. Efforts were made to reduce this by calling within 2 to 3 weeks after discharge. Lastly, these findings are limited by generalizability. All the patients included in this study were from the University of Chicago Medical Center, which serves largely underserved, African American patients. The experiences of these patients may be unique to this site. In addition, we only studied patients who had a PCP, excluding a population of patients that are at inherent risk due to lack of a coordinating physician to guide ongoing care.
In conclusion, this study suggests that many frail, older patients reported experiencing a post‐discharge problem and patients whose PCPs did not know about their admission were more likely to report a post‐discharge problem. Systematic interventions to improve communications with PCPs during patient care transitions in and out of the hospital are needed.
Acknowledgements
The authors thank Ms. Meryl Prochaska for her research assistance and manuscript preparation.
- , , , et al.Effects of physician experience on costs and outcomes on an academic general medicine service: results of a trial of hospitalists.Ann Intern Med.2002;137(11):866–874.
- , .The Hospitalist Movement 5 Years Later.JAMA.2002;287(4):487–494.
- , , , et al.Transitions of Care Consensus Policy Statement American College of Physicians‐Society of General Internal Medicine‐Society of Hospital Medicine‐American Geriatrics Society‐American College of Emergency Physicians‐Society of Academic Emergency Medicine.J Gen Intern Med.2009;24(8):971–976.
- , , , , , .Deficits in Communication and information transfer between hospital‐based and primary care physicians: implications for patient safety and continuity of care.JAMA.2007;297(8):831–841.
- , , , et al.Patient safety concerns arising from test results that return after hospital discharge.Ann Intern Med.2005;143(2):121–131.
- , , , .Maintaining continuity of care: a look at the quality of communication between Ontario emergency departments and community physicians.CJEM.2005;7(3):155–161.
- , , , , .Adverse drug events occuring following hospital discharge.J Gen Intern Med.2005;20(4):317–323.
- , , , , , .Electronically screening discharge summaries for adverse medical events.J Am Med Infrom Assoc.2003;10(4):339–350.
- , , , , .The incidence and severity of adverse events affecting patients after discharge from the hospital.Ann Intern Med.2003;138:161–167.
- , , , et al.Comparing patient‐reported hospital adverse events with the medical record review: do patients know something that hospitals do not?Ann Intern Med.2005;149(2):100–108.
- , , , et al.What can hospitalized patients tell us about adverse events? Learning from the patient‐reported incidents.J Gen Intern Med.2005;20(9):830–836.
- , , , et al.The Vulnerable Elders Survey: a tool for identifying vulnerable older people in the community.J Am Geriatr Soc.2001;49:1691–1699.
- , , , .Validation of a telephone version of the mini‐mental state examination.J Am Geriatr Soc.1992;40(7):697–702.
- .The critical incident technique.Psychol Bull.1954;51(4):327–359.
- .The critical incident technique in service research.J Serv Res.2004;7:65–89.
- , , , .Medical errors related to discontinuity of care from an inpatient to an outpatient setting.J Gen Intern Med.2003;18:646–651.
- .A Purposeful approach to the constant comparative method in the analysis of qualitative interviews.Qual Quant2002;36:3392–3340.
Copyright © 2010 Society of Hospital Medicine
