User login
Improving Teamwork with SIDR
Communication among hospital care providers is critically important to provide safe and effective care.15 Yet, studies in operating rooms, intensive care units (ICUs), and general medical units have revealed widely discrepant views on the quality of collaboration and communication between physicians and nurses.68 Although physicians consistently gave high ratings to the quality of collaboration with nurses, nurses rated the quality of collaboration with physicians relatively poorly.
A significant barrier to communication among providers on patient care units is the fluidity and geographic dispersion of team members.8 Physicians, nurses, and other hospital care providers have difficulty finding a way to discuss the care of their patients in person. Research has shown that nurses and physicians on patient care units do not communicate consistently and frequently are not in agreement about their patients' plans of care9, 10
Interdisciplinary Rounds (IDR) have been used as a means to assemble patient care unit team members and improve collaboration on the plan of care.1114 Prior research has demonstrated improved ratings of collaboration on the part of physicians,13, 14 but the effect of IDR on nurses' ratings of collaboration and teamwork has not been adequately assessed. One IDR study did not assess nurses' perceptions,13 while others used instruments not previously described and/or validated in the literature.12, 14 Regarding more concrete outcomes, research indicates variable effects of IDR on length of stay (LOS) and cost. Although 2 studies documented a reduction in LOS and cost with the use of IDR,12, 13 another study showed no effect.15 Furthermore, prior studies evaluated the use of IDR on resident‐covered teaching services. The effect IDR has on collaboration, LOS, and cost in a nonteaching hospitalist service setting is not known.
This study had 3 aims. The first was to assess the impact of an intervention, Structured Inter‐Disciplinary Rounds (SIDR), on nurses' ratings of collaboration and teamwork. The second was to assess the feasibility and sustainability of the intervention. The third was to assess the impact of the intervention on hospital LOS and cost.
Methods
Setting and Study Design
The study was conducted at Northwestern Memorial Hospital (NMH), an 897‐bed tertiary care teaching hospital in Chicago, IL, and was approved by the Institutional Review Board of Northwestern University. The study was a controlled trial of an intervention, SIDR, on collaboration and teamwork on patient care units. One of 2 similar hospitalist service units was randomly selected for the intervention, while the other served as a control unit. SIDR was implemented in August 2008 and data were collected over a 24 week study period.
Each hospitalist service unit consisted of 30 beds and was equipped with continuous cardiac telemetry monitoring. Units were also identical in structure and staffing of nonphysician personnel. The intervention unit included a heart failure‐hospitalist comanagement service. Patients followed at the Center for Heart Failure in the Bluhm Cardiovascular Institute of Northwestern were preferentially admitted to this service. All other patients were admitted to units based on bed availability in a quasi‐randomized fashion. Hospitalists worked 7 consecutive days while on service and cared for patients primarily on the units involved in this study. Therefore, hospitalists cared for patients on both the intervention and control units during their weeks on service. Hospitalists cared for patients independently without the assistance of resident physicians or mid‐level providers (ie, physician assistants or nurse practitioners).
Intervention
SIDR combined a structured format for communication with a forum for regular interdisciplinary meetings. A working group, consisting of nurses, hospitalists, and the unit pharmacist, social worker, and case manager, met weekly for 12 weeks prior to implementation. The working group determined the optimal timing, frequency, and location for SIDR. Additionally, the working group finalized the content of a structured communication tool (Supporting Information) to be used during SIDR. The structured communication tool was modeled after prior research demonstrating the benefit of daily goals of care forms16, 17 and ensured that important elements of the daily plan of care were discussed. Based on the working group's recommendation, SIDR took place each weekday at 11:00 AM in the unit conference room and lasted approximately 30 minutes. The nurse manager and a unit medical director co‐led rounds each day. SIDR was attended by all nurses and hospitalists caring for patients on the unit, as well as the pharmacist, social worker, and case manager assigned to the unit.
Provider Survey
Nurses working on the intervention and control units during the study period were administered a survey 16 weeks to 20 weeks after implementation of SIDR to assess ratings of collaboration and teamwork. The first portion of the survey was based on previously published surveys assessing teamwork attitudes among providers.6, 7 We asked nurses to rate the quality of communication and collaboration they had experienced with hospitalists using a 5‐point ordinal scale (1 = very low, 2 = low, 3 = adequate, 4 = high, 5 = very high). The second portion of the survey assessed teamwork and safety climate using the teamwork and safety domains of the Safety Attitudes Questionnaire (SAQ) developed by Sexton et al.18 The SAQ is based on previous research in aviation and medicine and has been validated in clinical settings.19, 20 Because hospitalists worked with nurses on both units, and in light of our prior research demonstrating that hospitalists rate the quality of collaboration with nurses highly,8 we did not assess hospitalists' ratings of collaboration. A final portion of the survey assessed nurses' perceptions of whether SIDR improved efficiency of communication, collaboration among team members, and patient care using a 5‐point Likert scale (1 = strongly disagree; 2 = disagree; 3 = neutral; 4 = agree; 5 = strongly agree). Hospitalists also received this portion of the survey at the completion of each clinical rotation. All surveys were administered in a web‐based format using an internet link (
SIDR Characteristics and Attendance
The unit medical director recorded the duration of SIDR, the number of patients on the unit, and the number of patients discussed each day. Attendance for each discipline was also recorded each day during the study period.
Data Analysis
Provider demographic data were obtained from completed surveys and group comparisons were done using chi‐square and t tests. The percentage of nurses on each unit rating of the quality of communication and collaboration with hospitalist physicians as high or very high was compared using chi‐square. Teamwork and safety climate scores were compared using the Mann Whitney U test.
Patient data were obtained from administrative databases for both the control and intervention unit during the study period as well as for the intervention unit in the 24 weeks preceding the study period. Demographic data were compared using chi‐square and t tests. Primary discharge diagnosis ICD‐9 codes were grouped into diagnosis clusters using the Healthcare Cost and Utilization Project system of the Agency for Healthcare Research and Quality.21 Diagnosis clusters were then analyzed using the chi‐square test. Because of case mix differences between patients on the intervention and control units, we analyzed LOS and cost using a concurrent control as well as an historic control. Unadjusted LOS and costs were compared using the Mann Whitney U test. We then conducted multivariable linear regression analyses to assess the impact of SIDR on LOS and cost. To satisfy normality requirements and distribution of residuals, we explored 2 methods of transforming skewed data on LOS and cost: logarithmic conversion and truncation at the mean LOS + 3 standard deviations (SDs). Since both techniques yielded similar results, we chose to present results by using truncation. Covariates for multivariable analyses included age, gender, race, payor, admission source, case‐mix, discharge disposition, presence of ICU stay during hospitalization, and Medicare Severity‐Diagnosis Related Group (MS‐DRG) weight. We used standard errors robust to the clustering of patients within each physician. All analyses were conducted using Stata version 10.0 (College Station, TX).
Results
Characteristics of Providers, Patients, and SIDR
Forty‐nine of 58 (84%) nurses completed the survey. Eighty‐eight of 96 (92%) surveys were completed by hospitalists at the end of their week on service. Hospitalist surveys represented 33 different hospitalists because individuals may have worked on study units more than once during the study period. Nurses were a mean 35.0 10.4 years of age and had been working at the hospital for a mean 5.0 6.3 years. Hospitalists were a mean 32.8 2.8 years of age and had been working at the hospital for a mean 2.6 1.9 years.
Patient characteristics are shown in Table 1. Intervention unit patients were admitted from the Emergency Department slightly more often in the postSIDR period. Patient case mix differed between the control and intervention unit, but was similar when comparing the intervention unit preSIDR and postSIDR. Intervention unit MS‐DRG weight was lower in the postSIDR period.
| Control Unit (n = 815) | Intervention Unit Pre‐SIDR (n = 722) | Intervention Unit Post‐SIDR (n = 684) | P Value for Comparison of Intervention Unit Post‐SIDR vs. Control | P Value for Comparison of Intervention Unit Post‐ vs. Pre‐SIDR | |
|---|---|---|---|---|---|
| |||||
| Mean age, years (SD) | 63.8 (16.0) | 64.2 (16.3) | 64.1 (17.2) | 0.74 | 0.92 |
| Women, n (%) | 403 (49) | 347 (48) | 336 (49) | 0.90 | 0.69 |
| Ethnicity, n (%) | 0.22 | 0.71 | |||
| White | 438 (54) | 350 (48) | 334 (49) | ||
| Black | 269 (33) | 266 (37) | 264 (39) | ||
| Hispanic | 48 (6) | 40 (6) | 34 (5) | ||
| Asian | 6 (1) | 8 (1) | 4 (1) | ||
| Other | 54 (7) | 58 (8) | 48 (7) | ||
| Payor, n (%) | 0.07 | 0.67 | |||
| Medicare | 456 (56) | 436 (60) | 399 (58) | ||
| Private | 261 (32) | 176 (24) | 182 (27) | ||
| Medicaid | 67 (8) | 75 (10) | 65 (10) | ||
| Self pay | 31 (4) | 35 (5) | 38 (6) | ||
| Admission source, n (%) | 0.51 | 0.03 | |||
| Emergency department | 695 (85) | 590 (82) | 593 (87) | ||
| Direct admission | 92 (11) | 99 (14) | 65 (10) | ||
| Transfer | 28 (3) | 33 (5) | 26 (4) | ||
| Case mix, n (%) | |||||
| Congestive heart failure | 78 (10) | 164 (23) | 144 (21) | <0.01 | 0.45 |
| Cardiac dysrhythmia | 167 (20) | 69 (10) | 81 (12) | <0.01 | 0.17 |
| Chest pain | 100 (12) | 47 (7) | 59 (9) | 0.02 | 0.13 |
| Coronary atherosclerosis | 52 (6) | 19 (3) | 19 (3) | <0.01 | 0.87 |
| Hypertension | 24 (3) | 38 (5) | 24 (4) | 0.54 | 0.11 |
| Syncope | 27 (3) | 23 (3) | 26 (4) | 0.61 | 0.53 |
| Fluid or electrolyte disorder | 11 (1) | 25 (3) | 23 (3) | 0.01 | 0.92 |
| Pneumonia | 14 (2) | 13 (2) | 22 (3) | 0.06 | 0.09 |
| Pulmonary heart disease | 16 (2) | 13 (2) | 14 (2) | 0.91 | 0.74 |
| Intervertebral disc or other back problem | 32 (4) | 3 (0) | 6 (1) | <0.01 | 0.28 |
| Other diagnosis | 294 (36) | 308 (43) | 266 (39) | 0.26 | 0.15 |
| Cardiovascular procedure during admission | 151 (19) | 95 (13) | 86 (13) | <0.01 | 0.74 |
| Intensive care unit stay during admission, n (%) | 39 (5) | 44 (6) | 27 (4) | 0.43 | 0.07 |
| Discharge disposition, n (%) | |||||
| Home | 736 (90) | 646 (89) | 610 (89) | 0.88 | 0.82 |
| Skilled nursing facility or rehabilitation | 66 (8) | 61 (8) | 63 (9) | ||
| Other facility | 9 (1) | 11 (2) | 7 (1) | ||
| Expired | 4 (0) | 4 (1) | 4 (1) | ||
| Mean Medicare severity ‐diagnosis related group weight (SD) | 1.08 (0.73) | 1.14 (0.76) | 1.06 (0.72) | 0.61 | 0.04 |
SIDR occurred each weekday (with the exception of holidays) on the intervention unit and lasted a mean 27.7 4.6 minutes. The unit had a mean 27 patients per day and 86% of patients on the unit were discussed each day. Attendance exceeded 85% for each discipline (hospitalists, nurses, and the unit pharmacist, social worker, and case manager).
Ratings of Teamwork and Perceptions of SIDR
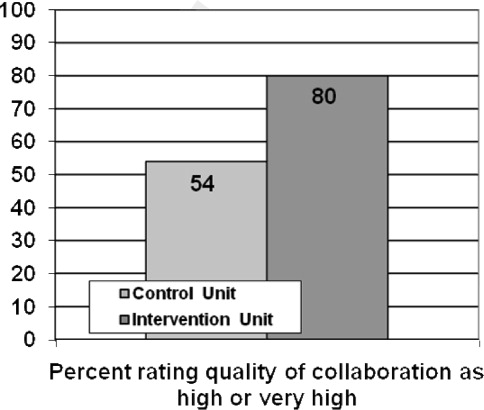
As shown in Figure 1, a larger percentage of nurses rated the quality of communication and collaboration with hospitalists as high or very high on the intervention unit compared to the control unit (80% vs. 54%; P = 0.05).
Nurses' ratings of the teamwork and safety climate are summarized in Table 2. The median teamwork climate score was 85.7 (interquartile range [IQR], 75.092.9) for the intervention unit as compared to 61.6 (IQR, 48.283.9) for the control unit (P = 0.008). The median safety climate score was 75.0 (IQR, 70.581.3) for the intervention unit as compared to 61.1 (IQR, 30.281.3) for the control unit (P = 0.03).
| Control Unit, n = 24 | Intervention Unit, n = 25 | P Value | |
|---|---|---|---|
| |||
| Median Teamwork Climate Score (IQR) | 75.0 (70.581.3) | 61.6 (48.283.9) | 0.008 |
| Median Safety Climate Score (IQR) | 85.7 (75.092.9) | 61.1 (30.281.3) | 0.03 |
Sixty‐five of 88 (74%) hospitalists and 18 of 24 (75%) nurses agreed that SIDR improved the efficiency of their work day. Eighty of 88 (91%) hospitalists and 18 of 24 (75%) nurses agreed that SIDR improved team collaboration. Seventy‐six of 88 (86%) hospitalists and 18 of 24 (75%) nurses agreed that SIDR improved patient care. Sixty‐seven of 88 (76%) hospitalists and 22 of 25 (88%) nurses indicated that they wanted SIDR to continue indefinitely.
SIDR Impact on LOS and Cost
The unadjusted mean LOS was significantly higher for the intervention unit postSIDR as compared to the control unit (4.0 3.4 vs. 3.7 3.3 days; P = 0.03). However, the unadjusted mean LOS was not significantly different for the intervention unit postSIDR as compared to the intervention unit preSIDR (4.0 3.4 vs. 4.26 3.5 days; P = 0.10). The unadjusted cost was lower for the intervention unit postSIDR as compared to the control unit ($7,513.23 7,085.10 vs. $8,588.66 7,381.03; P < 0.001). The unadjusted mean cost was not significantly different for the invention unit postSIDR as compared to the intervention unit preSIDR ($7,513.23 7,085.10 vs. $7,937.00 7,512.23; P = 0.19).
Multivariable analyses of LOS and cost are summarized in Table 3. The adjusted LOS was not significantly different when comparing the intervention unit postSIDR to either the control unit or the intervention unit preSIDR. The adjusted cost for the intervention unit postSIDR was $739.55 less than the control unit (P = 0.02). The adjusted cost was not significantly different when comparing the intervention unit postSIDR to the intervention unit preSIDR.
| Adjusted Difference for Intervention Unit Post‐SIDR vs. Control | P Value for Adjusted Difference for Intervention Unit Post‐SIDR vs. Control | Adjusted Difference for Intervention Unit Post‐ vs. Pre‐SIDR | P Value for Adjusted Difference for Intervention Unit Post‐ vs. Pre‐SIDR | |
|---|---|---|---|---|
| ||||
| Length of stay | 0.05 | 0.75 | 0.04 | 0.83 |
| Cost | 739.55 | 0.02 | 302.94 | 0.34 |
Discussion
We found that nurses working on a unit using SIDR rated the quality of communication and collaboration with hospitalists significantly higher as compared to a control unit. Notably, because hospitalists worked on both the intervention and control unit during their weeks on service, nurses on each unit were rating the quality of collaboration with the same hospitalists. Nurses also rated the teamwork and safety climate higher on the intervention unit. These findings are important because prior research has shown that nurses are often dissatisfied with the quality of collaboration and teamwork with physicians.68 Potential explanations include fundamental differences between nurses and physicians with regard to status/authority, gender, training, and patient care responsibilities.6 Unfortunately, a culture of poor teamwork may lead to a workplace in which team members feel unable to approach certain individuals and uncomfortable raising concerns. Not surprisingly, higher ratings of teamwork culture have been associated with nurse retention.22, 23 SIDR provided a facilitated forum for interdisciplinary discussion, exchange of critical clinical information, and collaboration on the plan of care.
Our findings are also important because poor communication represents a major etiology of preventable adverse events in hospitals.15 Higher ratings of collaboration and teamwork have been associated with better patient outcomes in observational studies.2426 Further research should evaluate the impact of improved interdisciplinary collaboration as a result of SIDR on the safety of care delivered on inpatient medical units.
The majority of providers agreed that SIDR improved patient care and that SIDR should continue indefinitely. Importantly, providers also felt that SIDR improved the efficiency of their workday and attendance was high among all disciplines. Prior studies on IDR either did not report attendance or struggled with attendance.11 Incorporating the input of frontline providers into the design of SIDR allowed us to create a sustainable intervention which fit into daily workflow.
Our bivariate analyses found significant patient case‐mix differences between the intervention and control unit, limiting our ability to perform direct comparisons in LOS and cost. Pre‐post analyses of LOS and cost may be affected by cyclical or secular trends. Because each approach has its own limitations, we felt that analyses using both an historic as well as a concurrent control would provide a more complete assessment of the effect of the intervention. We included case mix, among other variables, in out multivariable regression analyses and found no benefit to SIDR with regard to LOS and cost. Two prior studies have shown a reduction in LOS and cost with the use of IDR.12, 13 However, one study was conducted approximately 15 years ago and included patients with a longer mean LOS.12 The second study used a pre‐post study design which may not have accounted for unmeasured confounders affecting LOS and cost.13 A third, smaller study showed no effect on LOS and cost with the use of IDR.15 No prior study has evaluated the effect of IDR on LOS and cost in a nonteaching hospitalist service setting.
Our study has several limitations. First, our study reflects the experience of an intervention unit compared to a control unit in a single hospital. Larger studies will be required to test the reproducibility and generalizability of our findings. Second, we did not conduct preintervention provider surveys for comparison ratings of collaboration and teamwork. A prior study, conducted by our research group, found that nurses gave low ratings to the teamwork climate and the quality of collaboration with hospitalists.8 Because this baseline study showed consistently low nurse ratings of collaboration and teamwork across all medical units, and because the units in the current study were identical in size, structure, and staffing of nonphysician personnel, we did not repeat nurse surveys prior to the intervention. Third, as previously mentioned, our study did not directly assess the effect of improved teamwork and collaboration on patient safety. Further study is needed to evaluate this. Although we are not aware of any other interventions to improve interdisciplinary communication on the intervention unit, it is possible that other unknown factors contributed to our findings. We believe this is unlikely due to the magnitude of the improvement in collaboration and the high ratings of SIDR by nurses and physicians on the intervention unit.
In summary, SIDR had a positive effect on nurses' ratings of collaboration and teamwork on a nonteaching hospitalist unit. Future research efforts should assess whether improved teamwork as a result of SIDR also translates into safer patient care.
- Joint Commission on Accreditation of Healthcare Organizations. Sentinel Event Statistics. Available at: http://www.jointcommission.org/SentinelEvents/Statistics. Accessed March2010.
- ,,, et al.A look into the nature and causes of human errors in the intensive care unit.Crit Care Med.1995;23(2):294–300.
- ,,, et al.The nature of adverse events in hospitalized patients. Results of the Harvard Medical Practice Study II.N Engl J Med.1991;324(6):377–384.
- ,,.Communication failures: an insidious contributor to medical mishaps.Acad Med.2004;79(2):186–194.
- ,,,,,.The quality in Australian Health Care Study.Med J Aust.1995;163(9):458–471.
- ,,, et al.Operating room teamwork among physicians and nurses: teamwork in the eye of the beholder.J Am Coll Surg.2006;202(5):746–752.
- ,,.Discrepant attitudes about teamwork among critical care nurses and physicians.Crit Care Med.2003;31(3):956–959.
- ,,,,,.Teamwork on inpatient medical units: assessing attitudes and barriers.Qual Saf Health Care2010;19(2):117–121.
- ,,,,,.Can we talk? Priorities for patient care differed among health care providers:AHRQ;2005.
- ,,, et al.Patterns of nurse—physicians communication and agreement on the plan of care.Qual Saf Health Care. In press.
- ,,, et al.The effect of a multidisciplinary hospitalist/physician and advanced practice nurse collaboration on hospital costs.J Nurs Adm.2006;36(2):79–85.
- ,,.A firm trial of interdisciplinary rounds on the inpatient medical wards: an intervention designed using continuous quality improvement.Med Care.1998;36(8 Suppl):AS4–A12.
- ,,,,.Use of multidisciplinary rounds to simultaneously improve quality outcomes, enhance resident education, and shorten length of stay.J Gen Intern Med.2007;22(8):1073–1079.
- ,,,.Effect of a multidisciplinary intervention on communication and collaboration among physicians and nurses.Am J Crit Care.2005;14(1):71–77.
- ,,,.Effects of interdisciplinary rounds on length of stay in a telemetry unit.J Public Health Manag Pract.2004;10(1):63–69.
- ,,,,.Improving nurse‐physician communication and satisfaction in the intensive care unit with a daily goals worksheet.Am J Crit Care.2006;15(2):217–222.
- ,,,,,.Improving communication in the ICU using daily goals.J Crit Care.2003;18(2):71–75.
- ,,, et al.The Safety Attitudes Questionnaire: psychometric properties, benchmarking data, and emerging research.BMC Health Serv Res.2006;6:44.
- ,,,.Safety Climate Survey: reliability of results from a multicenter ICU survey.Qual Saf Health Care.2005;14(4):273–278.
- ,,, et al.Teamwork in the operating room: frontline perspectives among hospitals and operating room personnel.Anesthesiology.2006;105(5):877–884.
- HCUP Clinical Classification Software [computer program]. Version: Agency for Healthcare Research and Quality, Rockville, MD. Available at: http://www.hcup‐us.ahrq.gov/toolssoftware/ccs/ccs.jsp. Accessed March2010.
- ,,.The influence of teamwork culture on physician and nurse resignation rates in hospitals.Health Serv Manage Res.2008;21(1):23–31.
- .Original research: nurse‐physician relationships: impact on nurse satisfaction and retention.Am J Nurs.2002;102(6):26–34.
- ,,, et al.Association between nurse‐physician collaboration and patient outcomes in three intensive care units.Crit Care Med.1999;27(9):1991–1998.
- ,,,,.Risk‐adjusted morbidity in teaching hospitals correlates with reported levels of communication and collaboration on surgical teams but not with scale measures of teamwork climate, safety climate, or working conditions.J Am Coll Surg.2007;205(6):778–784.
- ,,.The link between teamwork and patients' outcomes in intensive care units.Am J Crit Care.2003;12(6):527–534.
Communication among hospital care providers is critically important to provide safe and effective care.15 Yet, studies in operating rooms, intensive care units (ICUs), and general medical units have revealed widely discrepant views on the quality of collaboration and communication between physicians and nurses.68 Although physicians consistently gave high ratings to the quality of collaboration with nurses, nurses rated the quality of collaboration with physicians relatively poorly.
A significant barrier to communication among providers on patient care units is the fluidity and geographic dispersion of team members.8 Physicians, nurses, and other hospital care providers have difficulty finding a way to discuss the care of their patients in person. Research has shown that nurses and physicians on patient care units do not communicate consistently and frequently are not in agreement about their patients' plans of care9, 10
Interdisciplinary Rounds (IDR) have been used as a means to assemble patient care unit team members and improve collaboration on the plan of care.1114 Prior research has demonstrated improved ratings of collaboration on the part of physicians,13, 14 but the effect of IDR on nurses' ratings of collaboration and teamwork has not been adequately assessed. One IDR study did not assess nurses' perceptions,13 while others used instruments not previously described and/or validated in the literature.12, 14 Regarding more concrete outcomes, research indicates variable effects of IDR on length of stay (LOS) and cost. Although 2 studies documented a reduction in LOS and cost with the use of IDR,12, 13 another study showed no effect.15 Furthermore, prior studies evaluated the use of IDR on resident‐covered teaching services. The effect IDR has on collaboration, LOS, and cost in a nonteaching hospitalist service setting is not known.
This study had 3 aims. The first was to assess the impact of an intervention, Structured Inter‐Disciplinary Rounds (SIDR), on nurses' ratings of collaboration and teamwork. The second was to assess the feasibility and sustainability of the intervention. The third was to assess the impact of the intervention on hospital LOS and cost.
Methods
Setting and Study Design
The study was conducted at Northwestern Memorial Hospital (NMH), an 897‐bed tertiary care teaching hospital in Chicago, IL, and was approved by the Institutional Review Board of Northwestern University. The study was a controlled trial of an intervention, SIDR, on collaboration and teamwork on patient care units. One of 2 similar hospitalist service units was randomly selected for the intervention, while the other served as a control unit. SIDR was implemented in August 2008 and data were collected over a 24 week study period.
Each hospitalist service unit consisted of 30 beds and was equipped with continuous cardiac telemetry monitoring. Units were also identical in structure and staffing of nonphysician personnel. The intervention unit included a heart failure‐hospitalist comanagement service. Patients followed at the Center for Heart Failure in the Bluhm Cardiovascular Institute of Northwestern were preferentially admitted to this service. All other patients were admitted to units based on bed availability in a quasi‐randomized fashion. Hospitalists worked 7 consecutive days while on service and cared for patients primarily on the units involved in this study. Therefore, hospitalists cared for patients on both the intervention and control units during their weeks on service. Hospitalists cared for patients independently without the assistance of resident physicians or mid‐level providers (ie, physician assistants or nurse practitioners).
Intervention
SIDR combined a structured format for communication with a forum for regular interdisciplinary meetings. A working group, consisting of nurses, hospitalists, and the unit pharmacist, social worker, and case manager, met weekly for 12 weeks prior to implementation. The working group determined the optimal timing, frequency, and location for SIDR. Additionally, the working group finalized the content of a structured communication tool (Supporting Information) to be used during SIDR. The structured communication tool was modeled after prior research demonstrating the benefit of daily goals of care forms16, 17 and ensured that important elements of the daily plan of care were discussed. Based on the working group's recommendation, SIDR took place each weekday at 11:00 AM in the unit conference room and lasted approximately 30 minutes. The nurse manager and a unit medical director co‐led rounds each day. SIDR was attended by all nurses and hospitalists caring for patients on the unit, as well as the pharmacist, social worker, and case manager assigned to the unit.
Provider Survey
Nurses working on the intervention and control units during the study period were administered a survey 16 weeks to 20 weeks after implementation of SIDR to assess ratings of collaboration and teamwork. The first portion of the survey was based on previously published surveys assessing teamwork attitudes among providers.6, 7 We asked nurses to rate the quality of communication and collaboration they had experienced with hospitalists using a 5‐point ordinal scale (1 = very low, 2 = low, 3 = adequate, 4 = high, 5 = very high). The second portion of the survey assessed teamwork and safety climate using the teamwork and safety domains of the Safety Attitudes Questionnaire (SAQ) developed by Sexton et al.18 The SAQ is based on previous research in aviation and medicine and has been validated in clinical settings.19, 20 Because hospitalists worked with nurses on both units, and in light of our prior research demonstrating that hospitalists rate the quality of collaboration with nurses highly,8 we did not assess hospitalists' ratings of collaboration. A final portion of the survey assessed nurses' perceptions of whether SIDR improved efficiency of communication, collaboration among team members, and patient care using a 5‐point Likert scale (1 = strongly disagree; 2 = disagree; 3 = neutral; 4 = agree; 5 = strongly agree). Hospitalists also received this portion of the survey at the completion of each clinical rotation. All surveys were administered in a web‐based format using an internet link (
SIDR Characteristics and Attendance
The unit medical director recorded the duration of SIDR, the number of patients on the unit, and the number of patients discussed each day. Attendance for each discipline was also recorded each day during the study period.
Data Analysis
Provider demographic data were obtained from completed surveys and group comparisons were done using chi‐square and t tests. The percentage of nurses on each unit rating of the quality of communication and collaboration with hospitalist physicians as high or very high was compared using chi‐square. Teamwork and safety climate scores were compared using the Mann Whitney U test.
Patient data were obtained from administrative databases for both the control and intervention unit during the study period as well as for the intervention unit in the 24 weeks preceding the study period. Demographic data were compared using chi‐square and t tests. Primary discharge diagnosis ICD‐9 codes were grouped into diagnosis clusters using the Healthcare Cost and Utilization Project system of the Agency for Healthcare Research and Quality.21 Diagnosis clusters were then analyzed using the chi‐square test. Because of case mix differences between patients on the intervention and control units, we analyzed LOS and cost using a concurrent control as well as an historic control. Unadjusted LOS and costs were compared using the Mann Whitney U test. We then conducted multivariable linear regression analyses to assess the impact of SIDR on LOS and cost. To satisfy normality requirements and distribution of residuals, we explored 2 methods of transforming skewed data on LOS and cost: logarithmic conversion and truncation at the mean LOS + 3 standard deviations (SDs). Since both techniques yielded similar results, we chose to present results by using truncation. Covariates for multivariable analyses included age, gender, race, payor, admission source, case‐mix, discharge disposition, presence of ICU stay during hospitalization, and Medicare Severity‐Diagnosis Related Group (MS‐DRG) weight. We used standard errors robust to the clustering of patients within each physician. All analyses were conducted using Stata version 10.0 (College Station, TX).
Results
Characteristics of Providers, Patients, and SIDR
Forty‐nine of 58 (84%) nurses completed the survey. Eighty‐eight of 96 (92%) surveys were completed by hospitalists at the end of their week on service. Hospitalist surveys represented 33 different hospitalists because individuals may have worked on study units more than once during the study period. Nurses were a mean 35.0 10.4 years of age and had been working at the hospital for a mean 5.0 6.3 years. Hospitalists were a mean 32.8 2.8 years of age and had been working at the hospital for a mean 2.6 1.9 years.
Patient characteristics are shown in Table 1. Intervention unit patients were admitted from the Emergency Department slightly more often in the postSIDR period. Patient case mix differed between the control and intervention unit, but was similar when comparing the intervention unit preSIDR and postSIDR. Intervention unit MS‐DRG weight was lower in the postSIDR period.
| Control Unit (n = 815) | Intervention Unit Pre‐SIDR (n = 722) | Intervention Unit Post‐SIDR (n = 684) | P Value for Comparison of Intervention Unit Post‐SIDR vs. Control | P Value for Comparison of Intervention Unit Post‐ vs. Pre‐SIDR | |
|---|---|---|---|---|---|
| |||||
| Mean age, years (SD) | 63.8 (16.0) | 64.2 (16.3) | 64.1 (17.2) | 0.74 | 0.92 |
| Women, n (%) | 403 (49) | 347 (48) | 336 (49) | 0.90 | 0.69 |
| Ethnicity, n (%) | 0.22 | 0.71 | |||
| White | 438 (54) | 350 (48) | 334 (49) | ||
| Black | 269 (33) | 266 (37) | 264 (39) | ||
| Hispanic | 48 (6) | 40 (6) | 34 (5) | ||
| Asian | 6 (1) | 8 (1) | 4 (1) | ||
| Other | 54 (7) | 58 (8) | 48 (7) | ||
| Payor, n (%) | 0.07 | 0.67 | |||
| Medicare | 456 (56) | 436 (60) | 399 (58) | ||
| Private | 261 (32) | 176 (24) | 182 (27) | ||
| Medicaid | 67 (8) | 75 (10) | 65 (10) | ||
| Self pay | 31 (4) | 35 (5) | 38 (6) | ||
| Admission source, n (%) | 0.51 | 0.03 | |||
| Emergency department | 695 (85) | 590 (82) | 593 (87) | ||
| Direct admission | 92 (11) | 99 (14) | 65 (10) | ||
| Transfer | 28 (3) | 33 (5) | 26 (4) | ||
| Case mix, n (%) | |||||
| Congestive heart failure | 78 (10) | 164 (23) | 144 (21) | <0.01 | 0.45 |
| Cardiac dysrhythmia | 167 (20) | 69 (10) | 81 (12) | <0.01 | 0.17 |
| Chest pain | 100 (12) | 47 (7) | 59 (9) | 0.02 | 0.13 |
| Coronary atherosclerosis | 52 (6) | 19 (3) | 19 (3) | <0.01 | 0.87 |
| Hypertension | 24 (3) | 38 (5) | 24 (4) | 0.54 | 0.11 |
| Syncope | 27 (3) | 23 (3) | 26 (4) | 0.61 | 0.53 |
| Fluid or electrolyte disorder | 11 (1) | 25 (3) | 23 (3) | 0.01 | 0.92 |
| Pneumonia | 14 (2) | 13 (2) | 22 (3) | 0.06 | 0.09 |
| Pulmonary heart disease | 16 (2) | 13 (2) | 14 (2) | 0.91 | 0.74 |
| Intervertebral disc or other back problem | 32 (4) | 3 (0) | 6 (1) | <0.01 | 0.28 |
| Other diagnosis | 294 (36) | 308 (43) | 266 (39) | 0.26 | 0.15 |
| Cardiovascular procedure during admission | 151 (19) | 95 (13) | 86 (13) | <0.01 | 0.74 |
| Intensive care unit stay during admission, n (%) | 39 (5) | 44 (6) | 27 (4) | 0.43 | 0.07 |
| Discharge disposition, n (%) | |||||
| Home | 736 (90) | 646 (89) | 610 (89) | 0.88 | 0.82 |
| Skilled nursing facility or rehabilitation | 66 (8) | 61 (8) | 63 (9) | ||
| Other facility | 9 (1) | 11 (2) | 7 (1) | ||
| Expired | 4 (0) | 4 (1) | 4 (1) | ||
| Mean Medicare severity ‐diagnosis related group weight (SD) | 1.08 (0.73) | 1.14 (0.76) | 1.06 (0.72) | 0.61 | 0.04 |
SIDR occurred each weekday (with the exception of holidays) on the intervention unit and lasted a mean 27.7 4.6 minutes. The unit had a mean 27 patients per day and 86% of patients on the unit were discussed each day. Attendance exceeded 85% for each discipline (hospitalists, nurses, and the unit pharmacist, social worker, and case manager).
Ratings of Teamwork and Perceptions of SIDR
As shown in Figure 1, a larger percentage of nurses rated the quality of communication and collaboration with hospitalists as high or very high on the intervention unit compared to the control unit (80% vs. 54%; P = 0.05).
Nurses' ratings of the teamwork and safety climate are summarized in Table 2. The median teamwork climate score was 85.7 (interquartile range [IQR], 75.092.9) for the intervention unit as compared to 61.6 (IQR, 48.283.9) for the control unit (P = 0.008). The median safety climate score was 75.0 (IQR, 70.581.3) for the intervention unit as compared to 61.1 (IQR, 30.281.3) for the control unit (P = 0.03).
| Control Unit, n = 24 | Intervention Unit, n = 25 | P Value | |
|---|---|---|---|
| |||
| Median Teamwork Climate Score (IQR) | 75.0 (70.581.3) | 61.6 (48.283.9) | 0.008 |
| Median Safety Climate Score (IQR) | 85.7 (75.092.9) | 61.1 (30.281.3) | 0.03 |
Sixty‐five of 88 (74%) hospitalists and 18 of 24 (75%) nurses agreed that SIDR improved the efficiency of their work day. Eighty of 88 (91%) hospitalists and 18 of 24 (75%) nurses agreed that SIDR improved team collaboration. Seventy‐six of 88 (86%) hospitalists and 18 of 24 (75%) nurses agreed that SIDR improved patient care. Sixty‐seven of 88 (76%) hospitalists and 22 of 25 (88%) nurses indicated that they wanted SIDR to continue indefinitely.
SIDR Impact on LOS and Cost
The unadjusted mean LOS was significantly higher for the intervention unit postSIDR as compared to the control unit (4.0 3.4 vs. 3.7 3.3 days; P = 0.03). However, the unadjusted mean LOS was not significantly different for the intervention unit postSIDR as compared to the intervention unit preSIDR (4.0 3.4 vs. 4.26 3.5 days; P = 0.10). The unadjusted cost was lower for the intervention unit postSIDR as compared to the control unit ($7,513.23 7,085.10 vs. $8,588.66 7,381.03; P < 0.001). The unadjusted mean cost was not significantly different for the invention unit postSIDR as compared to the intervention unit preSIDR ($7,513.23 7,085.10 vs. $7,937.00 7,512.23; P = 0.19).
Multivariable analyses of LOS and cost are summarized in Table 3. The adjusted LOS was not significantly different when comparing the intervention unit postSIDR to either the control unit or the intervention unit preSIDR. The adjusted cost for the intervention unit postSIDR was $739.55 less than the control unit (P = 0.02). The adjusted cost was not significantly different when comparing the intervention unit postSIDR to the intervention unit preSIDR.
| Adjusted Difference for Intervention Unit Post‐SIDR vs. Control | P Value for Adjusted Difference for Intervention Unit Post‐SIDR vs. Control | Adjusted Difference for Intervention Unit Post‐ vs. Pre‐SIDR | P Value for Adjusted Difference for Intervention Unit Post‐ vs. Pre‐SIDR | |
|---|---|---|---|---|
| ||||
| Length of stay | 0.05 | 0.75 | 0.04 | 0.83 |
| Cost | 739.55 | 0.02 | 302.94 | 0.34 |
Discussion
We found that nurses working on a unit using SIDR rated the quality of communication and collaboration with hospitalists significantly higher as compared to a control unit. Notably, because hospitalists worked on both the intervention and control unit during their weeks on service, nurses on each unit were rating the quality of collaboration with the same hospitalists. Nurses also rated the teamwork and safety climate higher on the intervention unit. These findings are important because prior research has shown that nurses are often dissatisfied with the quality of collaboration and teamwork with physicians.68 Potential explanations include fundamental differences between nurses and physicians with regard to status/authority, gender, training, and patient care responsibilities.6 Unfortunately, a culture of poor teamwork may lead to a workplace in which team members feel unable to approach certain individuals and uncomfortable raising concerns. Not surprisingly, higher ratings of teamwork culture have been associated with nurse retention.22, 23 SIDR provided a facilitated forum for interdisciplinary discussion, exchange of critical clinical information, and collaboration on the plan of care.
Our findings are also important because poor communication represents a major etiology of preventable adverse events in hospitals.15 Higher ratings of collaboration and teamwork have been associated with better patient outcomes in observational studies.2426 Further research should evaluate the impact of improved interdisciplinary collaboration as a result of SIDR on the safety of care delivered on inpatient medical units.
The majority of providers agreed that SIDR improved patient care and that SIDR should continue indefinitely. Importantly, providers also felt that SIDR improved the efficiency of their workday and attendance was high among all disciplines. Prior studies on IDR either did not report attendance or struggled with attendance.11 Incorporating the input of frontline providers into the design of SIDR allowed us to create a sustainable intervention which fit into daily workflow.
Our bivariate analyses found significant patient case‐mix differences between the intervention and control unit, limiting our ability to perform direct comparisons in LOS and cost. Pre‐post analyses of LOS and cost may be affected by cyclical or secular trends. Because each approach has its own limitations, we felt that analyses using both an historic as well as a concurrent control would provide a more complete assessment of the effect of the intervention. We included case mix, among other variables, in out multivariable regression analyses and found no benefit to SIDR with regard to LOS and cost. Two prior studies have shown a reduction in LOS and cost with the use of IDR.12, 13 However, one study was conducted approximately 15 years ago and included patients with a longer mean LOS.12 The second study used a pre‐post study design which may not have accounted for unmeasured confounders affecting LOS and cost.13 A third, smaller study showed no effect on LOS and cost with the use of IDR.15 No prior study has evaluated the effect of IDR on LOS and cost in a nonteaching hospitalist service setting.
Our study has several limitations. First, our study reflects the experience of an intervention unit compared to a control unit in a single hospital. Larger studies will be required to test the reproducibility and generalizability of our findings. Second, we did not conduct preintervention provider surveys for comparison ratings of collaboration and teamwork. A prior study, conducted by our research group, found that nurses gave low ratings to the teamwork climate and the quality of collaboration with hospitalists.8 Because this baseline study showed consistently low nurse ratings of collaboration and teamwork across all medical units, and because the units in the current study were identical in size, structure, and staffing of nonphysician personnel, we did not repeat nurse surveys prior to the intervention. Third, as previously mentioned, our study did not directly assess the effect of improved teamwork and collaboration on patient safety. Further study is needed to evaluate this. Although we are not aware of any other interventions to improve interdisciplinary communication on the intervention unit, it is possible that other unknown factors contributed to our findings. We believe this is unlikely due to the magnitude of the improvement in collaboration and the high ratings of SIDR by nurses and physicians on the intervention unit.
In summary, SIDR had a positive effect on nurses' ratings of collaboration and teamwork on a nonteaching hospitalist unit. Future research efforts should assess whether improved teamwork as a result of SIDR also translates into safer patient care.
- Joint Commission on Accreditation of Healthcare Organizations. Sentinel Event Statistics. Available at: http://www.jointcommission.org/SentinelEvents/Statistics. Accessed March2010.
- ,,, et al.A look into the nature and causes of human errors in the intensive care unit.Crit Care Med.1995;23(2):294–300.
- ,,, et al.The nature of adverse events in hospitalized patients. Results of the Harvard Medical Practice Study II.N Engl J Med.1991;324(6):377–384.
- ,,.Communication failures: an insidious contributor to medical mishaps.Acad Med.2004;79(2):186–194.
- ,,,,,.The quality in Australian Health Care Study.Med J Aust.1995;163(9):458–471.
- ,,, et al.Operating room teamwork among physicians and nurses: teamwork in the eye of the beholder.J Am Coll Surg.2006;202(5):746–752.
- ,,.Discrepant attitudes about teamwork among critical care nurses and physicians.Crit Care Med.2003;31(3):956–959.
- ,,,,,.Teamwork on inpatient medical units: assessing attitudes and barriers.Qual Saf Health Care2010;19(2):117–121.
- ,,,,,.Can we talk? Priorities for patient care differed among health care providers:AHRQ;2005.
- ,,, et al.Patterns of nurse—physicians communication and agreement on the plan of care.Qual Saf Health Care. In press.
- ,,, et al.The effect of a multidisciplinary hospitalist/physician and advanced practice nurse collaboration on hospital costs.J Nurs Adm.2006;36(2):79–85.
- ,,.A firm trial of interdisciplinary rounds on the inpatient medical wards: an intervention designed using continuous quality improvement.Med Care.1998;36(8 Suppl):AS4–A12.
- ,,,,.Use of multidisciplinary rounds to simultaneously improve quality outcomes, enhance resident education, and shorten length of stay.J Gen Intern Med.2007;22(8):1073–1079.
- ,,,.Effect of a multidisciplinary intervention on communication and collaboration among physicians and nurses.Am J Crit Care.2005;14(1):71–77.
- ,,,.Effects of interdisciplinary rounds on length of stay in a telemetry unit.J Public Health Manag Pract.2004;10(1):63–69.
- ,,,,.Improving nurse‐physician communication and satisfaction in the intensive care unit with a daily goals worksheet.Am J Crit Care.2006;15(2):217–222.
- ,,,,,.Improving communication in the ICU using daily goals.J Crit Care.2003;18(2):71–75.
- ,,, et al.The Safety Attitudes Questionnaire: psychometric properties, benchmarking data, and emerging research.BMC Health Serv Res.2006;6:44.
- ,,,.Safety Climate Survey: reliability of results from a multicenter ICU survey.Qual Saf Health Care.2005;14(4):273–278.
- ,,, et al.Teamwork in the operating room: frontline perspectives among hospitals and operating room personnel.Anesthesiology.2006;105(5):877–884.
- HCUP Clinical Classification Software [computer program]. Version: Agency for Healthcare Research and Quality, Rockville, MD. Available at: http://www.hcup‐us.ahrq.gov/toolssoftware/ccs/ccs.jsp. Accessed March2010.
- ,,.The influence of teamwork culture on physician and nurse resignation rates in hospitals.Health Serv Manage Res.2008;21(1):23–31.
- .Original research: nurse‐physician relationships: impact on nurse satisfaction and retention.Am J Nurs.2002;102(6):26–34.
- ,,, et al.Association between nurse‐physician collaboration and patient outcomes in three intensive care units.Crit Care Med.1999;27(9):1991–1998.
- ,,,,.Risk‐adjusted morbidity in teaching hospitals correlates with reported levels of communication and collaboration on surgical teams but not with scale measures of teamwork climate, safety climate, or working conditions.J Am Coll Surg.2007;205(6):778–784.
- ,,.The link between teamwork and patients' outcomes in intensive care units.Am J Crit Care.2003;12(6):527–534.
Copyright © 2010 Society of Hospital Medicine

Hospitalist–Care Coordinator Team
Many hospitalists work with clinical coordinators and case managers.13 The descriptions of these roles often overlap4 and commonly include activities such as obtaining medical records, expediting tests and procedures, coordinating the plan of care with other health care providers, assessing postdischarge needs, completing discharge paperwork, and arranging follow‐up visits.2, 5, 6 Despite the potential to improve patient care and hospital efficiency, few studies have formally evaluated the impact of these roles. Moher et al. found that adding a clinical coordinator to a general medical team decreased length of stay (LOS) and improved patient satisfaction.5 However, this study was conducted at a time when the LOS was routinely longer than it is today. Forster et al. found that adding a clinical coordinator to a general medical team resulted in improved patient satisfaction but did not reduce length of stay or risk of adverse events occurring following hospital discharge.6 Both these studies evaluated the impact of adding a clinical coordinator to resident‐covered medical teams. Yet many hospitalists deliver care without residents, limiting the generalizability of the findings from these studies.
To date, no studies have evaluated the impact of clinical coordinators, case managers, or other nonphysician providers on the hospitalist work experience. This is surprising, as hospital medicine group leaders list daily workload and work hours among their top concerns.7 Clinical coordinators have the potential to improve patient care and hospital efficiency while simultaneously improving the experience of the hospitalists with whom they work. We conducted this study to evaluate the impact of a hospitalistcare coordinator team on hospitalist work experience, patient satisfaction, and hospital efficiency.
METHODS
Setting
The study was conducted on the hospitalist service at Northwestern Memorial Hospital (NMH), a 753‐bed hospital in Chicago, Illinois. The hospitalist service is staffed by 5 hospitalists on duty at a time. Hospitalists work without residents and are on service for 7 consecutive days, usually followed by 7 consecutive days off. Daytime admissions are distributed among all hospitalists on duty in a consecutive fashion. A night float hospitalist performs admissions and all cross‐cover activities from 7:00 PM until 7:00 AM. Nighttime admissions are distributed to day hospitalists based on each hospitalist's daily census.
Study Design
Funding was provided by the hospital for a 12‐week study, and hospital administrative leaders collaborated as part of the research team. During each of the 12 weeks from September 2006 through November 2006, half the hospitalists on duty each week were randomly assigned to work with a hospitalist care coordinator (HCC) in a team approach. Hospitalists not assigned to work with a hospitalist care coordinator continued to work in their usual fashion, which included working with unit‐based care coordinators (UCCs). UCCs follow all patients on a 30‐bed medicine unit but generally do not round with physicians. HCCs performed all the activities that UCCs perform but also performed additional key activities (see Table 1) and worked in a team approach with their hospitalist. Unit‐based social workers and discharge planners were available for all hospitalists during the study. During each day patients were admitted consecutively to one of the hospitalists on service, regardless of their assignment to work with or without an HCC. Similarly, night admissions were distributed to hospitalists without regard to their assignment to work with or without an HCC.
| Activity type | Activities performed by both UCCs and HCCs | Additional activities performed by HCCs only |
|---|---|---|
| Care coordination | Document the interdisciplinary plan of care | Ensure collaboration in formulating the plan of care |
| Obtain outside medical records | ||
| Inform staff nurse of stat orders during rounds | ||
| Obtain certain test results (eg, preliminary echo reports) | ||
| Patient and family needs | Address patient and family concerns | Proactively identify and address patient and family concerns |
| Schedule family meetings | ||
| Efficiency of care delivery | Remediate barriers that impede plan of care and/or discharge | Identify barriers that impede plan of care |
| Identify and document avoidable days | Ensure tests are scheduled | |
| Discharge process | Coordinate discharge plans with social work and discharge planner | Schedule and confirm follow‐up appointments |
| Initiate discharge instructions | ||
| Write discharge prescriptionsverified and signed by physician | ||
| Review discharge instructions with patient and/or family |
HospitalistCare Coordinator Team
Four HCCs were used in this study. All 4 were registered nurses with specialized training in case management. Prior to the start of the study, the investigators held meetings with hospitalists and the HCCs to describe this new role, the work flow for the hospitalistcare coordinator team, and work activities appropriate for the HCC. Activities related to the discharge process were emphasized as a key feature of the HCC role. Hospitalists and HCCs were instructed to round together as a team each morning. They were advised to collaborate on the daily plan of care and assign specific activities for each to accomplish. During the study weekly meetings were held with the HCCs, the hospitalists with whom they were finishing the week, and the hospitalists with whom they were scheduled to work during the upcoming week. The purpose of these meetings was to ensure that the work flow and work activities were optimal.
Outcome Measures
At the completion of each week, all hospitalists on service were given an anonymous Web‐based survey designed to assess their satisfaction and perceived work efficiency. Hospitalists were asked to rate the efficiency of various work activities during the preceding week on a 5 point Likert scale (1 = very inefficient, 2 = somewhat inefficient, 3 = neutral, 4 = somewhat efficient, 5 = very efficient). Hospitalists who had worked with an HCC were also asked whether they thought working with an HCC improved their efficiency and increased their job satisfaction. We postulated that patient satisfaction with the discharge process might improve with use of the hospitalistHCC team. Therefore, patient satisfaction was assessed by telephone interviews conducted 714 days after discharge. Because of resource limitations, we were only able to interview patient during the second half of the study. Patients were asked to rate their satisfaction with the clarity of verbal and written discharge instructions as well as their overall satisfaction with hospital discharge using a 10‐point Likert scale (from 1 = least satisfied to 10 = most satisfied). Hospital databases provided information on patient demographics, LOS, and cost.
Data Analysis
All analyses were conducted using Stata version 9.0 (StataCorp LP, College Station, TX). Patient characteristics were compared using chi‐square and t tests. Responses to the hospitalist survey for the weeks when they worked independently and the weeks when they worked as a hospitalistHCC team were compared using the Wilcoxon rank sum test. To adjust for the clustering of responses by physicians (ie, individual physicians completed more than 1 survey), we used linear regression and the cluster option. The results were very similar, and only the P values from the Wilcoxon rank sum test are presented. Unadjusted LOS and cost were compared using the Wilcoxon rank sum test. We also conducted multivariate linear regressions using log‐transformed LOS and log‐transformed cost as dependent variables. The independent variable was the team type (whether patients were cared for by a hospitalistHCC team or a hospitalist working independently); age, sex, ethnicity, payer type, and diagnosis‐related group (DRG) weight were included as covariates, and P values were adjusted for physician clustering. We hypothesized a priori that the HCC would have no effect on the LOS of or cost for patients whose hospitalizations were very short. We therefore conducted secondary analyses in which we eliminated patients with an LOS of 1 day or less.
RESULTS
There were 356 patients cared for by hospitalistHCC teams and 337 patients cared for by control hospitalists. Of the 60 weeks of hospitalist service of the study, hospitalistHCC teams accounted for 31 weeks (52%) and control hospitalists for 29 weeks (48%). Patients cared for by the hospitalistHCC teams were similar in age, sex, ethnicity, payer type, and DRG weight to those cared for by control hospitalists (see Table 2).
| HospitalistHCC team | Control | P value | |
|---|---|---|---|
| n (%) or mean SD | |||
| Patients, n (%) | 356 (51.4%) | 337 (48.6%) | |
| Age (years) | 59.3 18.6 | 59.0 20.1 | .86 |
| Women (%) | 190 (53.4%) | 192 (57.0%) | .34 |
| Ethnicity | .74 | ||
| White | 182 (51.1%) | 174 (51.6%) | |
| Black | 111 (31.2%) | 114 (33.8%) | |
| Hispanic | 23 (6.5%) | 21 (6.2%) | |
| Asian | 5 (1.4%) | 4 (1.2%) | |
| Other | 35 (9.8%) | 24 (7.1%) | |
| Payer | .47 | ||
| Medicare | 177 (49.7%) | 168 (49.9%) | |
| Private | 76 (21.4%) | 69 (20.5%) | |
| Medicaid | 43 (12.1%) | 44 (13.1%) | |
| Capitated | 43 (12.1%) | 31 (9.2%) | |
| Other | 17 (4.8%) | 25 (7.4%) | |
| Diagnosis‐related group weight | 1.1 0.8 | 1.2 0.8 | .31 |
Sixty surveys were completed by hospitalists at the end of their week on service (response rate 100%). Of the 31 responses from hospitalists completing a hospitalistHCC team week, 28 (90%) reported that working with an HCC improved their efficiency and 28 (90%) that working with an HCC improved their job satisfaction. The hospitalists indicated that working with an HCC significantly improved the efficiency of most of their activities (see Table 3). Specifically, activities related to communication with nurses and patients and activities involving discharge planning and execution were improved with the use of an HCC. As would be expected, certain other activities did not improve. For example, there were no differences between the groups in the perceived efficiency of performing histories and physicals or placing admission orders. For activities that were significantly different, the Wilcoxon rank sum test and linear regression analysis adjusting for physician clustering showed identical results.
| HospitalistHCC Team | Control | P value | |
|---|---|---|---|
| Mean score SD* | |||
| |||
| Performing histories and physicals | 3.94 0.77 | 3.93 0.84 | .98 |
| Performing medication reconciliation | 3.35 1.08 | 2.03 1.18 | < .001 |
| Placing admission orders | 3.94 0.73 | 4.00 0.87 | .57 |
| Communicating with nurses | 4.45 0.68 | 3.14 1.09 | < .001 |
| Communicating with consultants | 3.65 0.75 | 3.34 1.04 | .25 |
| Communicating with patients | 4.42 0.62 | 3.62 1.01 | < .001 |
| Communicating with families | 4.32 0.70 | 2.89 1.14 | < .001 |
| Coordinating discharge plans | 4.74 0.51 | 2.76 1.18 | < .001 |
| Making/updating sign‐out | 3.55 0.72 | 3.49 0.83 | .55 |
| Making discharge instructions | 4.29 0.74 | 3.10 1.01 | < .001 |
| Going over discharge instructions | 4.48 0.57 | 2.76 1.15 | < .001 |
| Writing discharge prescriptions | 3.87 0.67 | 2.52 1.21 | < .001 |
| Arranging follow‐up appointments | 4.19 0.75 | 2.03 1.09 | < .001 |
Seventy‐one of 196 eligible patients (36%) completed the discharge satisfaction interview. Of the 71 patients interviewed, 44 (62%) were cared for by hospitalistHCC teams and 27 (38%) were cared for by control hospitalists. Patient satisfaction with the clarity of the verbal and written discharge instructions and overall satisfaction with hospital discharge was similar between the 2 groups (see Table 4).
| HospitalistHCC Team (n = 44) | Control (n = 27) | P value | |
|---|---|---|---|
| Mean score (SD)* | |||
| |||
| Clarity of verbal discharge instructions | 8.86 ( 2.31) | 8.44 ( 2.63) | 0.52 |
| Clarity of written discharge instructions | 8.95 ( 2.30) | 8.93 ( 2.54) | 0.78 |
| Overall satisfaction with hospital discharge | 8.57 ( 2.42) | 8.37 ( 2.90) | 0.94 |
The unadjusted mean LOS for patients cared for by hospitalistHCC teams was 4.70 4.15 days compared with 5.07 3.99 days for patients cared for by control hospitalists (P = .005; see Table 5). The unadjusted mean cost for patients cared for by hospitalistHCC teams was $10,052.96 $11,708.73 compared with $11,703.19 $20,455.78 for patients cared for by control hospitalists (P = .008). In multivariate analysis using age, sex, ethnicity, payer type, and DRG weight as independent variables and adjusting for physician clustering, LOS remained lower for patients cared for by hospitalistHCC teams; however, this result was not statistically significant (0.28 days, P = .17). Similar multivariate regression analysis showed a trend toward lower cost for patients cared for by the hospitalistHCC teams (585.62, P = .15).
| Unadjusted mean (SD) | P value for unadjusted difference* | Adjusted difference with hospitalistHCC team | P value for adjusted difference | |
|---|---|---|---|---|
| ||||
| Length of stay | ||||
| HospitalistHCC teams | 4.70 (4.15) | .005 | 0.28 | .17 |
| Control hospitalists | 5.07 (3.99) | |||
| Cost | ||||
| HospitalistHCC teams | 10,052.96 (11,708.73) | .008 | 585.62 | .15 |
| Control hospitalists | 11,703.19 (20,455.78) | |||
DISCUSSION
Our study found that hospitalists working in a team approach with an HCC rated the efficiency of their daily work and their job satisfaction significantly higher than did control hospitalists. Specific areas of improved efficiency included communication activities and activities related to hospital discharge. A prior study conducted by our group found that hospitalists spend a lot of time on indirect patient care activities such as communication and activities related to the discharge process, while spending relatively little time on direct patient care.8 Improving the efficiency of indirect patient care activities of hospitalists is likely to improve their job satisfaction. The importance of improving hospitalist workload and job satisfaction is underscored by the relatively high number of hospitalists at risk for burnout9 and the growing concern about daily workload among hospital medicine group leaders.7
Patient satisfaction was not significantly affected by the use of the hospitalistHCC team in our study. A priori, we postulated that patient satisfaction with the discharge process might improve with the use of the hospitalistHCC team. We therefore limited survey questions to assessing only satisfaction with hospital discharge rather than other aspects of patient hospital care. A recent study reported that patients rated the quality of discharge instructions significantly lower than they rated the overall quality of their hospital stay.10 However, the patients in our study gave high ratings to both discharge instructions and overall satisfaction with hospital discharge. This may explain why we were unable to detect a difference. Our study was limited by the relatively small number of patients we were able to contact to assess satisfaction. Previous studies evaluating the impact of care coordinators either did not assess patient satisfaction with discharge5 or found no difference in satisfaction with hospital discharge.6
Although our study did not find a difference in patient satisfaction with the discharge process, we believe the hospitalistHCC model has the potential to complement efforts to reduce the risk of adverse events as patients transition out of the hospital. It has been reported that 12% of patients have a preventable or ameliorable adverse event in the period immediately following hospital discharge.11, 12 Although Forster et al. did not find a reduction in the risk of adverse events with the addition of a clinical coordinator to a general medical team, they noted incongruence between the coordinator's role and the outcomes measured.6 Similarly, we would need to modify the role of the HCC from a position designed mainly to improve efficiency to one that complements efforts to improve the quality of the discharge process. Possible ways to enhance the HCC role in this regard include increasing the emphasis on and training in patient education skills. Several recently published articles have emphasized the need to redesign the discharge process in an effort to reduce the risk of adverse events following hospital discharge.1315 A modified HCC role might be an essential feature of a redesigned multidisciplinary discharge process.
We were unable to demonstrate improved efficiency for the hospital. Although LOS and cost were lower for patients cared for by the hospitalistHCC teams, the difference was not statistically significant. One possible explanation for why we did not observe a larger reduction in LOS is that our hospitalist service had a lower‐than‐average patient volume during the study period. The lower volume mirrored an unanticipated dip in hospital volume during the same period. Specifically, our service normally discharges an average of 338 patients per month, but during the study period we discharged an average of 235 patients per month. A potential LOS and cost benefit may have been attenuated by the relatively low volume, as hospitalists had ample time to dedicate to communication and coordination of discharge plans.
Our study had several limitations. It was conducted on a nonteaching hospitalist service at a single site. Hospitalist practices vary widely in their staffing and scheduling models. As previously mentioned, we were only able to perform patient satisfaction surveys during the second half of the study period. In addition, hospitalistHCC team patients made up a larger percentage of the patient survey responses (62%) than did control hospitalist patients (38%). This may have affected our ability to detect differences in satisfaction with the hospital discharge process. As also previously noted, our patient volume was lower than normal during the study period. We believe that a higher volume would have magnified differences in hospitalists' perceived efficiency and perhaps resulted in significant improvements in LOS and cost. Finally, the hospital provided funding for only a 12‐week study. This limited our sample size and the power of the study to detect important differences. It is possible that a larger sample size and/or longer study period may have been able to demonstrate a statistically significant improvement in LOS and cost.
Our findings are of particular importance in light of the persistent concerns about hospitalist workload and job satisfaction. Although many hospitalists work with clinical coordinators and case managers, we believe that having the formal structure of a hospitalistcare coordinator team was the key element to improving hospitalist efficiency and satisfaction. We hope that our study is a precursor to research evaluating models of delivering hospital care and their impact on hospitalist work experience, hospital efficiency, and patient outcomes.
- .Innovations in the management of hospitalized patients.Nurse Pract.2006;Suppl:2–3.
- ,.Hospitalists and case managers: the perfect partnership.Lippincotts Case Manag.2004;9:280–286.
- ,.Productive interdisciplinary team relationships: the hospitalist and the case manager.Lippincotts Case Manag.2006;11:160–164.
- ,,.Care coordinator—blending roles to improve patient outcomes.J Nurs Manage.1997;28:49–52.
- ,,,.Effects of a medical team coordinator on length of hospital stay.Can Med Assoc J.1992;146:511–515.
- ,,, et al.Effect of a nurse team coordinator on outcomes for hospitalized medicine patients.Am J Med.2005;118:1148–1153.
- Society of Hospital Medicine. Available at: http://www.hospitalmedicine.org/Content/NavigationMenu/ResourceCenter/Surveys/Surveys1.htm. Accessed April 2,2007.
- ,,.How hospitalists spend their time: insights on efficiency and safety.J Hosp Med.2006;1:88–93.
- ,,,,.Characteristics and work experiences of hospitalists in the United States.Arch Intern Med.2001;161:851–858.
- ,,,,,.Patient perception of quality in discharge instruction.Patient Educ Couns.2005;59:56–68.
- ,,, et al.Adverse events among medical patient after hospital discharge.Can Med Assoc J.2004;170:345–349.
- ,,,,.The incidence and severity of adverse events affecting patients after discharge from the hospital.Ann Intern Med.2003;138:161–167.
- ,.Lost in transition: challenges and opportunities for improving the quality of transitional care.Ann Intern Med.2004;141:533–536.
- ,,, et al.Transition of care for hospitalized elderly patients—development of a discharge checklist for hospitalists.J Hosp Med.2006;1:354–360.
- ,,, et al. Re‐engineering the hospital discharge—an example of a multifaceted process evaluation. Advances in Patient Safety: From Research to Implementation. Vol.2,Concepts and Methodology. AHRQ publication 05‐0021‐2.Rockville, MD:AHRQ;2005. p379–394.
Many hospitalists work with clinical coordinators and case managers.13 The descriptions of these roles often overlap4 and commonly include activities such as obtaining medical records, expediting tests and procedures, coordinating the plan of care with other health care providers, assessing postdischarge needs, completing discharge paperwork, and arranging follow‐up visits.2, 5, 6 Despite the potential to improve patient care and hospital efficiency, few studies have formally evaluated the impact of these roles. Moher et al. found that adding a clinical coordinator to a general medical team decreased length of stay (LOS) and improved patient satisfaction.5 However, this study was conducted at a time when the LOS was routinely longer than it is today. Forster et al. found that adding a clinical coordinator to a general medical team resulted in improved patient satisfaction but did not reduce length of stay or risk of adverse events occurring following hospital discharge.6 Both these studies evaluated the impact of adding a clinical coordinator to resident‐covered medical teams. Yet many hospitalists deliver care without residents, limiting the generalizability of the findings from these studies.
To date, no studies have evaluated the impact of clinical coordinators, case managers, or other nonphysician providers on the hospitalist work experience. This is surprising, as hospital medicine group leaders list daily workload and work hours among their top concerns.7 Clinical coordinators have the potential to improve patient care and hospital efficiency while simultaneously improving the experience of the hospitalists with whom they work. We conducted this study to evaluate the impact of a hospitalistcare coordinator team on hospitalist work experience, patient satisfaction, and hospital efficiency.
METHODS
Setting
The study was conducted on the hospitalist service at Northwestern Memorial Hospital (NMH), a 753‐bed hospital in Chicago, Illinois. The hospitalist service is staffed by 5 hospitalists on duty at a time. Hospitalists work without residents and are on service for 7 consecutive days, usually followed by 7 consecutive days off. Daytime admissions are distributed among all hospitalists on duty in a consecutive fashion. A night float hospitalist performs admissions and all cross‐cover activities from 7:00 PM until 7:00 AM. Nighttime admissions are distributed to day hospitalists based on each hospitalist's daily census.
Study Design
Funding was provided by the hospital for a 12‐week study, and hospital administrative leaders collaborated as part of the research team. During each of the 12 weeks from September 2006 through November 2006, half the hospitalists on duty each week were randomly assigned to work with a hospitalist care coordinator (HCC) in a team approach. Hospitalists not assigned to work with a hospitalist care coordinator continued to work in their usual fashion, which included working with unit‐based care coordinators (UCCs). UCCs follow all patients on a 30‐bed medicine unit but generally do not round with physicians. HCCs performed all the activities that UCCs perform but also performed additional key activities (see Table 1) and worked in a team approach with their hospitalist. Unit‐based social workers and discharge planners were available for all hospitalists during the study. During each day patients were admitted consecutively to one of the hospitalists on service, regardless of their assignment to work with or without an HCC. Similarly, night admissions were distributed to hospitalists without regard to their assignment to work with or without an HCC.
| Activity type | Activities performed by both UCCs and HCCs | Additional activities performed by HCCs only |
|---|---|---|
| Care coordination | Document the interdisciplinary plan of care | Ensure collaboration in formulating the plan of care |
| Obtain outside medical records | ||
| Inform staff nurse of stat orders during rounds | ||
| Obtain certain test results (eg, preliminary echo reports) | ||
| Patient and family needs | Address patient and family concerns | Proactively identify and address patient and family concerns |
| Schedule family meetings | ||
| Efficiency of care delivery | Remediate barriers that impede plan of care and/or discharge | Identify barriers that impede plan of care |
| Identify and document avoidable days | Ensure tests are scheduled | |
| Discharge process | Coordinate discharge plans with social work and discharge planner | Schedule and confirm follow‐up appointments |
| Initiate discharge instructions | ||
| Write discharge prescriptionsverified and signed by physician | ||
| Review discharge instructions with patient and/or family |
HospitalistCare Coordinator Team
Four HCCs were used in this study. All 4 were registered nurses with specialized training in case management. Prior to the start of the study, the investigators held meetings with hospitalists and the HCCs to describe this new role, the work flow for the hospitalistcare coordinator team, and work activities appropriate for the HCC. Activities related to the discharge process were emphasized as a key feature of the HCC role. Hospitalists and HCCs were instructed to round together as a team each morning. They were advised to collaborate on the daily plan of care and assign specific activities for each to accomplish. During the study weekly meetings were held with the HCCs, the hospitalists with whom they were finishing the week, and the hospitalists with whom they were scheduled to work during the upcoming week. The purpose of these meetings was to ensure that the work flow and work activities were optimal.
Outcome Measures
At the completion of each week, all hospitalists on service were given an anonymous Web‐based survey designed to assess their satisfaction and perceived work efficiency. Hospitalists were asked to rate the efficiency of various work activities during the preceding week on a 5 point Likert scale (1 = very inefficient, 2 = somewhat inefficient, 3 = neutral, 4 = somewhat efficient, 5 = very efficient). Hospitalists who had worked with an HCC were also asked whether they thought working with an HCC improved their efficiency and increased their job satisfaction. We postulated that patient satisfaction with the discharge process might improve with use of the hospitalistHCC team. Therefore, patient satisfaction was assessed by telephone interviews conducted 714 days after discharge. Because of resource limitations, we were only able to interview patient during the second half of the study. Patients were asked to rate their satisfaction with the clarity of verbal and written discharge instructions as well as their overall satisfaction with hospital discharge using a 10‐point Likert scale (from 1 = least satisfied to 10 = most satisfied). Hospital databases provided information on patient demographics, LOS, and cost.
Data Analysis
All analyses were conducted using Stata version 9.0 (StataCorp LP, College Station, TX). Patient characteristics were compared using chi‐square and t tests. Responses to the hospitalist survey for the weeks when they worked independently and the weeks when they worked as a hospitalistHCC team were compared using the Wilcoxon rank sum test. To adjust for the clustering of responses by physicians (ie, individual physicians completed more than 1 survey), we used linear regression and the cluster option. The results were very similar, and only the P values from the Wilcoxon rank sum test are presented. Unadjusted LOS and cost were compared using the Wilcoxon rank sum test. We also conducted multivariate linear regressions using log‐transformed LOS and log‐transformed cost as dependent variables. The independent variable was the team type (whether patients were cared for by a hospitalistHCC team or a hospitalist working independently); age, sex, ethnicity, payer type, and diagnosis‐related group (DRG) weight were included as covariates, and P values were adjusted for physician clustering. We hypothesized a priori that the HCC would have no effect on the LOS of or cost for patients whose hospitalizations were very short. We therefore conducted secondary analyses in which we eliminated patients with an LOS of 1 day or less.
RESULTS
There were 356 patients cared for by hospitalistHCC teams and 337 patients cared for by control hospitalists. Of the 60 weeks of hospitalist service of the study, hospitalistHCC teams accounted for 31 weeks (52%) and control hospitalists for 29 weeks (48%). Patients cared for by the hospitalistHCC teams were similar in age, sex, ethnicity, payer type, and DRG weight to those cared for by control hospitalists (see Table 2).
| HospitalistHCC team | Control | P value | |
|---|---|---|---|
| n (%) or mean SD | |||
| Patients, n (%) | 356 (51.4%) | 337 (48.6%) | |
| Age (years) | 59.3 18.6 | 59.0 20.1 | .86 |
| Women (%) | 190 (53.4%) | 192 (57.0%) | .34 |
| Ethnicity | .74 | ||
| White | 182 (51.1%) | 174 (51.6%) | |
| Black | 111 (31.2%) | 114 (33.8%) | |
| Hispanic | 23 (6.5%) | 21 (6.2%) | |
| Asian | 5 (1.4%) | 4 (1.2%) | |
| Other | 35 (9.8%) | 24 (7.1%) | |
| Payer | .47 | ||
| Medicare | 177 (49.7%) | 168 (49.9%) | |
| Private | 76 (21.4%) | 69 (20.5%) | |
| Medicaid | 43 (12.1%) | 44 (13.1%) | |
| Capitated | 43 (12.1%) | 31 (9.2%) | |
| Other | 17 (4.8%) | 25 (7.4%) | |
| Diagnosis‐related group weight | 1.1 0.8 | 1.2 0.8 | .31 |
Sixty surveys were completed by hospitalists at the end of their week on service (response rate 100%). Of the 31 responses from hospitalists completing a hospitalistHCC team week, 28 (90%) reported that working with an HCC improved their efficiency and 28 (90%) that working with an HCC improved their job satisfaction. The hospitalists indicated that working with an HCC significantly improved the efficiency of most of their activities (see Table 3). Specifically, activities related to communication with nurses and patients and activities involving discharge planning and execution were improved with the use of an HCC. As would be expected, certain other activities did not improve. For example, there were no differences between the groups in the perceived efficiency of performing histories and physicals or placing admission orders. For activities that were significantly different, the Wilcoxon rank sum test and linear regression analysis adjusting for physician clustering showed identical results.
| HospitalistHCC Team | Control | P value | |
|---|---|---|---|
| Mean score SD* | |||
| |||
| Performing histories and physicals | 3.94 0.77 | 3.93 0.84 | .98 |
| Performing medication reconciliation | 3.35 1.08 | 2.03 1.18 | < .001 |
| Placing admission orders | 3.94 0.73 | 4.00 0.87 | .57 |
| Communicating with nurses | 4.45 0.68 | 3.14 1.09 | < .001 |
| Communicating with consultants | 3.65 0.75 | 3.34 1.04 | .25 |
| Communicating with patients | 4.42 0.62 | 3.62 1.01 | < .001 |
| Communicating with families | 4.32 0.70 | 2.89 1.14 | < .001 |
| Coordinating discharge plans | 4.74 0.51 | 2.76 1.18 | < .001 |
| Making/updating sign‐out | 3.55 0.72 | 3.49 0.83 | .55 |
| Making discharge instructions | 4.29 0.74 | 3.10 1.01 | < .001 |
| Going over discharge instructions | 4.48 0.57 | 2.76 1.15 | < .001 |
| Writing discharge prescriptions | 3.87 0.67 | 2.52 1.21 | < .001 |
| Arranging follow‐up appointments | 4.19 0.75 | 2.03 1.09 | < .001 |
Seventy‐one of 196 eligible patients (36%) completed the discharge satisfaction interview. Of the 71 patients interviewed, 44 (62%) were cared for by hospitalistHCC teams and 27 (38%) were cared for by control hospitalists. Patient satisfaction with the clarity of the verbal and written discharge instructions and overall satisfaction with hospital discharge was similar between the 2 groups (see Table 4).
| HospitalistHCC Team (n = 44) | Control (n = 27) | P value | |
|---|---|---|---|
| Mean score (SD)* | |||
| |||
| Clarity of verbal discharge instructions | 8.86 ( 2.31) | 8.44 ( 2.63) | 0.52 |
| Clarity of written discharge instructions | 8.95 ( 2.30) | 8.93 ( 2.54) | 0.78 |
| Overall satisfaction with hospital discharge | 8.57 ( 2.42) | 8.37 ( 2.90) | 0.94 |
The unadjusted mean LOS for patients cared for by hospitalistHCC teams was 4.70 4.15 days compared with 5.07 3.99 days for patients cared for by control hospitalists (P = .005; see Table 5). The unadjusted mean cost for patients cared for by hospitalistHCC teams was $10,052.96 $11,708.73 compared with $11,703.19 $20,455.78 for patients cared for by control hospitalists (P = .008). In multivariate analysis using age, sex, ethnicity, payer type, and DRG weight as independent variables and adjusting for physician clustering, LOS remained lower for patients cared for by hospitalistHCC teams; however, this result was not statistically significant (0.28 days, P = .17). Similar multivariate regression analysis showed a trend toward lower cost for patients cared for by the hospitalistHCC teams (585.62, P = .15).
| Unadjusted mean (SD) | P value for unadjusted difference* | Adjusted difference with hospitalistHCC team | P value for adjusted difference | |
|---|---|---|---|---|
| ||||
| Length of stay | ||||
| HospitalistHCC teams | 4.70 (4.15) | .005 | 0.28 | .17 |
| Control hospitalists | 5.07 (3.99) | |||
| Cost | ||||
| HospitalistHCC teams | 10,052.96 (11,708.73) | .008 | 585.62 | .15 |
| Control hospitalists | 11,703.19 (20,455.78) | |||
DISCUSSION
Our study found that hospitalists working in a team approach with an HCC rated the efficiency of their daily work and their job satisfaction significantly higher than did control hospitalists. Specific areas of improved efficiency included communication activities and activities related to hospital discharge. A prior study conducted by our group found that hospitalists spend a lot of time on indirect patient care activities such as communication and activities related to the discharge process, while spending relatively little time on direct patient care.8 Improving the efficiency of indirect patient care activities of hospitalists is likely to improve their job satisfaction. The importance of improving hospitalist workload and job satisfaction is underscored by the relatively high number of hospitalists at risk for burnout9 and the growing concern about daily workload among hospital medicine group leaders.7
Patient satisfaction was not significantly affected by the use of the hospitalistHCC team in our study. A priori, we postulated that patient satisfaction with the discharge process might improve with the use of the hospitalistHCC team. We therefore limited survey questions to assessing only satisfaction with hospital discharge rather than other aspects of patient hospital care. A recent study reported that patients rated the quality of discharge instructions significantly lower than they rated the overall quality of their hospital stay.10 However, the patients in our study gave high ratings to both discharge instructions and overall satisfaction with hospital discharge. This may explain why we were unable to detect a difference. Our study was limited by the relatively small number of patients we were able to contact to assess satisfaction. Previous studies evaluating the impact of care coordinators either did not assess patient satisfaction with discharge5 or found no difference in satisfaction with hospital discharge.6
Although our study did not find a difference in patient satisfaction with the discharge process, we believe the hospitalistHCC model has the potential to complement efforts to reduce the risk of adverse events as patients transition out of the hospital. It has been reported that 12% of patients have a preventable or ameliorable adverse event in the period immediately following hospital discharge.11, 12 Although Forster et al. did not find a reduction in the risk of adverse events with the addition of a clinical coordinator to a general medical team, they noted incongruence between the coordinator's role and the outcomes measured.6 Similarly, we would need to modify the role of the HCC from a position designed mainly to improve efficiency to one that complements efforts to improve the quality of the discharge process. Possible ways to enhance the HCC role in this regard include increasing the emphasis on and training in patient education skills. Several recently published articles have emphasized the need to redesign the discharge process in an effort to reduce the risk of adverse events following hospital discharge.1315 A modified HCC role might be an essential feature of a redesigned multidisciplinary discharge process.
We were unable to demonstrate improved efficiency for the hospital. Although LOS and cost were lower for patients cared for by the hospitalistHCC teams, the difference was not statistically significant. One possible explanation for why we did not observe a larger reduction in LOS is that our hospitalist service had a lower‐than‐average patient volume during the study period. The lower volume mirrored an unanticipated dip in hospital volume during the same period. Specifically, our service normally discharges an average of 338 patients per month, but during the study period we discharged an average of 235 patients per month. A potential LOS and cost benefit may have been attenuated by the relatively low volume, as hospitalists had ample time to dedicate to communication and coordination of discharge plans.
Our study had several limitations. It was conducted on a nonteaching hospitalist service at a single site. Hospitalist practices vary widely in their staffing and scheduling models. As previously mentioned, we were only able to perform patient satisfaction surveys during the second half of the study period. In addition, hospitalistHCC team patients made up a larger percentage of the patient survey responses (62%) than did control hospitalist patients (38%). This may have affected our ability to detect differences in satisfaction with the hospital discharge process. As also previously noted, our patient volume was lower than normal during the study period. We believe that a higher volume would have magnified differences in hospitalists' perceived efficiency and perhaps resulted in significant improvements in LOS and cost. Finally, the hospital provided funding for only a 12‐week study. This limited our sample size and the power of the study to detect important differences. It is possible that a larger sample size and/or longer study period may have been able to demonstrate a statistically significant improvement in LOS and cost.
Our findings are of particular importance in light of the persistent concerns about hospitalist workload and job satisfaction. Although many hospitalists work with clinical coordinators and case managers, we believe that having the formal structure of a hospitalistcare coordinator team was the key element to improving hospitalist efficiency and satisfaction. We hope that our study is a precursor to research evaluating models of delivering hospital care and their impact on hospitalist work experience, hospital efficiency, and patient outcomes.
- .Innovations in the management of hospitalized patients.Nurse Pract.2006;Suppl:2–3.
- ,.Hospitalists and case managers: the perfect partnership.Lippincotts Case Manag.2004;9:280–286.
- ,.Productive interdisciplinary team relationships: the hospitalist and the case manager.Lippincotts Case Manag.2006;11:160–164.
- ,,.Care coordinator—blending roles to improve patient outcomes.J Nurs Manage.1997;28:49–52.
- ,,,.Effects of a medical team coordinator on length of hospital stay.Can Med Assoc J.1992;146:511–515.
- ,,, et al.Effect of a nurse team coordinator on outcomes for hospitalized medicine patients.Am J Med.2005;118:1148–1153.
- Society of Hospital Medicine. Available at: http://www.hospitalmedicine.org/Content/NavigationMenu/ResourceCenter/Surveys/Surveys1.htm. Accessed April 2,2007.
- ,,.How hospitalists spend their time: insights on efficiency and safety.J Hosp Med.2006;1:88–93.
- ,,,,.Characteristics and work experiences of hospitalists in the United States.Arch Intern Med.2001;161:851–858.
- ,,,,,.Patient perception of quality in discharge instruction.Patient Educ Couns.2005;59:56–68.
- ,,, et al.Adverse events among medical patient after hospital discharge.Can Med Assoc J.2004;170:345–349.
- ,,,,.The incidence and severity of adverse events affecting patients after discharge from the hospital.Ann Intern Med.2003;138:161–167.
- ,.Lost in transition: challenges and opportunities for improving the quality of transitional care.Ann Intern Med.2004;141:533–536.
- ,,, et al.Transition of care for hospitalized elderly patients—development of a discharge checklist for hospitalists.J Hosp Med.2006;1:354–360.
- ,,, et al. Re‐engineering the hospital discharge—an example of a multifaceted process evaluation. Advances in Patient Safety: From Research to Implementation. Vol.2,Concepts and Methodology. AHRQ publication 05‐0021‐2.Rockville, MD:AHRQ;2005. p379–394.
Copyright © 2008 Society of Hospital Medicine