User login
Mortality Due to Elevated Troponin
Acute coronary syndromes (ACS) are potentially lethal and present with a wide variety of symptoms. As such, physicians frequently order cardiac biomarkers, such as cardiac troponin, for patients with acute complaints. Elevated troponin is associated with higher risk of mortality regardless of the causes, which can be myriad, both chronic and acute.[1] Among patients with an elevated troponin, distinguishing ACS from non‐ACS can be challenging.
Making the distinction between ACS and non‐ACS troponin elevation is crucial because the underlying pathophysiology and subsequent management strategies are markedly different.[2] According to evidence‐based practice guidelines, ACS is managed with antiplatelet drugs, statins, and percutaneous coronary intervention, improving clinical outcomes.[3] In contrast, care for patients with non‐ACS troponin elevations is usually supportive, with a focus on the underlying conditions. The lack of specific treatment options for such patients is concerning given that several series have suggested that non‐ACS troponin patients may have a higher mortality risk than ACS patients.[4, 5, 6] Non‐ACS troponin elevation can be the result of a multitude of conditions.[7, 8] What remains unclear at this point is whether the excess mortality observed with non‐ACS troponin elevation is due to myocardial damage or to the underlying conditions that predispose to troponin release.
Using data from a quality improvement (QI) project collected at our Veterans Affairs (VA) medical center, we investigated the mortality risk associated with ACS and non‐ACS troponin elevation including an analysis of factors associated with mortality. We hypothesized that non‐ACS troponin elevation will have a higher mortality risk than troponin elevation due to ACS, and that important contributors to this relationship could be identified to provide direction for future investigation directed at modifying this mortality risk.
METHODS
We analyzed data that were prospectively collected for a quality initiative between 2006 and 2007. The project was a collaborative endeavor between cardiology, hospital medicine, and emergency medicine with the process goal of better identifying patients with ACS to hopefully improve outcomes. The QI team was consulted in real time to assist with treatment recommendations; no retrospective decisions were made regarding whether or not ACS was present. As the goal of the project was to improve cardiovascular outcomes, consultative advice was freely provided, and no physicians or teams were subject to any adverse repercussions for their diagnoses or management decisions.
A cardiologist‐led team was created to improve quality of care for myocardial infarction patients by evaluating all patients at our facility with an elevated troponin. On a daily basis, a specialist clinical coordinator (nurse practitioner or physician assistant) received a list of all patients with elevated troponin from the chemistry lab. The coordinator reviewed the patients' medical records with a cardiologist. A positive troponin was defined as a troponin T level of greater than 0.03 ng/mL (99th percentile at our facility). Each attending cardiologist prospectively determined if troponin elevation was related to clinical findings consistent with an ACS based on review of the patients' symptoms (duration, quality, severity, chronicity, and alleviating/aggravating factors), medical history, and noninvasive cardiac testing including electrocardiograms, cardiac biomarkers, and any other available imaging tests.
We have previously demonstrated that the cardiologists at our facility have a similar rate of diagnosing ACS.[9] All cardiologists at our facility maintain current American Board of Internal Medicine certification in cardiovascular disease and have academic appointments at the University of Florida College of Medicine. All patients were followed prospectively, and data on their medical history, acute evaluation, and outcomes were tracked in an electronic database. Given the higher risk of mortality with ST‐elevation myocardial infarction, such patients were excluded from this investigation. By definition, patients with unstable angina do not have elevated biomarkers and thus would not have been included in the database to begin with. Prospectively recorded data elements included: age, gender, chief complaint, tobacco use, presence of hypertension, hyperlipidemia, prior coronary disease, chronic kidney disease, diabetes mellitus, cardiac troponin values, serum creatinine, electrocardiogram (ECG) variables, Thrombolysis in Myocardial Infarction (TIMI) score, and if the patient was placed under hospice care or an active do‐not‐resuscitate (DNR) order. Additional data elements gathered at a later date included maximum temperature, white blood cell count, N‐terminal pro‐brain natriuretic peptide (NT‐proBNP), administration of advanced cardiac life support (ACLS), and admission to an intensive care unit (ICU). All consecutive patients with elevated troponin were included in the database; if patients were included more than once, we used their index evaluation only. All patients with troponin elevation after revascularization (percutaneous coronary intervention or coronary bypass surgery) were excluded. Our investigational design was reviewed by our institutional review board, who waived the requirement for formal written informed consent and approved use of data from this QI project for research purposes.
We focused this investigation on an analysis of all‐cause mortality in February 2014. We analyzed mortality at 30 days, 1 year, and 6 years. As secondary outcomes we analyzed the likelihood of the patients' chief complaint for the diagnosis of ACS and evaluated predictors of mortality based on Cox proportional hazard modeling. Mortality within the VA system is reliably tracked and compares favorably to the Social Security National Death Index Master File for accuracy.[10, 11]
Categorical variables were compared by 2 test. The Student t test was used to compare normally distributed continuous variables, and nonparametric tests were used for non‐normal distributions as appropriate. Mortality data at 30 days, 1 year, and 6 years were compared by log‐rank test and Kaplan‐Meier graphs. A formal power analysis was not performed; the entire available population was included. A Cox proportional hazard model was created to estimate mortality risk at each time point. Variables included in our Cox regression model were age, gender, history of coronary artery disease (CAD), hypertension, diabetes mellitus or hyperlipidemia, ACS diagnosis, dynamic ECG changes, TIMI risk score, initial troponin level, creatinine level at time of initial troponin (per mg/dL), presence of fever, maximum white blood cell count, NT‐proBNP level (per 1000 pg/mL), if ACLS was performed, if the patient was under hospice care, if there was a DNR order, and if they required ICU admission. This model was also constructed independently for the ACS and non‐ACS cohorts for mortality at 1 year. A forward stepwise model was used. Statistical results were considered significant at P < 0.05. Statistical analyses were performed using SPSS version 21 (IBM, Armonk, NY).
RESULTS
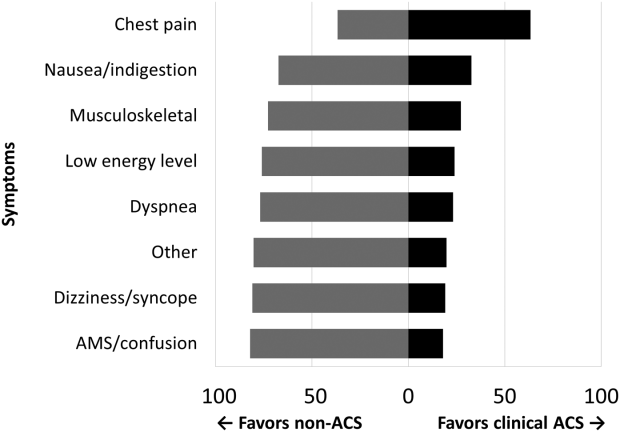
Among the 761 patients, 502 (66.0%) were classified as non‐ACS and 259 (34.0%) as ACS (Table 1). The mean age was higher in the non‐ACS group (71 years vs 69 years in the ACS group, P = 0.006). Hypertension, diabetes mellitus, and prior CAD were frequent in both groups and not significantly different. Median initial troponin T was higher in the ACS group (0.12 ng/mL vs 0.06 ng/mL, P < 0.001) as were the frequency of a TIMI risk score >2 (92.5% vs 74.3%, P < 0.001) and new ECG changes (29.7% vs 8.2%, P < 0.001). Hospice, DNR orders, and administration of ACLS were not different between groups; however, admission to the ICU was more frequent in the ACS group (44.8% vs 31.9%, P < 0.001). Chest pain was the symptom with the highest positive predictive value for the diagnosis of ACS (63.3%), whereas the least predictive was altered mental status or confusion (18.0%) (Figure 1).
| Non‐ACS, N = 502 | ACS, N = 259 | P Value | |
|---|---|---|---|
| |||
| Baseline characteristics, n (%) | |||
| Age, y | 71 11 | 69 11 | 0.006 |
| Female | 6 (1.2%) | 1 (0.4%) | 0.27 |
| Coronary artery disease | 244 (48.6%) | 141 (54.4%) | 0.13 |
| Hypertension | 381 (75.9%) | 203 (78.4%) | 0.44 |
| Diabetes mellitus | 220 (43.8%) | 119 (45.9%) | 0.58 |
| Hyperlipidemia | 268 (53.4%) | 170 (65.6%) | 0.001 |
| Current smoker | 24 (4.8%) | 49 (18.9%) | <0.001 |
| Clinical presentation | |||
| Initial troponin T, ng/mL, median [IQR] | 0.06 [0.040.11] | 0.12 [0.050.32] | <0.001 |
| White cell count, 109/L, median [IQR] | 10 [8.014.0] | 11 [8.015.0] | 0.005 |
| NT‐proBNP, pg/mL, median [IQR] | 3,531 [1,20110,519] | 1,932 [3199,100] | 0.001 |
| Creatinine, mg/dL, median [IQR] | 1.6 [1.12.4] | 1.1 [0.91.5] | <0.001 |
| New ECG changes, no. (%) | 41 (8.2%) | 77 (29.7%) | <0.001 |
| TIMI score over 2, no. (%) | 365 (74.3%) | 235 (92.5%) | <0.001 |
| Fever (over 100.4 F), no. (%) | 75 (15.0%) | 38 (14.7%) | 0.91 |
| Hospice, no. (%) | 8 (1.6%) | 5 (1.9%) | 0.73 |
| Do not resuscitate, no. (%) | 62 (12.4%) | 30 (11.6%) | 0.76 |
| Intensive care admission, no. (%) | 160 (31.9%) | 116 (44.8%) | <0.001 |
| ACLS administered, no. (%) | 38 (7.6%) | 17 (6.6%) | 0.6 |
| Outcomes, no. (%) | |||
| Death, 30 days | 67 (13.3%) | 30 (11.6%) | 0.49 |
| Death, 1 year | 211 (42.0%) | 75 (29.0%) | <0.001 |
| Death, 6 years | 390 (77.7%) | 152 (58.7%) | <0.001 |

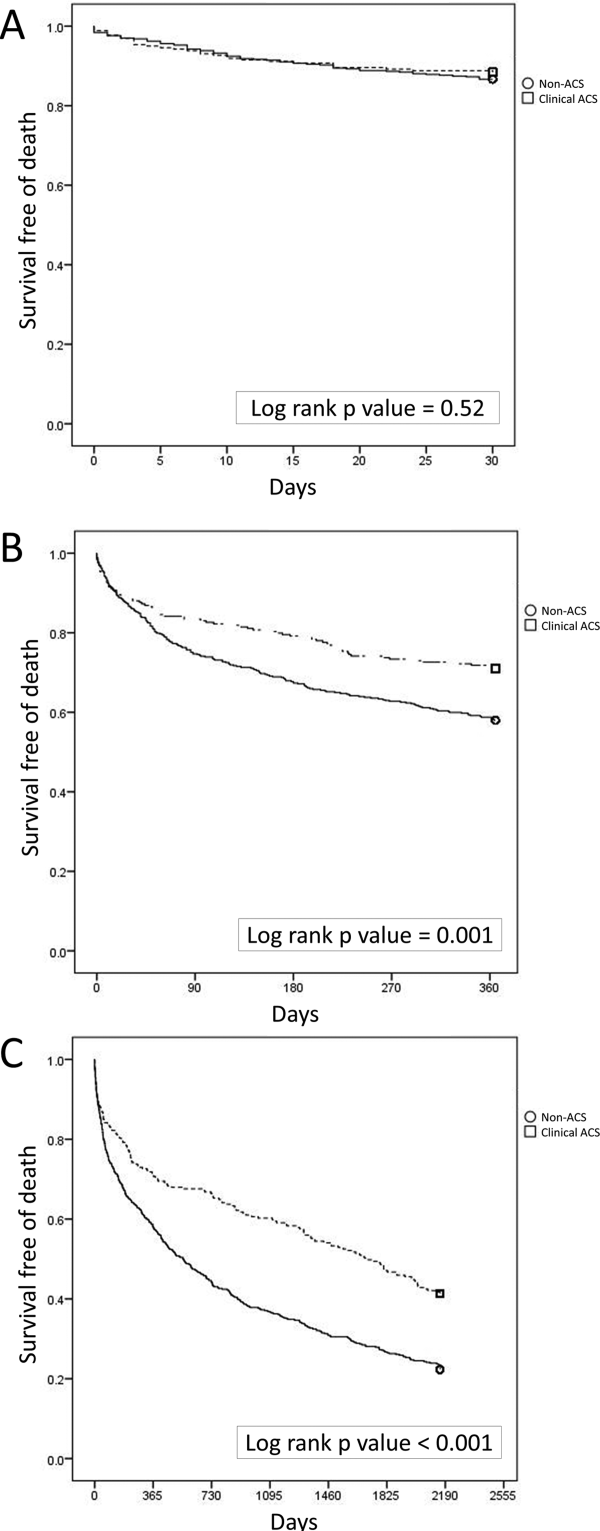
Mortality at 30 days was not different between the 2 groups, but mortality was higher for the non‐ACS cohort at 1 year and at 6 years (Table 1). Kaplan‐Meier curves demonstrate that mortality for the 2 cohorts begins to diverge between 30 and 60 days until approximately 2 years when the curves again are parallel (Figure 2).
In Cox proportional hazards models, 5 factors were associated with higher mortality at 30 days, 1 year, and at 6 years: age, hospice, DNR order, need for ACLS, and admission to the ICU (Table 2). Additionally, at 1 and 6 years, NT‐proBNP and non‐ACS were associated with higher mortality. At 6 years, creatinine was an additional significant factor. We separated the ACS and non‐ACS cohorts and performed the same model for 1‐year mortality (Table 3). The models yielded similar factors associated with higher mortality: hospice, DNR order, need for ACLS, age, and NT‐proBNP, with ICU admission being significant only in the non‐ACS cohort.
| P Value | Hazard Ratio | 95% CI | |
|---|---|---|---|
| |||
| 30 days | |||
| Intensive care unit admission | <0.0001 | 2.18 | 1.283.72 |
| Hospice | <0.0001 | 4.67 | 1.9111.40 |
| Do not resuscitate | <0.0001 | 3.19 | 1.945.24 |
| ACLS performed | <0.0001 | 10.17 | 6.0317.17 |
| Age, per year | <0.0001 | 1.04 | 1.021.06 |
| 1 year | |||
| Intensive care unit admission | <0.0001 | 1.66 | 1.262.20 |
| Hospice | <0.0001 | 4.98 | 2.699.21 |
| Do not resuscitate | <0.0001 | 2.52 | 1.833.47 |
| Non‐ACS | <0.0001 | 1.57 | 1.192.08 |
| ACLS performed | <0.0001 | 6.03 | 4.178.72 |
| Age, per year | <0.0001 | 1.03 | 1.021.04 |
| NT‐proBNP, per 1,000 pg/mL | <0.0001 | 1.02 | 1.011.03 |
| Extended follow‐up | |||
| Intensive care unit admission | <0.0001 | 1.35 | 1.111.65 |
| Hospice | <0.0001 | 3.81 | 2.136.81 |
| Do not resuscitate | <0.0001 | 2.11 | 1.622.74 |
| Non‐ACS | <0.0001 | 1.53 | 1.251.88 |
| ACLS performed | <0.0001 | 4.19 | 3.015.84 |
| Age, per year | <0.0001 | 1.03 | 1.031.04 |
| Creatinine, per mg/dL | 0.02 | 1.06 | 1.011.12 |
| NT‐proBNP, per 1,000 pg/mL | <0.0001 | 1.02 | 1.021.03 |
| P Value | Hazard Ratio | 95% CI | |
|---|---|---|---|
| |||
| Non‐ACS | |||
| Intensive care unit admission | <0.0001 | 1.86 | 1.352.58 |
| Hospice | <0.0001 | 7.55 | 3.5715.93 |
| Do not resuscitate | <0.0001 | 2.33 | 1.603.41 |
| ACLS performed | <0.0001 | 4.42 | 2.836.92 |
| Age, per year | <0.0001 | 1.03 | 1.011.04 |
| NT‐proBNP, per 1,000 pg/mL | 0.002 | 1.02 | 1.011.03 |
| Clinical ACS | |||
| Hospice | 0.036 | 3.17 | 1.089.32 |
| Do not resuscitate | 0.003 | 2.49 | 1.364.55 |
| ACLS performed | <0.0001 | 12.04 | 6.3322.91 |
| Age, per year | <0.0001 | 1.05 | 1.021.07 |
| NT‐proBNP, per 1,000 pg/mL | 0.001 | 1.04 | 1.011.06 |
DISCUSSION
Our findings confirm the important, but perhaps not well‐recognized, fact that an elevated troponin without ACS is associated with higher mortality than with ACS. This has been previously observed in veteran and nonveteran populations.[4, 6, 8, 12] The novel finding from our investigation is that mortality risk with troponin elevation is most strongly associated with unmodifiable clinical factors that are plausible explanations of risk. Furthermore, the distribution of these factors between our 2 cohorts does not sufficiently explain the difference in risk between ACS and non‐ACS patients.
At each time point we evaluated, ICU admission and need for ACLS were associated with mortality. These are indicators of a severely ill population and are not surprising to find associated with mortality. Many hospitals have instituted some form of pre‐code approach or rapid response team to identify patients before they need ACLS. These efforts, although well meaning, have not yielded convincing results of effectiveness.[13] Hospice and DNR patients were also, not surprisingly, associated with higher mortality. Although these factors were statistically significant, the low prevalence suggests that they are not clinically impactful on the primary questions of the investigation. These factors can be altered but are not intended as modifiable as they reflect the wishes of patients and their decision makers. The distribution of the factors in our model, however, did not adequately explain the higher risk of death with non‐ACS troponin elevation. For example, ACLS administration, hospice care, and DNR orders were strong predictors but were similar between the groups. ICU admission was actually more common with ACS patients, despite strong association with mortality. Age and NT‐proBNP were associated with mortality and higher in the non‐ACS group; however the magnitude of hazard was less than for the other factors. These findings lead us back to the possible explanation that non‐ACS troponin elevation stands as an independent risk factor, and that ACS patients have a distinct advantage in the myriad treatments available. If ACS patients were misdiagnosed as non‐ACS and failed to receive appropriate treatments, that might have contributed to higher mortality; however, we consider that unlikely given that the goal of the QI project was to minimize missed ACS diagnoses.
The overall mortality risk in our study was high: 12.7% at 30 days and 37.6% at 1 year. This reflects the high‐risk population with elevated troponin seen at our facility with ages nearly 70 years and high prevalence of multiple cardiovascular risk factors. Despite a high event rate, many clinically relevant risk factors were not retained in our Cox hazard model. Among sepsis patients, elevation in troponin is associated with mortality[14]; however, in our population neither fever or white blood cell count were significant mortality factors. The relationship between chronic kidney disease and troponin is complex. Renal dysfunction may result in troponin elevation and troponin elevation is a predictor of risk within kidney disease patients.[15] In our study, we did not evaluate chronic kidney disease as a predictor, instead opting to use the serum creatinine. This was not associated with mortality except at the 6‐year time point.
The TIMI score was not associated with mortality in either the overall population or the ACS cohort. The proportion of patients in our cohort with TIMI score under 3 was 16.5% as compared with 21.6% in the original derivation study.[16] The limited data on the prognostic value of the TIMI score within a veteran population suggest a modest predictive capacity.[17] Our data raises the possibility that TIMI is not an optimal choice; however, our analysis only includes all‐cause mortality, different from the original intended use of TIMI, predicting a variety of major cardiac events.
Our data confirm that ACS can be detected in a wide range of clinical presentations. Within our population of troponin positive patients, those with chest pain were most likely to be diagnosed with ACS, although one‐third of chest pain patients were felt to have a non‐ACS diagnosis. On the opposite end of the spectrum, an elevation in troponin with altered mental status or confusion was rarely diagnosed as ACSonly 18% of the time. Many symptoms were poor predictors of ACS; however, none were low enough to disregard. Our data would suggest that most patients with elevated troponin warrant evaluation by a cardiovascular expert.
Our study population came from a single VA hospital that is comprised of elderly and predominantly male patients limiting applicability to other populations. Despite this, other investigations in younger populations and with a higher proportion of women have found similar mortality trends.[4, 8, 12] We did not have sufficient data to determine the cause of death or to further classify as cardiac versus noncardiac; knowledge of the cause of the specific death may better inform future investigations into this important clinical question. Our investigation did not use a standardized definition to determine ACS, a notable limitation that could introduce bias or variation in care. Because all determinations about ACS were made prospectively as part of a QI project, we have little reason to suspect any systematic bias to the determination of ACS. With regard to variation in care, we have previously presented data demonstrating consistent rates of ACS diagnosis across the physicians at our facility.
Based on our investigation and others on this topic, non‐ACS troponin elevation is a common, high‐risk clinical scenario. In our cohort, non‐ACS troponin elevation is about twice as frequent as ACS, and the problem is likely to grow dramatically within the next few years as ultrasensitive troponin assays are eventually approved for use in the United States. These assays are much more sensitive than the current assays, and may make it challenging to distinguish between someone with an acute supply/demand mismatch from someone with an elevated troponin due to chronic, but stable, illness such as CAD, heart failure, or diabetes. Non‐ACS troponin elevation remains poorly understood, with no viable treatment options other than addressing the pathophysiology resulting in the troponin elevation. Due to the heterogeneity of the diagnoses and pathophysiological conditions that result in elevated troponin, a unifying treatment is not likely feasible.
In conclusion, in this elderly, male veteran population, the mortality impact associated with a cardiac troponin elevation was not limited to ACS, as mortality was high among those without ACS. Factors independently associated with this non‐ACS mortality risk were plausible, but did not elucidate the reasons why non‐ACS troponin elevation carries a higher risk. Attempting to better understand the biological basis for the troponin elevation in these non‐ACS patients is a critical unmet need.
Disclosure
Nothing to report.
- , , , , . Prognostic significance of elevated troponin in non‐cardiac hospitalized patients: a systematic review and meta‐analysis. Ann Med. 2014;46:653–663.
- , , , , , ; Joint ESC/ACCF/AHA/WHF Task Force for Universal Definition of Myocardial Infarction. Third universal definition of myocardial infarction. J Am Coll Cardiol. 2012;60:1581–1598.
- , , , et al.; ACC/AHA Task Force Members; Society for Cardiovascular Angiography and Interventions and the Society of Thoracic Surgeons. 2014 AHA/ACC guideline for the management of patients with non‐st‐elevation acute coronary syndromes: executive summary: a report of the American College of Cardiology/American Heart Association Task Force on Practice Guidelines. Circulation. 2014;130:2354–2394.
- , , , , , . Acute coronary syndrome vs nonspecific troponin elevation: clinical predictors and survival analysis. Arch Intern Med. 2007;167:276–281.
- , , , , , , TOTAL‐AMI study group. Type 2 myocardial infarction in clinical practice. Heart. 2015;101:101–106.
- , , , et al. Outcomes of hospitalized patients with non‐acute coronary syndrome and elevated cardiac troponin level. Am J Med. 2011;124:630–635.
- , , , et al. Classification of myocardial infarction: frequency and features of type 2 myocardial infarction. Am J Med. 2013;126:789–797.
- , , , , . Cardiac troponin I elevation in hospitalized patients without acute coronary syndromes. Am J Cardiol. 2008;101:1384–1388.
- , , , . Inter‐provider variation in diagnoses and cardiac catheterization use (abstract). Cardiology. 2014;128:346.
- , , , . A primer and comparative review of major us mortality databases. Ann Epidemiol. 2002;12:462–468.
- , , . Assessment of vital status in department of veterans affairs national databases. Comparison with state death certificates. Ann Epidemiol. 2001;11:286–291.
- , , , , , . Raised cardiac troponin T levels in patients without acute coronary syndrome. Postgrad Med J. 2007;83:200–205.
- , , , , . Rapid response teams: a systematic review and meta‐analysis. Arch Intern Med. 2010;170:18–26.
- , , , , . Prognostic value of troponins in sepsis: a meta‐analysis. Intensive Care Med. 2013;39:1181–1189.
- , , , et al. Prognostic value of cardiac troponin in patients with chronic kidney disease without suspected acute coronary syndrome: a systematic review and meta‐analysis. Ann Intern Med. 2014;161:491–501.
- , , , et al. The TIMI risk score for unstable angina/non‐ST elevation MI: a method for prognostication and therapeutic decision making. JAMA. 2000;284:835–842.
- , , , , , . Usefulness of the TIMI risk score in predicting both short‐ and long‐term outcomes in the Veterans Affairs non‐Q‐wave myocardial infarction strategies in‐hospital (VANQWISH) trial. Am J Cardiol. 2002;90:922–926.
Acute coronary syndromes (ACS) are potentially lethal and present with a wide variety of symptoms. As such, physicians frequently order cardiac biomarkers, such as cardiac troponin, for patients with acute complaints. Elevated troponin is associated with higher risk of mortality regardless of the causes, which can be myriad, both chronic and acute.[1] Among patients with an elevated troponin, distinguishing ACS from non‐ACS can be challenging.
Making the distinction between ACS and non‐ACS troponin elevation is crucial because the underlying pathophysiology and subsequent management strategies are markedly different.[2] According to evidence‐based practice guidelines, ACS is managed with antiplatelet drugs, statins, and percutaneous coronary intervention, improving clinical outcomes.[3] In contrast, care for patients with non‐ACS troponin elevations is usually supportive, with a focus on the underlying conditions. The lack of specific treatment options for such patients is concerning given that several series have suggested that non‐ACS troponin patients may have a higher mortality risk than ACS patients.[4, 5, 6] Non‐ACS troponin elevation can be the result of a multitude of conditions.[7, 8] What remains unclear at this point is whether the excess mortality observed with non‐ACS troponin elevation is due to myocardial damage or to the underlying conditions that predispose to troponin release.
Using data from a quality improvement (QI) project collected at our Veterans Affairs (VA) medical center, we investigated the mortality risk associated with ACS and non‐ACS troponin elevation including an analysis of factors associated with mortality. We hypothesized that non‐ACS troponin elevation will have a higher mortality risk than troponin elevation due to ACS, and that important contributors to this relationship could be identified to provide direction for future investigation directed at modifying this mortality risk.
METHODS
We analyzed data that were prospectively collected for a quality initiative between 2006 and 2007. The project was a collaborative endeavor between cardiology, hospital medicine, and emergency medicine with the process goal of better identifying patients with ACS to hopefully improve outcomes. The QI team was consulted in real time to assist with treatment recommendations; no retrospective decisions were made regarding whether or not ACS was present. As the goal of the project was to improve cardiovascular outcomes, consultative advice was freely provided, and no physicians or teams were subject to any adverse repercussions for their diagnoses or management decisions.
A cardiologist‐led team was created to improve quality of care for myocardial infarction patients by evaluating all patients at our facility with an elevated troponin. On a daily basis, a specialist clinical coordinator (nurse practitioner or physician assistant) received a list of all patients with elevated troponin from the chemistry lab. The coordinator reviewed the patients' medical records with a cardiologist. A positive troponin was defined as a troponin T level of greater than 0.03 ng/mL (99th percentile at our facility). Each attending cardiologist prospectively determined if troponin elevation was related to clinical findings consistent with an ACS based on review of the patients' symptoms (duration, quality, severity, chronicity, and alleviating/aggravating factors), medical history, and noninvasive cardiac testing including electrocardiograms, cardiac biomarkers, and any other available imaging tests.
We have previously demonstrated that the cardiologists at our facility have a similar rate of diagnosing ACS.[9] All cardiologists at our facility maintain current American Board of Internal Medicine certification in cardiovascular disease and have academic appointments at the University of Florida College of Medicine. All patients were followed prospectively, and data on their medical history, acute evaluation, and outcomes were tracked in an electronic database. Given the higher risk of mortality with ST‐elevation myocardial infarction, such patients were excluded from this investigation. By definition, patients with unstable angina do not have elevated biomarkers and thus would not have been included in the database to begin with. Prospectively recorded data elements included: age, gender, chief complaint, tobacco use, presence of hypertension, hyperlipidemia, prior coronary disease, chronic kidney disease, diabetes mellitus, cardiac troponin values, serum creatinine, electrocardiogram (ECG) variables, Thrombolysis in Myocardial Infarction (TIMI) score, and if the patient was placed under hospice care or an active do‐not‐resuscitate (DNR) order. Additional data elements gathered at a later date included maximum temperature, white blood cell count, N‐terminal pro‐brain natriuretic peptide (NT‐proBNP), administration of advanced cardiac life support (ACLS), and admission to an intensive care unit (ICU). All consecutive patients with elevated troponin were included in the database; if patients were included more than once, we used their index evaluation only. All patients with troponin elevation after revascularization (percutaneous coronary intervention or coronary bypass surgery) were excluded. Our investigational design was reviewed by our institutional review board, who waived the requirement for formal written informed consent and approved use of data from this QI project for research purposes.
We focused this investigation on an analysis of all‐cause mortality in February 2014. We analyzed mortality at 30 days, 1 year, and 6 years. As secondary outcomes we analyzed the likelihood of the patients' chief complaint for the diagnosis of ACS and evaluated predictors of mortality based on Cox proportional hazard modeling. Mortality within the VA system is reliably tracked and compares favorably to the Social Security National Death Index Master File for accuracy.[10, 11]
Categorical variables were compared by 2 test. The Student t test was used to compare normally distributed continuous variables, and nonparametric tests were used for non‐normal distributions as appropriate. Mortality data at 30 days, 1 year, and 6 years were compared by log‐rank test and Kaplan‐Meier graphs. A formal power analysis was not performed; the entire available population was included. A Cox proportional hazard model was created to estimate mortality risk at each time point. Variables included in our Cox regression model were age, gender, history of coronary artery disease (CAD), hypertension, diabetes mellitus or hyperlipidemia, ACS diagnosis, dynamic ECG changes, TIMI risk score, initial troponin level, creatinine level at time of initial troponin (per mg/dL), presence of fever, maximum white blood cell count, NT‐proBNP level (per 1000 pg/mL), if ACLS was performed, if the patient was under hospice care, if there was a DNR order, and if they required ICU admission. This model was also constructed independently for the ACS and non‐ACS cohorts for mortality at 1 year. A forward stepwise model was used. Statistical results were considered significant at P < 0.05. Statistical analyses were performed using SPSS version 21 (IBM, Armonk, NY).
RESULTS
Among the 761 patients, 502 (66.0%) were classified as non‐ACS and 259 (34.0%) as ACS (Table 1). The mean age was higher in the non‐ACS group (71 years vs 69 years in the ACS group, P = 0.006). Hypertension, diabetes mellitus, and prior CAD were frequent in both groups and not significantly different. Median initial troponin T was higher in the ACS group (0.12 ng/mL vs 0.06 ng/mL, P < 0.001) as were the frequency of a TIMI risk score >2 (92.5% vs 74.3%, P < 0.001) and new ECG changes (29.7% vs 8.2%, P < 0.001). Hospice, DNR orders, and administration of ACLS were not different between groups; however, admission to the ICU was more frequent in the ACS group (44.8% vs 31.9%, P < 0.001). Chest pain was the symptom with the highest positive predictive value for the diagnosis of ACS (63.3%), whereas the least predictive was altered mental status or confusion (18.0%) (Figure 1).
| Non‐ACS, N = 502 | ACS, N = 259 | P Value | |
|---|---|---|---|
| |||
| Baseline characteristics, n (%) | |||
| Age, y | 71 11 | 69 11 | 0.006 |
| Female | 6 (1.2%) | 1 (0.4%) | 0.27 |
| Coronary artery disease | 244 (48.6%) | 141 (54.4%) | 0.13 |
| Hypertension | 381 (75.9%) | 203 (78.4%) | 0.44 |
| Diabetes mellitus | 220 (43.8%) | 119 (45.9%) | 0.58 |
| Hyperlipidemia | 268 (53.4%) | 170 (65.6%) | 0.001 |
| Current smoker | 24 (4.8%) | 49 (18.9%) | <0.001 |
| Clinical presentation | |||
| Initial troponin T, ng/mL, median [IQR] | 0.06 [0.040.11] | 0.12 [0.050.32] | <0.001 |
| White cell count, 109/L, median [IQR] | 10 [8.014.0] | 11 [8.015.0] | 0.005 |
| NT‐proBNP, pg/mL, median [IQR] | 3,531 [1,20110,519] | 1,932 [3199,100] | 0.001 |
| Creatinine, mg/dL, median [IQR] | 1.6 [1.12.4] | 1.1 [0.91.5] | <0.001 |
| New ECG changes, no. (%) | 41 (8.2%) | 77 (29.7%) | <0.001 |
| TIMI score over 2, no. (%) | 365 (74.3%) | 235 (92.5%) | <0.001 |
| Fever (over 100.4 F), no. (%) | 75 (15.0%) | 38 (14.7%) | 0.91 |
| Hospice, no. (%) | 8 (1.6%) | 5 (1.9%) | 0.73 |
| Do not resuscitate, no. (%) | 62 (12.4%) | 30 (11.6%) | 0.76 |
| Intensive care admission, no. (%) | 160 (31.9%) | 116 (44.8%) | <0.001 |
| ACLS administered, no. (%) | 38 (7.6%) | 17 (6.6%) | 0.6 |
| Outcomes, no. (%) | |||
| Death, 30 days | 67 (13.3%) | 30 (11.6%) | 0.49 |
| Death, 1 year | 211 (42.0%) | 75 (29.0%) | <0.001 |
| Death, 6 years | 390 (77.7%) | 152 (58.7%) | <0.001 |
Mortality at 30 days was not different between the 2 groups, but mortality was higher for the non‐ACS cohort at 1 year and at 6 years (Table 1). Kaplan‐Meier curves demonstrate that mortality for the 2 cohorts begins to diverge between 30 and 60 days until approximately 2 years when the curves again are parallel (Figure 2).
In Cox proportional hazards models, 5 factors were associated with higher mortality at 30 days, 1 year, and at 6 years: age, hospice, DNR order, need for ACLS, and admission to the ICU (Table 2). Additionally, at 1 and 6 years, NT‐proBNP and non‐ACS were associated with higher mortality. At 6 years, creatinine was an additional significant factor. We separated the ACS and non‐ACS cohorts and performed the same model for 1‐year mortality (Table 3). The models yielded similar factors associated with higher mortality: hospice, DNR order, need for ACLS, age, and NT‐proBNP, with ICU admission being significant only in the non‐ACS cohort.
| P Value | Hazard Ratio | 95% CI | |
|---|---|---|---|
| |||
| 30 days | |||
| Intensive care unit admission | <0.0001 | 2.18 | 1.283.72 |
| Hospice | <0.0001 | 4.67 | 1.9111.40 |
| Do not resuscitate | <0.0001 | 3.19 | 1.945.24 |
| ACLS performed | <0.0001 | 10.17 | 6.0317.17 |
| Age, per year | <0.0001 | 1.04 | 1.021.06 |
| 1 year | |||
| Intensive care unit admission | <0.0001 | 1.66 | 1.262.20 |
| Hospice | <0.0001 | 4.98 | 2.699.21 |
| Do not resuscitate | <0.0001 | 2.52 | 1.833.47 |
| Non‐ACS | <0.0001 | 1.57 | 1.192.08 |
| ACLS performed | <0.0001 | 6.03 | 4.178.72 |
| Age, per year | <0.0001 | 1.03 | 1.021.04 |
| NT‐proBNP, per 1,000 pg/mL | <0.0001 | 1.02 | 1.011.03 |
| Extended follow‐up | |||
| Intensive care unit admission | <0.0001 | 1.35 | 1.111.65 |
| Hospice | <0.0001 | 3.81 | 2.136.81 |
| Do not resuscitate | <0.0001 | 2.11 | 1.622.74 |
| Non‐ACS | <0.0001 | 1.53 | 1.251.88 |
| ACLS performed | <0.0001 | 4.19 | 3.015.84 |
| Age, per year | <0.0001 | 1.03 | 1.031.04 |
| Creatinine, per mg/dL | 0.02 | 1.06 | 1.011.12 |
| NT‐proBNP, per 1,000 pg/mL | <0.0001 | 1.02 | 1.021.03 |
| P Value | Hazard Ratio | 95% CI | |
|---|---|---|---|
| |||
| Non‐ACS | |||
| Intensive care unit admission | <0.0001 | 1.86 | 1.352.58 |
| Hospice | <0.0001 | 7.55 | 3.5715.93 |
| Do not resuscitate | <0.0001 | 2.33 | 1.603.41 |
| ACLS performed | <0.0001 | 4.42 | 2.836.92 |
| Age, per year | <0.0001 | 1.03 | 1.011.04 |
| NT‐proBNP, per 1,000 pg/mL | 0.002 | 1.02 | 1.011.03 |
| Clinical ACS | |||
| Hospice | 0.036 | 3.17 | 1.089.32 |
| Do not resuscitate | 0.003 | 2.49 | 1.364.55 |
| ACLS performed | <0.0001 | 12.04 | 6.3322.91 |
| Age, per year | <0.0001 | 1.05 | 1.021.07 |
| NT‐proBNP, per 1,000 pg/mL | 0.001 | 1.04 | 1.011.06 |
DISCUSSION
Our findings confirm the important, but perhaps not well‐recognized, fact that an elevated troponin without ACS is associated with higher mortality than with ACS. This has been previously observed in veteran and nonveteran populations.[4, 6, 8, 12] The novel finding from our investigation is that mortality risk with troponin elevation is most strongly associated with unmodifiable clinical factors that are plausible explanations of risk. Furthermore, the distribution of these factors between our 2 cohorts does not sufficiently explain the difference in risk between ACS and non‐ACS patients.
At each time point we evaluated, ICU admission and need for ACLS were associated with mortality. These are indicators of a severely ill population and are not surprising to find associated with mortality. Many hospitals have instituted some form of pre‐code approach or rapid response team to identify patients before they need ACLS. These efforts, although well meaning, have not yielded convincing results of effectiveness.[13] Hospice and DNR patients were also, not surprisingly, associated with higher mortality. Although these factors were statistically significant, the low prevalence suggests that they are not clinically impactful on the primary questions of the investigation. These factors can be altered but are not intended as modifiable as they reflect the wishes of patients and their decision makers. The distribution of the factors in our model, however, did not adequately explain the higher risk of death with non‐ACS troponin elevation. For example, ACLS administration, hospice care, and DNR orders were strong predictors but were similar between the groups. ICU admission was actually more common with ACS patients, despite strong association with mortality. Age and NT‐proBNP were associated with mortality and higher in the non‐ACS group; however the magnitude of hazard was less than for the other factors. These findings lead us back to the possible explanation that non‐ACS troponin elevation stands as an independent risk factor, and that ACS patients have a distinct advantage in the myriad treatments available. If ACS patients were misdiagnosed as non‐ACS and failed to receive appropriate treatments, that might have contributed to higher mortality; however, we consider that unlikely given that the goal of the QI project was to minimize missed ACS diagnoses.
The overall mortality risk in our study was high: 12.7% at 30 days and 37.6% at 1 year. This reflects the high‐risk population with elevated troponin seen at our facility with ages nearly 70 years and high prevalence of multiple cardiovascular risk factors. Despite a high event rate, many clinically relevant risk factors were not retained in our Cox hazard model. Among sepsis patients, elevation in troponin is associated with mortality[14]; however, in our population neither fever or white blood cell count were significant mortality factors. The relationship between chronic kidney disease and troponin is complex. Renal dysfunction may result in troponin elevation and troponin elevation is a predictor of risk within kidney disease patients.[15] In our study, we did not evaluate chronic kidney disease as a predictor, instead opting to use the serum creatinine. This was not associated with mortality except at the 6‐year time point.
The TIMI score was not associated with mortality in either the overall population or the ACS cohort. The proportion of patients in our cohort with TIMI score under 3 was 16.5% as compared with 21.6% in the original derivation study.[16] The limited data on the prognostic value of the TIMI score within a veteran population suggest a modest predictive capacity.[17] Our data raises the possibility that TIMI is not an optimal choice; however, our analysis only includes all‐cause mortality, different from the original intended use of TIMI, predicting a variety of major cardiac events.
Our data confirm that ACS can be detected in a wide range of clinical presentations. Within our population of troponin positive patients, those with chest pain were most likely to be diagnosed with ACS, although one‐third of chest pain patients were felt to have a non‐ACS diagnosis. On the opposite end of the spectrum, an elevation in troponin with altered mental status or confusion was rarely diagnosed as ACSonly 18% of the time. Many symptoms were poor predictors of ACS; however, none were low enough to disregard. Our data would suggest that most patients with elevated troponin warrant evaluation by a cardiovascular expert.
Our study population came from a single VA hospital that is comprised of elderly and predominantly male patients limiting applicability to other populations. Despite this, other investigations in younger populations and with a higher proportion of women have found similar mortality trends.[4, 8, 12] We did not have sufficient data to determine the cause of death or to further classify as cardiac versus noncardiac; knowledge of the cause of the specific death may better inform future investigations into this important clinical question. Our investigation did not use a standardized definition to determine ACS, a notable limitation that could introduce bias or variation in care. Because all determinations about ACS were made prospectively as part of a QI project, we have little reason to suspect any systematic bias to the determination of ACS. With regard to variation in care, we have previously presented data demonstrating consistent rates of ACS diagnosis across the physicians at our facility.
Based on our investigation and others on this topic, non‐ACS troponin elevation is a common, high‐risk clinical scenario. In our cohort, non‐ACS troponin elevation is about twice as frequent as ACS, and the problem is likely to grow dramatically within the next few years as ultrasensitive troponin assays are eventually approved for use in the United States. These assays are much more sensitive than the current assays, and may make it challenging to distinguish between someone with an acute supply/demand mismatch from someone with an elevated troponin due to chronic, but stable, illness such as CAD, heart failure, or diabetes. Non‐ACS troponin elevation remains poorly understood, with no viable treatment options other than addressing the pathophysiology resulting in the troponin elevation. Due to the heterogeneity of the diagnoses and pathophysiological conditions that result in elevated troponin, a unifying treatment is not likely feasible.
In conclusion, in this elderly, male veteran population, the mortality impact associated with a cardiac troponin elevation was not limited to ACS, as mortality was high among those without ACS. Factors independently associated with this non‐ACS mortality risk were plausible, but did not elucidate the reasons why non‐ACS troponin elevation carries a higher risk. Attempting to better understand the biological basis for the troponin elevation in these non‐ACS patients is a critical unmet need.
Disclosure
Nothing to report.
- , , , , . Prognostic significance of elevated troponin in non‐cardiac hospitalized patients: a systematic review and meta‐analysis. Ann Med. 2014;46:653–663.
- , , , , , ; Joint ESC/ACCF/AHA/WHF Task Force for Universal Definition of Myocardial Infarction. Third universal definition of myocardial infarction. J Am Coll Cardiol. 2012;60:1581–1598.
- , , , et al.; ACC/AHA Task Force Members; Society for Cardiovascular Angiography and Interventions and the Society of Thoracic Surgeons. 2014 AHA/ACC guideline for the management of patients with non‐st‐elevation acute coronary syndromes: executive summary: a report of the American College of Cardiology/American Heart Association Task Force on Practice Guidelines. Circulation. 2014;130:2354–2394.
- , , , , , . Acute coronary syndrome vs nonspecific troponin elevation: clinical predictors and survival analysis. Arch Intern Med. 2007;167:276–281.
- , , , , , , TOTAL‐AMI study group. Type 2 myocardial infarction in clinical practice. Heart. 2015;101:101–106.
- , , , et al. Outcomes of hospitalized patients with non‐acute coronary syndrome and elevated cardiac troponin level. Am J Med. 2011;124:630–635.
- , , , et al. Classification of myocardial infarction: frequency and features of type 2 myocardial infarction. Am J Med. 2013;126:789–797.
- , , , , . Cardiac troponin I elevation in hospitalized patients without acute coronary syndromes. Am J Cardiol. 2008;101:1384–1388.
- , , , . Inter‐provider variation in diagnoses and cardiac catheterization use (abstract). Cardiology. 2014;128:346.
- , , , . A primer and comparative review of major us mortality databases. Ann Epidemiol. 2002;12:462–468.
- , , . Assessment of vital status in department of veterans affairs national databases. Comparison with state death certificates. Ann Epidemiol. 2001;11:286–291.
- , , , , , . Raised cardiac troponin T levels in patients without acute coronary syndrome. Postgrad Med J. 2007;83:200–205.
- , , , , . Rapid response teams: a systematic review and meta‐analysis. Arch Intern Med. 2010;170:18–26.
- , , , , . Prognostic value of troponins in sepsis: a meta‐analysis. Intensive Care Med. 2013;39:1181–1189.
- , , , et al. Prognostic value of cardiac troponin in patients with chronic kidney disease without suspected acute coronary syndrome: a systematic review and meta‐analysis. Ann Intern Med. 2014;161:491–501.
- , , , et al. The TIMI risk score for unstable angina/non‐ST elevation MI: a method for prognostication and therapeutic decision making. JAMA. 2000;284:835–842.
- , , , , , . Usefulness of the TIMI risk score in predicting both short‐ and long‐term outcomes in the Veterans Affairs non‐Q‐wave myocardial infarction strategies in‐hospital (VANQWISH) trial. Am J Cardiol. 2002;90:922–926.
Which patients may benefit from coronary artery calcification scoring?
Although we still have no evidence from randomized trials that patients have better outcomes if we measure the calcification in their coronary arteries, a growing body of evidence shows that we can estimate risk more accurately than with a risk model score alone if we also score coronary artery calcification in asymptomatic patients, especially those at intermediate risk.
Current guidelines1 recommend using the Framingham Risk Score or a similar tool to estimate coronary risk in asymptomatic patients, but these tools have only modest accuracy. Calcification scoring is accurate, inexpensive, quick, widely available, low-risk, and does not appear to increase medical costs afterward. In addition to improving risk stratification, it may also encourage patients to adhere better to drug therapy and lifestyle modification.
HOW IS CORONARY ARTERY CALCIFICATION MEASURED?
Calcification of the coronary arteries is synonymous with atherosclerosis. It can easily be detected with computed tomography without contrast (Figure 1), and the amount can be quantified with a scoring system such as the volumetric score or the Agatston score. The latter, which is more commonly used, is based on the product of the area of the calcium deposits and the x-ray attenuation in Hounsfield units.
Scores can be roughly categorized (with some overlap owing to data from different studies) as:
- Low risk: 0 Agatston units (AU)
- Average risk: 1–112 AU
- Moderate risk: 100–400 AU
- High risk: 400–999 AU
- Very high risk: 1,000 AU.2
The actual test takes only a few seconds, and the patient can usually be out the door in 15 minutes or less. It does not require iodinated contrast and the radiation dose is minimal, usually less than 1 mSv, equivalent to fewer than 10 chest radiographs.3
The cost is typically between $200 and $500. The test is usually not covered by health insurance, but this differs by insurer and by state; for example, coverage is mandated in Texas, and the test is covered by United Healthcare.
WHAT IS THE EVIDENCE IN FAVOR OF CALCIFICATION SCORING?
Cohort studies with long-term follow-up show that calcification scoring has robust prognostic ability. A pooled analysis of several of these studies2 showed that a higher score strongly correlated with a higher risk of cardiac events over 3 to 5 years. Compared with the risk in people with a score of 0, the risk was twice as high in those with a score of 1 to 112, four times as high with a score of 100 to 400, seven times as high with a score of 400 to 499, and 10 times as high with a score greater than 1,000.2
A cohort study of more than 25,000 patients had similar conclusions about the magnitude of risk associated with coronary calcification.4 It also found that the 10-year risk of death was 0.6% in patients with a score of 0, 3.4% with a score of 101 to 399, 5.3% with a score of 400 to 699, 6.1% with a score of 700 to 999, and 12.2% with a score greater than 1,000.
Although progression of coronary artery calcification may predict the risk of death from any cause,5 the clinical utility of serial measurements is not yet apparent, especially since statin therapy—our front-line treatment for coronary disease—has not been shown to slow the progression of calcification.
Improving the accuracy of risk prediction
If a patient’s 10-year coronary risk is intermediate (10% to 20%), calcification scoring can reclassify the risk as low or high in about 50% of cases and can improve the accuracy of risk prediction.6–8
For example, Elias-Smale et al6 evaluated the effect of calcification scoring in 2,028 asymptomatic patients, with median follow-up of 9.2 years and 135 coronary events observed. Adding the calcification score to the Framingham model significantly improved risk classification, with a net reclassification improvement (NRI) of 0.14 (P < .01). (NRI is a measure of discriminatory performance for a diagnostic test; higher is better.9) Reclassification was most robust in those at intermediate risk, 52% of whom were reclassified, with 30% reclassified to low risk and 22% reclassified to high risk.
Erbel et al7 reported data from the Heinz Nixdorf Recall study, which used calcification scoring to estimate the NRI in 4,129 patients followed for 5 years. During this time there were 93 coronary deaths and non-fatal myocardial infarctions. The addition of the calcification score to the Framingham risk model resulted in an NRI of 0.21 (P = .0002) for patients with a risk of 6% to 20% and 0.31 (P < .0001) for those with a risk of 10% to 20%. Erbel et al also estimated the C statistic (area under the receiver operating characteristic curve; the maximum value is 1.0 and the higher the value the better) for the addition of the calcification score to the Framingham risk model and to the Adult Treatment Panel (ATP) III algorithm. They reported a significant increase of 0.681 to 0.749 with the Framingham model and 0.653 to 0.755 with the ATP III algorithm.
Polonsky et al8 studied a cohort of 5,878 participants from the Multi-Ethnic Study of Atherosclerosis (MESA) and estimated the event risk using a model based on Framingham risk characteristics. When the calcification score was added to the prediction model, 26% of the sample was reclassified to a new risk category. In intermediate-risk patients, 292 (16%) were reclassified as high risk, and 712 (39%) were reclassified as low risk, achieving an NRI of 0.55 (95% confidence interval 0.41 to 0.69; P < .001). In addition, the C statistic for the prediction of cardiovascular events was 0.76 for the model based on Framingham risk characteristics and increased to 0.81 (P < .001) with the addition of calcification scoring.
Improving adherence and care
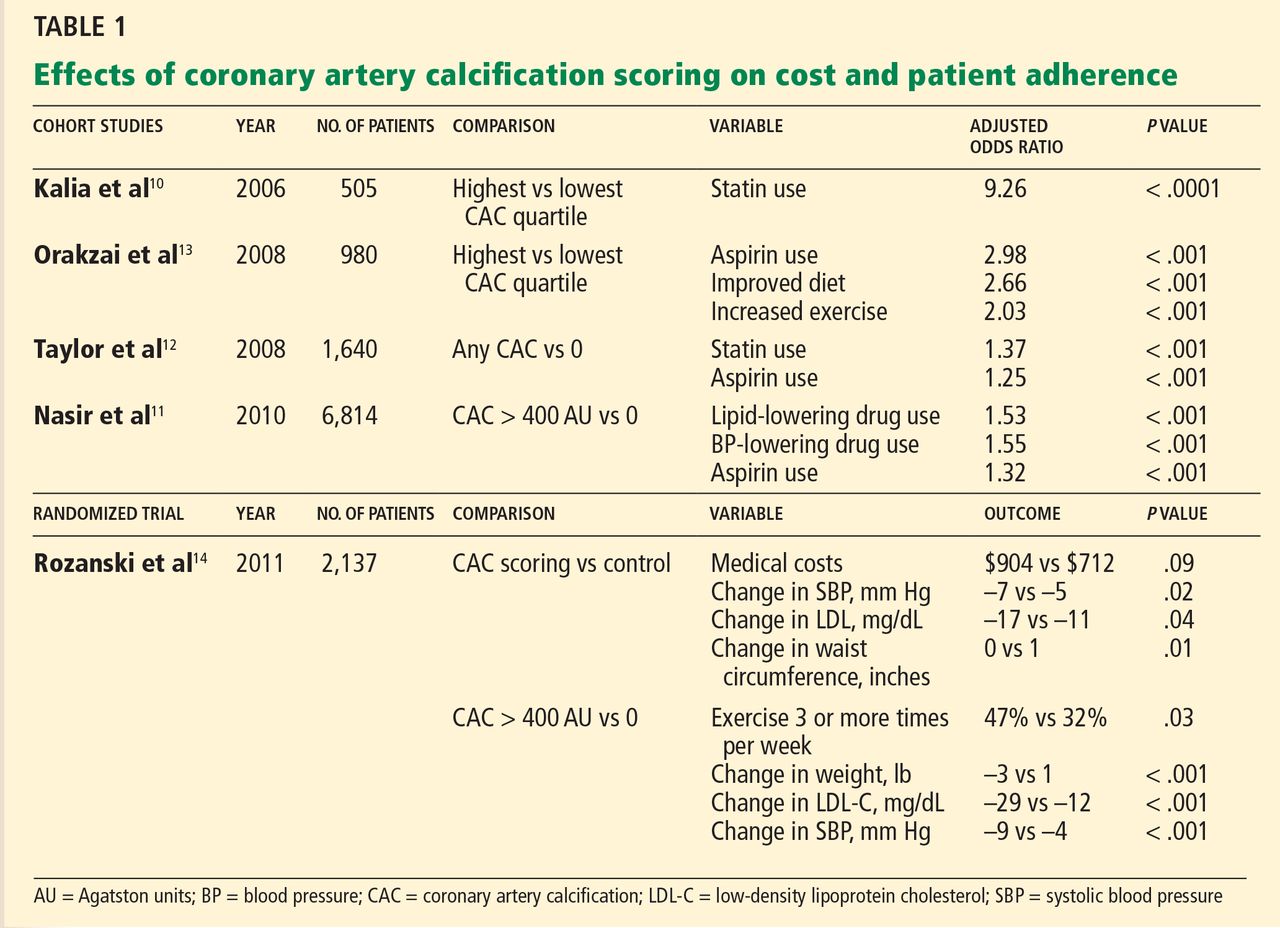
Knowing that a patient has a higher calcification score, physicians are more likely to prescribe lipid-lowering and antihypertensive drugs (Table 1),10–12 and patients with a higher score are also more often adherent to recommendations regarding diet and exercise.13
Rozanski et al,14 in a randomized controlled trial, showed that measuring coronary artery calcification did not increase downstream medical spending. A modest improvement in systolic blood pressure (P = .02), serum low-density lipoprotein level (P = .04), and waist circumference (P = .01) was observed in patients who had their calcification measured. Patients with the highest scores had the greatest improvement in coronary risk factors, including blood pressure, cholesterol, weight, and regular exercise.
On the other hand, other analyses have suggested that imaging tests are not effective for motivating behavioral changes. This topic deserves more research.15
Less utility in symptomatic disease
Coronary artery calcification scoring has less clinical utility in patients who already have coronary symptoms. Villines et al16 described a cohort of 10,037 patients with coronary symptoms who underwent calcification scoring and computed tomographic coronary angiography and found that stenosis of greater than 50% was present in 3.5% of those who had a score of 0 and in 29% of those with a score higher than 0. Therefore, a score of 0 does not rule out obstructive coronary heart disease if the patient has symptoms. Conversely, these patients may still have coronary artery calcification even if perfusion stress imaging is normal,17,18 and calcification scoring may have a role in the evaluation of equivocal stress tests.19
CALCIFICATION SCORING GUIDELINES
In their most recent (2010) joint guidelines for assessing risk of coronary heart disease in asymptomatic patients,20 the American College of Cardiology and the American Heart Association say coronary artery calcification scoring:
- Is recommended for asymptomatic patients at intermediate 10-year risk (10% to 20%) of coronary heart disease (class IIa recommendation, level of evidence B)
- May be acceptable for asymptomatic patients at low to intermediate risk (6% to 10%) (class IIb recommendation)
- Is discouraged for those at low risk (< 6%) (class III recommendation).
The most recent (2010) criteria for the appropriate use of cardiac computed tomography21 provide similar recommendations. Specifically, coronary artery calcification scoring with noncontrast computed tomography was rated as appropriate for patients at intermediate risk (10% to 20%) of coronary heart disease and for the specific subset of patients who are at low risk (6% to 10%) but who have a family history of premature coronary heart disease.
These recommendations are based on multiple lines of evidence that calcification scoring is a robust risk-predictor, can enhance risk estimates beyond traditional scoring strategies, and may—in theory—improve outcomes.
CALCIFICATION SCORING’S LIMITATIONS
The images used for measuring coronary calcification do predict risk of cardiovascular events, but they are not adequate to assess the severity of coronary stenosis. Further, calcification scoring often leads to incidental findings, which can cause anxiety and possibly lead to more imaging, entailing more radiation exposure and expense. And as noted, there are no randomized trial data demonstrating a reduction in cardiovascular events with the use of calcification scoring.
- Redberg RF, Benjamin EJ, Bittner V, et al. ACCF/AHA 2009 performance measures for primary prevention of cardiovascular disease in adults. J Am Coll Cardiol 2009; 54:1364–1405.
- Greenland P, Bonow RO, Brundage BH, et al. ACCF/AHA 2007 clinical expert consensus document on coronary artery calcium scoring by computed tomography in global cardiovascular risk assessment and in evaluation of patients with chest pain. J Am Coll Cardiol 2007; 49:378–402.
- Winchester DE, Wymer DC, Shifrin RY, Kraft SM, Hill JA. Responsible use of computed tomography in the evaluation of coronary artery disease and chest pain. Mayo Clin Proc 2010; 85:358–364.
- Budoff MJ, Shaw LJ, Liu ST, et al. Long-term prognosis associated with coronary calcification: observations from a registry of 25,253 patients. J Am Coll Cardiol 2007; 49:1860–1870.
- Budoff MJ, Hokanson JE, Nasir K, et al. Progression of coronary artery calcium predicts all-cause mortality. JACC Cardiovasc Imaging 2010; 3:1229–1236.
- Elias-Smale SE, Proença RV, Koller MT, et al. Coronary calcium score improves classification of coronary heart disease risk in the elderly: The Rotterdam study. J Am Coll Cardiol 2010; 56:1407–1414.
- Erbel R, Möhlenkamp S, Moebus S, et al; Heinz Nixdorf Recall Study Investigative Group. Coronary risk stratification, discrimination, and reclassification improvement based on quantification of subclinical coronary atherosclerosis: the Heinz Nixdorf Recall study. J Am Coll Cardiol 2010; 56:1397–1406.
- Polonsky TS, McClelland RL, Jorgensen NW, et al. Coronary artery calcium score and risk classification for coronary heart disease prediction. JAMA 2010; 303:1610–1616.
- Pencina MJ, Agostino RB, Agostino RB, Vasan RS. Evaluating the added predictive ability of a new marker: from area under the ROC curve to reclassification and beyond. Statist Med 2008; 27:157–172.
- Kalia NK, Miller LG, Nasir K, Blumenthal RS, Agrawal N, Budoff MJ. Visualizing coronary calcium is associated with improvements in adherence to statin therapy. Atherosclerosis 2006; 185:394–399.
- Nasir K, McClelland RL, Blumenthal RS, et al. Coronary artery calcium in relation to initiation and continuation of cardiovascular preventive medications: the Multi-Ethnic Study of Atherosclerosis (MESA). Circ Cardiovasc Qual Outcomes 2010; 3:228–235.
- Taylor AJ, Bindeman J, Feuerstein I, et al. Community-based provision of statin and aspirin after the detection of coronary artery calcium within a community-based screening cohort. J Am Coll Cardiol 2008; 51:1337–1341.
- Orakzai RH, Nasir K, Orakzai SH, et al. Effect of patient visualization of coronary calcium by electron beam computed tomography on changes in beneficial lifestyle behaviors. Am J Cardiol 2008; 101:999–1002.
- Rozanski A, Gransar H, Shaw LJ, et al. Impact of coronary artery calcium scanning on coronary risk factors and downstream testing the EISNER (Early Identification of Subclinical Atherosclerosis by Noninvasive Imaging Research) prospective randomized trial. J Am Coll Cardiol 2011; 57:1622–1632.
- Hackam DG, Shojania KG, Spence JD, et al. Influence of noninvasive cardiovascular imaging in primary prevention: systematic review and meta-analysis of randomized trials. Arch Intern Med 2011; 171:977–982.
- Villines TC, Hulten EA, Shaw LJ, et al; CONFIRM Registry Investigators. Prevalence and severity of coronary artery disease and adverse events among symptomatic patients with coronary artery calcification scores of zero undergoing coronary computed tomography angiography. J Am Coll Cardiol 2011; 58:2533–2540.
- Schenker MP, Dorbala S, Hong EC, et al. Interrelation of coronary calcification, myocardial ischemia, and outcomes in patients with intermediate likelihood of coronary artery disease: a combined positron emission tomography/computed tomography study. Circulation 2008; 117:1693–1700.
- Bybee KA, Lee J, Markiewicz R, et al. Diagnostic and clinical benefit of combined coronary calcium and perfusion assessment in patients undergoing PET/CT myocardial perfusion stress imaging. J Nucl Cardiol 2010; 17:188–196.
- Schmermund A, Baumgart D, Sack S, et al. Assessment of coronary calcification by electron-beam computed tomography in symptomatic patients with normal, abnormal or equivocal exercise stress test. Eur Heart J 2000; 21:1674–1682.
- Greenland P, Alpert JS, Beller GA, et al. 2010 ACCF/AHA guideline for assessment of cardiovascular risk in asymptomatic adults. J Am Coll Cardiol 2010; 56:e50–e103.
- Taylor AJ, Cerqueira M, Hodgson JM, et al. ACCF/SCCT/ACR/AHA/ASE/ASNC/NASCI/SCAI/SCMR 2010 appropriate use criteria for cardiac computed tomography. J Am Coll Cardiol 2010; 56:1864–1894.
Although we still have no evidence from randomized trials that patients have better outcomes if we measure the calcification in their coronary arteries, a growing body of evidence shows that we can estimate risk more accurately than with a risk model score alone if we also score coronary artery calcification in asymptomatic patients, especially those at intermediate risk.
Current guidelines1 recommend using the Framingham Risk Score or a similar tool to estimate coronary risk in asymptomatic patients, but these tools have only modest accuracy. Calcification scoring is accurate, inexpensive, quick, widely available, low-risk, and does not appear to increase medical costs afterward. In addition to improving risk stratification, it may also encourage patients to adhere better to drug therapy and lifestyle modification.
HOW IS CORONARY ARTERY CALCIFICATION MEASURED?
Calcification of the coronary arteries is synonymous with atherosclerosis. It can easily be detected with computed tomography without contrast (Figure 1), and the amount can be quantified with a scoring system such as the volumetric score or the Agatston score. The latter, which is more commonly used, is based on the product of the area of the calcium deposits and the x-ray attenuation in Hounsfield units.
Scores can be roughly categorized (with some overlap owing to data from different studies) as:
- Low risk: 0 Agatston units (AU)
- Average risk: 1–112 AU
- Moderate risk: 100–400 AU
- High risk: 400–999 AU
- Very high risk: 1,000 AU.2
The actual test takes only a few seconds, and the patient can usually be out the door in 15 minutes or less. It does not require iodinated contrast and the radiation dose is minimal, usually less than 1 mSv, equivalent to fewer than 10 chest radiographs.3
The cost is typically between $200 and $500. The test is usually not covered by health insurance, but this differs by insurer and by state; for example, coverage is mandated in Texas, and the test is covered by United Healthcare.
WHAT IS THE EVIDENCE IN FAVOR OF CALCIFICATION SCORING?
Cohort studies with long-term follow-up show that calcification scoring has robust prognostic ability. A pooled analysis of several of these studies2 showed that a higher score strongly correlated with a higher risk of cardiac events over 3 to 5 years. Compared with the risk in people with a score of 0, the risk was twice as high in those with a score of 1 to 112, four times as high with a score of 100 to 400, seven times as high with a score of 400 to 499, and 10 times as high with a score greater than 1,000.2
A cohort study of more than 25,000 patients had similar conclusions about the magnitude of risk associated with coronary calcification.4 It also found that the 10-year risk of death was 0.6% in patients with a score of 0, 3.4% with a score of 101 to 399, 5.3% with a score of 400 to 699, 6.1% with a score of 700 to 999, and 12.2% with a score greater than 1,000.
Although progression of coronary artery calcification may predict the risk of death from any cause,5 the clinical utility of serial measurements is not yet apparent, especially since statin therapy—our front-line treatment for coronary disease—has not been shown to slow the progression of calcification.
Improving the accuracy of risk prediction
If a patient’s 10-year coronary risk is intermediate (10% to 20%), calcification scoring can reclassify the risk as low or high in about 50% of cases and can improve the accuracy of risk prediction.6–8
For example, Elias-Smale et al6 evaluated the effect of calcification scoring in 2,028 asymptomatic patients, with median follow-up of 9.2 years and 135 coronary events observed. Adding the calcification score to the Framingham model significantly improved risk classification, with a net reclassification improvement (NRI) of 0.14 (P < .01). (NRI is a measure of discriminatory performance for a diagnostic test; higher is better.9) Reclassification was most robust in those at intermediate risk, 52% of whom were reclassified, with 30% reclassified to low risk and 22% reclassified to high risk.
Erbel et al7 reported data from the Heinz Nixdorf Recall study, which used calcification scoring to estimate the NRI in 4,129 patients followed for 5 years. During this time there were 93 coronary deaths and non-fatal myocardial infarctions. The addition of the calcification score to the Framingham risk model resulted in an NRI of 0.21 (P = .0002) for patients with a risk of 6% to 20% and 0.31 (P < .0001) for those with a risk of 10% to 20%. Erbel et al also estimated the C statistic (area under the receiver operating characteristic curve; the maximum value is 1.0 and the higher the value the better) for the addition of the calcification score to the Framingham risk model and to the Adult Treatment Panel (ATP) III algorithm. They reported a significant increase of 0.681 to 0.749 with the Framingham model and 0.653 to 0.755 with the ATP III algorithm.
Polonsky et al8 studied a cohort of 5,878 participants from the Multi-Ethnic Study of Atherosclerosis (MESA) and estimated the event risk using a model based on Framingham risk characteristics. When the calcification score was added to the prediction model, 26% of the sample was reclassified to a new risk category. In intermediate-risk patients, 292 (16%) were reclassified as high risk, and 712 (39%) were reclassified as low risk, achieving an NRI of 0.55 (95% confidence interval 0.41 to 0.69; P < .001). In addition, the C statistic for the prediction of cardiovascular events was 0.76 for the model based on Framingham risk characteristics and increased to 0.81 (P < .001) with the addition of calcification scoring.
Improving adherence and care
Knowing that a patient has a higher calcification score, physicians are more likely to prescribe lipid-lowering and antihypertensive drugs (Table 1),10–12 and patients with a higher score are also more often adherent to recommendations regarding diet and exercise.13
Rozanski et al,14 in a randomized controlled trial, showed that measuring coronary artery calcification did not increase downstream medical spending. A modest improvement in systolic blood pressure (P = .02), serum low-density lipoprotein level (P = .04), and waist circumference (P = .01) was observed in patients who had their calcification measured. Patients with the highest scores had the greatest improvement in coronary risk factors, including blood pressure, cholesterol, weight, and regular exercise.
On the other hand, other analyses have suggested that imaging tests are not effective for motivating behavioral changes. This topic deserves more research.15
Less utility in symptomatic disease
Coronary artery calcification scoring has less clinical utility in patients who already have coronary symptoms. Villines et al16 described a cohort of 10,037 patients with coronary symptoms who underwent calcification scoring and computed tomographic coronary angiography and found that stenosis of greater than 50% was present in 3.5% of those who had a score of 0 and in 29% of those with a score higher than 0. Therefore, a score of 0 does not rule out obstructive coronary heart disease if the patient has symptoms. Conversely, these patients may still have coronary artery calcification even if perfusion stress imaging is normal,17,18 and calcification scoring may have a role in the evaluation of equivocal stress tests.19
CALCIFICATION SCORING GUIDELINES
In their most recent (2010) joint guidelines for assessing risk of coronary heart disease in asymptomatic patients,20 the American College of Cardiology and the American Heart Association say coronary artery calcification scoring:
- Is recommended for asymptomatic patients at intermediate 10-year risk (10% to 20%) of coronary heart disease (class IIa recommendation, level of evidence B)
- May be acceptable for asymptomatic patients at low to intermediate risk (6% to 10%) (class IIb recommendation)
- Is discouraged for those at low risk (< 6%) (class III recommendation).
The most recent (2010) criteria for the appropriate use of cardiac computed tomography21 provide similar recommendations. Specifically, coronary artery calcification scoring with noncontrast computed tomography was rated as appropriate for patients at intermediate risk (10% to 20%) of coronary heart disease and for the specific subset of patients who are at low risk (6% to 10%) but who have a family history of premature coronary heart disease.
These recommendations are based on multiple lines of evidence that calcification scoring is a robust risk-predictor, can enhance risk estimates beyond traditional scoring strategies, and may—in theory—improve outcomes.
CALCIFICATION SCORING’S LIMITATIONS
The images used for measuring coronary calcification do predict risk of cardiovascular events, but they are not adequate to assess the severity of coronary stenosis. Further, calcification scoring often leads to incidental findings, which can cause anxiety and possibly lead to more imaging, entailing more radiation exposure and expense. And as noted, there are no randomized trial data demonstrating a reduction in cardiovascular events with the use of calcification scoring.
- Redberg RF, Benjamin EJ, Bittner V, et al. ACCF/AHA 2009 performance measures for primary prevention of cardiovascular disease in adults. J Am Coll Cardiol 2009; 54:1364–1405.
- Greenland P, Bonow RO, Brundage BH, et al. ACCF/AHA 2007 clinical expert consensus document on coronary artery calcium scoring by computed tomography in global cardiovascular risk assessment and in evaluation of patients with chest pain. J Am Coll Cardiol 2007; 49:378–402.
- Winchester DE, Wymer DC, Shifrin RY, Kraft SM, Hill JA. Responsible use of computed tomography in the evaluation of coronary artery disease and chest pain. Mayo Clin Proc 2010; 85:358–364.
- Budoff MJ, Shaw LJ, Liu ST, et al. Long-term prognosis associated with coronary calcification: observations from a registry of 25,253 patients. J Am Coll Cardiol 2007; 49:1860–1870.
- Budoff MJ, Hokanson JE, Nasir K, et al. Progression of coronary artery calcium predicts all-cause mortality. JACC Cardiovasc Imaging 2010; 3:1229–1236.
- Elias-Smale SE, Proença RV, Koller MT, et al. Coronary calcium score improves classification of coronary heart disease risk in the elderly: The Rotterdam study. J Am Coll Cardiol 2010; 56:1407–1414.
- Erbel R, Möhlenkamp S, Moebus S, et al; Heinz Nixdorf Recall Study Investigative Group. Coronary risk stratification, discrimination, and reclassification improvement based on quantification of subclinical coronary atherosclerosis: the Heinz Nixdorf Recall study. J Am Coll Cardiol 2010; 56:1397–1406.
- Polonsky TS, McClelland RL, Jorgensen NW, et al. Coronary artery calcium score and risk classification for coronary heart disease prediction. JAMA 2010; 303:1610–1616.
- Pencina MJ, Agostino RB, Agostino RB, Vasan RS. Evaluating the added predictive ability of a new marker: from area under the ROC curve to reclassification and beyond. Statist Med 2008; 27:157–172.
- Kalia NK, Miller LG, Nasir K, Blumenthal RS, Agrawal N, Budoff MJ. Visualizing coronary calcium is associated with improvements in adherence to statin therapy. Atherosclerosis 2006; 185:394–399.
- Nasir K, McClelland RL, Blumenthal RS, et al. Coronary artery calcium in relation to initiation and continuation of cardiovascular preventive medications: the Multi-Ethnic Study of Atherosclerosis (MESA). Circ Cardiovasc Qual Outcomes 2010; 3:228–235.
- Taylor AJ, Bindeman J, Feuerstein I, et al. Community-based provision of statin and aspirin after the detection of coronary artery calcium within a community-based screening cohort. J Am Coll Cardiol 2008; 51:1337–1341.
- Orakzai RH, Nasir K, Orakzai SH, et al. Effect of patient visualization of coronary calcium by electron beam computed tomography on changes in beneficial lifestyle behaviors. Am J Cardiol 2008; 101:999–1002.
- Rozanski A, Gransar H, Shaw LJ, et al. Impact of coronary artery calcium scanning on coronary risk factors and downstream testing the EISNER (Early Identification of Subclinical Atherosclerosis by Noninvasive Imaging Research) prospective randomized trial. J Am Coll Cardiol 2011; 57:1622–1632.
- Hackam DG, Shojania KG, Spence JD, et al. Influence of noninvasive cardiovascular imaging in primary prevention: systematic review and meta-analysis of randomized trials. Arch Intern Med 2011; 171:977–982.
- Villines TC, Hulten EA, Shaw LJ, et al; CONFIRM Registry Investigators. Prevalence and severity of coronary artery disease and adverse events among symptomatic patients with coronary artery calcification scores of zero undergoing coronary computed tomography angiography. J Am Coll Cardiol 2011; 58:2533–2540.
- Schenker MP, Dorbala S, Hong EC, et al. Interrelation of coronary calcification, myocardial ischemia, and outcomes in patients with intermediate likelihood of coronary artery disease: a combined positron emission tomography/computed tomography study. Circulation 2008; 117:1693–1700.
- Bybee KA, Lee J, Markiewicz R, et al. Diagnostic and clinical benefit of combined coronary calcium and perfusion assessment in patients undergoing PET/CT myocardial perfusion stress imaging. J Nucl Cardiol 2010; 17:188–196.
- Schmermund A, Baumgart D, Sack S, et al. Assessment of coronary calcification by electron-beam computed tomography in symptomatic patients with normal, abnormal or equivocal exercise stress test. Eur Heart J 2000; 21:1674–1682.
- Greenland P, Alpert JS, Beller GA, et al. 2010 ACCF/AHA guideline for assessment of cardiovascular risk in asymptomatic adults. J Am Coll Cardiol 2010; 56:e50–e103.
- Taylor AJ, Cerqueira M, Hodgson JM, et al. ACCF/SCCT/ACR/AHA/ASE/ASNC/NASCI/SCAI/SCMR 2010 appropriate use criteria for cardiac computed tomography. J Am Coll Cardiol 2010; 56:1864–1894.