User login
Documentation and billing: Tips for hospitalists
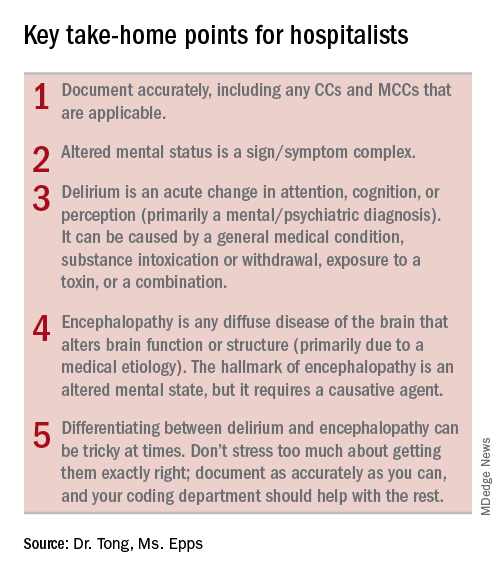
Is it AMS, Delirium, or Encephalopathy?
During residency, physicians are trained to care for patients and write notes that are clinically useful. However, physicians are often not taught about how documentation affects reimbursement and quality measures. Our purpose here, and in articles to follow, is to give readers tools to enable them to more accurately reflect the complexity and work that is done for accurate reimbursements.

If you were to get in a car accident, the body shop would document the damage done and submit it to the insurance company. It’s the body shop’s responsibility to record the damage, not the insurance company’s. So while documentation can seem onerous, the insurance company is not going to scour the chart to find diagnoses missed in the note. That would be like the body shop doing repair work without documenting the damage but then somehow expecting to get paid.
For the insurance company, “If you didn’t document it, it didn’t happen.” The body shop should not underdocument and say there were only a few scratches on the right rear panel if it was severely damaged. Likewise, it should not overbill and say the front bumper was damaged if it was not. The goal is not to bill as much as possible but rather to document appropriately.
Terminology
The expected length of stay (LOS) and the expected mortality for a particular patient is determined by how sick the patient appears to be based on the medical record documentation. So documenting all the appropriate diagnoses makes the LOS index (actual LOS divided by expected LOS) and mortality index more accurate as well. It is particularly important to document when a condition is (or is not) “present on admission”.
While physician payments can be based on evaluation and management coding, the hospital’s reimbursement is largely determined by physician documentation. Hospitals are paid by Medicare on a capitated basis according to the Acute Inpatient Prospective Payment System. The amount paid is determined by the base rate of the hospital multiplied by the relative weight (RW) of the Medicare Severity Diagnosis Related Group (MS-DRG).
The base rate is adjusted by the wage index of the hospital location. Hospitals that serve a high proportion of low income patients receive a Disproportionate Share Hospital adjustment. The base rate is not something hospitalists have control over.
The RW, however, is determined by the primary diagnosis (reason for admission) and whether or not there are complications or comorbidities (CCs) or major complications or comorbidities (MCCs). The more CCs and MCCs a patient has, the higher the severity of illness and expected increased resources needed to care for that patient.
Diagnoses are currently coded using ICD-10 used by the World Health Organization. The ICD-10 of the primary diagnosis is mapped to an MS-DRG. Many, but not all, MS-DRGs have increasing reimbursements for CCs and MCCs. Coders map the ICD-10 of the principal diagnosis along with any associated CCs or MCCs to the MS-DRG code. The relative weights for different DRGs can found on table 5 of the Medicare website (see reference 1).
Altered mental status versus delirium versus encephalopathy
As an example, let’s look at the difference in RW, LOS, and reimbursement in an otherwise identical patient based on documenting altered mental status (AMS), delirium, or encephalopathy. (see Table 1)
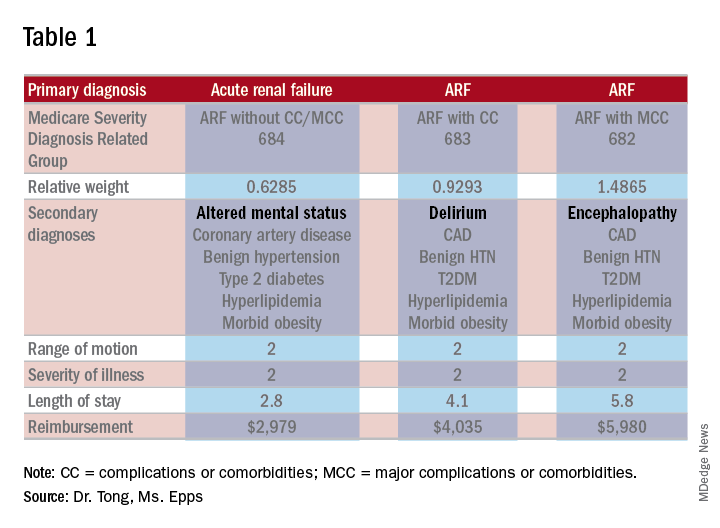
As one can see, RW, estimated LOS, and reimbursement would significantly increase for the patient with delirium (CC) or encephalopathy (MCC) versus AMS (no CC/MCC). A list of which diagnoses are considered CC’s versus MCC’s are on tables 6J and 6I, respectively, on the same Medicare website as table 5.
The difference between AMS, delirium, and encephalopathy
AMS is a sign/symptom complex similar to shortness of breath before an etiology is found. AMS can be the presenting symptom; when a specific etiology is found, however, a more specific diagnosis should be used such as delirium or encephalopathy.
Delirium, according to the DSM-5, is an acute change in the level of attention, cognition, or perception from baseline that developed over hours or days and tends to fluctuate during the course of a day. The change described is not better explained by a preexisting or evolving neurocognitive disorder and does not occur in the context of a severely reduced level of arousal, such as coma. There is evidence from the history, physical examination, or laboratory findings that the disturbance is a direct consequence of a general medical condition, substance intoxication or withdrawal, exposure to a toxin, or more than one cause.
The National Institute of Neurological Diseases and Stroke defines encephalopathy as “any diffuse disease of the brain that alters brain function or structure. Encephalopathy may be caused by an infectious agent, metabolic or mitochondrial dysfunction, brain tumor or increased intracranial pressure, prolonged exposure to toxic elements, chronic progressive trauma, poor nutrition, or lack of oxygen or blood flow to the brain. The hallmark of encephalopathy is an altered mental state.”
It is confusing since there is a lot of overlap in the definitions of delirium and encephalopathy. One way to tease this out conceptually is noting that delirium is listed under mental, behavioral, and neurodevelopmental disorders, while encephalopathy appears under disorders of the nervous system. One can think of delirium as more of a “mental/psychiatric” diagnosis, while encephalopathy is caused by more “medical” causes.
If a patient who is normally not altered presents with confusion because of an infection or metabolic derangement, one can diagnose and document the cause of an acute encephalopathy. However, let’s say a patient is admitted in the morning with an infection, is started on treatment, but is not initially confused. If he/she later becomes confused at night, one could err conservatively and document delirium caused by sundowning.
Differentiating delirium and encephalopathy can be especially difficult in patients who have dementia with episodic confusion when they present with an infection and confusion. If the confusion is within what family members/caretakers say is “normal,” then one shouldn’t document encephalopathy. As a provider, one shouldn’t focus on all the rules and exceptions, just document as specifically and accurately as possible and the coders should take care of the rest.
Dr. Tong is an assistant professor of hospital medicine and an assistant director of the clinical research program at Emory University, Atlanta. Ms. Epps is director of clinical documentation improvement at Emory Healthcare, Atlanta.
References
1. “Acute Inpatient PPS.” Centers for Medicare and Medicaid Services. Accessed 2/17/18. https://www.cms.gov/Medicare/Medicare-Fee-for-Service-Payment/AcuteInpatientPPS/index.html.
2. American Psychiatric Association. Diagnostic and statistical manual of mental disorders (5th ed.). Arlington, VA: American Psychiatric Publishing, 2013.
3. “Details for title: FY 2018 Final Rule and Correction Notice Tables.” Centers for Medicare and Medicaid Services Accessed 2/17/18. https://www.cms.gov/Medicare/Medicare-Fee-for-Service-Payment/AcuteInpatientPPS/FY2018-IPPS-Final-Rule-Home-Page-Items/FY2018-IPPS-Final-Rule-Tables.html.
4. “Encephalopathy Information Page.” National Institute of Neurologic Disorders and Stroke. Accessed on 2/17/18. https://www.ninds.nih.gov/Disorders/All-Disorders/Encephalopathy-Information-Page.
5. The ICD-10 Classification of Mental and Behavioural Disorders: Clinical Descriptions and Diagnostic Guidelines. Geneva: World Health Organization, 1992. http://apps.who.int/iris/handle/10665/37958.
Is it AMS, Delirium, or Encephalopathy?
Is it AMS, Delirium, or Encephalopathy?
During residency, physicians are trained to care for patients and write notes that are clinically useful. However, physicians are often not taught about how documentation affects reimbursement and quality measures. Our purpose here, and in articles to follow, is to give readers tools to enable them to more accurately reflect the complexity and work that is done for accurate reimbursements.
If you were to get in a car accident, the body shop would document the damage done and submit it to the insurance company. It’s the body shop’s responsibility to record the damage, not the insurance company’s. So while documentation can seem onerous, the insurance company is not going to scour the chart to find diagnoses missed in the note. That would be like the body shop doing repair work without documenting the damage but then somehow expecting to get paid.
For the insurance company, “If you didn’t document it, it didn’t happen.” The body shop should not underdocument and say there were only a few scratches on the right rear panel if it was severely damaged. Likewise, it should not overbill and say the front bumper was damaged if it was not. The goal is not to bill as much as possible but rather to document appropriately.
Terminology
The expected length of stay (LOS) and the expected mortality for a particular patient is determined by how sick the patient appears to be based on the medical record documentation. So documenting all the appropriate diagnoses makes the LOS index (actual LOS divided by expected LOS) and mortality index more accurate as well. It is particularly important to document when a condition is (or is not) “present on admission”.
While physician payments can be based on evaluation and management coding, the hospital’s reimbursement is largely determined by physician documentation. Hospitals are paid by Medicare on a capitated basis according to the Acute Inpatient Prospective Payment System. The amount paid is determined by the base rate of the hospital multiplied by the relative weight (RW) of the Medicare Severity Diagnosis Related Group (MS-DRG).
The base rate is adjusted by the wage index of the hospital location. Hospitals that serve a high proportion of low income patients receive a Disproportionate Share Hospital adjustment. The base rate is not something hospitalists have control over.
The RW, however, is determined by the primary diagnosis (reason for admission) and whether or not there are complications or comorbidities (CCs) or major complications or comorbidities (MCCs). The more CCs and MCCs a patient has, the higher the severity of illness and expected increased resources needed to care for that patient.
Diagnoses are currently coded using ICD-10 used by the World Health Organization. The ICD-10 of the primary diagnosis is mapped to an MS-DRG. Many, but not all, MS-DRGs have increasing reimbursements for CCs and MCCs. Coders map the ICD-10 of the principal diagnosis along with any associated CCs or MCCs to the MS-DRG code. The relative weights for different DRGs can found on table 5 of the Medicare website (see reference 1).
Altered mental status versus delirium versus encephalopathy
As an example, let’s look at the difference in RW, LOS, and reimbursement in an otherwise identical patient based on documenting altered mental status (AMS), delirium, or encephalopathy. (see Table 1)
As one can see, RW, estimated LOS, and reimbursement would significantly increase for the patient with delirium (CC) or encephalopathy (MCC) versus AMS (no CC/MCC). A list of which diagnoses are considered CC’s versus MCC’s are on tables 6J and 6I, respectively, on the same Medicare website as table 5.
The difference between AMS, delirium, and encephalopathy
AMS is a sign/symptom complex similar to shortness of breath before an etiology is found. AMS can be the presenting symptom; when a specific etiology is found, however, a more specific diagnosis should be used such as delirium or encephalopathy.
Delirium, according to the DSM-5, is an acute change in the level of attention, cognition, or perception from baseline that developed over hours or days and tends to fluctuate during the course of a day. The change described is not better explained by a preexisting or evolving neurocognitive disorder and does not occur in the context of a severely reduced level of arousal, such as coma. There is evidence from the history, physical examination, or laboratory findings that the disturbance is a direct consequence of a general medical condition, substance intoxication or withdrawal, exposure to a toxin, or more than one cause.
The National Institute of Neurological Diseases and Stroke defines encephalopathy as “any diffuse disease of the brain that alters brain function or structure. Encephalopathy may be caused by an infectious agent, metabolic or mitochondrial dysfunction, brain tumor or increased intracranial pressure, prolonged exposure to toxic elements, chronic progressive trauma, poor nutrition, or lack of oxygen or blood flow to the brain. The hallmark of encephalopathy is an altered mental state.”
It is confusing since there is a lot of overlap in the definitions of delirium and encephalopathy. One way to tease this out conceptually is noting that delirium is listed under mental, behavioral, and neurodevelopmental disorders, while encephalopathy appears under disorders of the nervous system. One can think of delirium as more of a “mental/psychiatric” diagnosis, while encephalopathy is caused by more “medical” causes.
If a patient who is normally not altered presents with confusion because of an infection or metabolic derangement, one can diagnose and document the cause of an acute encephalopathy. However, let’s say a patient is admitted in the morning with an infection, is started on treatment, but is not initially confused. If he/she later becomes confused at night, one could err conservatively and document delirium caused by sundowning.
Differentiating delirium and encephalopathy can be especially difficult in patients who have dementia with episodic confusion when they present with an infection and confusion. If the confusion is within what family members/caretakers say is “normal,” then one shouldn’t document encephalopathy. As a provider, one shouldn’t focus on all the rules and exceptions, just document as specifically and accurately as possible and the coders should take care of the rest.
Dr. Tong is an assistant professor of hospital medicine and an assistant director of the clinical research program at Emory University, Atlanta. Ms. Epps is director of clinical documentation improvement at Emory Healthcare, Atlanta.
References
1. “Acute Inpatient PPS.” Centers for Medicare and Medicaid Services. Accessed 2/17/18. https://www.cms.gov/Medicare/Medicare-Fee-for-Service-Payment/AcuteInpatientPPS/index.html.
2. American Psychiatric Association. Diagnostic and statistical manual of mental disorders (5th ed.). Arlington, VA: American Psychiatric Publishing, 2013.
3. “Details for title: FY 2018 Final Rule and Correction Notice Tables.” Centers for Medicare and Medicaid Services Accessed 2/17/18. https://www.cms.gov/Medicare/Medicare-Fee-for-Service-Payment/AcuteInpatientPPS/FY2018-IPPS-Final-Rule-Home-Page-Items/FY2018-IPPS-Final-Rule-Tables.html.
4. “Encephalopathy Information Page.” National Institute of Neurologic Disorders and Stroke. Accessed on 2/17/18. https://www.ninds.nih.gov/Disorders/All-Disorders/Encephalopathy-Information-Page.
5. The ICD-10 Classification of Mental and Behavioural Disorders: Clinical Descriptions and Diagnostic Guidelines. Geneva: World Health Organization, 1992. http://apps.who.int/iris/handle/10665/37958.
RTNI to Safely Reduce Dysglycemia
Dysglycemia, defined as a random blood glucose value >180 mg/dL or <70 mg/dL, is present in 25% to 28% of hospitalized patients.1, 2 It is associated with poor clinical outcomes, such as increased hospital‐acquired infection rates, increased hospital length of stay, and higher mortality rates.25 Although optimal targets for glycemic control remain unknown for non‐criticallyill patients, adverse effects of hyperglycemia remain very clear.3, 5, 6 The American Diabetes Association and various medical societies have published recommendations and position statements urging better management of hyperglycemia even in stabilized patients on general medical floors.7 Effective options for managing inpatient dysglycemia are available,8 but still remain underutilized. Despite increasing questions about its clinical benefit, lone correctional insulin (LCI) therapy, commonly known as sliding scale insulin, remains a common approach for glycemic control.9, 10 Explanations for this clinical inertia to utilize best practices range from fears of causing hypoglycemia, to a shortage of glycemic control specialists.11
Along with LCI therapy, use of potentially inappropriate oral hypoglycemic medications (PIOHMs) during hospitalization remains common. Scotton et al.12 reports that up to 68% of hospitalized patients on metformin were continued on the drug despite contraindications to its use.1214 Surgical intervention, intravenous contrast use, and elevated creatinine accounted for the majority of contraindications.12 Unfortunately, an educational memo mailed to physicians as well as a computer alert regarding the contraindications to metformin use failed to decrease the inappropriate use of metformin on an inpatient basis.12 Notably, the computer alert appeared whenever metformin was prescribed but did not require the clinician to actively acknowledge the statement. One study has found that inpatient metformin use did not result in increased mortality or adverse events.
Research has shown that implementation of best practices increases with a team approach, or when specialist oversight follows educational efforts.15, 16 Elinav et al.15 describe the difficulty in maintaining specialist oversight, which was essential to provide enhanced glycemic control for inpatients. To capture the potential strengths of team‐based care and specialist oversight, we hypothesized that a glycemic control order set combined with a real‐time nursing intervention (RTNI) could improve best‐practice utilization for glycemic control among hospitalized patients. This intervention likely has the capability to be sustainable, as it is modeled to be incorporated into the frontline workflow. This pilot study depicts the effects of a comprehensive effort to improve glycemic control catalyzed by the RTNI.
Materials and Methods
This study was carried out in a new 110‐bed exurban community teaching hospital, where patients with dysglycemia are primarily treated by family medicine residents, academic hospitalists, private generalists, and bariatric surgeons. Several months prior to the beginning of the study, a glycemic control task force was formed and supported as part of the strategic plan for this new hospital. The interventions in this study were approved by the task force as part of a quality improvement program (QI). Institutional review board (IRB) approval for this study was obtained through Emory University.
A total of 653 patients qualified to participate in this study (Table 1). The analysis was retrospective, using the hospital's electronic health record. Patients were included based on the frequency of blood glucose values obtained. Consent was not required nor obtained for this analysis.
| Baseline (n = 142) | Education (n = 153) | RTNI (n = 183) | Post‐RTNI (n = 175) | P value | |
|---|---|---|---|---|---|
| |||||
| Age (years) | 61 | 60 | 64 | 64 | 0.0606 |
| Weight (lb) | 202 | 207 | 188 | 200 | 0.0378 |
| Serum creatinine | 1.31 | 1.40 | 1.43 | 1.65 | 0.3161 |
| Sex (% male) | 46 | 47 | 40 | 38 | 0.3067 |
| WBC | 9.2 | 9.5 | 9.9 | 9.4 | 0.7249 |
Prior to the RTNI, several educational programs were undertaken from mid‐September 2007 to early November 2007. The glycemic control task force conducted physician education through: 1‐on‐1 physician office visits; phone conferences for hospital‐based physicians; and mailed letters to physicians informing them of available protocols. All 40 physicians who manage dysglycemia at this hospital were contacted by the principal investigator (PI), with 2 exceptions, due to logistic difficulties. We posted clinical guidelines to treat dysglycemia and glucometric performance data in physician workstations. In addition, we developed and conducted a mandatory educational session for nurses. The session lasted 6 hours, and consisted of literature review, pathophysiology, hospital metrics, diabetic pharmacology, and dietary education. All nurses who work on the medical and surgical floors of our hospital were required to attend. Nurses hired after the live educational sessions were required to watch a videotape. Finally, we compiled, distributed, and publicized a paper‐based glycemic control order set for non‐critically‐ill patients. The glycemic control protocol (GCP) contained prompts to encourage key elements of best practices, such as basal insulin, use of prandial insulin for patients who were eating, automatic orders for nurses to address nutritional interruptions, and a hypoglycemic protocol (see Appendix A: Glycemic Control Protocol).
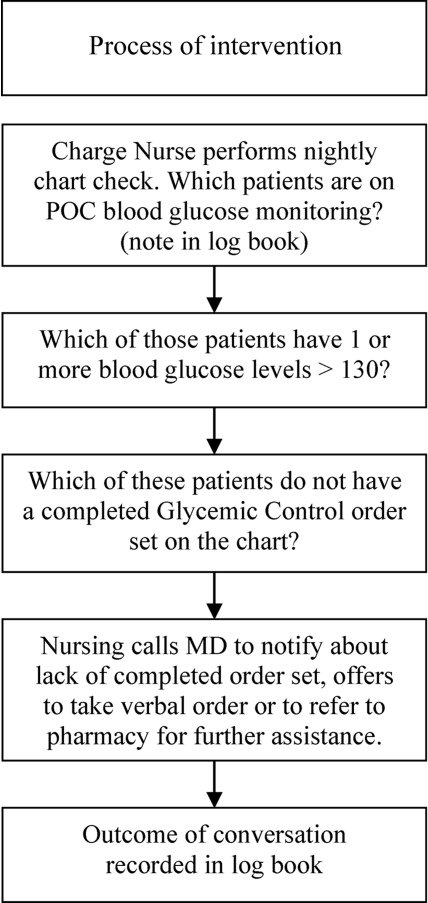
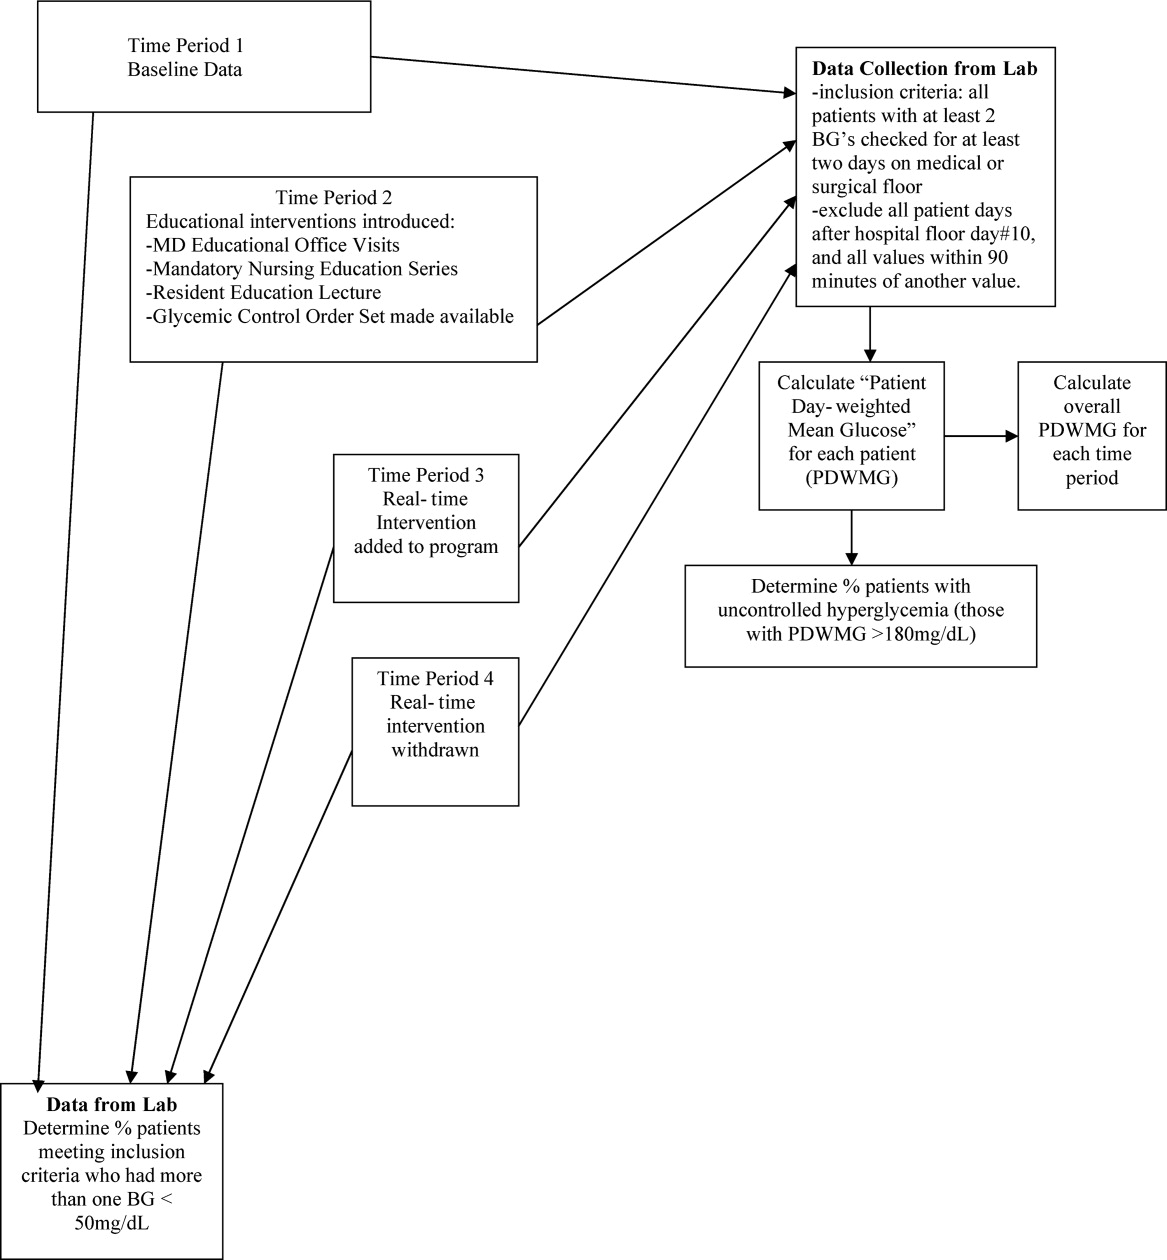
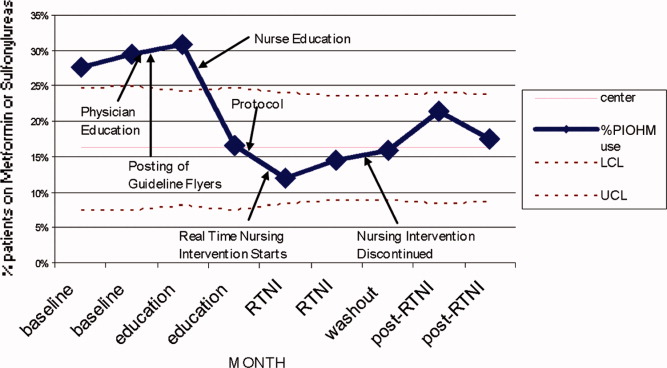
After these educational measures, the RTNI ran for 2 months (December 1, 2007 to January 31, 2008). The charge nurse of each floor identified patients with point of care (POC) glucose monitoring who had any glucose level >130mg/dL. When any such patient did not have a physician‐completed GCP, the charge nurse called the attending physician to remind them of the availability and likely appropriateness of initiating the GCP. The nurses offered to take verbal orders for the GCP and referred the physicians to the hospital pharmacist for any dosing questions. This information was recorded on log sheets and stored in a secure office by the charge nurses. After 2 months, the RTNI was removed as scheduled (Figure 1).

The hospital's electronic clinical information system was used to extract information on all noncritical and nonobstetric adult patients having 2 recorded blood glucose values per day for at least 2 days during the admission. Both serum glucose and POC glucose values were sufficient for inclusion. This level of glucose monitoring was the only qualifying criteria. Serum glucose testing was performed on the Siemens RXL MAX (Siemens, Deerfield, IL), and POC glucose values were obtained using the Roche Accuchek (Roche, Nutley, NJ).
One laboratory technician was trained to conduct this data extraction. This work was reviewed by the PI to assure data integrity. Our analysis included data on qualifying patients from the following time periods: (1) patients hospitalized during the 2‐month period prior to the initiation of educational programs (baseline); (2) patients hospitalized during the 2 months of education; (3) patients hospitalized during the RTNI; and (4) patients admitted for 2 months after the RTNI was removed (post‐RTNI). Between the RTNI and the post‐RTNI groups, 1 month's data were discarded as a washout period.
Five metrics were tracked for all patients. The first metric, the overall patient day‐weighted mean glucose (PDWMG; ie, mean glucose for each hospital day, averaged across all hospital days) value, was calculated using a method similar to a previously validated technique.17 We excluded all values <70 mg/dL, all values after day 10 of the hospitalization, and all values within 90 minutes of the previous value. Using the remaining values, the mean for each day was calculated. With each patient having 1 such value per patient‐day, we then calculated the individual PDWMG as the mean of all these patient‐days (1 value per qualifying patient per admission). The overall PDWMG was an average of the PDWMGs for all study patients in a particular time period.
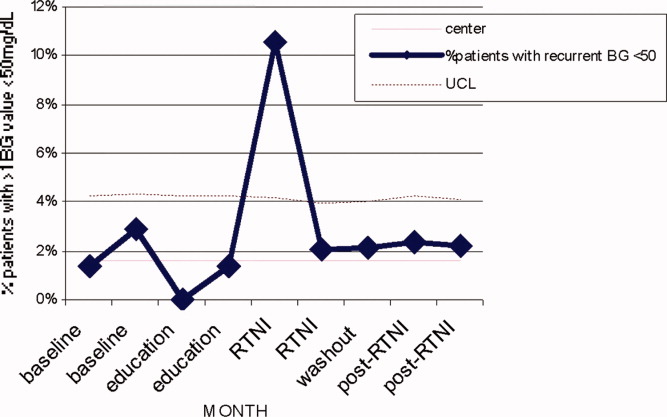
The second metric was the percentage of qualifying patients with PDWMGs >180 mg/dL. The third metric was the percentage of patients who were administered PIOHMs (metformin or sulfonylureas). The fourth metric was the percentage of study patients who were administered correctional insulin without scheduled insulin. Fifth, we calculated the percentage of patients with severe recurrent hypoglycemia (glucose <50 mg/dL on more than 1 occasion separated by 30 minutes). We tracked patient data on a monthly basis and used 1‐way analysis of variance (ANOVA) to analyze the data (Figure 2).
Results
There were 1902 nonobstetric, noncritical, adult admissions to our facility during the entire study period. A total of 521 patients were admitted during the RTNI period. A total of 653 patients met inclusion criteria during the entire study. During the RTNI period, 183 patients met inclusion criteria. Forty‐nine patients met criteria for an RTNI call. The number of patients who had an RTNI call done was 25. The number of patients placed on the order set after an RTNI call was 12.
The study was designed to elucidate whether or not our RTNI was effective in improving best practices and glycemic control in a hospital that provided its staff with education to effectively treat dysglycemia. Compared to baseline, the use of LCIn regimens decreased from 48.2% to 31.3% (P < 0.01) during the RTNI period and the rate of PIOHM usage was reduced from 28.5% to 13.3% (P < 0.01).
We observed a decrease in PDWMG from 166 mg/dL to 156 mg/dL (P = 0.04) and found a trend toward a reduced rate of patients with PDWMG > 180 mg/dL, from 27.0% to 21.7% (P = 0.28). After removal of the intervention, all 4 glycemic control metrics trended back toward and were not significantly different from the baseline, with the exception of PIOHM use. The PIOHM remained significantly lower, from 28.5% in the baseline group, to 19.4% in the postintervention group (P = 0.039) (Table 2). The prevalence of severe recurrent hypoglycemia was not significantly different in 7 of the 8 months. The exception was in the first month of the RTNI, when we observed a spike to 10%. Figures 3 to 5 depict some of these findings using annotated statistical process control charts.

| Outcome Measure | Baseline | Education | Intervention | Postintervention |
|---|---|---|---|---|
| ||||
| Mean PDWMG (mg/dL) | 166.1 | 162.8 (P = 0.52) | 156.4 (P = 0.04) | 167.0 (P = 0.15) |
| Patients with PDWMG > 180 mg/dL (%) | 27.0 | 27.3 (P = 0.075) | 21.7 (P = 0.28) | 24.6 (P = 0.49) |
| Patients on correctional insulin only (%) | 48.2 | 37.9 (P = 0.075) | 31.1 (P = 0.0006) | 37.7 (P = 0.49) |
| Patients on potentially inappropriate medications (%) | 28.5 | 24.2 (P = 0.42) | 13.3 (P = 0.0005) | 19.4 (P = 0.039) |
| Number of patients | 142 | 153 | 183 | 175 |
Discussion
Glucometrics are useful in monitoring changes during a glycemic control QI program.17 Our study was designed to explore the glucometric effect of a RTNI when preceded by staff education and a best‐practice glycemic control order set. In this study, after identifying patients with dysglycemia, charge nurses personally encouraged physicians to use a paper‐based best‐practice order set. During the 2 months of the RTNI, we observed a significant corresponding improvement in many metrics. This improvement largely disappeared following removal of the RTNI. We postulate that the RTNI triggered clinically important moments of awareness or accountability to overcome clinical inertia. The total number of calls was only a fraction of the total patients who met inclusion criteria. We postulate that the publicized RTNI program created a level of awareness for many providers, who came to anticipate phone call reminders regarding use of the GCP. Clinical inertia has been described as the failure of health care providers to initiate or intensify therapy when indicated,18 and thereby represents a plausible explanation for underutilizing best‐practice guidelines.
PIOHM usage decreased and stayed low after withdrawal of the intervention. The literature is not conclusive with regard to the inappropriateness of oral medication use in hospitals, but avoiding these oral medications is espoused by experts in the field.19
Because our RTNI did not include a focused insulin titration component we did not demonstrate a vast improvement in glycemic control itself, the metric with the greatest association with morbid events.3 We theorize that the addition of a focused titration component to an RTNI may address this issue.
There was a concerning rise in hypoglycemic events initially, which completely returned to pre‐RTNI levels in 1 month. Although the reason for the increased hypoglycemia is not clear, we speculate that the lack of physician familiarity with insulin dosing played a large role. Since this problem did not persist after the first RTNI month, despite the same study conditions, we speculate that the physicians responsible adapted by learning to make the appropriate dose adjustments. In these patients, no intensive care unit (ICU) transfers or seizures resulted from the hypoglycemia.
Hypoglycemia is a common problem encountered even in several studies on intensive glucose control in both an inpatient and outpatient setting. In medical ICU patients, the rate of hypoglycemia was shown be 18.7% in the intensive treatment group as compared with 3.1% in the control group.20 Hypoglycemia is also the reason one clinical trial on intensive insulin therapy in critically ill patients was stopped.21 However, one study of 302 ICU patients found no association between hypoglycemia and short‐term (within 5 days of the event) or late (hospital) mortality.22 The Normoglycaemia in Intensive Care Evaluation and Survival Using Glucose Algorithm Regulation (NICE‐SUGAR) study found a lower overall incidence of severe hypoglycemia in its study of critically ill patients, but the tight glycemic control group had a 2.6% higher mortality rate, and the number needed to harm was only 38.23
In February 2008, the outpatient glycemic control study of Evaluating How the Treatments in the Action to Control Cardiovascular Risk in Diabetes (ACCORD) was halted due to the finding of an increased rate of mortality in the intensive arm compared with the standard arm. In both study arms, participants with severe hypoglycemia had higher mortality than those without severe hypoglycemia. Controversy still remains secondary to the inability of the ACCORD, Action in Diabetes and Vascular Disease: Preterax and Diamicron MR Controlled Evaluation (ADVANCE), and Veterans Administration Diabetes Trial (VADT) trials to demonstrate significant reduction of cardiovascular disease (CVD) with intensive glycemic control in outpatients and recently the American Diabetes Association (ADA) came out with a position statement,24 in which it concludes the evidence obtained from the ACCORD, ADVANCE, and VADT trials do not suggest the need for total abandonment of, or major changes in glycemic control targets. The statement stresses on individualization as the benefits of intensive glycemic control on microvascular and neuropathic complications are well established for both type 1 and type 2 diabetes. This controversy is all the more reason to properly address dysglycemia. LCI places patients at risk for both hyperglycemia from lack of basal insulin, and hypoglycemia from insulin stacking. A proactive strategy of appropriately dosed scheduled insulin via a defined protocol is therefore recommended.
Our study demonstrates that a relatively simple intervention can create the situational awareness to overcome clinical inertia in appropriately treating hyperglycemia. However, it clearly warns glycemic control QI leaders of the need to diligently monitor for hypoglycemia as improvement efforts begin. A system devised to formally check insulin dosing may be warranted. Healthcare providers new to practicing proactive glycemic control with basal/bolus insulin regimens may require close oversight, especially early in the Do phase of the Plan Do Study Act (PDSA) cycle. The Randomized Study of Basal Bolus Insulin Therapy in the Inpatient Management of Patients with Type 2 Diabetes (RABBIT 2) trial randomized insulin naive diabetic patients to weight based scheduled insulin dosing and an adjustable LCI regimen, and found no difference in rates of hypoglycemia, while substantially reducing hyperglycemia with scheduled insulin.25 Our study included patients with advanced age and renal dysfunction who require decreased insulin dosing, the initial increase of hypoglycemia highlights the need for further research in this area.
Study Limitations
This study does have limitations. First, it is not clear how much the improvement in glucometrics was due to the RTNI alone. In fact, it is likely that there was a carryover effect from the education period. A longer time series might make the relative contributions clearer. Second, routine glycosylated hemoglobin (HbA1c) values, severity of illness, patient mix, and mortality were not assessed in this study. It is difficult to generalize the results of this single‐center study. Finally, our method of tracking glycemic control was limited by evaluating patient stay (patient day‐weighted mean glucose, PDWMG; ie, mean glucose for each hospital day, averaged across all hospital days), rather than the patient day mean glucose (PDMG). Mean glucose changes in short hospital patient stay may be highly blunted by using this method. Rigorous analyses in future QI studies using PDMG may be done by excluding the PDMG values for the first hospital day in all patients. This would yield a greater number of meaningful data points, enabling a more clear and rapid realization of results.
Conclusions
An RTNI coupled with a GCP significantly improved best‐practices for hospitalized patients with dysglycemia and may have modestly improved glycemic control. The RTNI accommodates normal clinical workflow and therefore is likely to be sustainable. Additional study should gauge the effect of a focused insulin titration component and further investigation is needed to gauge sustainability, transferability across nursing units and hospitals, and scalability of the underlying concept to additional inpatient care metrics. Vigilant monitoring of hypoglycemia is necessary as glycemic control QI initiatives are undertaken.
Acknowledgements
The authors thank Jennifer H. Eig, MPH; Alicia Fish, MT; Emily O'Malley, MSPH; Moges S. Ido, MPH; John D. Quinlivan, MHA; Kimberly Bentley, MS; Gloria Nunn, PhD; Laurie Hansen, MS; Beth Delrossi, PharmD; Roland Tam, PharmD; Christina Ostrowski, BS; and all others who contributed to the study.
- ,,, et al.Diabetes care in hospitalized noncritically ill patients: more evidence for clinical inertia and negative therapeutic momentum.J Hosp Med.2007;2(4):203–211.
- ,.Inpatient diabetes management in non‐ICU settings: evidence and strategies.Curr Diabetes Rev.2007;3(4):239–243.
- ,,, et al.Hyperglycemia: an independent marker of in‐hospital mortality in patients with undiagnosed diabetes.J Clin Endocrinol Metab.2002;87(3):978–982.
- ,.Glycemic chaos (not glycemic control) still the rule for inpatient care: how do we stop the insanity?J Hosp Med.2006;1(3):141–144.
- ,.Financial implications of glycemic control: results of an inpatient diabetes management program.Endocr Pract.2006;12(3):43–48.
- ,,, et al.Early postoperative glucose control predicts nosocomial infection rate in diabetic patients.J Parenter Enter Nutr.1998;22:77–81.
- ,,, et al.Management of diabetes and hyperglycemia in hospitals.Diabetes Care.2004;27:856.
- ,.Point: inpatient glucose management: the emperor finally has clothes.Diabetes Care.2005;28(4):973–975.
- ,. Sliding‐scale insulin therapy: an ineffective option for inpatient glycemic control. Available at:http://www.residentandstaff.com/issues/articles/2007–02_08.asp. Accessed July 2009.
- ,,.Glycemic control and sliding scale insulin use in medical inpatients with diabetes mellitus.Arch Intern Med.1997;157:545–552.
- ,,, et al.Improving glycemic control in medical inpatients: a pilot study.J Hosp Med.2008;3(1):55–63.
- ,,,,.Assessing the appropriate use of metformin in an inpatient setting and the effectiveness of two pharmacy‐based measures to improve guideline adherence.Qual Manag Health Care.2009;18(1):71–76.
- ,,,,.Evaluation of prescribing practices: risk of lactic acidosis with metformin therapy.Arch Intern Med.2002;162(4):434–437.
- ,,,,,Retrospective review of metformin in inpatients and outpatients at the University of Michigan.Diabetes Care.2006;29(1):170–171.
- ,,, et al.In‐hospital treatment of hyperglycemia: effects of intensified subcutaneous insulin treatment.Curr Med Res Opin.2007;23(4):757–765.
- ,,, et al.An institutional process to improve inpatient glycemic control.Qual Manag Health Care.2007;16(3):239–249.
- ,,, et al.“Glucometrics”—assessing the quality of inpatient glucose management.Diabetes Technol Ther.2006;8(5):560–569.
- ,,, et al.Clinical inertia.Ann Intern Med.2001;135(9):825–834.
- ,,,,.Management of diabetes and hyperglycemia in the hospital: a practical guide to subcutaneous insulin use in the non‐critically ill, adult patient.J Hosp Med.2008;3(S5):17–18.
- ,,, et al.Intensive insulin therapy in the medical ICU.N Engl J Med2006;354:449–461.
- ,,, et al.Intensive insulin therapy and pentastarch resuscitation in severe sepsis (VISEP).N Engl J Med.2008;358(2):125–139.
- ,,, et al.Evaluation of short‐term consequences of hypoglycemia in an intensive care unit.Crit Care Med.2006;34:2714–2718.
- ,,, et al.Intensive versus conventional glucose control in critically ill patients (NICE SUGAR).N Engl J Med.2009;26;360(13):1283–1297.
- ,,, et al.Intensive glycemic control and the prevention of cardiovascular events: implications of the ACCORD, ADVANCE, and VA Diabetes Trials: a position statement of the American Diabetes Association and a Scientific Statement of the American College of Cardiology Foundation and the American Heart Association.Circulation.2009;119:351–357.
- ,,.Randomized study of basal‐bolus insulin therapy in the inpatient management of patients with type 2 diabetes (RABBIT 2 trial).Diabetes Care.2007;30(9):2181–2186.
Dysglycemia, defined as a random blood glucose value >180 mg/dL or <70 mg/dL, is present in 25% to 28% of hospitalized patients.1, 2 It is associated with poor clinical outcomes, such as increased hospital‐acquired infection rates, increased hospital length of stay, and higher mortality rates.25 Although optimal targets for glycemic control remain unknown for non‐criticallyill patients, adverse effects of hyperglycemia remain very clear.3, 5, 6 The American Diabetes Association and various medical societies have published recommendations and position statements urging better management of hyperglycemia even in stabilized patients on general medical floors.7 Effective options for managing inpatient dysglycemia are available,8 but still remain underutilized. Despite increasing questions about its clinical benefit, lone correctional insulin (LCI) therapy, commonly known as sliding scale insulin, remains a common approach for glycemic control.9, 10 Explanations for this clinical inertia to utilize best practices range from fears of causing hypoglycemia, to a shortage of glycemic control specialists.11
Along with LCI therapy, use of potentially inappropriate oral hypoglycemic medications (PIOHMs) during hospitalization remains common. Scotton et al.12 reports that up to 68% of hospitalized patients on metformin were continued on the drug despite contraindications to its use.1214 Surgical intervention, intravenous contrast use, and elevated creatinine accounted for the majority of contraindications.12 Unfortunately, an educational memo mailed to physicians as well as a computer alert regarding the contraindications to metformin use failed to decrease the inappropriate use of metformin on an inpatient basis.12 Notably, the computer alert appeared whenever metformin was prescribed but did not require the clinician to actively acknowledge the statement. One study has found that inpatient metformin use did not result in increased mortality or adverse events.
Research has shown that implementation of best practices increases with a team approach, or when specialist oversight follows educational efforts.15, 16 Elinav et al.15 describe the difficulty in maintaining specialist oversight, which was essential to provide enhanced glycemic control for inpatients. To capture the potential strengths of team‐based care and specialist oversight, we hypothesized that a glycemic control order set combined with a real‐time nursing intervention (RTNI) could improve best‐practice utilization for glycemic control among hospitalized patients. This intervention likely has the capability to be sustainable, as it is modeled to be incorporated into the frontline workflow. This pilot study depicts the effects of a comprehensive effort to improve glycemic control catalyzed by the RTNI.
Materials and Methods
This study was carried out in a new 110‐bed exurban community teaching hospital, where patients with dysglycemia are primarily treated by family medicine residents, academic hospitalists, private generalists, and bariatric surgeons. Several months prior to the beginning of the study, a glycemic control task force was formed and supported as part of the strategic plan for this new hospital. The interventions in this study were approved by the task force as part of a quality improvement program (QI). Institutional review board (IRB) approval for this study was obtained through Emory University.
A total of 653 patients qualified to participate in this study (Table 1). The analysis was retrospective, using the hospital's electronic health record. Patients were included based on the frequency of blood glucose values obtained. Consent was not required nor obtained for this analysis.
| Baseline (n = 142) | Education (n = 153) | RTNI (n = 183) | Post‐RTNI (n = 175) | P value | |
|---|---|---|---|---|---|
| |||||
| Age (years) | 61 | 60 | 64 | 64 | 0.0606 |
| Weight (lb) | 202 | 207 | 188 | 200 | 0.0378 |
| Serum creatinine | 1.31 | 1.40 | 1.43 | 1.65 | 0.3161 |
| Sex (% male) | 46 | 47 | 40 | 38 | 0.3067 |
| WBC | 9.2 | 9.5 | 9.9 | 9.4 | 0.7249 |
Prior to the RTNI, several educational programs were undertaken from mid‐September 2007 to early November 2007. The glycemic control task force conducted physician education through: 1‐on‐1 physician office visits; phone conferences for hospital‐based physicians; and mailed letters to physicians informing them of available protocols. All 40 physicians who manage dysglycemia at this hospital were contacted by the principal investigator (PI), with 2 exceptions, due to logistic difficulties. We posted clinical guidelines to treat dysglycemia and glucometric performance data in physician workstations. In addition, we developed and conducted a mandatory educational session for nurses. The session lasted 6 hours, and consisted of literature review, pathophysiology, hospital metrics, diabetic pharmacology, and dietary education. All nurses who work on the medical and surgical floors of our hospital were required to attend. Nurses hired after the live educational sessions were required to watch a videotape. Finally, we compiled, distributed, and publicized a paper‐based glycemic control order set for non‐critically‐ill patients. The glycemic control protocol (GCP) contained prompts to encourage key elements of best practices, such as basal insulin, use of prandial insulin for patients who were eating, automatic orders for nurses to address nutritional interruptions, and a hypoglycemic protocol (see Appendix A: Glycemic Control Protocol).
After these educational measures, the RTNI ran for 2 months (December 1, 2007 to January 31, 2008). The charge nurse of each floor identified patients with point of care (POC) glucose monitoring who had any glucose level >130mg/dL. When any such patient did not have a physician‐completed GCP, the charge nurse called the attending physician to remind them of the availability and likely appropriateness of initiating the GCP. The nurses offered to take verbal orders for the GCP and referred the physicians to the hospital pharmacist for any dosing questions. This information was recorded on log sheets and stored in a secure office by the charge nurses. After 2 months, the RTNI was removed as scheduled (Figure 1).
The hospital's electronic clinical information system was used to extract information on all noncritical and nonobstetric adult patients having 2 recorded blood glucose values per day for at least 2 days during the admission. Both serum glucose and POC glucose values were sufficient for inclusion. This level of glucose monitoring was the only qualifying criteria. Serum glucose testing was performed on the Siemens RXL MAX (Siemens, Deerfield, IL), and POC glucose values were obtained using the Roche Accuchek (Roche, Nutley, NJ).
One laboratory technician was trained to conduct this data extraction. This work was reviewed by the PI to assure data integrity. Our analysis included data on qualifying patients from the following time periods: (1) patients hospitalized during the 2‐month period prior to the initiation of educational programs (baseline); (2) patients hospitalized during the 2 months of education; (3) patients hospitalized during the RTNI; and (4) patients admitted for 2 months after the RTNI was removed (post‐RTNI). Between the RTNI and the post‐RTNI groups, 1 month's data were discarded as a washout period.
Five metrics were tracked for all patients. The first metric, the overall patient day‐weighted mean glucose (PDWMG; ie, mean glucose for each hospital day, averaged across all hospital days) value, was calculated using a method similar to a previously validated technique.17 We excluded all values <70 mg/dL, all values after day 10 of the hospitalization, and all values within 90 minutes of the previous value. Using the remaining values, the mean for each day was calculated. With each patient having 1 such value per patient‐day, we then calculated the individual PDWMG as the mean of all these patient‐days (1 value per qualifying patient per admission). The overall PDWMG was an average of the PDWMGs for all study patients in a particular time period.
The second metric was the percentage of qualifying patients with PDWMGs >180 mg/dL. The third metric was the percentage of patients who were administered PIOHMs (metformin or sulfonylureas). The fourth metric was the percentage of study patients who were administered correctional insulin without scheduled insulin. Fifth, we calculated the percentage of patients with severe recurrent hypoglycemia (glucose <50 mg/dL on more than 1 occasion separated by 30 minutes). We tracked patient data on a monthly basis and used 1‐way analysis of variance (ANOVA) to analyze the data (Figure 2).
Results
There were 1902 nonobstetric, noncritical, adult admissions to our facility during the entire study period. A total of 521 patients were admitted during the RTNI period. A total of 653 patients met inclusion criteria during the entire study. During the RTNI period, 183 patients met inclusion criteria. Forty‐nine patients met criteria for an RTNI call. The number of patients who had an RTNI call done was 25. The number of patients placed on the order set after an RTNI call was 12.
The study was designed to elucidate whether or not our RTNI was effective in improving best practices and glycemic control in a hospital that provided its staff with education to effectively treat dysglycemia. Compared to baseline, the use of LCIn regimens decreased from 48.2% to 31.3% (P < 0.01) during the RTNI period and the rate of PIOHM usage was reduced from 28.5% to 13.3% (P < 0.01).
We observed a decrease in PDWMG from 166 mg/dL to 156 mg/dL (P = 0.04) and found a trend toward a reduced rate of patients with PDWMG > 180 mg/dL, from 27.0% to 21.7% (P = 0.28). After removal of the intervention, all 4 glycemic control metrics trended back toward and were not significantly different from the baseline, with the exception of PIOHM use. The PIOHM remained significantly lower, from 28.5% in the baseline group, to 19.4% in the postintervention group (P = 0.039) (Table 2). The prevalence of severe recurrent hypoglycemia was not significantly different in 7 of the 8 months. The exception was in the first month of the RTNI, when we observed a spike to 10%. Figures 3 to 5 depict some of these findings using annotated statistical process control charts.
| Outcome Measure | Baseline | Education | Intervention | Postintervention |
|---|---|---|---|---|
| ||||
| Mean PDWMG (mg/dL) | 166.1 | 162.8 (P = 0.52) | 156.4 (P = 0.04) | 167.0 (P = 0.15) |
| Patients with PDWMG > 180 mg/dL (%) | 27.0 | 27.3 (P = 0.075) | 21.7 (P = 0.28) | 24.6 (P = 0.49) |
| Patients on correctional insulin only (%) | 48.2 | 37.9 (P = 0.075) | 31.1 (P = 0.0006) | 37.7 (P = 0.49) |
| Patients on potentially inappropriate medications (%) | 28.5 | 24.2 (P = 0.42) | 13.3 (P = 0.0005) | 19.4 (P = 0.039) |
| Number of patients | 142 | 153 | 183 | 175 |
Discussion
Glucometrics are useful in monitoring changes during a glycemic control QI program.17 Our study was designed to explore the glucometric effect of a RTNI when preceded by staff education and a best‐practice glycemic control order set. In this study, after identifying patients with dysglycemia, charge nurses personally encouraged physicians to use a paper‐based best‐practice order set. During the 2 months of the RTNI, we observed a significant corresponding improvement in many metrics. This improvement largely disappeared following removal of the RTNI. We postulate that the RTNI triggered clinically important moments of awareness or accountability to overcome clinical inertia. The total number of calls was only a fraction of the total patients who met inclusion criteria. We postulate that the publicized RTNI program created a level of awareness for many providers, who came to anticipate phone call reminders regarding use of the GCP. Clinical inertia has been described as the failure of health care providers to initiate or intensify therapy when indicated,18 and thereby represents a plausible explanation for underutilizing best‐practice guidelines.
PIOHM usage decreased and stayed low after withdrawal of the intervention. The literature is not conclusive with regard to the inappropriateness of oral medication use in hospitals, but avoiding these oral medications is espoused by experts in the field.19
Because our RTNI did not include a focused insulin titration component we did not demonstrate a vast improvement in glycemic control itself, the metric with the greatest association with morbid events.3 We theorize that the addition of a focused titration component to an RTNI may address this issue.
There was a concerning rise in hypoglycemic events initially, which completely returned to pre‐RTNI levels in 1 month. Although the reason for the increased hypoglycemia is not clear, we speculate that the lack of physician familiarity with insulin dosing played a large role. Since this problem did not persist after the first RTNI month, despite the same study conditions, we speculate that the physicians responsible adapted by learning to make the appropriate dose adjustments. In these patients, no intensive care unit (ICU) transfers or seizures resulted from the hypoglycemia.
Hypoglycemia is a common problem encountered even in several studies on intensive glucose control in both an inpatient and outpatient setting. In medical ICU patients, the rate of hypoglycemia was shown be 18.7% in the intensive treatment group as compared with 3.1% in the control group.20 Hypoglycemia is also the reason one clinical trial on intensive insulin therapy in critically ill patients was stopped.21 However, one study of 302 ICU patients found no association between hypoglycemia and short‐term (within 5 days of the event) or late (hospital) mortality.22 The Normoglycaemia in Intensive Care Evaluation and Survival Using Glucose Algorithm Regulation (NICE‐SUGAR) study found a lower overall incidence of severe hypoglycemia in its study of critically ill patients, but the tight glycemic control group had a 2.6% higher mortality rate, and the number needed to harm was only 38.23
In February 2008, the outpatient glycemic control study of Evaluating How the Treatments in the Action to Control Cardiovascular Risk in Diabetes (ACCORD) was halted due to the finding of an increased rate of mortality in the intensive arm compared with the standard arm. In both study arms, participants with severe hypoglycemia had higher mortality than those without severe hypoglycemia. Controversy still remains secondary to the inability of the ACCORD, Action in Diabetes and Vascular Disease: Preterax and Diamicron MR Controlled Evaluation (ADVANCE), and Veterans Administration Diabetes Trial (VADT) trials to demonstrate significant reduction of cardiovascular disease (CVD) with intensive glycemic control in outpatients and recently the American Diabetes Association (ADA) came out with a position statement,24 in which it concludes the evidence obtained from the ACCORD, ADVANCE, and VADT trials do not suggest the need for total abandonment of, or major changes in glycemic control targets. The statement stresses on individualization as the benefits of intensive glycemic control on microvascular and neuropathic complications are well established for both type 1 and type 2 diabetes. This controversy is all the more reason to properly address dysglycemia. LCI places patients at risk for both hyperglycemia from lack of basal insulin, and hypoglycemia from insulin stacking. A proactive strategy of appropriately dosed scheduled insulin via a defined protocol is therefore recommended.
Our study demonstrates that a relatively simple intervention can create the situational awareness to overcome clinical inertia in appropriately treating hyperglycemia. However, it clearly warns glycemic control QI leaders of the need to diligently monitor for hypoglycemia as improvement efforts begin. A system devised to formally check insulin dosing may be warranted. Healthcare providers new to practicing proactive glycemic control with basal/bolus insulin regimens may require close oversight, especially early in the Do phase of the Plan Do Study Act (PDSA) cycle. The Randomized Study of Basal Bolus Insulin Therapy in the Inpatient Management of Patients with Type 2 Diabetes (RABBIT 2) trial randomized insulin naive diabetic patients to weight based scheduled insulin dosing and an adjustable LCI regimen, and found no difference in rates of hypoglycemia, while substantially reducing hyperglycemia with scheduled insulin.25 Our study included patients with advanced age and renal dysfunction who require decreased insulin dosing, the initial increase of hypoglycemia highlights the need for further research in this area.
Study Limitations
This study does have limitations. First, it is not clear how much the improvement in glucometrics was due to the RTNI alone. In fact, it is likely that there was a carryover effect from the education period. A longer time series might make the relative contributions clearer. Second, routine glycosylated hemoglobin (HbA1c) values, severity of illness, patient mix, and mortality were not assessed in this study. It is difficult to generalize the results of this single‐center study. Finally, our method of tracking glycemic control was limited by evaluating patient stay (patient day‐weighted mean glucose, PDWMG; ie, mean glucose for each hospital day, averaged across all hospital days), rather than the patient day mean glucose (PDMG). Mean glucose changes in short hospital patient stay may be highly blunted by using this method. Rigorous analyses in future QI studies using PDMG may be done by excluding the PDMG values for the first hospital day in all patients. This would yield a greater number of meaningful data points, enabling a more clear and rapid realization of results.
Conclusions
An RTNI coupled with a GCP significantly improved best‐practices for hospitalized patients with dysglycemia and may have modestly improved glycemic control. The RTNI accommodates normal clinical workflow and therefore is likely to be sustainable. Additional study should gauge the effect of a focused insulin titration component and further investigation is needed to gauge sustainability, transferability across nursing units and hospitals, and scalability of the underlying concept to additional inpatient care metrics. Vigilant monitoring of hypoglycemia is necessary as glycemic control QI initiatives are undertaken.
Acknowledgements
The authors thank Jennifer H. Eig, MPH; Alicia Fish, MT; Emily O'Malley, MSPH; Moges S. Ido, MPH; John D. Quinlivan, MHA; Kimberly Bentley, MS; Gloria Nunn, PhD; Laurie Hansen, MS; Beth Delrossi, PharmD; Roland Tam, PharmD; Christina Ostrowski, BS; and all others who contributed to the study.
- ,,, et al.Diabetes care in hospitalized noncritically ill patients: more evidence for clinical inertia and negative therapeutic momentum.J Hosp Med.2007;2(4):203–211.
- ,.Inpatient diabetes management in non‐ICU settings: evidence and strategies.Curr Diabetes Rev.2007;3(4):239–243.
- ,,, et al.Hyperglycemia: an independent marker of in‐hospital mortality in patients with undiagnosed diabetes.J Clin Endocrinol Metab.2002;87(3):978–982.
- ,.Glycemic chaos (not glycemic control) still the rule for inpatient care: how do we stop the insanity?J Hosp Med.2006;1(3):141–144.
- ,.Financial implications of glycemic control: results of an inpatient diabetes management program.Endocr Pract.2006;12(3):43–48.
- ,,, et al.Early postoperative glucose control predicts nosocomial infection rate in diabetic patients.J Parenter Enter Nutr.1998;22:77–81.
- ,,, et al.Management of diabetes and hyperglycemia in hospitals.Diabetes Care.2004;27:856.
- ,.Point: inpatient glucose management: the emperor finally has clothes.Diabetes Care.2005;28(4):973–975.
- ,. Sliding‐scale insulin therapy: an ineffective option for inpatient glycemic control. Available at:http://www.residentandstaff.com/issues/articles/2007–02_08.asp. Accessed July 2009.
- ,,.Glycemic control and sliding scale insulin use in medical inpatients with diabetes mellitus.Arch Intern Med.1997;157:545–552.
- ,,, et al.Improving glycemic control in medical inpatients: a pilot study.J Hosp Med.2008;3(1):55–63.
- ,,,,.Assessing the appropriate use of metformin in an inpatient setting and the effectiveness of two pharmacy‐based measures to improve guideline adherence.Qual Manag Health Care.2009;18(1):71–76.
- ,,,,.Evaluation of prescribing practices: risk of lactic acidosis with metformin therapy.Arch Intern Med.2002;162(4):434–437.
- ,,,,,Retrospective review of metformin in inpatients and outpatients at the University of Michigan.Diabetes Care.2006;29(1):170–171.
- ,,, et al.In‐hospital treatment of hyperglycemia: effects of intensified subcutaneous insulin treatment.Curr Med Res Opin.2007;23(4):757–765.
- ,,, et al.An institutional process to improve inpatient glycemic control.Qual Manag Health Care.2007;16(3):239–249.
- ,,, et al.“Glucometrics”—assessing the quality of inpatient glucose management.Diabetes Technol Ther.2006;8(5):560–569.
- ,,, et al.Clinical inertia.Ann Intern Med.2001;135(9):825–834.
- ,,,,.Management of diabetes and hyperglycemia in the hospital: a practical guide to subcutaneous insulin use in the non‐critically ill, adult patient.J Hosp Med.2008;3(S5):17–18.
- ,,, et al.Intensive insulin therapy in the medical ICU.N Engl J Med2006;354:449–461.
- ,,, et al.Intensive insulin therapy and pentastarch resuscitation in severe sepsis (VISEP).N Engl J Med.2008;358(2):125–139.
- ,,, et al.Evaluation of short‐term consequences of hypoglycemia in an intensive care unit.Crit Care Med.2006;34:2714–2718.
- ,,, et al.Intensive versus conventional glucose control in critically ill patients (NICE SUGAR).N Engl J Med.2009;26;360(13):1283–1297.
- ,,, et al.Intensive glycemic control and the prevention of cardiovascular events: implications of the ACCORD, ADVANCE, and VA Diabetes Trials: a position statement of the American Diabetes Association and a Scientific Statement of the American College of Cardiology Foundation and the American Heart Association.Circulation.2009;119:351–357.
- ,,.Randomized study of basal‐bolus insulin therapy in the inpatient management of patients with type 2 diabetes (RABBIT 2 trial).Diabetes Care.2007;30(9):2181–2186.
Copyright © 2010 Society of Hospital Medicine