User login
Dashboards and P4P in VTE Prophylaxis
The Affordable Care Act explicitly outlines improving the value of healthcare by increasing quality and decreasing costs. It emphasizes value‐based purchasing, the transparency of performance metrics, and the use of payment incentives to reward quality.[1, 2] Venous thromboembolism (VTE) prophylaxis is one of these publicly reported performance measures. The National Quality Forum recommends that each patient be evaluated on hospital admission and during their hospitalization for VTE risk level and for appropriate thromboprophylaxis to be used, if required.[3] Similarly, the Joint Commission includes appropriate VTE prophylaxis in its Core Measures.[4] Patient experience and performance metrics, including VTE prophylaxis, constitute the hospital value‐based purchasing (VBP) component of healthcare reform.[5] For a hypothetical 327‐bed hospital, an estimated $1.7 million of a hospital's inpatient payments from Medicare will be at risk from VBP alone.[2]
VTE prophylaxis is a common target of quality improvement projects. Effective, safe, and cost‐effective measures to prevent VTE exist, including pharmacologic and mechanical prophylaxis.[6, 7] Despite these measures, compliance rates are often below 50%.[8] Different interventions have been pursued to ensure appropriate VTE prophylaxis, including computerized provider order entry (CPOE), electronic alerts, mandatory VTE risk assessment and prophylaxis, and provider education campaigns.[9] Recent studies show that CPOE systems with mandatory fields can increase VTE prophylaxis rates to above 80%, yet the goal of a high reliability health system is for 100% of patients to receive recommended therapy.[10, 11, 12, 13, 14, 15] Interventions to improve prophylaxis rates that have included multiple strategies, such as computerized order sets, feedback, and education, have been the most effective, increasing compliance to above 90%.[9, 11, 16] These systems can be enhanced with additional interventions such as providing individualized provider education and feedback, understanding of work flow, and ensuring patients receive the prescribed therapies.[12] For example, a physician dashboard could be employed to provide a snapshot and historical trend of key performance indicators using graphical displays and indicators.[17]
Dashboards and pay‐for‐performance programs have been increasingly used to increase the visibility of these metrics, provide feedback, visually display benchmarks and goals, and proactively monitor for achievements and setbacks.[18] Although these strategies are often addressed at departmental (or greater) levels, applying them at the level of the individual provider may assist hospitals in reducing preventable harm and achieving safety and quality goals, especially at higher benchmarks. With their expanding role, hospitalists provide a key opportunity to lead improvement efforts and to study the impact of dashboards and pay‐for performance at the provider level to achieve VTE prophylaxis performance targets. Hospitalists are often the front‐line provider for inpatients and deliver up to 70% of inpatient general medical services.[19] The objective of our study was to evaluate the impact of providing individual provider feedback and employing a pay‐for‐performance program on baseline performance of VTE prophylaxis among hospitalists. We hypothesized that performance feedback through the use of a dashboard would increase appropriate VTE prophylaxis, and this effect would be further augmented by incorporation of a pay‐for‐performance program.
METHODS
Hospitalist Dashboard
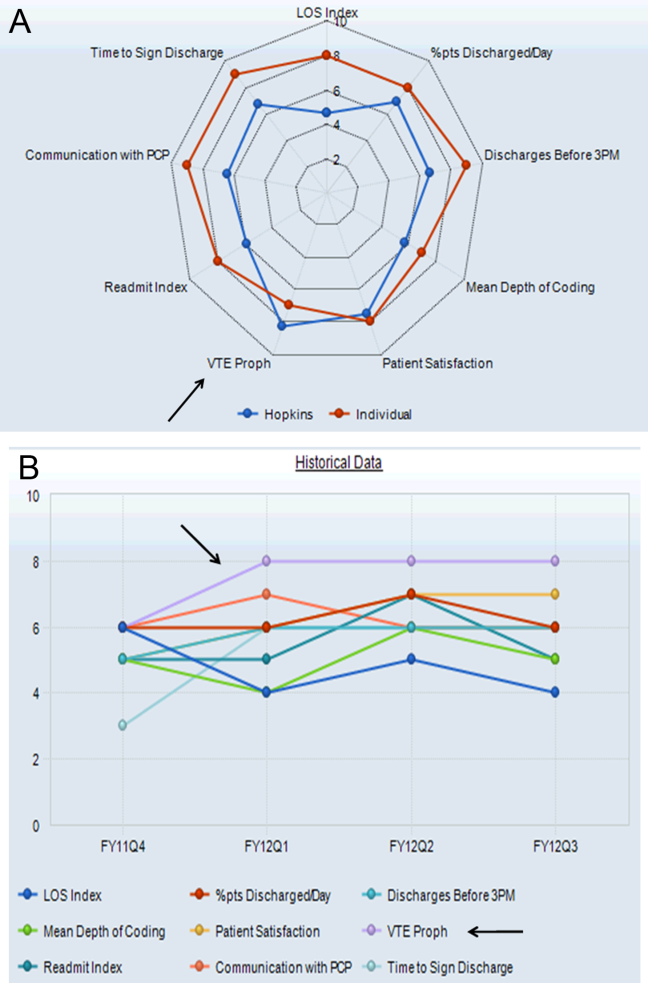
In 2010, hospitalist program leaders met with hospital administrators to create a hospitalist dashboard that would provide regularly updated summaries of performance measures for individual hospitalists. The final set of metrics identified included appropriate VTE prophylaxis, length of stay, patients discharged per day, discharges before 3 pm, depth of coding, patient satisfaction, readmissions, communication with the primary care provider, and time to signature for discharge summaries (Figure 1A). The dashboard was introduced at a general hospitalist meeting during which its purpose, methodology, and accessibility were described; it was subsequently implemented in January 2011.

Benchmarks were established for each metric, standardized to establish a scale ranging from 1 through 9, and incorporated into the dashboard (Figure 1A). Higher scores (creating a larger geometric shape) were desirable. For the VTE prophylaxis measure, scores of 1 through 9 corresponded to <60%, 60% to 64.9%, 65% to 69.9%, 70% to 74.9%, 75% to 79.9%, 80% to 84.9%, 85% to 89.9%, 90% to 94.9%, and 95% American College of Chest Physicians (ACCP)‐compliant VTE prophylaxis, respectively.[12, 20] Each provider was able to access the aggregated dashboard (showing the group mean) and his/her individualized dashboard using an individualized login and password for the institutional portal. This portal is used during the provider's workflow, including medical record review and order entry. Both a polygonal summary graphic (Figure 1A) and trend (Figure 1B) view of the dashboard were available to the provider. A comparison of the individual provider to the hospitalist group average was displayed (Figure 1A). At monthly program meetings, the dashboard, group results, and trends were discussed.
Venous Thromboembolism Prophylaxis Compliance
Our study was performed in a tertiary academic medical center with an approximately 20‐member hospitalist group (the precise membership varied over time), whose responsibilities include, among other clinical duties, staffing a 17‐bed general medicine unit with telemetry. The scope of diagnoses and acuity of patients admitted to the hospitalist service is similar to the housestaff services. Some hospitalist faculty serve both as hospitalist and nonhospitalist general medicine service team attendings, but the comparison groups were staffed by hospitalists for <20% of the time. For admissions, all hospitalists use a standardized general medicine admission order set that is integrated into the CPOE system (Sunrise Clinical Manager; Allscripts, Chicago, IL) and completed for all admitted patients. A mandatory VTE risk screen, which includes an assessment of VTE risk factors and pharmacological prophylaxis contraindications, must be completed by the ordering physician as part of this order set (Figure 2A). The system then prompts the provider with a risk‐appropriate VTE prophylaxis recommendation that the provider may subsequently order, including mechanical prophylaxis (Figure 2B). Based on ACCP VTE prevention guidelines, risk‐appropriate prophylaxis was determined using an electronic algorithm that categorized patients into risk categories based on the presence of major VTE risk factors (Figure 2A).[12, 15, 20] If none of these were present, the provider selected No major risk factors known. Both an assessment of current use of anticoagulation and a clinically high risk of bleeding were also included (Figure 2A). If none of these were present, the provider selected No contraindications known. This algorithm is published in detail elsewhere and has been shown to not increase major bleeding episodes.[12, 15] The VTE risk assessment, but not the VTE order itself, was a mandatory field. This allowed the physician discretion to choose among various pharmacological agents and mechanical mechanisms based on patient and physician preferences.
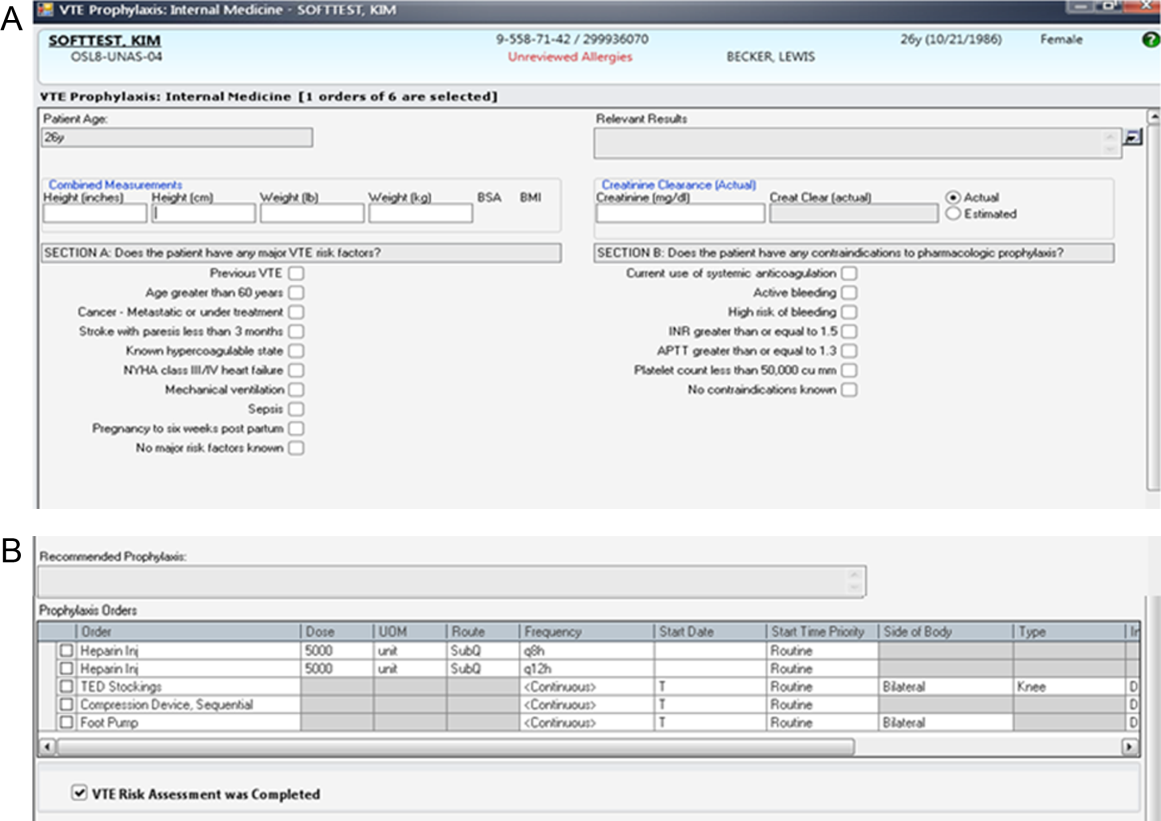
Compliance of risk‐appropriate VTE prophylaxis was determined 24 hours after the admission order set was completed using an automated electronic query of the CPOE system. Low molecular‐weight heparin prescription was included in the compliance algorithm as acceptable prophylaxis. Prescription of pharmacological VTE prophylaxis when a contraindication was present was considered noncompliant. The metric was assigned to the attending physician who billed for the first inpatient encounter.
Pay‐for‐Performance Program
In July 2011, a pay‐for‐performance program was added to the dashboard. All full‐time and part‐time hospitalists were eligible. The financial incentive was determined according to hospital priority and funds available. The VTE prophylaxis metric was prorated by clinical effort, with a maximum of $0.50 per work relative value unit (RVU). To optimize performance, a threshold of 80% compliance had to be surpassed before any payment was made. Progressively increasing percentages of the incentive were earned as compliance increased from 80% to 100%, corresponding to dashboard scores of 6, 7, 8, and 9: <80% (scores 1 to 5)=no payment; 80% to 84.9% (score 6)=$0.125 per RVU; 85% to 89.9% (score 7)=$0.25 per RVU; 90% to 94.9% (score 8)=$0.375 per RVU; and 95% (score 9)=$0.50 per RVU (maximum incentive). Payments were accrued quarterly and paid at the end of the fiscal year as a cumulative, separate performance supplement.
Individualized physician feedback through the dashboard was continued during the pay‐for‐performance period. Average hospitalist group compliance continued to be displayed on the electronic dashboard and was explicitly reviewed at monthly hospitalist meetings.
The VTE prophylaxis order set and data collection and analyses were approved by the Johns Hopkins Medicine Institutional Review Board. The dashboard and pay‐for‐performance program were initiated by the institution as part of a proof of concept quality improvement project.
Analysis
We examined all inpatient admissions to the hospitalist unit from 2008 to 2012. We included patients admitted to and discharged from the hospitalist unit and excluded patients transferred into/out of the unit and encounters with a length of stay <24 hours. VTE prophylaxis orders were queried from the CPOE system 24 hours after the patient was admitted to determine compliance.
After allowing for a run‐in period (2008), we analyzed the change in percent compliance for 3 periods: (1) CPOE‐based VTE order set alone (baseline [BASE], January 2009 to December 2010); (2) group and individual physician feedback using the dashboard (dashboard only [DASH], January to June 2011); and (3) dashboard tied to the pay‐for‐performance program (dashboard with pay‐for‐performance [P4P], July 2011 to December 2012). The CPOE‐based VTE order set was used during all 3 periods. We used the other medical services as a control to ensure that there were no temporal trends toward improved prophylaxis on a service without the intervention. VTE prophylaxis compliance was examined by calculating percent compliance using the same algorithm for the 4 resident‐staffed general medicine service teams at our institution, which utilized the same CPOE system but did not receive the dashboard or pay‐for‐performance interventions. We used locally weighted scatterplot smoothing, a locally weighted regression of percent compliance over time, to graphically display changes in group compliance over time.[21, 22]
We also performed linear regression to assess the rate of change in group compliance and included spline terms that allowed slope to vary for each of the 3 time periods.[23, 24] Clustered analysis accounted for potentially correlated serial measurements of compliance for an individual provider. A separate analysis examined the effect of provider turnover and individual provider improvement during each of the 3 periods. Tests of significance were 2‐sided, with an level of 0.05. Statistical analysis was performed using Stata 12.1 (StataCorp LP, College Station, TX).
RESULTS
Venous Thromboembolism Prophylaxis Compliance
We analyzed 3144 inpatient admissions by 38 hospitalists from 2009 to 2012. The 5 most frequent coded diagnoses were heart failure, acute kidney failure, syncope, pneumonia, and chest pain. Patients had a median length of stay of 3 days [interquartile range: 26]. During the dashboard‐only period, on average, providers improved in compliance by 4% (95% confidence interval [CI]: 35; P<0.001). With the addition of the pay‐for‐performance program, providers improved by an additional 4% (95% CI: 35; P<0.001). Group compliance significantly improved from 86% (95% CI: 8588) during the BASE period of the CPOE‐based VTE order set to 90% (95% CI: 8893) during the DASH period (P=0.01) and 94% (95% CI: 9396) during the subsequent P4P program (P=0.01) (Figure 3). Both inappropriate prophylaxis and lack of prophylaxis, when indicated, resulted in a non‐compliance rating. During the 3 periods, inappropriate prophylaxis decreased from 7.9% to 6.2% to 2.6% during the BASE, DASH, and subsequent P4P periods, respectively. Similarly, lack of prophylaxis when indicated decreased from 6.1% to 3.2% to 3.1% during the BASE, DASH, and subsequent P4P periods, respectively.
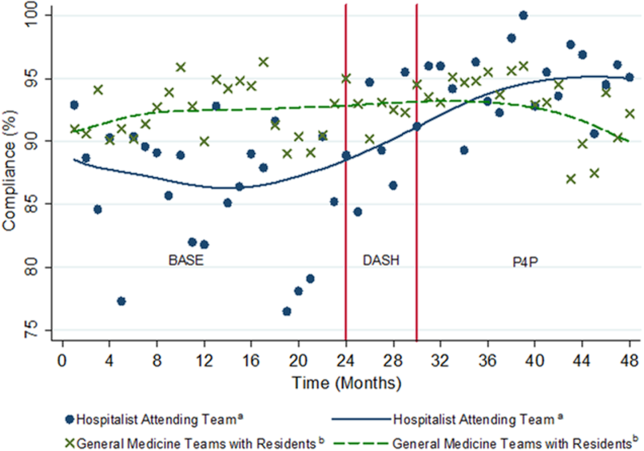
The average compliance of the 4 non‐hospitalist general medicine service teams was initially higher than that of the hospitalist service during the CPOE‐based VTE order set (90%) and DASH (92%) periods, but subsequently plateaued and was exceeded by the hospitalist service during the combined P4P (92%) period (Figure 3). However, there was no statistically significant difference between the general medicine service teams and hospitalist service during the DASH (P=0.15) and subsequent P4P (P=0.76) periods.
We also analyzed the rate of VTE prophylaxis compliance improvement (slope) with cut points at each time period transition (Figure 3). Risk‐appropriate VTE prophylaxis during the BASE period did not exhibit significant improvement as indicated by the slope (P=0.23) (Figure 3). In contrast, during the DASH period, VTE prophylaxis compliance significantly increased by 1.58% per month (95% CI: 0.41‐2.76; P=0.01). The addition of the P4P program, however, did not further significantly increase the rate of compliance (P=0.78).
A subgroup analysis restricted to the 19 providers present during all 3 periods was performed to assess for potential confounding from physician turnover. The percent compliance increased in a similar fashion: BASE period of CPOE‐based VTE order set, 85% (95% CI: 8386); DASH, 90% (95% CI: 8893); and P4P, 94% (95% CI: 9296).
Pay‐for‐Performance Program
Nineteen providers met the threshold for pay‐for‐performance (80% appropriate VTE prophylaxis), with 9 providers in the intermediate categories (80%94.9%) and 10 in the full incentive category (95%). The mean individual payout for the incentive was $633 (standard deviation 350), with a total disbursement of $12,029. The majority of payments (17 of 19) were under $1000.
DISCUSSION
A key component of healthcare reform has been value‐based purchasing, which emphasizes extrinsic motivation through the transparency of performance metrics and use of payment incentives to reward quality. Our study evaluates the impact of both extrinsic (payments) and intrinsic (professionalism and peer norms) motivation. It specifically attributed an individual performance metric, VTE prophylaxis, to an attending physician, provided both individualized and group feedback using an electronic dashboard, and incorporated a pay‐for‐performance program. Prescription of risk‐appropriate VTE prophylaxis significantly increased with the implementation of the dashboard and subsequent pay‐for performance program. The fastest rate of improvement occurred after the addition of the dashboard. Sensitivity analyses for provider turnover and comparisons to the general medicine services showed our results to be independent of a general trend of improvement, both at the provider and institutional levels.
Our prior studies demonstrated that order sets significantly improve performance, from a baseline compliance of risk‐appropriate VTE prophylaxis of 66% to 84%.[13, 15, 25] In the current study, compliance was relatively flat during the BASE period, which included these order sets. The greatest rate of continued improvement in compliance occurred during the DASH period, emphasizing both the importance of provider feedback and receptivity and adaptability in the prescribing behavior of hospitalists. Because the goal of a high‐reliability health system is for 100% of patients to receive recommended therapy, multiple approaches are necessary for success.
Nationally, benchmarks for performance measures continue to be raised, with the highest performers achieving above 95%.[26] Additional interventions, such as dashboards and pay‐for‐performance programs, supplement CPOE systems to achieve high reliability. In our study, the compliance rate during the baseline period, which included a CPOE‐based, clinical support‐enabled VTE order set, was 86%. Initially the compliance of the general medicine teams with residents exceeded that of the hospitalist attending teams, which may reflect a greater willingness of resident teams to comply with order sets and automated recommendations. This emphasizes the importance of continuous individual feedback and provider education at the attending physician level to enhance both guideline compliance and decrease provider care variation. Ultimately, with the addition of the dashboard and subsequent pay‐for‐performance program, compliance was increased to 90% and 94%, respectively. Although the major mechanism used by policymakers to improve quality of care is extrinsic motivation, this study demonstrates that intrinsic motivation through peer norms can enhance extrinsic efforts and may be more influential. Both of these programs, dashboards and pay‐for‐performance, may ultimately assist institutions in changing provider behavior and achieving these harder‐to‐achieve higher benchmarks.
We recognize that there are several limitations to our study. First, this is a single‐site program limited to an attending‐physician‐only service. There was strong data support and a defined CPOE algorithm for this initiative. Multi‐site studies will need to overcome the additional challenges of varying service structures and electronic medical record and provider order entry systems. Second, it is difficult to show actual changes in VTE events over time with appropriate prophylaxis. Although VTE prophylaxis is recommended for patients with VTE risk factors, there are conflicting findings about whether prophylaxis prevents VTE events in lower‐risk patients, and current studies suggest that most patients with VTE events are severely ill and develop VTE despite receiving prophylaxis.[27, 28, 29] Our study was underpowered to detect these potential differences in VTE rates, and although the algorithm has been shown to not increase bleeding rates, we did not measure bleeding rates during this study.[12, 15] Our institutional experience suggests that the majority of VTE events occur despite appropriate prophylaxis.[30] Also, VTE prophylaxis may be ordered, but intervening events, such as procedures and changes in risk status or patient refusal, may prevent patients from receiving appropriate prophylaxis.[31, 32] Similarly, hospitals with higher quality scores have higher VTE prophylaxis rates but worse risk‐adjusted VTE rates, which may result from increased surveillance for VTE, suggesting surveillance bias limits the usefulness of the VTE quality measure.[33, 34] Nevertheless, VTE prophylaxis remains a publicly reported Core Measure tied to financial incentives.[4, 5] Third, there may be an unmeasured factor specific to the hospitalist program, which could potentially account for an overall improvement in quality of care. Although the rate of increase in appropriate prophylaxis was not statistically significant during the baseline period, there did appear to be some improvement in prophylaxis toward the end of the period. However, there were no other VTE‐related provider feedback programs being simultaneously pursued during this study. VTE prophylaxis for the non‐hospitalist services showed a relatively stable, non‐increasing compliance rate for the general medical services. Although it was possible for successful residents to age into the hospitalist service, thereby improving rates of prophylaxis based on changes in group makeup, our subgroup analysis of the providers present throughout all phases of the study showed our results to be robust. Similarly, there may have been a cross‐contamination effect of hospitalist faculty who attended on both hospitalist and non‐hospitalist general medicine service teams. This, however, would attenuate any impact of the programs, and thus the effects may in fact be greater than reported. Fourth, establishment of both the dashboard and pay‐for‐performance program required significant institutional and program leadership and resources. To be successful, the dashboard must be in the provider's workflow, transparent, minimize reporter burden, use existing systems, and be actively fed back to providers, ideally those directly entering orders. Our greatest rate of improvement occurred during the feedback‐only phase of this study, emphasizing the importance of physician feedback, provider‐level accountability, and engagement. We suspect that the relatively modest pay‐for‐performance incentive served mainly as a means of engaging providers in self‐monitoring, rather than as a means to change behavior through true incentivization. Although we did not track individual physician views of the dashboard, we reinforced trends, deviations, and expectations at regularly scheduled meetings and provided feedback and patient‐level data to individual providers. Fifth, the design of the pay‐for‐performance program may have also influenced its effectiveness. These types of programs may be more effective when they provide frequent visible, small payments rather than one large payment, and when the payment is framed as a loss rather than a gain.[35] Finally, physician champions and consistent feedback through departmental meetings or visual displays may be required for program success. The initial resources to create the dashboard, continued maintenance and monitoring of performance, and payment of financial incentives all require institutional commitment. A partnership of physicians, program leaders, and institutional administrators is necessary for both initial and continued success.
To achieve performance goals and benchmarks, multiple strategies that combine extrinsic and intrinsic motivation are necessary. As shown by our study, the use of a dashboard and pay‐for‐performance can be tailored to an institution's goals, in line with national standards. The specific goal (risk‐appropriate VTE prophylaxis) and benchmarks (80%, 85%, 90%, 95%) can be individualized to a particular institution. For example, if readmission rates are above target, readmissions could be added as a dashboard metric. The specific benchmark would be determined by historical trends and administrative targets. Similarly, the overall financial incentives could be adjusted based on the financial resources available. Other process measures, such as influenza vaccination screening and administration, could also be targeted. For all of these objectives, continued provider feedback and engagement are critical for progressive success, especially to decrease variability in care at the attending physician level. Incorporating the value‐based purchasing philosophy from the Affordable Care Act, our study suggests that the combination of standardized order sets, real‐time dashboards, and physician‐level incentives may assist hospitals in achieving quality and safety benchmarks, especially at higher targets.
Acknowledgements
The authors thank Meir Gottlieb, BS, from Salar Inc. for data support; Murali Padmanaban, BS, from Johns Hopkins University for his assistance in linking the administrative billing data with real‐time physician orders; and Hsin‐Chieh Yeh, PhD, from the Bloomberg School of Public Health for her statistical advice and additional review. We also thank Mr. Ronald R. Peterson, President, Johns Hopkins Health System and Johns Hopkins Hospital, for providing funding support for the physician incentive payments.
Disclosures: Drs. Michtalik and Brotman had full access to all of the data in the study and take responsibility for the integrity of the data and accuracy of the data analysis. Study concept and design: Drs. Michtalik, Streiff, Finkelstein, Pronovost, and Brotman. Acquisition of data: Drs. Michtalik, Streiff, Brotman and Mr. Carolan, Mr. Lau, Mrs. Durkin. Analysis and interpretation of data: Drs. Michtalik, Haut, Streiff, Brotman and Mr. Carolan, Mr. Lau. Drafting of the manuscript: Drs. Michtalik and Brotman. Critical revision of the manuscript for important intellectual content: Drs. Michtalik, Haut, Streiff, Finkelstein, Pronovost, Brotman and Mr. Carolan, Mr. Lau, Mrs. Durkin. Statistical analysis and supervision: Drs. Michtalik and Brotman. Obtaining funding: Drs. Streiff and Brotman. Technical support: Dr. Streiff and Mr. Carolan, Mr. Lau, Mrs. Durkin
This study was supported by a National Institutes of Health grant T32 HP10025‐17‐00 (Dr. Michtalik), the National Institutes of Health/Johns Hopkins Institute for Clinical and Translational Research KL2 Award 5KL2RR025006 (Dr. Michtalik), the Agency for Healthcare Research and Quality Mentored Clinical Scientist Development K08 Awards 1K08HS017952‐01 (Dr. Haut) and 1K08HS022331‐01A1 (Dr. Michtalik), and the Johns Hopkins Hospitalist Scholars Fund. The funders had no role in the design and conduct of the study; collection, management, analysis, and interpretation of the data; preparation, review, or approval of the manuscript; and decision to submit the manuscript for publication.
Dr. Haut receives royalties from Lippincott, Williams & Wilkins. Dr. Streiff has received research funding from Portola and Bristol Myers Squibb, honoraria for CME lectures from Sanofi‐Aventis and Ortho‐McNeil, consulted for Eisai, Daiichi‐Sankyo, Boerhinger‐Ingelheim, Janssen Healthcare, and Pfizer. Mr. Lau, Drs. Haut, Streiff, and Pronovost are supported by a contract from the Patient‐Centered Outcomes Research Institute (PCORI) titled Preventing Venous Thromboembolism: Empowering Patients and Enabling Patient‐Centered Care via Health Information Technology (CE‐12‐11‐4489). Dr. Brotman has received research support from Siemens Healthcare Diagnostics, Bristol‐Myers Squibb, the Agency for Healthcare Research and Quality, Centers for Medicare & Medicaid Services, the Amerigroup Corporation, and the Guerrieri Family Foundation. He has received honoraria from the Gerson Lehrman Group, the Dunn Group, and from Quantia Communications, and received royalties from McGraw‐Hill.
- Medicare Program, Centers for Medicare 76(88):26490–26547.
- . Quality meets finance: payments at risk with value‐based purchasing, readmission, and hospital‐acquired conditions force hospitalists to focus. Hospitalist. 2013;17(1):31.
- National Quality Forum. March 2009. Safe practices for better healthcare—2009 update. Available at: http://www.qualityforum.org/Publications/2009/03/Safe_Practices_for_Better_Healthcare%E2%80%932009_Update.aspx. Accessed November 1, 2014.
- Joint Commission on Accreditation of Healthcare Organizations. Approved: more options for hospital core measures. Jt Comm Perspect. 2009;29(4):1–6.
- Centers for Medicare 208(2):227–240.
- , . Thromboprophylaxis in nonsurgical patients. Hematology Am Soc Hematol Educ Program. 2012;2012:631–637.
- , , , et al. Venous thromboembolism risk and prophylaxis in the acute hospital care setting (ENDORSE study): a multinational cross‐sectional study. Lancet. 2008;371(9610):387–394.
- , . Practices to prevent venous thromboembolism: a brief review. BMJ Qual Saf. 2014;23(3):187–195.
- , , , et al. Improving hospital venous thromboembolism prophylaxis with electronic decision support. J Hosp Med. 2013;8(3):115–120.
- , , . Innovative approaches to increase deep vein thrombosis prophylaxis rate resulting in a decrease in hospital‐acquired deep vein thrombosis at a tertiary‐care teaching hospital. J Hosp Med. 2008;3(2):148–155.
- , , , et al. Lessons from the Johns Hopkins Multi‐Disciplinary Venous Thromboembolism (VTE) Prevention Collaborative. BMJ. 2012;344:e3935.
- , , , et al. Improved prophylaxis and decreased rates of preventable harm with the use of a mandatory computerized clinical decision support tool for prophylaxis for venous thromboembolism in trauma. Arch Surg. 2012;147(10):901–907.
- , . Designing and implementing effective venous thromboembolism prevention protocols: lessons from collaborative efforts. J Thromb Thrombolysis. 2010;29(2):159–166.
- , , , et al. Impact of a venous thromboembolism prophylaxis "smart order set": improved compliance, fewer events. Am J Hematol. 2013;88(7):545–549.
- , . Improving adherence to venous thromoembolism prophylaxis using multiple interventions. BMJ. 2012;344:e3935.
- Health Resources and Services Administration of the U.S. Department of Health and Human Services. Managing data for performance improvement. Available at: http://www.hrsa.gov/quality/toolbox/methodology/performanceimprovement/part2.html. Accessed December 18, 2014.
- , . Improving patient safety by taking systems seriously. JAMA. 2008;299(4):445–447.
- , , , . Growth in the care of older patients by hospitalists in the United States. N Engl J Med. 2009;360(11):1102–1112.
- , , , et al. Prevention of venous thromboembolism: American College of Chest Physicians evidence‐based clinical practice guidelines (8th edition). Chest. 2008;133(6 suppl):381S–453S.
- . Robust locally weighted regression and smoothing scatterplots. J Am Stat Assoc. 1979;74(368):829–836.
- , . Locally weighted regression: An approach to regression analysis by local fitting. J Am Stat Assoc. 1988;83(403):596–610.
- , , , . Regression Methods in Biostatistics: Linear, Logistic, Survival, and Repeated Measures Models. 2nd ed. New York, NY: Springer; 2012.
- . Regression Modeling Strategies: With Applications to Linear Models, Logistic Regression, and Survival Analysis. New York, NY: Springer‐Verlag; 2001.
- , , , et al. Eliminating healthcare disparities via mandatory clinical decision support: the venous thromboembolism (VTE) example [published online ahead of print November 4, 2014]. Med Care. doi: 10.1097/MLR.0000000000000251.
- Joint Commission. Improving America's hospitals: the Joint Commission's annual report on quality and safety. 2012. Available at: http://www.jointcommission.org/assets/1/18/TJC_Annual_Report_2012.pdf. Accessed September 8, 2013.
- , , , et al. Hospital performance for pharmacologic venous thromboembolism prophylaxis and rate of venous thromboembolism: a cohort study. JAMA Intern Med. 2014;174(10):1577–1584.
- , , , et al. Incidence of hospital‐acquired venous thromboembolic codes in medical patients hospitalized in academic medical centers. J Hosp Med. 2014;9(4):221–225.
- , , , , . No association between hospital‐reported perioperative venous thromboembolism prophylaxis and outcome rates in publicly reported data. JAMA Surg. 2014;149(4):400–401.
- , , , , . Linking processes and outcomes: a key strategy to prevent and report harm from venous thromboembolism in surgical patients. JAMA Surg. 2013;148(3):299–300.
- , , , et al. Patterns of non‐administration of ordered doses of venous thromboembolism prophylaxis: implications for novel intervention strategies. PLoS One. 2013;8(6):e66311.
- , , , et al. Nonadministration of thromboprophylaxis in hospitalized patients with HIV: a missed opportunity for prevention? J Hosp Med. 2014;9(4):215–220.
- , , , et al. Evaluation of surveillance bias and the validity of the venous thromboembolism quality measure. JAMA. 2013;310(14):1482–1489.
- , . Surveillance bias in outcomes reporting. JAMA. 2011;305(23):2462–2463.
- . Pay for performance in health care: an international overview of initiatives. Med Care Res Rev. 2012;69(3):251–276.
The Affordable Care Act explicitly outlines improving the value of healthcare by increasing quality and decreasing costs. It emphasizes value‐based purchasing, the transparency of performance metrics, and the use of payment incentives to reward quality.[1, 2] Venous thromboembolism (VTE) prophylaxis is one of these publicly reported performance measures. The National Quality Forum recommends that each patient be evaluated on hospital admission and during their hospitalization for VTE risk level and for appropriate thromboprophylaxis to be used, if required.[3] Similarly, the Joint Commission includes appropriate VTE prophylaxis in its Core Measures.[4] Patient experience and performance metrics, including VTE prophylaxis, constitute the hospital value‐based purchasing (VBP) component of healthcare reform.[5] For a hypothetical 327‐bed hospital, an estimated $1.7 million of a hospital's inpatient payments from Medicare will be at risk from VBP alone.[2]
VTE prophylaxis is a common target of quality improvement projects. Effective, safe, and cost‐effective measures to prevent VTE exist, including pharmacologic and mechanical prophylaxis.[6, 7] Despite these measures, compliance rates are often below 50%.[8] Different interventions have been pursued to ensure appropriate VTE prophylaxis, including computerized provider order entry (CPOE), electronic alerts, mandatory VTE risk assessment and prophylaxis, and provider education campaigns.[9] Recent studies show that CPOE systems with mandatory fields can increase VTE prophylaxis rates to above 80%, yet the goal of a high reliability health system is for 100% of patients to receive recommended therapy.[10, 11, 12, 13, 14, 15] Interventions to improve prophylaxis rates that have included multiple strategies, such as computerized order sets, feedback, and education, have been the most effective, increasing compliance to above 90%.[9, 11, 16] These systems can be enhanced with additional interventions such as providing individualized provider education and feedback, understanding of work flow, and ensuring patients receive the prescribed therapies.[12] For example, a physician dashboard could be employed to provide a snapshot and historical trend of key performance indicators using graphical displays and indicators.[17]
Dashboards and pay‐for‐performance programs have been increasingly used to increase the visibility of these metrics, provide feedback, visually display benchmarks and goals, and proactively monitor for achievements and setbacks.[18] Although these strategies are often addressed at departmental (or greater) levels, applying them at the level of the individual provider may assist hospitals in reducing preventable harm and achieving safety and quality goals, especially at higher benchmarks. With their expanding role, hospitalists provide a key opportunity to lead improvement efforts and to study the impact of dashboards and pay‐for performance at the provider level to achieve VTE prophylaxis performance targets. Hospitalists are often the front‐line provider for inpatients and deliver up to 70% of inpatient general medical services.[19] The objective of our study was to evaluate the impact of providing individual provider feedback and employing a pay‐for‐performance program on baseline performance of VTE prophylaxis among hospitalists. We hypothesized that performance feedback through the use of a dashboard would increase appropriate VTE prophylaxis, and this effect would be further augmented by incorporation of a pay‐for‐performance program.
METHODS
Hospitalist Dashboard
In 2010, hospitalist program leaders met with hospital administrators to create a hospitalist dashboard that would provide regularly updated summaries of performance measures for individual hospitalists. The final set of metrics identified included appropriate VTE prophylaxis, length of stay, patients discharged per day, discharges before 3 pm, depth of coding, patient satisfaction, readmissions, communication with the primary care provider, and time to signature for discharge summaries (Figure 1A). The dashboard was introduced at a general hospitalist meeting during which its purpose, methodology, and accessibility were described; it was subsequently implemented in January 2011.
Benchmarks were established for each metric, standardized to establish a scale ranging from 1 through 9, and incorporated into the dashboard (Figure 1A). Higher scores (creating a larger geometric shape) were desirable. For the VTE prophylaxis measure, scores of 1 through 9 corresponded to <60%, 60% to 64.9%, 65% to 69.9%, 70% to 74.9%, 75% to 79.9%, 80% to 84.9%, 85% to 89.9%, 90% to 94.9%, and 95% American College of Chest Physicians (ACCP)‐compliant VTE prophylaxis, respectively.[12, 20] Each provider was able to access the aggregated dashboard (showing the group mean) and his/her individualized dashboard using an individualized login and password for the institutional portal. This portal is used during the provider's workflow, including medical record review and order entry. Both a polygonal summary graphic (Figure 1A) and trend (Figure 1B) view of the dashboard were available to the provider. A comparison of the individual provider to the hospitalist group average was displayed (Figure 1A). At monthly program meetings, the dashboard, group results, and trends were discussed.
Venous Thromboembolism Prophylaxis Compliance
Our study was performed in a tertiary academic medical center with an approximately 20‐member hospitalist group (the precise membership varied over time), whose responsibilities include, among other clinical duties, staffing a 17‐bed general medicine unit with telemetry. The scope of diagnoses and acuity of patients admitted to the hospitalist service is similar to the housestaff services. Some hospitalist faculty serve both as hospitalist and nonhospitalist general medicine service team attendings, but the comparison groups were staffed by hospitalists for <20% of the time. For admissions, all hospitalists use a standardized general medicine admission order set that is integrated into the CPOE system (Sunrise Clinical Manager; Allscripts, Chicago, IL) and completed for all admitted patients. A mandatory VTE risk screen, which includes an assessment of VTE risk factors and pharmacological prophylaxis contraindications, must be completed by the ordering physician as part of this order set (Figure 2A). The system then prompts the provider with a risk‐appropriate VTE prophylaxis recommendation that the provider may subsequently order, including mechanical prophylaxis (Figure 2B). Based on ACCP VTE prevention guidelines, risk‐appropriate prophylaxis was determined using an electronic algorithm that categorized patients into risk categories based on the presence of major VTE risk factors (Figure 2A).[12, 15, 20] If none of these were present, the provider selected No major risk factors known. Both an assessment of current use of anticoagulation and a clinically high risk of bleeding were also included (Figure 2A). If none of these were present, the provider selected No contraindications known. This algorithm is published in detail elsewhere and has been shown to not increase major bleeding episodes.[12, 15] The VTE risk assessment, but not the VTE order itself, was a mandatory field. This allowed the physician discretion to choose among various pharmacological agents and mechanical mechanisms based on patient and physician preferences.
Compliance of risk‐appropriate VTE prophylaxis was determined 24 hours after the admission order set was completed using an automated electronic query of the CPOE system. Low molecular‐weight heparin prescription was included in the compliance algorithm as acceptable prophylaxis. Prescription of pharmacological VTE prophylaxis when a contraindication was present was considered noncompliant. The metric was assigned to the attending physician who billed for the first inpatient encounter.
Pay‐for‐Performance Program
In July 2011, a pay‐for‐performance program was added to the dashboard. All full‐time and part‐time hospitalists were eligible. The financial incentive was determined according to hospital priority and funds available. The VTE prophylaxis metric was prorated by clinical effort, with a maximum of $0.50 per work relative value unit (RVU). To optimize performance, a threshold of 80% compliance had to be surpassed before any payment was made. Progressively increasing percentages of the incentive were earned as compliance increased from 80% to 100%, corresponding to dashboard scores of 6, 7, 8, and 9: <80% (scores 1 to 5)=no payment; 80% to 84.9% (score 6)=$0.125 per RVU; 85% to 89.9% (score 7)=$0.25 per RVU; 90% to 94.9% (score 8)=$0.375 per RVU; and 95% (score 9)=$0.50 per RVU (maximum incentive). Payments were accrued quarterly and paid at the end of the fiscal year as a cumulative, separate performance supplement.
Individualized physician feedback through the dashboard was continued during the pay‐for‐performance period. Average hospitalist group compliance continued to be displayed on the electronic dashboard and was explicitly reviewed at monthly hospitalist meetings.
The VTE prophylaxis order set and data collection and analyses were approved by the Johns Hopkins Medicine Institutional Review Board. The dashboard and pay‐for‐performance program were initiated by the institution as part of a proof of concept quality improvement project.
Analysis
We examined all inpatient admissions to the hospitalist unit from 2008 to 2012. We included patients admitted to and discharged from the hospitalist unit and excluded patients transferred into/out of the unit and encounters with a length of stay <24 hours. VTE prophylaxis orders were queried from the CPOE system 24 hours after the patient was admitted to determine compliance.
After allowing for a run‐in period (2008), we analyzed the change in percent compliance for 3 periods: (1) CPOE‐based VTE order set alone (baseline [BASE], January 2009 to December 2010); (2) group and individual physician feedback using the dashboard (dashboard only [DASH], January to June 2011); and (3) dashboard tied to the pay‐for‐performance program (dashboard with pay‐for‐performance [P4P], July 2011 to December 2012). The CPOE‐based VTE order set was used during all 3 periods. We used the other medical services as a control to ensure that there were no temporal trends toward improved prophylaxis on a service without the intervention. VTE prophylaxis compliance was examined by calculating percent compliance using the same algorithm for the 4 resident‐staffed general medicine service teams at our institution, which utilized the same CPOE system but did not receive the dashboard or pay‐for‐performance interventions. We used locally weighted scatterplot smoothing, a locally weighted regression of percent compliance over time, to graphically display changes in group compliance over time.[21, 22]
We also performed linear regression to assess the rate of change in group compliance and included spline terms that allowed slope to vary for each of the 3 time periods.[23, 24] Clustered analysis accounted for potentially correlated serial measurements of compliance for an individual provider. A separate analysis examined the effect of provider turnover and individual provider improvement during each of the 3 periods. Tests of significance were 2‐sided, with an level of 0.05. Statistical analysis was performed using Stata 12.1 (StataCorp LP, College Station, TX).
RESULTS
Venous Thromboembolism Prophylaxis Compliance
We analyzed 3144 inpatient admissions by 38 hospitalists from 2009 to 2012. The 5 most frequent coded diagnoses were heart failure, acute kidney failure, syncope, pneumonia, and chest pain. Patients had a median length of stay of 3 days [interquartile range: 26]. During the dashboard‐only period, on average, providers improved in compliance by 4% (95% confidence interval [CI]: 35; P<0.001). With the addition of the pay‐for‐performance program, providers improved by an additional 4% (95% CI: 35; P<0.001). Group compliance significantly improved from 86% (95% CI: 8588) during the BASE period of the CPOE‐based VTE order set to 90% (95% CI: 8893) during the DASH period (P=0.01) and 94% (95% CI: 9396) during the subsequent P4P program (P=0.01) (Figure 3). Both inappropriate prophylaxis and lack of prophylaxis, when indicated, resulted in a non‐compliance rating. During the 3 periods, inappropriate prophylaxis decreased from 7.9% to 6.2% to 2.6% during the BASE, DASH, and subsequent P4P periods, respectively. Similarly, lack of prophylaxis when indicated decreased from 6.1% to 3.2% to 3.1% during the BASE, DASH, and subsequent P4P periods, respectively.
The average compliance of the 4 non‐hospitalist general medicine service teams was initially higher than that of the hospitalist service during the CPOE‐based VTE order set (90%) and DASH (92%) periods, but subsequently plateaued and was exceeded by the hospitalist service during the combined P4P (92%) period (Figure 3). However, there was no statistically significant difference between the general medicine service teams and hospitalist service during the DASH (P=0.15) and subsequent P4P (P=0.76) periods.
We also analyzed the rate of VTE prophylaxis compliance improvement (slope) with cut points at each time period transition (Figure 3). Risk‐appropriate VTE prophylaxis during the BASE period did not exhibit significant improvement as indicated by the slope (P=0.23) (Figure 3). In contrast, during the DASH period, VTE prophylaxis compliance significantly increased by 1.58% per month (95% CI: 0.41‐2.76; P=0.01). The addition of the P4P program, however, did not further significantly increase the rate of compliance (P=0.78).
A subgroup analysis restricted to the 19 providers present during all 3 periods was performed to assess for potential confounding from physician turnover. The percent compliance increased in a similar fashion: BASE period of CPOE‐based VTE order set, 85% (95% CI: 8386); DASH, 90% (95% CI: 8893); and P4P, 94% (95% CI: 9296).
Pay‐for‐Performance Program
Nineteen providers met the threshold for pay‐for‐performance (80% appropriate VTE prophylaxis), with 9 providers in the intermediate categories (80%94.9%) and 10 in the full incentive category (95%). The mean individual payout for the incentive was $633 (standard deviation 350), with a total disbursement of $12,029. The majority of payments (17 of 19) were under $1000.
DISCUSSION
A key component of healthcare reform has been value‐based purchasing, which emphasizes extrinsic motivation through the transparency of performance metrics and use of payment incentives to reward quality. Our study evaluates the impact of both extrinsic (payments) and intrinsic (professionalism and peer norms) motivation. It specifically attributed an individual performance metric, VTE prophylaxis, to an attending physician, provided both individualized and group feedback using an electronic dashboard, and incorporated a pay‐for‐performance program. Prescription of risk‐appropriate VTE prophylaxis significantly increased with the implementation of the dashboard and subsequent pay‐for performance program. The fastest rate of improvement occurred after the addition of the dashboard. Sensitivity analyses for provider turnover and comparisons to the general medicine services showed our results to be independent of a general trend of improvement, both at the provider and institutional levels.
Our prior studies demonstrated that order sets significantly improve performance, from a baseline compliance of risk‐appropriate VTE prophylaxis of 66% to 84%.[13, 15, 25] In the current study, compliance was relatively flat during the BASE period, which included these order sets. The greatest rate of continued improvement in compliance occurred during the DASH period, emphasizing both the importance of provider feedback and receptivity and adaptability in the prescribing behavior of hospitalists. Because the goal of a high‐reliability health system is for 100% of patients to receive recommended therapy, multiple approaches are necessary for success.
Nationally, benchmarks for performance measures continue to be raised, with the highest performers achieving above 95%.[26] Additional interventions, such as dashboards and pay‐for‐performance programs, supplement CPOE systems to achieve high reliability. In our study, the compliance rate during the baseline period, which included a CPOE‐based, clinical support‐enabled VTE order set, was 86%. Initially the compliance of the general medicine teams with residents exceeded that of the hospitalist attending teams, which may reflect a greater willingness of resident teams to comply with order sets and automated recommendations. This emphasizes the importance of continuous individual feedback and provider education at the attending physician level to enhance both guideline compliance and decrease provider care variation. Ultimately, with the addition of the dashboard and subsequent pay‐for‐performance program, compliance was increased to 90% and 94%, respectively. Although the major mechanism used by policymakers to improve quality of care is extrinsic motivation, this study demonstrates that intrinsic motivation through peer norms can enhance extrinsic efforts and may be more influential. Both of these programs, dashboards and pay‐for‐performance, may ultimately assist institutions in changing provider behavior and achieving these harder‐to‐achieve higher benchmarks.
We recognize that there are several limitations to our study. First, this is a single‐site program limited to an attending‐physician‐only service. There was strong data support and a defined CPOE algorithm for this initiative. Multi‐site studies will need to overcome the additional challenges of varying service structures and electronic medical record and provider order entry systems. Second, it is difficult to show actual changes in VTE events over time with appropriate prophylaxis. Although VTE prophylaxis is recommended for patients with VTE risk factors, there are conflicting findings about whether prophylaxis prevents VTE events in lower‐risk patients, and current studies suggest that most patients with VTE events are severely ill and develop VTE despite receiving prophylaxis.[27, 28, 29] Our study was underpowered to detect these potential differences in VTE rates, and although the algorithm has been shown to not increase bleeding rates, we did not measure bleeding rates during this study.[12, 15] Our institutional experience suggests that the majority of VTE events occur despite appropriate prophylaxis.[30] Also, VTE prophylaxis may be ordered, but intervening events, such as procedures and changes in risk status or patient refusal, may prevent patients from receiving appropriate prophylaxis.[31, 32] Similarly, hospitals with higher quality scores have higher VTE prophylaxis rates but worse risk‐adjusted VTE rates, which may result from increased surveillance for VTE, suggesting surveillance bias limits the usefulness of the VTE quality measure.[33, 34] Nevertheless, VTE prophylaxis remains a publicly reported Core Measure tied to financial incentives.[4, 5] Third, there may be an unmeasured factor specific to the hospitalist program, which could potentially account for an overall improvement in quality of care. Although the rate of increase in appropriate prophylaxis was not statistically significant during the baseline period, there did appear to be some improvement in prophylaxis toward the end of the period. However, there were no other VTE‐related provider feedback programs being simultaneously pursued during this study. VTE prophylaxis for the non‐hospitalist services showed a relatively stable, non‐increasing compliance rate for the general medical services. Although it was possible for successful residents to age into the hospitalist service, thereby improving rates of prophylaxis based on changes in group makeup, our subgroup analysis of the providers present throughout all phases of the study showed our results to be robust. Similarly, there may have been a cross‐contamination effect of hospitalist faculty who attended on both hospitalist and non‐hospitalist general medicine service teams. This, however, would attenuate any impact of the programs, and thus the effects may in fact be greater than reported. Fourth, establishment of both the dashboard and pay‐for‐performance program required significant institutional and program leadership and resources. To be successful, the dashboard must be in the provider's workflow, transparent, minimize reporter burden, use existing systems, and be actively fed back to providers, ideally those directly entering orders. Our greatest rate of improvement occurred during the feedback‐only phase of this study, emphasizing the importance of physician feedback, provider‐level accountability, and engagement. We suspect that the relatively modest pay‐for‐performance incentive served mainly as a means of engaging providers in self‐monitoring, rather than as a means to change behavior through true incentivization. Although we did not track individual physician views of the dashboard, we reinforced trends, deviations, and expectations at regularly scheduled meetings and provided feedback and patient‐level data to individual providers. Fifth, the design of the pay‐for‐performance program may have also influenced its effectiveness. These types of programs may be more effective when they provide frequent visible, small payments rather than one large payment, and when the payment is framed as a loss rather than a gain.[35] Finally, physician champions and consistent feedback through departmental meetings or visual displays may be required for program success. The initial resources to create the dashboard, continued maintenance and monitoring of performance, and payment of financial incentives all require institutional commitment. A partnership of physicians, program leaders, and institutional administrators is necessary for both initial and continued success.
To achieve performance goals and benchmarks, multiple strategies that combine extrinsic and intrinsic motivation are necessary. As shown by our study, the use of a dashboard and pay‐for‐performance can be tailored to an institution's goals, in line with national standards. The specific goal (risk‐appropriate VTE prophylaxis) and benchmarks (80%, 85%, 90%, 95%) can be individualized to a particular institution. For example, if readmission rates are above target, readmissions could be added as a dashboard metric. The specific benchmark would be determined by historical trends and administrative targets. Similarly, the overall financial incentives could be adjusted based on the financial resources available. Other process measures, such as influenza vaccination screening and administration, could also be targeted. For all of these objectives, continued provider feedback and engagement are critical for progressive success, especially to decrease variability in care at the attending physician level. Incorporating the value‐based purchasing philosophy from the Affordable Care Act, our study suggests that the combination of standardized order sets, real‐time dashboards, and physician‐level incentives may assist hospitals in achieving quality and safety benchmarks, especially at higher targets.
Acknowledgements
The authors thank Meir Gottlieb, BS, from Salar Inc. for data support; Murali Padmanaban, BS, from Johns Hopkins University for his assistance in linking the administrative billing data with real‐time physician orders; and Hsin‐Chieh Yeh, PhD, from the Bloomberg School of Public Health for her statistical advice and additional review. We also thank Mr. Ronald R. Peterson, President, Johns Hopkins Health System and Johns Hopkins Hospital, for providing funding support for the physician incentive payments.
Disclosures: Drs. Michtalik and Brotman had full access to all of the data in the study and take responsibility for the integrity of the data and accuracy of the data analysis. Study concept and design: Drs. Michtalik, Streiff, Finkelstein, Pronovost, and Brotman. Acquisition of data: Drs. Michtalik, Streiff, Brotman and Mr. Carolan, Mr. Lau, Mrs. Durkin. Analysis and interpretation of data: Drs. Michtalik, Haut, Streiff, Brotman and Mr. Carolan, Mr. Lau. Drafting of the manuscript: Drs. Michtalik and Brotman. Critical revision of the manuscript for important intellectual content: Drs. Michtalik, Haut, Streiff, Finkelstein, Pronovost, Brotman and Mr. Carolan, Mr. Lau, Mrs. Durkin. Statistical analysis and supervision: Drs. Michtalik and Brotman. Obtaining funding: Drs. Streiff and Brotman. Technical support: Dr. Streiff and Mr. Carolan, Mr. Lau, Mrs. Durkin
This study was supported by a National Institutes of Health grant T32 HP10025‐17‐00 (Dr. Michtalik), the National Institutes of Health/Johns Hopkins Institute for Clinical and Translational Research KL2 Award 5KL2RR025006 (Dr. Michtalik), the Agency for Healthcare Research and Quality Mentored Clinical Scientist Development K08 Awards 1K08HS017952‐01 (Dr. Haut) and 1K08HS022331‐01A1 (Dr. Michtalik), and the Johns Hopkins Hospitalist Scholars Fund. The funders had no role in the design and conduct of the study; collection, management, analysis, and interpretation of the data; preparation, review, or approval of the manuscript; and decision to submit the manuscript for publication.
Dr. Haut receives royalties from Lippincott, Williams & Wilkins. Dr. Streiff has received research funding from Portola and Bristol Myers Squibb, honoraria for CME lectures from Sanofi‐Aventis and Ortho‐McNeil, consulted for Eisai, Daiichi‐Sankyo, Boerhinger‐Ingelheim, Janssen Healthcare, and Pfizer. Mr. Lau, Drs. Haut, Streiff, and Pronovost are supported by a contract from the Patient‐Centered Outcomes Research Institute (PCORI) titled Preventing Venous Thromboembolism: Empowering Patients and Enabling Patient‐Centered Care via Health Information Technology (CE‐12‐11‐4489). Dr. Brotman has received research support from Siemens Healthcare Diagnostics, Bristol‐Myers Squibb, the Agency for Healthcare Research and Quality, Centers for Medicare & Medicaid Services, the Amerigroup Corporation, and the Guerrieri Family Foundation. He has received honoraria from the Gerson Lehrman Group, the Dunn Group, and from Quantia Communications, and received royalties from McGraw‐Hill.
- Medicare Program, Centers for Medicare 76(88):26490–26547.
- . Quality meets finance: payments at risk with value‐based purchasing, readmission, and hospital‐acquired conditions force hospitalists to focus. Hospitalist. 2013;17(1):31.
- National Quality Forum. March 2009. Safe practices for better healthcare—2009 update. Available at: http://www.qualityforum.org/Publications/2009/03/Safe_Practices_for_Better_Healthcare%E2%80%932009_Update.aspx. Accessed November 1, 2014.
- Joint Commission on Accreditation of Healthcare Organizations. Approved: more options for hospital core measures. Jt Comm Perspect. 2009;29(4):1–6.
- Centers for Medicare 208(2):227–240.
- , . Thromboprophylaxis in nonsurgical patients. Hematology Am Soc Hematol Educ Program. 2012;2012:631–637.
- , , , et al. Venous thromboembolism risk and prophylaxis in the acute hospital care setting (ENDORSE study): a multinational cross‐sectional study. Lancet. 2008;371(9610):387–394.
- , . Practices to prevent venous thromboembolism: a brief review. BMJ Qual Saf. 2014;23(3):187–195.
- , , , et al. Improving hospital venous thromboembolism prophylaxis with electronic decision support. J Hosp Med. 2013;8(3):115–120.
- , , . Innovative approaches to increase deep vein thrombosis prophylaxis rate resulting in a decrease in hospital‐acquired deep vein thrombosis at a tertiary‐care teaching hospital. J Hosp Med. 2008;3(2):148–155.
- , , , et al. Lessons from the Johns Hopkins Multi‐Disciplinary Venous Thromboembolism (VTE) Prevention Collaborative. BMJ. 2012;344:e3935.
- , , , et al. Improved prophylaxis and decreased rates of preventable harm with the use of a mandatory computerized clinical decision support tool for prophylaxis for venous thromboembolism in trauma. Arch Surg. 2012;147(10):901–907.
- , . Designing and implementing effective venous thromboembolism prevention protocols: lessons from collaborative efforts. J Thromb Thrombolysis. 2010;29(2):159–166.
- , , , et al. Impact of a venous thromboembolism prophylaxis "smart order set": improved compliance, fewer events. Am J Hematol. 2013;88(7):545–549.
- , . Improving adherence to venous thromoembolism prophylaxis using multiple interventions. BMJ. 2012;344:e3935.
- Health Resources and Services Administration of the U.S. Department of Health and Human Services. Managing data for performance improvement. Available at: http://www.hrsa.gov/quality/toolbox/methodology/performanceimprovement/part2.html. Accessed December 18, 2014.
- , . Improving patient safety by taking systems seriously. JAMA. 2008;299(4):445–447.
- , , , . Growth in the care of older patients by hospitalists in the United States. N Engl J Med. 2009;360(11):1102–1112.
- , , , et al. Prevention of venous thromboembolism: American College of Chest Physicians evidence‐based clinical practice guidelines (8th edition). Chest. 2008;133(6 suppl):381S–453S.
- . Robust locally weighted regression and smoothing scatterplots. J Am Stat Assoc. 1979;74(368):829–836.
- , . Locally weighted regression: An approach to regression analysis by local fitting. J Am Stat Assoc. 1988;83(403):596–610.
- , , , . Regression Methods in Biostatistics: Linear, Logistic, Survival, and Repeated Measures Models. 2nd ed. New York, NY: Springer; 2012.
- . Regression Modeling Strategies: With Applications to Linear Models, Logistic Regression, and Survival Analysis. New York, NY: Springer‐Verlag; 2001.
- , , , et al. Eliminating healthcare disparities via mandatory clinical decision support: the venous thromboembolism (VTE) example [published online ahead of print November 4, 2014]. Med Care. doi: 10.1097/MLR.0000000000000251.
- Joint Commission. Improving America's hospitals: the Joint Commission's annual report on quality and safety. 2012. Available at: http://www.jointcommission.org/assets/1/18/TJC_Annual_Report_2012.pdf. Accessed September 8, 2013.
- , , , et al. Hospital performance for pharmacologic venous thromboembolism prophylaxis and rate of venous thromboembolism: a cohort study. JAMA Intern Med. 2014;174(10):1577–1584.
- , , , et al. Incidence of hospital‐acquired venous thromboembolic codes in medical patients hospitalized in academic medical centers. J Hosp Med. 2014;9(4):221–225.
- , , , , . No association between hospital‐reported perioperative venous thromboembolism prophylaxis and outcome rates in publicly reported data. JAMA Surg. 2014;149(4):400–401.
- , , , , . Linking processes and outcomes: a key strategy to prevent and report harm from venous thromboembolism in surgical patients. JAMA Surg. 2013;148(3):299–300.
- , , , et al. Patterns of non‐administration of ordered doses of venous thromboembolism prophylaxis: implications for novel intervention strategies. PLoS One. 2013;8(6):e66311.
- , , , et al. Nonadministration of thromboprophylaxis in hospitalized patients with HIV: a missed opportunity for prevention? J Hosp Med. 2014;9(4):215–220.
- , , , et al. Evaluation of surveillance bias and the validity of the venous thromboembolism quality measure. JAMA. 2013;310(14):1482–1489.
- , . Surveillance bias in outcomes reporting. JAMA. 2011;305(23):2462–2463.
- . Pay for performance in health care: an international overview of initiatives. Med Care Res Rev. 2012;69(3):251–276.
© 2014 Society of Hospital Medicine