User login
Complications of Bariatric Surgery
Obesity is a growing epidemic in the United States and worldwide. Over one‐third of Americans (33.8%) are considered obese (body mass index [BMI] 30).1 Nonsurgical interventions have failed to achieve the long‐lasting effects of weight loss surgery and the associated reduction in obesity‐related comorbidities such as type 2 diabetes mellitus, hyperlipidemia, hypertension, obstructive sleep apnea, cancer, coronary artery disease, osteoarthritis, and gastroesophageal reflux disease (GERD).27 The American Society for Metabolic and Bariatric Surgery estimates that 220,000 people underwent bariatric surgery in 2009 with over 1.5 million procedures performed since 1992.
Centers of excellence criteria include follow‐up with the bariatric surgeon for 5 years; however, the patient may be admitted to a hospital without immediate availability of the bariatric surgeon. Since hospitalists are often first responders to the majority of newly hospitalized patients, this growing number of post‐bariatric surgery patients necessitates hospitalists have a full understanding of their unique postoperative anatomical and physiological consequences. During the first hours of an acute inpatient presentation, post‐bariatric surgical patients can be divided into the following categories: surgical complications, surgical complications masquerading as acute medical conditions, and medical complications. Additionally, hospitalists should be aware of the nuances of radiographic imaging and appropriate endoscopic procedures in these patients. This article will discuss the common current bariatric surgical procedures; post‐bariatric surgery radiographic imaging pearls; and a review of the signs, symptoms, and treatment of common medical and surgical complications.
Descriptions of Contemporary Procedures
Contemporary weight loss procedures can be divided into 2 categories based on how they produce weight loss: restrictive only or combination malabsorptive with restriction. Most are performed laparoscopically to reduce postoperative pain, speed recovery, and decrease wound complications.
Restrictive Procedures (Laparoscopic Adjustable Gastric Band and Sleeve Gastrectomy)
These procedures produce weight loss by reducing the size of the stomach or creating an obstruction in the proximal stomach, limiting the consumption of large quantities at one time. They produce early satiety, but patients may still consume a large volume of calorie‐dense liquids compromising weight loss.
Laparoscopic Adjustable Gastric Band
Laparoscopic adjustable gastric band (LAGB; Figure 1A) is the primary form of restrictive procedures with 2 Food and Drug Administration‐approved bands (Lap Band [Allergan, Inc; Irvine, CA] and REALIZE band [Ethicon Endo‐Surgery, Inc; Cincinnati, OH]). A cuff is inflated around the proximal stomach creating a gastric pouch approximately 15‐30 mL in size. A subcutaneous reservoir is attached to the cuff allowing adjustment to the degree of restriction.8 LAGB has replaced the vertical banded gastroplasty (VBG). It is less invasive, adjustable, and reversible (0.1% operative mortality rate). Weight loss is maintained with this procedure but is generally less, with a higher failure rate compared to the more common gastric bypass procedure (Table 1).3, 9 Complications may include band dysfunction (ie, slippage, erosion, infections), esophageal dilatation, balloon failure, and port malposition, with rates approaching 3%‐5% per year requiring removal or repair.10 Patients may also experience GERD symptoms, especially if the condition was present preoperatively. Progressive GERD symptoms should be investigated with an upper gastrointestinal (GI) series to ensure there is no band slippage, esophageal dilation, or dysfunction.

| LAGB | Roux‐en‐Y Gastric Bypass | Biliopancreatic Diversion With and Without Duodenal Switch | |
|---|---|---|---|
| Excess weight loss | 48% | 62% | 70% |
| Resolution of diabetes | 48% | 84% | 98% |
Sleeve Gastrectomy
With the sleeve gastrectomy (Figure 1B) procedure, a small gastric tube is created by resecting the majority of the stomach. Early postoperative complications are comparable to those after Roux‐en‐Y gastric bypass (RYGB) operations. Leaks from the long gastric staple line are the most concerning. Recent report of a leak rate of 4.9% is much higher than contemporary reports of leaks after laparoscopic RYGB operations.11 Gastric tube stenosis is unique to the operation but comparable to gastrojejunal anastomotic stricture rates after RYGB. Weight loss is less than RYGB. Long‐term results from larger cohorts are needed to determine if the high incidence of esophageal complaints (GERD 26%, vomiting 21%), and weight regain issues are consistently experienced.
Combination Procedures (Roux‐en‐Y Gastric Bypass and Biliopancreatic Diversion With and Without Duodenal Switch)
These procedures produce weight loss by decreasing caloric intake and altering digestion and absorption.
Roux‐en‐Y Gastric Bypass
Roux‐en‐Y Gastric Bypass (RYGB) (Figure 1C) is the most common bariatric procedure performed in the United States. As the gold standard, it provides long‐term successful weight loss and a defined risk profile.9 This procedure involves the creation of a small (15‐30 mL) gastric pouch by transecting the stomach and then draining the pouch via a Roux limb. The Roux (aka alimentary) limb is the segment of bowel between the small gastric pouch and the jejunojejunostomy. Variations on this procedure include different length Roux limbs (75‐150 cm) and the use of a silastic ring at the gastrojejunal anastomosis. The latter is not commonly used because of the high incidence of band erosion. Weight loss seems to be independent of these variations. Postoperatively, food bypasses the biliopancreatic limb (ie, the stomach, duodenum, and part of the jejunum) resulting in selective malabsorption in the common channel (the segment distal to the jejunojejunostomy). Hormone secretions are altered, affecting satiety signaling and glucose metabolism.10, 12
Biliopancreatic Diversion With Duodenal Switch
In biliopancreatic diversion (BPD) with duodenal switch (DS) (Figure 1D), a sleeve gastrectomy is performed. The ileum is transected about 250 cm proximal to the ileocecal valve and is then attached to the transected duodenum just distal to the pylorus, forming the path for the food. The excluded duodenum, jejunum, and proximal ileum drain the biliary and pancreatic secretions and are reconnected to the distal ileum about 50‐100 cm proximal to the ileocecal valve. Food and digestive juices mix, allowing for absorption of nutrients over this short common channel. Greater malabsorption of calories, vitamins, and trace elements occurs, providing more reliable weight loss and significantly more nutritional problems.8, 9
Radiographic and Endoscopic Considerations
When evaluating abdominal complaints with radiographic imaging, the postoperative anatomic variations can challenge routine interpretation. An experienced radiologist and involvement of a bariatric surgeon, who is familiar with the post‐gastric bypass anatomical changes, are essential for accurate interpretation.
Computed tomography (CT) scans with oral contrast are the imaging modality of choice, particularly in the acute setting, to rule out small bowel obstruction. CT scans are helpful in delineating postoperative anatomy, detecting anastomotic leaks, obstructions and other intra‐abdominal problems.1315 Routine upper GI series (UGI) after gastric bypass is controversial, with some performing it routinely and others only for cause. Regardless, when UGI is performed, likewise for CT, small volumes of water‐soluble contrast should be used, followed by small volumes of dilute barium solution. A UGI may be complementary and more sensitive in the case of a small leak when done under fluoroscopy, but CT and UGI may not show the leak in as many as 30% of patients; CT scans may provide additional information to help guide the clinical decision making. A negative study should not preclude surgical exploration if a high suspicion for leak exists.16 Internal hernias (loop of bowel passing through a mesenteric defect created by the original surgery), a common cause of bowel obstructions, are frequently missed, therefore a high level of suspicion is necessary.1719 Several studies have identified 8 radiographic CT findings in bowel obstructions caused by internal hernias including swirl sign, mushroom sign, hurricane eye, small bowel obstruction, clustered loops, small bowel behind superior mesenteric artery, right‐side anastomosis, and engorged nodes.18, 19 The clinical picture should guide medical versus surgical management in those exceeding CT scanner weight limits (commonly 350 lb).
Imaging modalities such as UGI, endoscopy, or double balloon enteroscopy (DBE) should be used for patients with more chronic abdominal complaints. UGI may miss leaks and obstructions in the remnant stomach and bypassed intestine. If pathology, such as ulcers, retained sutures, and strictures are suspected in the bypassed stomach/emntestine, DBE can be used to diagnose and therapeutically intervene, but may not be available at all centers and referral may be considered. Endoscopy allows for direct visualization of subtle or mucosal pathology in the small bowel, but is unable to visualize the excluded stomach and duodenum.20
Early Medical and Surgical Complications
Early postoperative complications (within 30 days) occur in the minority of patients after weight loss operations. Clinical findings, even in life‐threatening conditions, may be subtle. Readmissions most often occur for dehydration secondary to inadequate oral intake. Pneumonias, and wound and urinary tract infections are not unique to the bariatric surgery patient, but there is a higher than average risk of pulmonary embolism and bleeding. Bleeding most frequently occurs into the GI tract from staple lines resulting in rapid catharsis or emesis, but can also be intraperitoneal and elusive. Most GI bleeding stops spontaneously, but some require transfusion and re‐exploration in extreme cases.21 Leaks may occur at any of the staple lines or anastomoses. The most common sites of leak are the g‐j anastomosis, gastric pouch, and remnant stomach. Again, remnant stomach and j‐j anastomosis leaks may escape detection by UGI and CT. Re‐exploration of a sick patient in the early postoperative period may be required despite normal imaging studies. Early consultation with, or transfer to, a bariatric surgery center should always be considered for patients readmitted after bariatric surgery.
Late Medical Complications
Gastrointestinal complaints, excessive weight loss, and vitamin/mineral deficiencies resulting in neurological problems and metabolic bone disease are post‐bariatric medical complications that may prompt hospital admission. If not the primary reason for admission, special attention to these issues may prevent readmission, another focus of hospital care.
Gastrointestinal Complaints
One of the most common causes of hospital admission any time postoperatively is abdominal pain. A differential diagnosis of abdominal pain, nausea, and/or vomiting in the post‐bariatric surgery patient should include small bowel obstruction, hernias (internal or incisional), band complications, food intolerance, dietary noncompliance, ileus, mesenteric venous thrombosis, strictures (such as outlet obstruction or anastomotic stenosis), ulcers, esophagitis, cholelithiasis, dumping syndrome, and Roux stasis syndrome.20
A thorough history targeted at the relationship between symptoms and food intake, attention to the character and location of the pain, and a thorough physical exam (specifically the presence or absence of palpable tenderness, guarding, or rebound) is essential. The physical exam may be misleading in obese patients and, if radiographic studies cannot be performed secondary to patient size, surgical exploration may be needed soon after presentation. Therefore, even lacking an obvious surgical need, the bariatric surgeon should be notified of admission.
Improper food choice, and failure to slowly and adequately chew food, can result in emesis and digestive difficulty. Physical incompatibility with the small gastric pouch and gastric outlet obstructions can be caused by nondigestible foods (ie, breads, steak, raw vegetables). This highlights the importance of ordering the appropriate hospital diet.8 Specific gastric bypass hospital diets for all consistencies should reflect the mechanical limitations and carbohydrate/protein requirements of these patients.
Increased gallstone formation is observed in patients with rapid weight loss (1.5 kg/wk), especially following RYGB and less often after LAGB procedures (40% vs 20% over 3 years). Routine use of ursodiol during rapid weight loss (6 months after RYGB) reduces this complication to <5%.8
Stenosis or ulceration at the anastomotic site for RYGB can cause abdominal pain and vomiting. The incidence of stomal stenosis has been reported at 5%‐19% and typically occurs within the first 3 postoperative months.22 This problem is often amenable to endoscopic dilatation, unless a ring was used to reinforce the anastomosis. Ulceration has been reported in 1%‐16% of patients and is usually secondary to tobacco or non‐steroidal anti‐inflammatory drug (NSAID) use, H. pylori, fistula‐induced acid exposure, reaction to foreign material, or ischemia from tension and poor tissue perfusion.23, 24 Endoscopy can diagnose the presence of ulcers, with biopsies to rule out H. pylori infection. Cessation of NSAIDs and tobacco are critical. Medical management including proton pump inhibitors and/or sucralfate is sufficient for up to 95% of patients. Surgical revision is reserved for persistent ulcers associated with obstruction, pain, and/or bleeding.25
Dumping syndrome is a complex of post‐prandial symptoms occurring most commonly in the RYGB patients. As many as 44% of RYGB patients may experience this syndrome characterized by flushing, dizziness, abdominal distension, pain, nausea, vomiting, and/or diarrhea.26 Symptoms may result from the ingestion of large amounts of sugars which empty from the altered gastric pouch at an unregulated rate. This large osmotic load causes fluid shifts and surges in peptide hormone levels, resulting in symptoms which may reinforce adherence to the prescribed postoperative diet. It occurs shortly after a meal and resolves over hours. Dietary modifications, such as increased protein and fiber intake with decreased consumption of simple sugars, will ameliorate symptoms in many patients, with most seeing resolution after the first year.8, 27 Some patients experience hyperglycemia secondary to ingestion of simple carbohydrates, with hypoglycemia approximately 2 hours later (late dumping). In our experience, limiting carbohydrate intake to 30 grams at any meal usually alleviates post‐prandial hypoglycemia.
If the patient reports an absence of bowel movements and flatus, an ileus from chronic narcotic use or a mechanical small bowel obstruction secondary to internal hernias or adhesions (see Late Surgical Complications) must be investigated. Severe or prolonged pain, lasting longer than a few hours, is cause for alarm and should prompt aggressive evaluation and possibly exploratory surgery.
Excessive Weight Loss
In diagnosing postoperative excessive weight loss, it is important to understand average anticipated weight loss parameters. Compared to the values expected for RYGB, LAGB produces less weight loss and BPD with and without DS produces more (Table 227). Patients experiencing more rapid or prolonged weight loss should be investigated for bacterial overgrowth syndrome, short bowel syndrome, or other anatomic abnormalities.
| Postoperative Time Period | Average Weight Loss (RYGB) | |
|---|---|---|
| Daily | By Time Period | |
| ||
| 0‐3 mo | 0.22‐0.45 kg/day | 15‐20 kg by 3 mo |
| 3‐9 mo | 0.11‐0.22 kg/day | 25‐35 kg by 6 mo |
| 9‐12 mo | 0.11 kg/day | 40‐60 kg in first year |
Known risk factors for bacterial overgrowth, which are prominent in this population, include decreased gastric acidity and slowed intestinal transit time (ie, narcotic use). Patients may be asymptomatic or experience weight loss, abdominal bloating and/or pain, nausea, vomiting, and diarrhea. The diagnosis can be made with a hydrogen breath test or by obtaining quantitative cultures of jejunal secretions during endoscopy. Questions remain on how the normalized values of these tests are affected by the postoperative environment, and on how this syndrome may present or be treated if it affects the excluded intestine. Bacterial overgrowth may be an incidental finding and not the cause of the gastrointestinal complaints. Although data is limited, treatment typically consists of a 7‐10 day course of rifaximin 1200 mg/day (divided doses) and/or a trial of dietary modifications.20, 2831 These may include avoiding lactose and eating a high fat, low carbohydrate, low fiber diet, so nutrients are readily absorbed and not left for bacterial consumption.32
Short bowel syndrome (<100‐200 cm of intestinal tissue remaining and subsequent malabsorption) can occur after any extensive colonic resection or bypass of the intestine.33 This condition rarely results after an initial bariatric procedure; however, subsequent procedures for small bowel obstructions or intestinal ischemia may result in short bowel syndrome. Typical presentations include diarrhea, weight loss, and symptoms of vitamin and mineral deficiencies. Short bowel can also predispose patients to the development of bacterial overgrowth, further complicating weight loss. Management consists of nutritional supplementation, occasionally parenteral nutrition, and rarely reoperation to increase the length of the common channel.34 Avoidance of further bowel resection is crucial in preventing short bowel syndrome.33, 34 In the setting of carbohydrate malabsorption with concomitant bacterial overgrowth syndrome, production of d‐lactic acid causing a metabolic acidosis with encephalopathy has been reported.35
Once medical complications have been ruled out, it is prudent to evaluate for a psychological component such as anorexia nervosa. It is helpful to involve a qualified psychologist who is familiar with this population. Addictions to alcohol, gambling, and pain medications have been reported in the post‐bariatric surgery population as a substitute for food addiction.
Neurological Complications and Vitamin Deficiencies
Neurological complications develop months to years postoperatively, secondary to vitamin, mineral, and nutrient deficiencies that result from malabsorption or inadequate intake. An inpatient provider should be aware of the potential role these conditions may play in a hospitalized patient.
Peripheral neuropathy can develop secondary to several deficiencies, including vitamin B12, thiamine, vitamin E, and copper. Their sources, deficiencies, and replacement regimens are presented in Table 3.3642 Thiamine deficiency, manifesting as Wernicke's encephalopathy, is particularly important in the postoperative patient with excessive vomiting. For prevention, we recommend all patients readmitted with vomiting and dehydration receive a banana bag or rally pack (thiamine 100 mg, folic acid 1 mg, multivitamin with iron and magnesium 3 g in one liter of D5 normal saline) over 4‐8 hours. Additional deficiencies after gastric bypass include folate, selenium, zinc, vitamin B6, and riboflavin. A multivitamin with minerals will meet the needs of most patients. Multiple fat‐soluble vitamin deficiencies can occur with small bowel bacterial overgrowth or BPD.
| B12 | B1 (Thiamine) | Vitamin E | Copper | |
|---|---|---|---|---|
| Dietary sources | Meat and dairy | Fortified grains, cereals, nuts, and pork | Vegetable oil, nuts, leafy vegetables39 | Shellfish, organ meats (liver, kidney), chocolate, nuts, dried legumes/fruits41 |
| Location of absorption | Terminal ileum after combining with intrinsic factor | Proximal small intestine | Upper small intestine41 | Stomach and duodenum38 |
| Mechanism of deficiency | Inadequate intake intrinsic factor deficiency37, 39 | Bypass of primary absorption site Inadequate intake Excessive emesis | Fat malabsorption39 Inadequate intake | Defective intestinal mucosal transport40 Decreased absorptive surface area40 Inadequate intake Coadministered zinc which competes with copper for absorption38 |
| Time to develop deficiency | Years | 18 days37, 39 | 6‐12 mo39 | 3‐12 mo42 |
| Postoperative supplementation recommendation | Optimal prophylactic dose unknown Minimum 1‐2 mg/day | 1‐1.5 mg/day37 | Males: 10 mg/day Females: 8 mg/day | Multivitamin (900 g/day) |
| Pathology of deficiency | Macrocytic anemia Paresthesias Ataxia Subacute combined degeneration of the spinal cord | Dry beriberi Wernicke's encephalopathy Korsakoff's syndrome | Myopathy/neuropathy Ataxia | Demyelinating neuropathy with ataxia Anemia |
| Labs to document deficiency | Serum B12 | Erythrocyte transketolase activity Thiamine diphosphate effect37 | Serum alphatocopherol37, 39 Check for deficiencies of other fat soluble vitamins (A, D, K) | Serum copper level40 |
| Correcting deficiency | Intramuscular B12 (1000 mcg) Sublingual supplementation36 | 50‐100 mg/day (parenteral or oral)37 | 400 mg PO BID37 | 2‐4 mg/day38 |
Anemia
Iron deficiency affects 6%‐33% of patients after 1 year.43 Iron is preferentially absorbed in the duodenum and proximal jejunum which are bypassed postoperatively. The absence of gastric acid prevents conversion of ferric (Fe2+) to the absorbable ferrous (Fe3+) iron, further decreasing absorption.44 Ferritin reflects iron stores but is also an acute phase reactant and, therefore, may mask an underlying deficiency in an acutely ill hospitalized patient. A multivitamin with iron is recommended for all patients, but additional supplementation may be required for menstruating women.43 Parenteral administration may be necessary if oral supplements are not tolerated or are inadequately absorbed.44
Fractures and Osteomalacia
Calcium and vitamin D deficiencies are a significant problem in the bariatric surgery population, with resultant osteoporosis or osteomalacia and associated fractures.38, 43 Calcium is preferentially absorbed in the duodenum and proximal jejunum. Vitamin D is absorbed in the ileum or produced in the skin in response to ultraviolet B (UVB) radiation.45 Deficiency of vitamin D exacerbates calcium malabsorption, thereby causing secondary hyperparathyroidism, increased bone turnover, and osteomalacia. Dramatic weight loss can lead to bone loss, increasing the risk for osteoporosis and fractures.38 Hypocalcemia or osteomalacia may cause generalized bone pain, muscular weakness, tetany, and chronic musculoskeletal pain.45
Fat‐soluble vitamin deficiencies are more common in those undergoing malabsorptive versus restrictive procedures and, in the case of BPD, may be related to the length of the common channel.43 It is important to ensure that calcium and vitamin D levels are sufficient prior to surgery, and prior to starting any osteoporotic treatment such as bisphosphonates.45 We recommend at least 1200 mg of calcium citrate and 1000‐2000 IU of Vitamin D daily. Up to 50,000 IU weekly or daily may be required to correct deficiency and maintain sufficiency in this population.46, 47 Vitamin D2 (ergocalciferol) or D3 (cholecalciferol) can be used for supplementation. Cholecalciferol is preferred if given through a feeding tube because it is less prone to clogging the tube.46 With severe malabsorption, phototherapy may be necessary, as intravenous doses are often inadequate and intramuscular preparations require special compounding.46 Calcium carbonate requires acid for proper absorption, therefore calcium citrate may be preferred due to achlorhydria from gastric exclusion.
Late Surgical Complications
Hospitalists are increasingly responsible for managing and comanaging surgical patients. The post‐bariatric surgery patient may present with unique signs and symptoms of surgical conditions masquerading as medical conditions. Common conditions that present in uncommon ways include strictures (ie, outlet obstruction and stomal stenosis), hernias with strangulation (incisional and internal), and small bowel obstructions.
Small bowel obstruction (SBO) occurs in 0%‐5% of RYGB patients (less with LAGB, similar with BPD), which is similar to other abdominal surgery rates, and may occur months to years after the original surgery. The differential diagnosis of an SBO includes internal hernias, adhesions, ventral hernia (incisional and umbilical), postoperative ileus, and jejunojejunal anastomotic stricture. Typical symptoms are often present, but may be less obvious than with a non‐gastric bypass patient. Pain can range from acute to a chronic or intermittent pattern. Pain is the most common presenting symptom of obstruction. Pain relieved by emesis may indicate an obstruction in the Roux limb. Nausea, bloating, tachycardia, and hiccups with shoulder/back pain can occur when obstruction in the biliopancreatic limb causes gastric distension.48
Vomiting is seen in fewer than half of patients with SBOs due to the altered anatomy.49 Any post‐RYGB patient that vomits bile needs emergent surgical evaluation for a common channel obstruction. Radiographic imaging may be misleading as to the cause of the obstruction. SBO is crucial to consider since delayed diagnosis can result in bowel ischemia and death.18 For the hospitalist who is caring for a post‐bariatric patient with a bowel obstruction, early surgical consultation is mandatory, preferably with a bariatric surgeon. Traditional medical management such as nasogastric (NG) tube placement will not decompress the excluded stomach, therefore patients rarely benefit from nasogastric decompression. If necessary, an NG tube should only be placed by experienced hands or fluoroscopic guidance, due to the altered anatomy.
Conclusion
Weight loss surgery, developed to address the growing obesity problem, has been beneficial to hundreds of thousands of people by decreasing their excess weight and comorbidities. For some, the postoperative course is complicated by medical and surgical problems requiring hospitalization. It is critically important that, as this relatively new field of postoperative medicine evolves, the hospitalist stay informed on relevant presentations, complications, and treatment to better address this growing population. Early consultation with, and transfer to, a bariatric surgery center should be encouraged. The importance of arranging proper hospital follow‐up, including community‐based support groups, nutritional consults, psychological support, and close follow‐up with the bariatric surgeon, bariatrician, and/or primary care physician, should not be underestimated.
- ,,,.Prevalence and trends in obesity among US adults, 1999‐2008.JAMA.2010;303(3):235–241.
- ,,, et al.Long‐term mortality after gastric bypass surgery.N Engl J Med.2007;357(8):753–761.
- ,,, et al.Bariatric surgery: a systematic review and meta‐analysis.JAMA.2004;292(14):1724–1737.
- ,,.Results of laparoscopic sleeve gastrectomy (LSG) at 1 year in morbidly obese Korean patients.Obes Surg.2005;15(10):1469–1475.
- ,,, et al.Lifestyle, diabetes, and cardiovascular risk factors 10 years after bariatric surgery.N Engl J Med.2004;351(26):2683–2693.
- ,,, et al.Long‐term weight loss and changes in blood pressure: results of the Trials of Hypertension Prevention, phase II.Ann Intern Med.2001;134(1):1–11.
- ,,,.Narrative review: effect of bariatric surgery on type 2 diabetes mellitus.Ann Intern Med.2009;150(2):94–103.
- ,,.Metabolic consequences of bariatric surgery.J Clin Gastroenterol.2006;40(8):659–668.
- ,.Surgical approaches to obesity.Mayo Clin Proc.2006;81(10 suppl):S18–S24.
- ,,, et al.American Association of Clinical Endocrinologists, The Obesity Society, and American Society for Metabolic 4(5 suppl):S109–S184.
- ,,.Long‐term results of laparoscopic sleeve gastrectomy for obesity.Ann Surg.2010;252(2):319–324.
- ,,,,.Gastric banding or bypass? A systematic review comparing the two most popular bariatric procedures.Am J Med.2008;121(10):885–893.
- ,.Gastrointestinal complications of laparoscopic Roux‐en‐Y gastric bypass surgery in patients who are morbidly obese: findings on radiography and CT.AJR Am J Roentgenol.2002;179(6):1437–1442.
- ,,,,.Gastrointestinal complications of laparoscopic Roux‐en‐Y gastric bypass surgery: clinical and imaging findings.Radiology.2002;223(3):625–632.
- ,,.Use of computed tomography in diagnosis of major postoperative gastrointestinal complications of laparoscopic Roux‐en‐Y gastric bypass surgery.Am Surg.2004;70(11):964–966.
- ,,, et al.Diagnosis and contemporary management of anastomotic leaks after gastric bypass for obesity.J Am Coll Surg.2007;204(1):47–55.
- ,,,,.Small‐bowel obstruction after laparoscopic Roux‐en‐Y gastric bypass surgery.J Comput Assist Tomogr.2009;33(3):369–375.
- ,,,,,.Sensitivity and specificity of eight CT signs in the preoperative diagnosis of internal mesenteric hernia following Roux‐en‐Y gastric bypass surgery.Clin Radiol.2009;64(4):373–380.
- ,,, et al.Internal hernia after gastric bypass: sensitivity and specificity of seven CT signs with surgical correlation and controls.AJR Am J Roentgenol.2007;188(3):745–750.
- ,,,,.Nausea, bloating and abdominal pain in the Roux‐en‐Y gastric bypass patient: more questions than answers.Obes Surg.2007;17(11):1529–1533.
- ,,, et al.Management of acute bleeding after laparoscopic Roux‐en‐Y gastric bypass.Obes Surg.2003;13(6):842–847.
- ,,,,.Endoscopic balloon dilation of gastroenteric anastomotic stricture after laparoscopic gastric bypass.Endoscopy.2003;35(9):725–728.
- ,.Ulcer disease after gastric bypass surgery.Surg Obes Relat Dis.2006;2(4):455–459.
- ,,,.Marginal ulcer after gastric bypass: a prospective 3‐year study of 173 patients.Obes Surg.1998;8(5):505–516.
- ,,,,.Stomal complications of gastric bypass: incidence and outcome of therapy.Am J Gastroenterol.1992;87(9):1165–1169.
- ,,,,.[Analysis of the dumping syndrome on morbid obese patients submitted to Roux en Y gastric bypass].Rev Col Bras Cir.2009;36(5):413–419.
- ,,, et al.Clinical management after bariatric surgery: value of a multidisciplinary approach.Mayo Clin Proc.2006;81(10 suppl):S34–S45.
- ,,,,,.Antibiotic efficacy in small intestinal bacterial overgrowth‐related chronic diarrhea: a crossover, randomized trial.Gastroenterology.1999;117(4):794–797.
- ,,,,.Absorbable vs. non‐absorbable antibiotics in the treatment of small intestine bacterial overgrowth in patients with blind‐loop syndrome.Aliment Pharmacol Ther.2005;21(8):985–992.
- ,,, et al.Small intestinal bacterial overgrowth: diagnosis and treatment.Dig Dis.2007;25(3):237–240.
- ,,, et al.Antibiotic therapy in small intestinal bacterial overgrowth: rifaximin versus metronidazole.Eur Rev Med Pharmacol Sci.2009;13(2):111–116.
- ,,,.Treatment strategies for small bowel bacterial overgrowth in short bowel syndrome.J Pediatr Gastroenterol Nutr.1998;27(2):155–160.
- ,,,.Short bowel syndrome following bariatric surgical procedures.Am J Surg.2006;192(6):828–832.
- ,,,,.Postoperative short bowel syndrome.J Am Coll Surg.2005;201(1):85–89.
- ,,.D‐lactic acidosis. A review of clinical presentation, biochemical features, and pathophysiologic mechanisms.Medicine.1998;77(2):73–82.
- ,,, et al.Oral vitamin B12 versus intramuscular vitamin B12 for vitamin B12 deficiency: a systematic review of randomized controlled trials.Fam Pract.2006;23(3):279–285.
- ,,.Neuromuscular diseases and disorders of the alimentary system.Muscle Nerve.2002;25(6):768–784.
- .Nutritional deficiencies following bariatric surgery.General Surgery News: Obesity Care Special Edition.2007;65–72. Available at: http://www.generalsurgerynews.com/download/gsnse07issueWM.pdf.
- ,,,.Neurologic complications after surgery for obesity.Muscle Nerve.2006;33(2):166–176.
- ,,.Acquired hypocupremia after gastric surgery.Clin Gastroenterol Hepatol.2004;2(12):1074–1079.
- ,.Krause's Food 2008.
- ,.Nutritional consequences of bariatric surgery.Curr Opin Clin Nutr Metab Care.2006;9(4):489–496.
- ,,,,.Nutritional deficiencies following bariatric surgery: what have we learned?Obes Surg.2005;15(2):145–154.
- .Managing micronutrient deficiencies in the bariatric surgical patient.Obesity Management.2005;1(5):203–206. Available at: http://www.liebertonline.com/doi/pdf/10.1089/obe.2005.1.203.
- ,,, et al.Abnormalities of vitamin D and calcium metabolism after surgical treatment of morbid obesity: a study of 136 patients.Endocr Pract.2007;13(2):131–136.
- ,,.Vitamin D deficiency in adults: when to test and how to treat.Mayo Clinic Proc.85(8):752–757; quiz757–758.
- ,,, et al.Endocrine and nutritional management of the post‐bariatric surgery patient: an Endocrine Society Clinical Practice Guideline.J Clin Endocrinol Metab.2010;95(11):4823–4843.
- ,,.Small bowel obstruction after laparoscopic Roux‐en‐Y gastric bypass: a review of 9,527 patients.J Am Coll Surg.2008;206(3):571–584.
- ,,,,.Small‐bowel obstruction after laparoscopic Roux‐en‐Y gastric bypass: etiology, diagnosis, and management.Arch Surg.2007;142(10):988–993.
Obesity is a growing epidemic in the United States and worldwide. Over one‐third of Americans (33.8%) are considered obese (body mass index [BMI] 30).1 Nonsurgical interventions have failed to achieve the long‐lasting effects of weight loss surgery and the associated reduction in obesity‐related comorbidities such as type 2 diabetes mellitus, hyperlipidemia, hypertension, obstructive sleep apnea, cancer, coronary artery disease, osteoarthritis, and gastroesophageal reflux disease (GERD).27 The American Society for Metabolic and Bariatric Surgery estimates that 220,000 people underwent bariatric surgery in 2009 with over 1.5 million procedures performed since 1992.
Centers of excellence criteria include follow‐up with the bariatric surgeon for 5 years; however, the patient may be admitted to a hospital without immediate availability of the bariatric surgeon. Since hospitalists are often first responders to the majority of newly hospitalized patients, this growing number of post‐bariatric surgery patients necessitates hospitalists have a full understanding of their unique postoperative anatomical and physiological consequences. During the first hours of an acute inpatient presentation, post‐bariatric surgical patients can be divided into the following categories: surgical complications, surgical complications masquerading as acute medical conditions, and medical complications. Additionally, hospitalists should be aware of the nuances of radiographic imaging and appropriate endoscopic procedures in these patients. This article will discuss the common current bariatric surgical procedures; post‐bariatric surgery radiographic imaging pearls; and a review of the signs, symptoms, and treatment of common medical and surgical complications.
Descriptions of Contemporary Procedures
Contemporary weight loss procedures can be divided into 2 categories based on how they produce weight loss: restrictive only or combination malabsorptive with restriction. Most are performed laparoscopically to reduce postoperative pain, speed recovery, and decrease wound complications.
Restrictive Procedures (Laparoscopic Adjustable Gastric Band and Sleeve Gastrectomy)
These procedures produce weight loss by reducing the size of the stomach or creating an obstruction in the proximal stomach, limiting the consumption of large quantities at one time. They produce early satiety, but patients may still consume a large volume of calorie‐dense liquids compromising weight loss.
Laparoscopic Adjustable Gastric Band
Laparoscopic adjustable gastric band (LAGB; Figure 1A) is the primary form of restrictive procedures with 2 Food and Drug Administration‐approved bands (Lap Band [Allergan, Inc; Irvine, CA] and REALIZE band [Ethicon Endo‐Surgery, Inc; Cincinnati, OH]). A cuff is inflated around the proximal stomach creating a gastric pouch approximately 15‐30 mL in size. A subcutaneous reservoir is attached to the cuff allowing adjustment to the degree of restriction.8 LAGB has replaced the vertical banded gastroplasty (VBG). It is less invasive, adjustable, and reversible (0.1% operative mortality rate). Weight loss is maintained with this procedure but is generally less, with a higher failure rate compared to the more common gastric bypass procedure (Table 1).3, 9 Complications may include band dysfunction (ie, slippage, erosion, infections), esophageal dilatation, balloon failure, and port malposition, with rates approaching 3%‐5% per year requiring removal or repair.10 Patients may also experience GERD symptoms, especially if the condition was present preoperatively. Progressive GERD symptoms should be investigated with an upper gastrointestinal (GI) series to ensure there is no band slippage, esophageal dilation, or dysfunction.
| LAGB | Roux‐en‐Y Gastric Bypass | Biliopancreatic Diversion With and Without Duodenal Switch | |
|---|---|---|---|
| Excess weight loss | 48% | 62% | 70% |
| Resolution of diabetes | 48% | 84% | 98% |
Sleeve Gastrectomy
With the sleeve gastrectomy (Figure 1B) procedure, a small gastric tube is created by resecting the majority of the stomach. Early postoperative complications are comparable to those after Roux‐en‐Y gastric bypass (RYGB) operations. Leaks from the long gastric staple line are the most concerning. Recent report of a leak rate of 4.9% is much higher than contemporary reports of leaks after laparoscopic RYGB operations.11 Gastric tube stenosis is unique to the operation but comparable to gastrojejunal anastomotic stricture rates after RYGB. Weight loss is less than RYGB. Long‐term results from larger cohorts are needed to determine if the high incidence of esophageal complaints (GERD 26%, vomiting 21%), and weight regain issues are consistently experienced.
Combination Procedures (Roux‐en‐Y Gastric Bypass and Biliopancreatic Diversion With and Without Duodenal Switch)
These procedures produce weight loss by decreasing caloric intake and altering digestion and absorption.
Roux‐en‐Y Gastric Bypass
Roux‐en‐Y Gastric Bypass (RYGB) (Figure 1C) is the most common bariatric procedure performed in the United States. As the gold standard, it provides long‐term successful weight loss and a defined risk profile.9 This procedure involves the creation of a small (15‐30 mL) gastric pouch by transecting the stomach and then draining the pouch via a Roux limb. The Roux (aka alimentary) limb is the segment of bowel between the small gastric pouch and the jejunojejunostomy. Variations on this procedure include different length Roux limbs (75‐150 cm) and the use of a silastic ring at the gastrojejunal anastomosis. The latter is not commonly used because of the high incidence of band erosion. Weight loss seems to be independent of these variations. Postoperatively, food bypasses the biliopancreatic limb (ie, the stomach, duodenum, and part of the jejunum) resulting in selective malabsorption in the common channel (the segment distal to the jejunojejunostomy). Hormone secretions are altered, affecting satiety signaling and glucose metabolism.10, 12
Biliopancreatic Diversion With Duodenal Switch
In biliopancreatic diversion (BPD) with duodenal switch (DS) (Figure 1D), a sleeve gastrectomy is performed. The ileum is transected about 250 cm proximal to the ileocecal valve and is then attached to the transected duodenum just distal to the pylorus, forming the path for the food. The excluded duodenum, jejunum, and proximal ileum drain the biliary and pancreatic secretions and are reconnected to the distal ileum about 50‐100 cm proximal to the ileocecal valve. Food and digestive juices mix, allowing for absorption of nutrients over this short common channel. Greater malabsorption of calories, vitamins, and trace elements occurs, providing more reliable weight loss and significantly more nutritional problems.8, 9
Radiographic and Endoscopic Considerations
When evaluating abdominal complaints with radiographic imaging, the postoperative anatomic variations can challenge routine interpretation. An experienced radiologist and involvement of a bariatric surgeon, who is familiar with the post‐gastric bypass anatomical changes, are essential for accurate interpretation.
Computed tomography (CT) scans with oral contrast are the imaging modality of choice, particularly in the acute setting, to rule out small bowel obstruction. CT scans are helpful in delineating postoperative anatomy, detecting anastomotic leaks, obstructions and other intra‐abdominal problems.1315 Routine upper GI series (UGI) after gastric bypass is controversial, with some performing it routinely and others only for cause. Regardless, when UGI is performed, likewise for CT, small volumes of water‐soluble contrast should be used, followed by small volumes of dilute barium solution. A UGI may be complementary and more sensitive in the case of a small leak when done under fluoroscopy, but CT and UGI may not show the leak in as many as 30% of patients; CT scans may provide additional information to help guide the clinical decision making. A negative study should not preclude surgical exploration if a high suspicion for leak exists.16 Internal hernias (loop of bowel passing through a mesenteric defect created by the original surgery), a common cause of bowel obstructions, are frequently missed, therefore a high level of suspicion is necessary.1719 Several studies have identified 8 radiographic CT findings in bowel obstructions caused by internal hernias including swirl sign, mushroom sign, hurricane eye, small bowel obstruction, clustered loops, small bowel behind superior mesenteric artery, right‐side anastomosis, and engorged nodes.18, 19 The clinical picture should guide medical versus surgical management in those exceeding CT scanner weight limits (commonly 350 lb).
Imaging modalities such as UGI, endoscopy, or double balloon enteroscopy (DBE) should be used for patients with more chronic abdominal complaints. UGI may miss leaks and obstructions in the remnant stomach and bypassed intestine. If pathology, such as ulcers, retained sutures, and strictures are suspected in the bypassed stomach/emntestine, DBE can be used to diagnose and therapeutically intervene, but may not be available at all centers and referral may be considered. Endoscopy allows for direct visualization of subtle or mucosal pathology in the small bowel, but is unable to visualize the excluded stomach and duodenum.20
Early Medical and Surgical Complications
Early postoperative complications (within 30 days) occur in the minority of patients after weight loss operations. Clinical findings, even in life‐threatening conditions, may be subtle. Readmissions most often occur for dehydration secondary to inadequate oral intake. Pneumonias, and wound and urinary tract infections are not unique to the bariatric surgery patient, but there is a higher than average risk of pulmonary embolism and bleeding. Bleeding most frequently occurs into the GI tract from staple lines resulting in rapid catharsis or emesis, but can also be intraperitoneal and elusive. Most GI bleeding stops spontaneously, but some require transfusion and re‐exploration in extreme cases.21 Leaks may occur at any of the staple lines or anastomoses. The most common sites of leak are the g‐j anastomosis, gastric pouch, and remnant stomach. Again, remnant stomach and j‐j anastomosis leaks may escape detection by UGI and CT. Re‐exploration of a sick patient in the early postoperative period may be required despite normal imaging studies. Early consultation with, or transfer to, a bariatric surgery center should always be considered for patients readmitted after bariatric surgery.
Late Medical Complications
Gastrointestinal complaints, excessive weight loss, and vitamin/mineral deficiencies resulting in neurological problems and metabolic bone disease are post‐bariatric medical complications that may prompt hospital admission. If not the primary reason for admission, special attention to these issues may prevent readmission, another focus of hospital care.
Gastrointestinal Complaints
One of the most common causes of hospital admission any time postoperatively is abdominal pain. A differential diagnosis of abdominal pain, nausea, and/or vomiting in the post‐bariatric surgery patient should include small bowel obstruction, hernias (internal or incisional), band complications, food intolerance, dietary noncompliance, ileus, mesenteric venous thrombosis, strictures (such as outlet obstruction or anastomotic stenosis), ulcers, esophagitis, cholelithiasis, dumping syndrome, and Roux stasis syndrome.20
A thorough history targeted at the relationship between symptoms and food intake, attention to the character and location of the pain, and a thorough physical exam (specifically the presence or absence of palpable tenderness, guarding, or rebound) is essential. The physical exam may be misleading in obese patients and, if radiographic studies cannot be performed secondary to patient size, surgical exploration may be needed soon after presentation. Therefore, even lacking an obvious surgical need, the bariatric surgeon should be notified of admission.
Improper food choice, and failure to slowly and adequately chew food, can result in emesis and digestive difficulty. Physical incompatibility with the small gastric pouch and gastric outlet obstructions can be caused by nondigestible foods (ie, breads, steak, raw vegetables). This highlights the importance of ordering the appropriate hospital diet.8 Specific gastric bypass hospital diets for all consistencies should reflect the mechanical limitations and carbohydrate/protein requirements of these patients.
Increased gallstone formation is observed in patients with rapid weight loss (1.5 kg/wk), especially following RYGB and less often after LAGB procedures (40% vs 20% over 3 years). Routine use of ursodiol during rapid weight loss (6 months after RYGB) reduces this complication to <5%.8
Stenosis or ulceration at the anastomotic site for RYGB can cause abdominal pain and vomiting. The incidence of stomal stenosis has been reported at 5%‐19% and typically occurs within the first 3 postoperative months.22 This problem is often amenable to endoscopic dilatation, unless a ring was used to reinforce the anastomosis. Ulceration has been reported in 1%‐16% of patients and is usually secondary to tobacco or non‐steroidal anti‐inflammatory drug (NSAID) use, H. pylori, fistula‐induced acid exposure, reaction to foreign material, or ischemia from tension and poor tissue perfusion.23, 24 Endoscopy can diagnose the presence of ulcers, with biopsies to rule out H. pylori infection. Cessation of NSAIDs and tobacco are critical. Medical management including proton pump inhibitors and/or sucralfate is sufficient for up to 95% of patients. Surgical revision is reserved for persistent ulcers associated with obstruction, pain, and/or bleeding.25
Dumping syndrome is a complex of post‐prandial symptoms occurring most commonly in the RYGB patients. As many as 44% of RYGB patients may experience this syndrome characterized by flushing, dizziness, abdominal distension, pain, nausea, vomiting, and/or diarrhea.26 Symptoms may result from the ingestion of large amounts of sugars which empty from the altered gastric pouch at an unregulated rate. This large osmotic load causes fluid shifts and surges in peptide hormone levels, resulting in symptoms which may reinforce adherence to the prescribed postoperative diet. It occurs shortly after a meal and resolves over hours. Dietary modifications, such as increased protein and fiber intake with decreased consumption of simple sugars, will ameliorate symptoms in many patients, with most seeing resolution after the first year.8, 27 Some patients experience hyperglycemia secondary to ingestion of simple carbohydrates, with hypoglycemia approximately 2 hours later (late dumping). In our experience, limiting carbohydrate intake to 30 grams at any meal usually alleviates post‐prandial hypoglycemia.
If the patient reports an absence of bowel movements and flatus, an ileus from chronic narcotic use or a mechanical small bowel obstruction secondary to internal hernias or adhesions (see Late Surgical Complications) must be investigated. Severe or prolonged pain, lasting longer than a few hours, is cause for alarm and should prompt aggressive evaluation and possibly exploratory surgery.
Excessive Weight Loss
In diagnosing postoperative excessive weight loss, it is important to understand average anticipated weight loss parameters. Compared to the values expected for RYGB, LAGB produces less weight loss and BPD with and without DS produces more (Table 227). Patients experiencing more rapid or prolonged weight loss should be investigated for bacterial overgrowth syndrome, short bowel syndrome, or other anatomic abnormalities.
| Postoperative Time Period | Average Weight Loss (RYGB) | |
|---|---|---|
| Daily | By Time Period | |
| ||
| 0‐3 mo | 0.22‐0.45 kg/day | 15‐20 kg by 3 mo |
| 3‐9 mo | 0.11‐0.22 kg/day | 25‐35 kg by 6 mo |
| 9‐12 mo | 0.11 kg/day | 40‐60 kg in first year |
Known risk factors for bacterial overgrowth, which are prominent in this population, include decreased gastric acidity and slowed intestinal transit time (ie, narcotic use). Patients may be asymptomatic or experience weight loss, abdominal bloating and/or pain, nausea, vomiting, and diarrhea. The diagnosis can be made with a hydrogen breath test or by obtaining quantitative cultures of jejunal secretions during endoscopy. Questions remain on how the normalized values of these tests are affected by the postoperative environment, and on how this syndrome may present or be treated if it affects the excluded intestine. Bacterial overgrowth may be an incidental finding and not the cause of the gastrointestinal complaints. Although data is limited, treatment typically consists of a 7‐10 day course of rifaximin 1200 mg/day (divided doses) and/or a trial of dietary modifications.20, 2831 These may include avoiding lactose and eating a high fat, low carbohydrate, low fiber diet, so nutrients are readily absorbed and not left for bacterial consumption.32
Short bowel syndrome (<100‐200 cm of intestinal tissue remaining and subsequent malabsorption) can occur after any extensive colonic resection or bypass of the intestine.33 This condition rarely results after an initial bariatric procedure; however, subsequent procedures for small bowel obstructions or intestinal ischemia may result in short bowel syndrome. Typical presentations include diarrhea, weight loss, and symptoms of vitamin and mineral deficiencies. Short bowel can also predispose patients to the development of bacterial overgrowth, further complicating weight loss. Management consists of nutritional supplementation, occasionally parenteral nutrition, and rarely reoperation to increase the length of the common channel.34 Avoidance of further bowel resection is crucial in preventing short bowel syndrome.33, 34 In the setting of carbohydrate malabsorption with concomitant bacterial overgrowth syndrome, production of d‐lactic acid causing a metabolic acidosis with encephalopathy has been reported.35
Once medical complications have been ruled out, it is prudent to evaluate for a psychological component such as anorexia nervosa. It is helpful to involve a qualified psychologist who is familiar with this population. Addictions to alcohol, gambling, and pain medications have been reported in the post‐bariatric surgery population as a substitute for food addiction.
Neurological Complications and Vitamin Deficiencies
Neurological complications develop months to years postoperatively, secondary to vitamin, mineral, and nutrient deficiencies that result from malabsorption or inadequate intake. An inpatient provider should be aware of the potential role these conditions may play in a hospitalized patient.
Peripheral neuropathy can develop secondary to several deficiencies, including vitamin B12, thiamine, vitamin E, and copper. Their sources, deficiencies, and replacement regimens are presented in Table 3.3642 Thiamine deficiency, manifesting as Wernicke's encephalopathy, is particularly important in the postoperative patient with excessive vomiting. For prevention, we recommend all patients readmitted with vomiting and dehydration receive a banana bag or rally pack (thiamine 100 mg, folic acid 1 mg, multivitamin with iron and magnesium 3 g in one liter of D5 normal saline) over 4‐8 hours. Additional deficiencies after gastric bypass include folate, selenium, zinc, vitamin B6, and riboflavin. A multivitamin with minerals will meet the needs of most patients. Multiple fat‐soluble vitamin deficiencies can occur with small bowel bacterial overgrowth or BPD.
| B12 | B1 (Thiamine) | Vitamin E | Copper | |
|---|---|---|---|---|
| Dietary sources | Meat and dairy | Fortified grains, cereals, nuts, and pork | Vegetable oil, nuts, leafy vegetables39 | Shellfish, organ meats (liver, kidney), chocolate, nuts, dried legumes/fruits41 |
| Location of absorption | Terminal ileum after combining with intrinsic factor | Proximal small intestine | Upper small intestine41 | Stomach and duodenum38 |
| Mechanism of deficiency | Inadequate intake intrinsic factor deficiency37, 39 | Bypass of primary absorption site Inadequate intake Excessive emesis | Fat malabsorption39 Inadequate intake | Defective intestinal mucosal transport40 Decreased absorptive surface area40 Inadequate intake Coadministered zinc which competes with copper for absorption38 |
| Time to develop deficiency | Years | 18 days37, 39 | 6‐12 mo39 | 3‐12 mo42 |
| Postoperative supplementation recommendation | Optimal prophylactic dose unknown Minimum 1‐2 mg/day | 1‐1.5 mg/day37 | Males: 10 mg/day Females: 8 mg/day | Multivitamin (900 g/day) |
| Pathology of deficiency | Macrocytic anemia Paresthesias Ataxia Subacute combined degeneration of the spinal cord | Dry beriberi Wernicke's encephalopathy Korsakoff's syndrome | Myopathy/neuropathy Ataxia | Demyelinating neuropathy with ataxia Anemia |
| Labs to document deficiency | Serum B12 | Erythrocyte transketolase activity Thiamine diphosphate effect37 | Serum alphatocopherol37, 39 Check for deficiencies of other fat soluble vitamins (A, D, K) | Serum copper level40 |
| Correcting deficiency | Intramuscular B12 (1000 mcg) Sublingual supplementation36 | 50‐100 mg/day (parenteral or oral)37 | 400 mg PO BID37 | 2‐4 mg/day38 |
Anemia
Iron deficiency affects 6%‐33% of patients after 1 year.43 Iron is preferentially absorbed in the duodenum and proximal jejunum which are bypassed postoperatively. The absence of gastric acid prevents conversion of ferric (Fe2+) to the absorbable ferrous (Fe3+) iron, further decreasing absorption.44 Ferritin reflects iron stores but is also an acute phase reactant and, therefore, may mask an underlying deficiency in an acutely ill hospitalized patient. A multivitamin with iron is recommended for all patients, but additional supplementation may be required for menstruating women.43 Parenteral administration may be necessary if oral supplements are not tolerated or are inadequately absorbed.44
Fractures and Osteomalacia
Calcium and vitamin D deficiencies are a significant problem in the bariatric surgery population, with resultant osteoporosis or osteomalacia and associated fractures.38, 43 Calcium is preferentially absorbed in the duodenum and proximal jejunum. Vitamin D is absorbed in the ileum or produced in the skin in response to ultraviolet B (UVB) radiation.45 Deficiency of vitamin D exacerbates calcium malabsorption, thereby causing secondary hyperparathyroidism, increased bone turnover, and osteomalacia. Dramatic weight loss can lead to bone loss, increasing the risk for osteoporosis and fractures.38 Hypocalcemia or osteomalacia may cause generalized bone pain, muscular weakness, tetany, and chronic musculoskeletal pain.45
Fat‐soluble vitamin deficiencies are more common in those undergoing malabsorptive versus restrictive procedures and, in the case of BPD, may be related to the length of the common channel.43 It is important to ensure that calcium and vitamin D levels are sufficient prior to surgery, and prior to starting any osteoporotic treatment such as bisphosphonates.45 We recommend at least 1200 mg of calcium citrate and 1000‐2000 IU of Vitamin D daily. Up to 50,000 IU weekly or daily may be required to correct deficiency and maintain sufficiency in this population.46, 47 Vitamin D2 (ergocalciferol) or D3 (cholecalciferol) can be used for supplementation. Cholecalciferol is preferred if given through a feeding tube because it is less prone to clogging the tube.46 With severe malabsorption, phototherapy may be necessary, as intravenous doses are often inadequate and intramuscular preparations require special compounding.46 Calcium carbonate requires acid for proper absorption, therefore calcium citrate may be preferred due to achlorhydria from gastric exclusion.
Late Surgical Complications
Hospitalists are increasingly responsible for managing and comanaging surgical patients. The post‐bariatric surgery patient may present with unique signs and symptoms of surgical conditions masquerading as medical conditions. Common conditions that present in uncommon ways include strictures (ie, outlet obstruction and stomal stenosis), hernias with strangulation (incisional and internal), and small bowel obstructions.
Small bowel obstruction (SBO) occurs in 0%‐5% of RYGB patients (less with LAGB, similar with BPD), which is similar to other abdominal surgery rates, and may occur months to years after the original surgery. The differential diagnosis of an SBO includes internal hernias, adhesions, ventral hernia (incisional and umbilical), postoperative ileus, and jejunojejunal anastomotic stricture. Typical symptoms are often present, but may be less obvious than with a non‐gastric bypass patient. Pain can range from acute to a chronic or intermittent pattern. Pain is the most common presenting symptom of obstruction. Pain relieved by emesis may indicate an obstruction in the Roux limb. Nausea, bloating, tachycardia, and hiccups with shoulder/back pain can occur when obstruction in the biliopancreatic limb causes gastric distension.48
Vomiting is seen in fewer than half of patients with SBOs due to the altered anatomy.49 Any post‐RYGB patient that vomits bile needs emergent surgical evaluation for a common channel obstruction. Radiographic imaging may be misleading as to the cause of the obstruction. SBO is crucial to consider since delayed diagnosis can result in bowel ischemia and death.18 For the hospitalist who is caring for a post‐bariatric patient with a bowel obstruction, early surgical consultation is mandatory, preferably with a bariatric surgeon. Traditional medical management such as nasogastric (NG) tube placement will not decompress the excluded stomach, therefore patients rarely benefit from nasogastric decompression. If necessary, an NG tube should only be placed by experienced hands or fluoroscopic guidance, due to the altered anatomy.
Conclusion
Weight loss surgery, developed to address the growing obesity problem, has been beneficial to hundreds of thousands of people by decreasing their excess weight and comorbidities. For some, the postoperative course is complicated by medical and surgical problems requiring hospitalization. It is critically important that, as this relatively new field of postoperative medicine evolves, the hospitalist stay informed on relevant presentations, complications, and treatment to better address this growing population. Early consultation with, and transfer to, a bariatric surgery center should be encouraged. The importance of arranging proper hospital follow‐up, including community‐based support groups, nutritional consults, psychological support, and close follow‐up with the bariatric surgeon, bariatrician, and/or primary care physician, should not be underestimated.
- ,,,.Prevalence and trends in obesity among US adults, 1999‐2008.JAMA.2010;303(3):235–241.
- ,,, et al.Long‐term mortality after gastric bypass surgery.N Engl J Med.2007;357(8):753–761.
- ,,, et al.Bariatric surgery: a systematic review and meta‐analysis.JAMA.2004;292(14):1724–1737.
- ,,.Results of laparoscopic sleeve gastrectomy (LSG) at 1 year in morbidly obese Korean patients.Obes Surg.2005;15(10):1469–1475.
- ,,, et al.Lifestyle, diabetes, and cardiovascular risk factors 10 years after bariatric surgery.N Engl J Med.2004;351(26):2683–2693.
- ,,, et al.Long‐term weight loss and changes in blood pressure: results of the Trials of Hypertension Prevention, phase II.Ann Intern Med.2001;134(1):1–11.
- ,,,.Narrative review: effect of bariatric surgery on type 2 diabetes mellitus.Ann Intern Med.2009;150(2):94–103.
- ,,.Metabolic consequences of bariatric surgery.J Clin Gastroenterol.2006;40(8):659–668.
- ,.Surgical approaches to obesity.Mayo Clin Proc.2006;81(10 suppl):S18–S24.
- ,,, et al.American Association of Clinical Endocrinologists, The Obesity Society, and American Society for Metabolic 4(5 suppl):S109–S184.
- ,,.Long‐term results of laparoscopic sleeve gastrectomy for obesity.Ann Surg.2010;252(2):319–324.
- ,,,,.Gastric banding or bypass? A systematic review comparing the two most popular bariatric procedures.Am J Med.2008;121(10):885–893.
- ,.Gastrointestinal complications of laparoscopic Roux‐en‐Y gastric bypass surgery in patients who are morbidly obese: findings on radiography and CT.AJR Am J Roentgenol.2002;179(6):1437–1442.
- ,,,,.Gastrointestinal complications of laparoscopic Roux‐en‐Y gastric bypass surgery: clinical and imaging findings.Radiology.2002;223(3):625–632.
- ,,.Use of computed tomography in diagnosis of major postoperative gastrointestinal complications of laparoscopic Roux‐en‐Y gastric bypass surgery.Am Surg.2004;70(11):964–966.
- ,,, et al.Diagnosis and contemporary management of anastomotic leaks after gastric bypass for obesity.J Am Coll Surg.2007;204(1):47–55.
- ,,,,.Small‐bowel obstruction after laparoscopic Roux‐en‐Y gastric bypass surgery.J Comput Assist Tomogr.2009;33(3):369–375.
- ,,,,,.Sensitivity and specificity of eight CT signs in the preoperative diagnosis of internal mesenteric hernia following Roux‐en‐Y gastric bypass surgery.Clin Radiol.2009;64(4):373–380.
- ,,, et al.Internal hernia after gastric bypass: sensitivity and specificity of seven CT signs with surgical correlation and controls.AJR Am J Roentgenol.2007;188(3):745–750.
- ,,,,.Nausea, bloating and abdominal pain in the Roux‐en‐Y gastric bypass patient: more questions than answers.Obes Surg.2007;17(11):1529–1533.
- ,,, et al.Management of acute bleeding after laparoscopic Roux‐en‐Y gastric bypass.Obes Surg.2003;13(6):842–847.
- ,,,,.Endoscopic balloon dilation of gastroenteric anastomotic stricture after laparoscopic gastric bypass.Endoscopy.2003;35(9):725–728.
- ,.Ulcer disease after gastric bypass surgery.Surg Obes Relat Dis.2006;2(4):455–459.
- ,,,.Marginal ulcer after gastric bypass: a prospective 3‐year study of 173 patients.Obes Surg.1998;8(5):505–516.
- ,,,,.Stomal complications of gastric bypass: incidence and outcome of therapy.Am J Gastroenterol.1992;87(9):1165–1169.
- ,,,,.[Analysis of the dumping syndrome on morbid obese patients submitted to Roux en Y gastric bypass].Rev Col Bras Cir.2009;36(5):413–419.
- ,,, et al.Clinical management after bariatric surgery: value of a multidisciplinary approach.Mayo Clin Proc.2006;81(10 suppl):S34–S45.
- ,,,,,.Antibiotic efficacy in small intestinal bacterial overgrowth‐related chronic diarrhea: a crossover, randomized trial.Gastroenterology.1999;117(4):794–797.
- ,,,,.Absorbable vs. non‐absorbable antibiotics in the treatment of small intestine bacterial overgrowth in patients with blind‐loop syndrome.Aliment Pharmacol Ther.2005;21(8):985–992.
- ,,, et al.Small intestinal bacterial overgrowth: diagnosis and treatment.Dig Dis.2007;25(3):237–240.
- ,,, et al.Antibiotic therapy in small intestinal bacterial overgrowth: rifaximin versus metronidazole.Eur Rev Med Pharmacol Sci.2009;13(2):111–116.
- ,,,.Treatment strategies for small bowel bacterial overgrowth in short bowel syndrome.J Pediatr Gastroenterol Nutr.1998;27(2):155–160.
- ,,,.Short bowel syndrome following bariatric surgical procedures.Am J Surg.2006;192(6):828–832.
- ,,,,.Postoperative short bowel syndrome.J Am Coll Surg.2005;201(1):85–89.
- ,,.D‐lactic acidosis. A review of clinical presentation, biochemical features, and pathophysiologic mechanisms.Medicine.1998;77(2):73–82.
- ,,, et al.Oral vitamin B12 versus intramuscular vitamin B12 for vitamin B12 deficiency: a systematic review of randomized controlled trials.Fam Pract.2006;23(3):279–285.
- ,,.Neuromuscular diseases and disorders of the alimentary system.Muscle Nerve.2002;25(6):768–784.
- .Nutritional deficiencies following bariatric surgery.General Surgery News: Obesity Care Special Edition.2007;65–72. Available at: http://www.generalsurgerynews.com/download/gsnse07issueWM.pdf.
- ,,,.Neurologic complications after surgery for obesity.Muscle Nerve.2006;33(2):166–176.
- ,,.Acquired hypocupremia after gastric surgery.Clin Gastroenterol Hepatol.2004;2(12):1074–1079.
- ,.Krause's Food 2008.
- ,.Nutritional consequences of bariatric surgery.Curr Opin Clin Nutr Metab Care.2006;9(4):489–496.
- ,,,,.Nutritional deficiencies following bariatric surgery: what have we learned?Obes Surg.2005;15(2):145–154.
- .Managing micronutrient deficiencies in the bariatric surgical patient.Obesity Management.2005;1(5):203–206. Available at: http://www.liebertonline.com/doi/pdf/10.1089/obe.2005.1.203.
- ,,, et al.Abnormalities of vitamin D and calcium metabolism after surgical treatment of morbid obesity: a study of 136 patients.Endocr Pract.2007;13(2):131–136.
- ,,.Vitamin D deficiency in adults: when to test and how to treat.Mayo Clinic Proc.85(8):752–757; quiz757–758.
- ,,, et al.Endocrine and nutritional management of the post‐bariatric surgery patient: an Endocrine Society Clinical Practice Guideline.J Clin Endocrinol Metab.2010;95(11):4823–4843.
- ,,.Small bowel obstruction after laparoscopic Roux‐en‐Y gastric bypass: a review of 9,527 patients.J Am Coll Surg.2008;206(3):571–584.
- ,,,,.Small‐bowel obstruction after laparoscopic Roux‐en‐Y gastric bypass: etiology, diagnosis, and management.Arch Surg.2007;142(10):988–993.
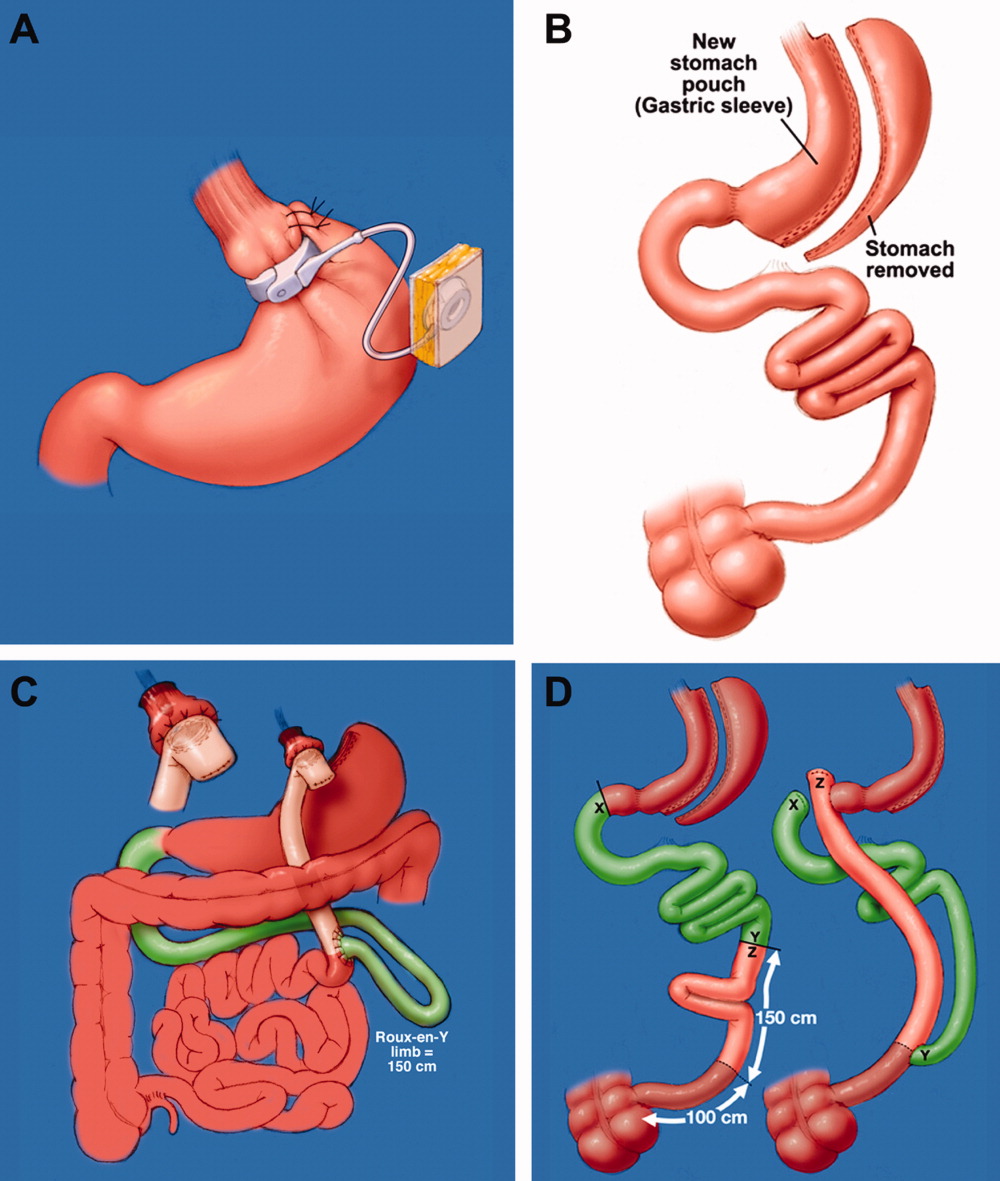
Inpatient Diabetes Care
Diabetes confers a substantial burden on the hospital system. Diabetes is the fourth‐leading comorbid condition associated with any hospital discharge in the United States1. During 2001, for more than 500,000 patients discharged from U.S. hospitals diabetes was listed as the principal diagnosis and for more than 4 million it was listed as a codiagnosis.2, 3 Nearly one‐third of diabetes patients require at least 2 hospitalizations annually,4 and inpatient stays account for the largest proportion of direct medical expenses incurred by persons with the disease.5
Numerous studies have demonstrated that hyperglycemia is associated with adverse outcomes of hospitalized patients.68 However, studies have also confirmed that attention to lowering glucose levels in the hospital improves patient outcomes.7, 8 Although inpatients with known diabetes will likely constitute the largest and most visible percentage of those who will require treatment for high glucose, the recommendation to control glucose applies to all inpatients regardless of whether they have been diagnosed with diabetes prior to hospitalization or have manifested hyperglycemia only during the hospital stay.79
Now that the relationship between hyperglycemia and hospital outcomes is well established, the task of organizations that deliver care and set policy is to translate current recommendations of good glucose control into real‐world hospital settings. Quality improvement organizations are currently working toward developing and disseminating performance measures for control of inpatient hyperglycemia.10, 11 Although management of hospital hyperglycemia is often perceived as suboptimal,12 actual data are limited and are based on review of small numbers of charts,1315 and information is even sparser on the pharmacologic strategies being used to treat inpatient hyperglycemia. Before educational programs and policies can be developed, individual hospital systems need to gain more insight into how hyperglycemia is being managed in the hospital.
We reported previously the results of a review of a small number of charts (n = 90) of patients hospitalized with diabetes. The findings from this review suggested there was clinical inertia in glycemia management in the hospital.15 Clinical inertia was originally described in relationship to diabetes care in the outpatient setting and was defined as a failure to perform a needed service or make a change in treatment when indicated.16, 17 Since the original description, additional reports have documented the problem of clinical inertia, but these have all been based on experiences in the outpatient setting.1822 To our knowledge, our previous report was the first to question whether clinical inertia occurred in the hospital environment. In addition, we described the negative therapeutic momentuma deintensification of treatment despite ongoing hyperglycemia15. However, our prior study examined only a small number of cases and did not include detailed data on pharmacologic treatment for hyperglycemia. Therefore, we expanded our analysis using an information systems rather than a chart reviewbased methodology to assess the status of hyperglycemia management in our hospital.
METHODS
Setting
Our tertiary‐care academic teaching hospital is a 200‐bed facility in metropolitan Phoenix, Arizona. All adult general medical and surgical specialties are represented, including transplantation services; the hospital also has a level 2 trauma center and an inpatient rehabilitation unit. Care is provided by various types of practitioners, including postgraduate trainees, faculty, physician assistants, and nurse‐practitioners. An electronic medical record links outpatient and inpatient records with laboratory results and pharmacy orders. The core electronic health record system is the Centricity/LastWord platform, provided by GE/IDX. The ancillary core systems, including laboratory and pharmacy, are interfaced with the Centricity system and maintained by on‐site Mayo Clinic information technology professionals.
Case Selection
Patients discharged with an International Classification of Diseases, 9th Revision, Clinical Modification (ICD‐9‐CM) diagnosis code for diabetes (ICD‐9‐CM code 250.xx) or hyperglycemia (ICD‐9‐CM code 790.6) were identified in a search of the hospital's electronic billing records.24 Our facility does not provide obstetric or pediatric services; therefore, corresponding ICD‐9‐CM codes for those populations were not included. Both primary and nonprimary diagnostic fields were searched. Discharges were extracted for the period between January 1, 2001, and December 31, 2004. Data retrieved included patient age, ethnicity/race, length of stay (LOS), and type of hospital service with primary responsibility for the patient's care. For confidentiality reasons, individual patients were not identified, and the unit of analysis was the discharge.
Our analyses focused principally on the noncritically ill, defined as those patients who did not require a stay in our intensive or intermediate care units; critically ill patients were identified based on room location in the data set and excluded. The reasons this study assessed hyperglycemia management in the noncritically ill were 2‐fold. First, the critically ill may migrate in and out of intensive care depending on their health status and thus experience different intensities of glucose management. Second, in our facility the therapeutic approach to hyperglycemia management is different for the critically ill than for the noncritically ill; the critically ill may receive intravenous and/or subcutaneous insulin, whereas subcutaneous insulin therapy only is given to the noncritically ill. Thus, the noncritically ill represent a more clearly defined patient population whose therapies would be easier to evaluate. We also restricted the final analysis to patients who had a LOS of 3 days or less, so that differences in glucose control and insulin therapy between the first and last 24 hours of hospital stay could be assessed.
Data on 30 randomly chosen patients from different years was extracted from electronic records. A spreadsheet of the data was compared against data in our online electronic medical records. The online data were printed, and packets were made of the data for each patient selected for review. The patient demographic information was validated against our registration screen. Inpatient stay was validated to verify a patient was in intensive or intermediate care. The result of each glucose test performed while the patient was in the hospital was printed and the calculations validated. The insulin given while the patient was hospitalized was also printed and reviewed to verify the type of insulin and calculations for the amounts of insulin given.
Assessment of Glycemic Control
After extraction of hospital cases, data were linked via patient identifiers to our electronic laboratory database to retrieve information on glucose values. Glucose data included both blood and bedside measurements. In our institution, bedside glucose monitoring is performed with an instrument that scans and records patient identification, followed by direct downloading to our laboratory database. Commercial software (Medical Automation Systems, Charlottesville, VA) facilitates the interfacing of glucometer data with the electronic laboratory file.
Nearly all hospitalized patients had either bedside glucose (84%) or blood glucose (86%) data available for analysis. However, the mean number of bedside glucose measurements was 3.4 per day, whereas the average number of blood glucose measurements was only 1.0 per day. Because of the greater number of bedside measurements and because practitioners typically make therapeutic decisions about hyperglycemia management on the basis of daily bedside glucose results, these values were used to assess glycemic control of patients in the hospital discharge data.15
To assess glycemic control, we used methods similar to those previously published by ourselves and others.15, 23 We averaged each patient's available bedside glucose measurements to determine the composite average (BedGlucavg). We also computed the average of bedside glucose measurements obtained during the first 24 hours after admission (F24BedGlucavg) and during the last 24 hours before discharge (L24BedGlucavg), then examined the distributions of BedGlucavg, F24BedGlucavg, and L24BedGlucavg. The first 24‐hour period was calculated forward from the recorded time of admission, and the last 24‐hour period was calculated backward from the time of discharge. We calculated the frequency that each patient's bedside measurements showed hypoglycemia (bedside glucose < 70, < 60, < 50, or < 40 mg/dL) and showed hyperglycemia (bedside glucose >2 00, > 250, > 300, > 350, or > 400 mg/dL). Results were recorded as the number of values per 100 measurements per person; this method allowed adjustment for variation in the individual number of measurements and captured information on multiple episodes of hypo‐ or hyperglycemia of individual patients.15, 23
Hyperglycemia Therapy
Links to our inpatient pharmacy database enabled determination of types of pharmacotherapy actually administered to patients to treat hyperglycemia. Our electronic pharmacy records are designed so that intravenous medications (eg, intravenous insulin), scheduled oral and subcutaneous medications (eg, subcutaneous insulin), and medications administered on a one‐time or as‐needed basis (eg, sliding‐scale insulin) are documented electronically as separate categories. In our facility, intravenous insulin is administered only in the intensive care setting or as a component of total parenteral nutrition, and we excluded intravenous insulin use from this data. Thus, our analysis of insulin therapy focused only on elucidating patterns of subcutaneous treatment.
We classified hyperglycemia treatment as no therapy, oral agents only, oral agents plus insulin, and insulin only. Patients were regarded as having received an oral agent or insulin if they were administered the medication at any time during their inpatient stay. For management of hyperglycemia in noncritically ill patients, the use of a programmed basal‐bolus insulin program is advocated rather than the use of only a short‐acting bolus or sliding‐scale regimen.7, 8 Therefore, we further examined the insulin treatment strategies by classifying the type of regimen as basal only (if only an extended‐release preparation was used), as basal bolus (if the therapy consisted of a long‐acting plus a short‐acting formulation), or as bolus only (if the only insulin administered was a short‐acting preparation).
In addition to characterizing the general therapeutic approaches to hyperglycemia, we determined changes in the amount of insulin administered according to the severity of the hyperglycemia. Among patients who received insulin, we compared the average total units of insulin used during the last 24 hours before discharge with the amount administered during the first 24 hours of hospitalization. If more units were used during the last 24 hours than in the first 24 hours, the amount of insulin administered was categorized as having increased; if fewer units were provided during the last 24 hours, then the insulin amount was classified as having decreased; otherwise, no change was considered to have occurred. The BedGlucavg values were divided into 3 intervals using tertile cut points, and the differences in the proportion of patients by each type of insulin treatment regimen and the categories of insulin change were compared across tertiles; differences in proportions were determined using the 2 statistic.
RESULTS
Patient Characteristics
Between January 1, 2001, and December 31, 2004, a total of 7361 patients were discharged from our facility with either a diabetes or a hyperglycemia diagnosis (16% of all discharges); the percentage of discharges associated with these diagnoses increased from 14.9% in 2001 to 16.4% in 2004. Most patients with diabetes or hyperglycemia (5198 or 71%) received care outside the intensive‐ or intermediate‐care setting.
Among the noncritically ill patients whose LOS was at least 3 days (N = 2916), average age was 69 years, and average LOS was 5.7 days. Most of the discharged patients were men (57%), and 90% were white. Most patients were discharged from primary care (45%; general internal medicine or family medicine) or surgical services (34%), with the rest discharged from other specialties (eg, cardiology, transplant medicine). Compared to the noncritically ill, who had an LOS of at least 3 days, those noncritically patients whose LOS was less than 3 days (n = 2282) were slightly younger (mean age 68 versus 69 years, P < .001 by Mann‐Whitney testing) but were comparable in sex and race distribution (P > .07 for both by chi‐square testing).
Glycemic Control
The median duration between admission and time of first bedside glucose measurement was 3.0 hours. Patients had an average of 19 bedside glucose measurements; the overall mean number of bedside measurements was 3.4 per day, 3.7 during the first 24‐hour period, and 3.4 during the last 24 hours of hospitalization. Nearly 25% of patients were hyperglycemic (bedside glucose > 200 mg/dL) during the first 24 hours of hospitalization (Fig. 1A), 20% had persistent hyperglycemia throughout the entire hospitalization (Fig. 1B), and 21% were hyperglycemic during the 24 hours before discharge (Fig. 1C), with some patients discharged with an average bedside glucose of at least 300 mg/dL during the 24 hours before discharge.
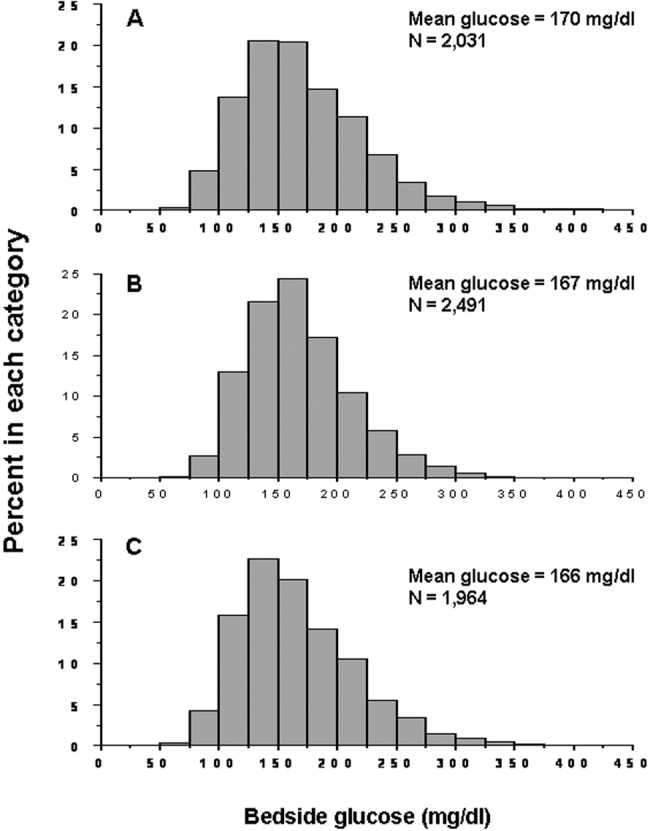
The incidence of hypoglycemic episodes was lower than that of hyperglycemic episodes: 21% of patients had at least 1 bedside glucose value less than 70 mg/dL, but 68% had at least 1 value greater than 200 mg/dL. The frequency of hypoglycemic measurements was low (Fig. 2A) compared with the frequency of hyperglycemic episodes (Fig. 2B).
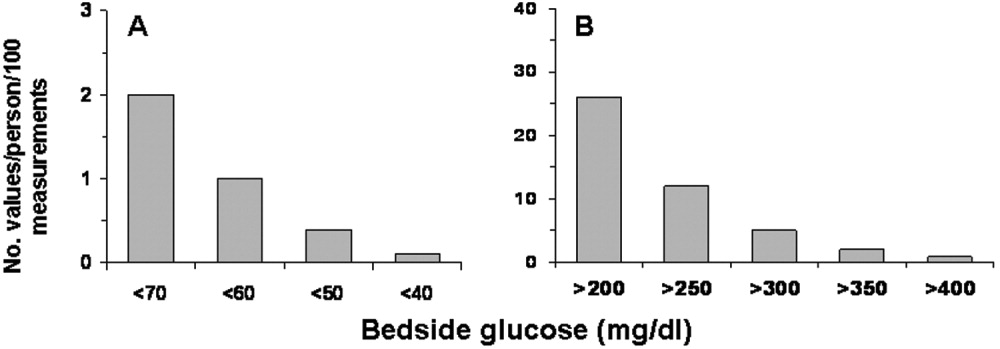
Hyperglycemia Therapy
Most patients (72%) received subcutaneous insulin at some point during their hospital stay; 19% had no therapy, 9% had oral agents only, 26% had oral agents plus insulin, and 46% had insulin only. The proportion receiving no therapy decreased from 32% among patients whose BedGlucavg was in the first tertile to 2% in the third tertile; the percentage of patients taking oral agents only decreased from 18% to 1%; the proportion taking oral agents plus insulin was 17% in the first tertile and 30% in the third; and the proportion of those taking insulin only was 32% in the first tertile and 66% in the third (Fig. 3). Thus, nearly all patients whose BedGlucavg value was in the third tertile received insulin, either as monotherapy or in combination with oral agents.
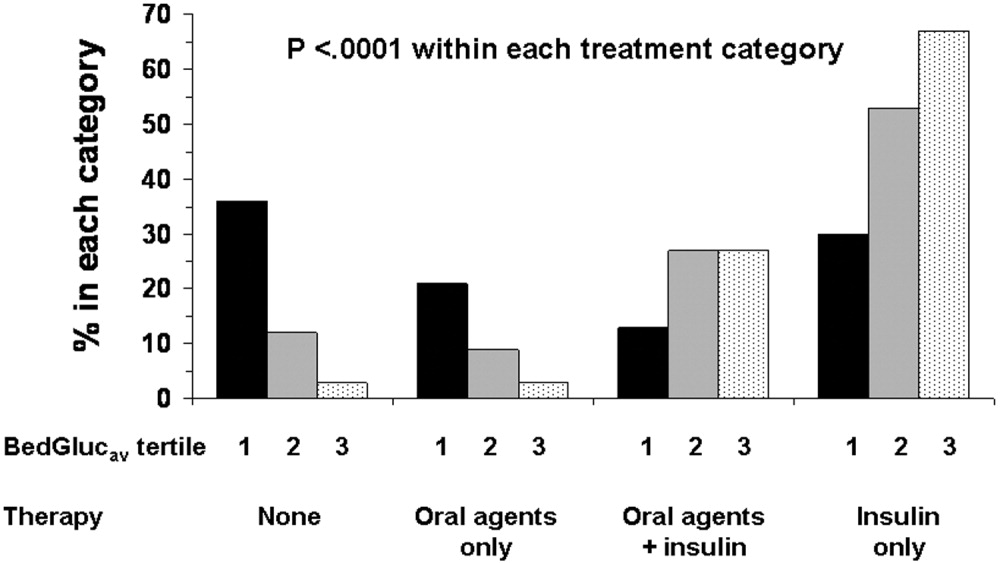
Among insulin users, 58% received bolus‐only, 42% received basal‐bolus, and 1% received basal‐only injections. Because of the small proportion of basal‐only patients, we conducted analyses only of patients whose insulin treatment fell into 1 of the first 2 categories. The use of a basal‐bolus insulin program increased from 34% in patients whose BedGlucavg was in the first tertile to 54% for those who had BedGlucavg in the third tertile (P < .001; Fig. 4, left). Thus, although there was a greater transition to a more intensive insulin regimen with worsening hyperglycemia, a substantial number of patients (46%) whose BedGlucavg was in the third tertile still did not have their insulin regimen intensified to a basal‐bolus program.
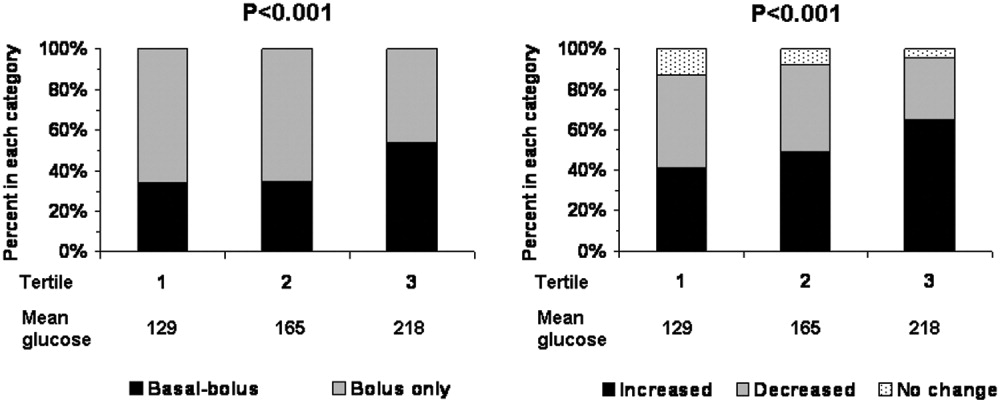
Fifty‐four percent of subcutaneous insulin users (N = 1680) had an increase in the amount of insulin administered between the first and last 24 hours of hospitalization (average increase, 17 U), 39% had a decrease (average decrease, 12 U), and 7% had no change. With rising hyperglycemia, more patients had their insulin increased by the time of discharge; 41% of persons who had BedGlucavg values in the first tertile were on more insulin by the time of discharge, whereas 65% of those who had average glucose values in the third tertile had insulin increased (Fig. 4, right). However, the pattern of changes in the amount of administered insulin was heterogeneous, with increases, decreases, and no change occurring in all tertiles of BedGlucavg (Fig. 3, right). Nearly 31% of patients whose BedGlucavg values were in the third tertile actually had a decrease in insulin. This decrease occurred despite evidence of a low frequency of hypoglycemia (only 1.2 values < 70 mg/dL per 100 measurements per person) and a high frequency of hyperglycemia (55.4 values > 200 mg/dL per person per 100 measurements).
DISCUSSION
The number of diabetes‐associated hospital discharges has been climbing2, 3; our own data indicate an increase in the number of patients with diabetes as a proportion of the total number of discharged patients. A recent consensus advocates good glucose control in the hospital to optimize outcomes,79 and institutions need to begin the process of assessing their quality of inpatient hyperglycemia management as a first step to enhancing care.
There are no guidelines about which method of glucose measurement (ie, blood glucose or bedside glucose) should be used as the quality measure to evaluate glycemic control in hospital patients. Both blood and bedside glucose measurements have been used in outcomes studies.23, 24 We analyzed capillary bedside values measured by a method subjected to ongoing quality control oversight and stored in the electronic laboratory database. Bedside glucose measurements are typically obtained with far greater frequency than blood glucose measurements and therefore provide better insight into daily changes in glycemic control; in practice, clinicians rely on bedside values when assessing hyperglycemia and making therapeutic decisions.
There is also no consensus about what glucose metric should be used to assess the status of glycemic control in the hospital. Some studies have used single glucose values to examine the relationship between hyperglycemia and outcomes,25, 26 whereas others have used values averaged over various lengths of time.24, 27 To evaluate glucose control, we averaged capillary measurements in the first 24 hours of hospitalization (F24BedGlucavg), the last 24 hours of hospitalization (L24BedGlucavg), and for the entire LOS (BedGlucavg), and we calculated the number of documented hyper‐ and hypoglycemic events. The measures we used to examine hyperglycemia would serve as useful benchmarks for following the progress of future institutional interventions directed at glucose control in hospitalized patients at our hospital.
A substantial number of our patients selected for analysis (ie, noncritically ill with LOS 3 days) were found to have sustained hyperglycemia at the beginning, during, and at the end of their hospital stay. We found very few instances of severe hypoglycemia (values < 50 or < 40 mg/dL), and the low frequency of hypoglycemia compared to that of hyperglycemia could encourage practitioners to be more aggressive in treating hyperglycemia. The high frequency of recorded bedside glucose compared with blood glucose measurements ( 3 per day), the ongoing patient surveillance by medical, nursing, and other staff members, and our institution's written hypoglycemia policy most likely minimize the number of unobserved, undocumented, or untreated hypoglycemic episodes. There are no data or recommendations about what would be an acceptable number of hypoglycemic episodes in the hospital.
Very little is known about the therapeutic strategies being applied to hyperglycemia in the hospital. Our data show that subcutaneous insulin (either alone or in combination with oral agents) was used at some point during hospitalization for nearly three‐fourths of noncritically patients who were in the hospital for 3 days or longer. Moreover, as hyperglycemia worsened, use of oral hypoglycemic agents declined, there was a shift toward greater use of a scheduled basal‐bolus insulin program, and a greater proportion of patients had more insulin administered.
Although these latter findings are encouraging and suggest that practitioners are responding to the severity of hyperglycemia, further examination of the data suggests that a substantial number of patients in the highest glucose tertile did not have insulin therapy intensified. Nearly half our patients whose glucose values were in the highest tertile were treated with short‐acting insulin aloneprobably an ineffective regimen23, 28or did not have more insulin administered. The higher doses administered were not likely solely a result of using more sliding‐scale insulin, as previous investigators actually found no correlation between intensity of the sliding scale and total daily insulin dose.14 Although evidence here is circumstantial (we did not examine changes in provider orders in response to glucose levels), these findings, together with those in our previous study15 and in another study,14 provide indirect evidence of clinical inertia in the hospital.
Beyond clinical inertia, however, there was evidence of negative therapeutic momentum: nearly one‐third of patients whose glucose was in the highest tertile had insulin decreased rather than increased, despite the low frequency of hypoglycemia and the high frequency of hyperglycemia. It is likely that even a single episode of hypoglycemia concerned practitioners, but the clinical response in these situations should be to investigate and correct the circumstances leading to the hypoglycemia, rather than to necessarily deintensify therapy in the face of continued hyperglycemia. The analysis of this larger data set corroborated our observations of clinical inertia and negative therapeutic momentum from an earlier study of chart reviews of a smaller patient sample.15
The variable application of insulin therapy to the treatment of hyperglycemia may be an indication of the level of comfort practitioners have about using this pharmacologic agent. A recently completed survey of resident physicians at our institution indicated that understanding how to use insulin was the most common barrier to successful management of inpatient hyperglycemia.29 These observations reinforce the need for institutions to develop standardized insulin order sets and develop programs to educate the staff on the use of insulin.
This study differs from our original analysis based on chart review in 4 ways. First, the sample size in our first study (n = 90) was small and derived from discharges from a single year (2003), whereas the sample in the present study spanned several years and included several thousand cases. Second, in our prior study we did not have detailed pharmacologic data on glucose management and how treatment approaches varied relative to severity of hyperglycemia. In general, there is very limited data on what therapeutic strategies are being applied to inpatient hyperglycemia, and this analysis of a large sample of cases provides more insight into how practitioners are managing glucose.
Third, we wanted to corroborate observations made in our previous report using a different methodologyin this instance, adapting existing information systems to assessment of inpatient diabetes care. For example, our last study was based on a limited number of glucose observations but suggested that the prevalence of hypoglycemia in our hospital was low compared with that of hyperglycemia; the present analysis of a very large number of glucose values confirmed these initial findings. In addition, use of information systems versus a chart review approach to assessing inpatient diabetes care corroborates our earlier suspicions about the presence of clinical inertia and negative therapeutic momentum in glucose management.
Fourth and finally, this study gave us experience with use of electronic records as a means to assess the status of inpatient diabetes care. Electronic data sources will likely be common tools to monitor quality of inpatient diabetes care and will likely figure prominently in future accreditation processes.10, 11 Unlike chart abstraction, which would require extensive man‐hours to extract data on few patients, use of electronic records allows examination of large numbers of hospital cases. Queries of information systems could be automated, and report cards potentially generated and feedback given to providers on the status of inpatient glycemic control. The industry is actively pursuing software development to assist hospitals in assessing the quality of inpatient glycemic control (eg, RALS‐TGCM, available at
However, there are also limitations to using electronic records as the sole method of assessing inpatient diabetes care. For instance, retrospective review of electronic records does not allow assessment of reasons underlying decision‐making behavior of clinicians (eg, why they did or did not change therapy). Diabetes and hyperglycemia associated hospitalizations must be identified by discharge diagnosis codes, so some cases of diabetes and hyperglycemia were likely missed.30, 31 Recent guidelines propose preprandial targets for glucose in the hospital.8 It is not easy to determine from an electronic data source which is a preprandial bedside glucose and which is a postprandial bedside glucose. Pre‐ and postpyramidal glucose categories would be difficult to define even during prospective studies, given the varying nature of nutritional support (ie, enteral, parenteral) used in the hospital and the administration of continuous dextrose infusions. Some type of quality control, such as conducting reviews of small samples of randomly selected charts to see how they compare with the electronic data, will need to be conducted.
From electronic discharge data, we cannot establish who had preexisting diabetes, who was admitted with new‐onset diabetes, and who developed hyperglycemia as a result of the hospital stay. Our previous random chart review15 indicated it is likely that most (more than 90%) had an established diagnosis of diabetes before admission. However, the recommendation to treat hyperglycemia should apply to all patients regardless of whether they had diagnosed diabetes prior to hospitalization or manifested hyperglycemia only during the hospital stay.79
As hospitals move toward making efforts to improve performance related to treating inpatient hyperglycemia, they must be cognizant of the heterogeneity of the inpatient population and the challenges to managing hospital hyperglycemia before drawing conclusions about their management. Inpatients with hyperglycemia are a diverse group, comprising patients with preexisting diabetes, with previously undiagnosed diabetes, and stress‐caused hyperglycemia. The unpredictable timing of procedures, various and changing forms of nutritional support, and different levels of staff expertise all contribute to the challenges of managing inpatient hyperglycemia. Inpatient practitioners may be forced to attempt glycemic control catch‐up for hospitalized persons who had poor outpatient glucose control. Patients who have required a stay in the intensive care unit may have very different glycemic outcomes than those who have not. Patients whose LOS was short (< 3days) may have different glycemic outcomes than persons whose LOS was longer ( 3 days as defined here) because of the length of time practitioners have to work to control their hyperglycemia. These and other variables may have to be taken into account when developing and assessing the impact of interventions.
Despite these limitations, our analysis was helpful in providing direction for enhancing the care of hospitalized patients with hyperglycemia in our facility. For instance, our generalists and surgeons are the principal caretakers of noncritically ill patients with diabetes, and these practitioners could be targeted for the first continuing educational programs about inpatient care of hyperglycemia. In addition, institutional guidelines on when and how to initiate and change therapyparticularly insulincan be designed so that hyperglycemia in noncritically ill hospital patients can be managed more effectively. These and other ongoing educational initiatives are necessary to ensure delivery of the highest quality of inpatient glucose care.
- ,,,.Hospitalization in the United States,1997.Rockville, MD:Agency for Healthcare Research and Quality;2000. Report No.: HCUP Fact Book No. 1; AHRQ Publication No. 00‐0031.
- Hospitalization for Diabetes as First‐Listed Diagnosis. Available at: http://www.cdc.gov/diabetes/statistics/dmfirst/index.htm. Accessed November 29,2006.
- Hospitalizations for Diabetes as Any‐Listed Diagnosis. Available at: http://www.cdc.gov/diabetes/statistics/dmany/index.htm. Accessed November 29,2006,
- ,,,.Multiple hospitalizations for patients with diabetes.Diabetes Care.2003;26:1421–1426.
- ,,.Economic costs of diabetes in the US in 2002.Diabetes Care.2003;26:917–932.
- ,,.Inpatient diabetology. The new frontier.J Gen Intern Med.2004;19:466–471.
- ,,, et al.American Diabetes Association Diabetes in Hospitals Writing Committee: Management of diabetes and hyperglycemia in hospitals.Diabetes Care.2004;27:553–591.
- ACE Task Force on Inpatient Diabetes and Metabolic Control.American College of Endocrinology position statement on inpatient diabetes and metabolic control.Endocr Pract,2004;10:77–82.
- ACE/ADA Task Force on Inpatient Diabetes.American College of Endocrinology and American Diabetes Association consensus statement on inpatient diabetes and glycemic control.Endocr Pract.2006;12:459–468.
- Getting started kit: prevent surgical site infections.2006 Available at: www.ihi.org/NR/rdonlyres/00EBAF1F‐A29F‐4822‐ABCE‐829573255AB8/0/SSIHowtoGuideFINAL.pdf. Accessed November 29,year="2006"2006.
- Joint Commission on Accreditation of Healthcare Organizations. American Diabetes Association and Joint Commission Collaborate on Joint Commission Inpatient Diabetes Care Certification.2006. Available at: http://www.jointcommission.org/NewsRoom/NewsReleases/jc_nr_072006.htm. Accessed November 29,year="2006"2006,
- ,.Glycemic chaos (not glycemic control) still the rule for inpatient care: How do we stop the insanity?J Hosp Med.2006;1:141–144.
- ,,,,.Unrecognized diabetes among hospitalized patients.Diabetes Care.1998;21(2):246–249.
- ,,,,.Inpatient management of diabetes and hyperglycemia among general medicine patients at a large teaching hospital.J Hosp Med.2006;1(3):145–150.
- ,,, et al.Diabetes care in the non‐ICU setting: is there clinical inertia in the hospital?J Hosp Med,2006;1(3):151–160.
- ,,, et al.Diabetes in urban African‐Americans. XVI. Overcoming clinical inertia improves glycemic control in patients with type 2 diabetes.Diabetes Care.1999;22:1494–500.
- ,,, et al.Clinical Inertia.Ann Intern Med.2001;135:825–834.
- ,,,Team UHCUDBP.Quality of diabetes care in U.S. academic medical centers: low rates of medical regimen change.Diabetes Care.2005;28:337–442.
- ,,, et al.Clinical inertia in the management of type 2 diabetes metabolic risk factors.Diabet Med,2004;21:150–155.
- ,.Clinical inertia: errors of omission in drug therapy.Am J Health Syst Pharm.2004;61:401–404.
- .Overcome clinical inertia to control systolic blood pressure.Arch Intern Med,2003;163:2677–2678.
- ,,,,.Clinical inertia in response to inadequate glycemic control: do specialists differ from primary care physicians?Diabetes Care.2005;28:600–606.
- ,,.Glycemic Control and Sliding Scale Insulin Use in Medical Inpatients With Diabetes Mellitus.Arch Intern Med.1997;157:545–552.
- ,,.Effect of hyperglycemia and continuous intraveneous insulin infusions on outcomes of cardiac surgical procedures: the Portland Diabetic Project.Endocr Pract.2004;10(2):21–33.
- ,,, et al.Plasma glucose at hospital admission and previous metabolic control determine myocardial infarct size and survival in patients with and without type 2 diabetes: the Langendreer Myocardial Infarction and Blood Glucose in Diabetic Patients Assessment (LAMBDA).Diabetes Care.2005;28:2551–2553.
- ,,.Admission hyperglycemia as a prognostic indicator in trauma.J Trauma Inj Infect Crit Care.2003;55(1):33–38.
- ,,, et al.Intraoperative hyperglycemia and perioperative outcomes in cardiac surgery patients.Mayo Clin Proc.2005;80:862–866.
- ,,,,.Efficacy of sliding‐scale insulin therapy: a comparison with prospective regimens.Fam Pract Res J.1994;14:313–22.
- ,,, et al.Management of inpatient hyperglycemia: assessing perceptions and barriers to care among resident physicians.Endocr Pract., to appear.
- ,,,,.Diabetes‐related hospitalization and hospital utilization. In:Diabetes in America.Bethesda, MD:National Institutes of Diabetes and Digestive Diseases;1995:553–563.
- ,,, et al.Hospital discharge records under‐report the prevalence of diabetes in inpatients.Diabetes Res Clin Pract.2003;59(2):145–151.
Diabetes confers a substantial burden on the hospital system. Diabetes is the fourth‐leading comorbid condition associated with any hospital discharge in the United States1. During 2001, for more than 500,000 patients discharged from U.S. hospitals diabetes was listed as the principal diagnosis and for more than 4 million it was listed as a codiagnosis.2, 3 Nearly one‐third of diabetes patients require at least 2 hospitalizations annually,4 and inpatient stays account for the largest proportion of direct medical expenses incurred by persons with the disease.5
Numerous studies have demonstrated that hyperglycemia is associated with adverse outcomes of hospitalized patients.68 However, studies have also confirmed that attention to lowering glucose levels in the hospital improves patient outcomes.7, 8 Although inpatients with known diabetes will likely constitute the largest and most visible percentage of those who will require treatment for high glucose, the recommendation to control glucose applies to all inpatients regardless of whether they have been diagnosed with diabetes prior to hospitalization or have manifested hyperglycemia only during the hospital stay.79
Now that the relationship between hyperglycemia and hospital outcomes is well established, the task of organizations that deliver care and set policy is to translate current recommendations of good glucose control into real‐world hospital settings. Quality improvement organizations are currently working toward developing and disseminating performance measures for control of inpatient hyperglycemia.10, 11 Although management of hospital hyperglycemia is often perceived as suboptimal,12 actual data are limited and are based on review of small numbers of charts,1315 and information is even sparser on the pharmacologic strategies being used to treat inpatient hyperglycemia. Before educational programs and policies can be developed, individual hospital systems need to gain more insight into how hyperglycemia is being managed in the hospital.
We reported previously the results of a review of a small number of charts (n = 90) of patients hospitalized with diabetes. The findings from this review suggested there was clinical inertia in glycemia management in the hospital.15 Clinical inertia was originally described in relationship to diabetes care in the outpatient setting and was defined as a failure to perform a needed service or make a change in treatment when indicated.16, 17 Since the original description, additional reports have documented the problem of clinical inertia, but these have all been based on experiences in the outpatient setting.1822 To our knowledge, our previous report was the first to question whether clinical inertia occurred in the hospital environment. In addition, we described the negative therapeutic momentuma deintensification of treatment despite ongoing hyperglycemia15. However, our prior study examined only a small number of cases and did not include detailed data on pharmacologic treatment for hyperglycemia. Therefore, we expanded our analysis using an information systems rather than a chart reviewbased methodology to assess the status of hyperglycemia management in our hospital.
METHODS
Setting
Our tertiary‐care academic teaching hospital is a 200‐bed facility in metropolitan Phoenix, Arizona. All adult general medical and surgical specialties are represented, including transplantation services; the hospital also has a level 2 trauma center and an inpatient rehabilitation unit. Care is provided by various types of practitioners, including postgraduate trainees, faculty, physician assistants, and nurse‐practitioners. An electronic medical record links outpatient and inpatient records with laboratory results and pharmacy orders. The core electronic health record system is the Centricity/LastWord platform, provided by GE/IDX. The ancillary core systems, including laboratory and pharmacy, are interfaced with the Centricity system and maintained by on‐site Mayo Clinic information technology professionals.
Case Selection
Patients discharged with an International Classification of Diseases, 9th Revision, Clinical Modification (ICD‐9‐CM) diagnosis code for diabetes (ICD‐9‐CM code 250.xx) or hyperglycemia (ICD‐9‐CM code 790.6) were identified in a search of the hospital's electronic billing records.24 Our facility does not provide obstetric or pediatric services; therefore, corresponding ICD‐9‐CM codes for those populations were not included. Both primary and nonprimary diagnostic fields were searched. Discharges were extracted for the period between January 1, 2001, and December 31, 2004. Data retrieved included patient age, ethnicity/race, length of stay (LOS), and type of hospital service with primary responsibility for the patient's care. For confidentiality reasons, individual patients were not identified, and the unit of analysis was the discharge.
Our analyses focused principally on the noncritically ill, defined as those patients who did not require a stay in our intensive or intermediate care units; critically ill patients were identified based on room location in the data set and excluded. The reasons this study assessed hyperglycemia management in the noncritically ill were 2‐fold. First, the critically ill may migrate in and out of intensive care depending on their health status and thus experience different intensities of glucose management. Second, in our facility the therapeutic approach to hyperglycemia management is different for the critically ill than for the noncritically ill; the critically ill may receive intravenous and/or subcutaneous insulin, whereas subcutaneous insulin therapy only is given to the noncritically ill. Thus, the noncritically ill represent a more clearly defined patient population whose therapies would be easier to evaluate. We also restricted the final analysis to patients who had a LOS of 3 days or less, so that differences in glucose control and insulin therapy between the first and last 24 hours of hospital stay could be assessed.
Data on 30 randomly chosen patients from different years was extracted from electronic records. A spreadsheet of the data was compared against data in our online electronic medical records. The online data were printed, and packets were made of the data for each patient selected for review. The patient demographic information was validated against our registration screen. Inpatient stay was validated to verify a patient was in intensive or intermediate care. The result of each glucose test performed while the patient was in the hospital was printed and the calculations validated. The insulin given while the patient was hospitalized was also printed and reviewed to verify the type of insulin and calculations for the amounts of insulin given.
Assessment of Glycemic Control
After extraction of hospital cases, data were linked via patient identifiers to our electronic laboratory database to retrieve information on glucose values. Glucose data included both blood and bedside measurements. In our institution, bedside glucose monitoring is performed with an instrument that scans and records patient identification, followed by direct downloading to our laboratory database. Commercial software (Medical Automation Systems, Charlottesville, VA) facilitates the interfacing of glucometer data with the electronic laboratory file.
Nearly all hospitalized patients had either bedside glucose (84%) or blood glucose (86%) data available for analysis. However, the mean number of bedside glucose measurements was 3.4 per day, whereas the average number of blood glucose measurements was only 1.0 per day. Because of the greater number of bedside measurements and because practitioners typically make therapeutic decisions about hyperglycemia management on the basis of daily bedside glucose results, these values were used to assess glycemic control of patients in the hospital discharge data.15
To assess glycemic control, we used methods similar to those previously published by ourselves and others.15, 23 We averaged each patient's available bedside glucose measurements to determine the composite average (BedGlucavg). We also computed the average of bedside glucose measurements obtained during the first 24 hours after admission (F24BedGlucavg) and during the last 24 hours before discharge (L24BedGlucavg), then examined the distributions of BedGlucavg, F24BedGlucavg, and L24BedGlucavg. The first 24‐hour period was calculated forward from the recorded time of admission, and the last 24‐hour period was calculated backward from the time of discharge. We calculated the frequency that each patient's bedside measurements showed hypoglycemia (bedside glucose < 70, < 60, < 50, or < 40 mg/dL) and showed hyperglycemia (bedside glucose >2 00, > 250, > 300, > 350, or > 400 mg/dL). Results were recorded as the number of values per 100 measurements per person; this method allowed adjustment for variation in the individual number of measurements and captured information on multiple episodes of hypo‐ or hyperglycemia of individual patients.15, 23
Hyperglycemia Therapy
Links to our inpatient pharmacy database enabled determination of types of pharmacotherapy actually administered to patients to treat hyperglycemia. Our electronic pharmacy records are designed so that intravenous medications (eg, intravenous insulin), scheduled oral and subcutaneous medications (eg, subcutaneous insulin), and medications administered on a one‐time or as‐needed basis (eg, sliding‐scale insulin) are documented electronically as separate categories. In our facility, intravenous insulin is administered only in the intensive care setting or as a component of total parenteral nutrition, and we excluded intravenous insulin use from this data. Thus, our analysis of insulin therapy focused only on elucidating patterns of subcutaneous treatment.
We classified hyperglycemia treatment as no therapy, oral agents only, oral agents plus insulin, and insulin only. Patients were regarded as having received an oral agent or insulin if they were administered the medication at any time during their inpatient stay. For management of hyperglycemia in noncritically ill patients, the use of a programmed basal‐bolus insulin program is advocated rather than the use of only a short‐acting bolus or sliding‐scale regimen.7, 8 Therefore, we further examined the insulin treatment strategies by classifying the type of regimen as basal only (if only an extended‐release preparation was used), as basal bolus (if the therapy consisted of a long‐acting plus a short‐acting formulation), or as bolus only (if the only insulin administered was a short‐acting preparation).
In addition to characterizing the general therapeutic approaches to hyperglycemia, we determined changes in the amount of insulin administered according to the severity of the hyperglycemia. Among patients who received insulin, we compared the average total units of insulin used during the last 24 hours before discharge with the amount administered during the first 24 hours of hospitalization. If more units were used during the last 24 hours than in the first 24 hours, the amount of insulin administered was categorized as having increased; if fewer units were provided during the last 24 hours, then the insulin amount was classified as having decreased; otherwise, no change was considered to have occurred. The BedGlucavg values were divided into 3 intervals using tertile cut points, and the differences in the proportion of patients by each type of insulin treatment regimen and the categories of insulin change were compared across tertiles; differences in proportions were determined using the 2 statistic.
RESULTS
Patient Characteristics
Between January 1, 2001, and December 31, 2004, a total of 7361 patients were discharged from our facility with either a diabetes or a hyperglycemia diagnosis (16% of all discharges); the percentage of discharges associated with these diagnoses increased from 14.9% in 2001 to 16.4% in 2004. Most patients with diabetes or hyperglycemia (5198 or 71%) received care outside the intensive‐ or intermediate‐care setting.
Among the noncritically ill patients whose LOS was at least 3 days (N = 2916), average age was 69 years, and average LOS was 5.7 days. Most of the discharged patients were men (57%), and 90% were white. Most patients were discharged from primary care (45%; general internal medicine or family medicine) or surgical services (34%), with the rest discharged from other specialties (eg, cardiology, transplant medicine). Compared to the noncritically ill, who had an LOS of at least 3 days, those noncritically patients whose LOS was less than 3 days (n = 2282) were slightly younger (mean age 68 versus 69 years, P < .001 by Mann‐Whitney testing) but were comparable in sex and race distribution (P > .07 for both by chi‐square testing).
Glycemic Control
The median duration between admission and time of first bedside glucose measurement was 3.0 hours. Patients had an average of 19 bedside glucose measurements; the overall mean number of bedside measurements was 3.4 per day, 3.7 during the first 24‐hour period, and 3.4 during the last 24 hours of hospitalization. Nearly 25% of patients were hyperglycemic (bedside glucose > 200 mg/dL) during the first 24 hours of hospitalization (Fig. 1A), 20% had persistent hyperglycemia throughout the entire hospitalization (Fig. 1B), and 21% were hyperglycemic during the 24 hours before discharge (Fig. 1C), with some patients discharged with an average bedside glucose of at least 300 mg/dL during the 24 hours before discharge.
The incidence of hypoglycemic episodes was lower than that of hyperglycemic episodes: 21% of patients had at least 1 bedside glucose value less than 70 mg/dL, but 68% had at least 1 value greater than 200 mg/dL. The frequency of hypoglycemic measurements was low (Fig. 2A) compared with the frequency of hyperglycemic episodes (Fig. 2B).
Hyperglycemia Therapy
Most patients (72%) received subcutaneous insulin at some point during their hospital stay; 19% had no therapy, 9% had oral agents only, 26% had oral agents plus insulin, and 46% had insulin only. The proportion receiving no therapy decreased from 32% among patients whose BedGlucavg was in the first tertile to 2% in the third tertile; the percentage of patients taking oral agents only decreased from 18% to 1%; the proportion taking oral agents plus insulin was 17% in the first tertile and 30% in the third; and the proportion of those taking insulin only was 32% in the first tertile and 66% in the third (Fig. 3). Thus, nearly all patients whose BedGlucavg value was in the third tertile received insulin, either as monotherapy or in combination with oral agents.
Among insulin users, 58% received bolus‐only, 42% received basal‐bolus, and 1% received basal‐only injections. Because of the small proportion of basal‐only patients, we conducted analyses only of patients whose insulin treatment fell into 1 of the first 2 categories. The use of a basal‐bolus insulin program increased from 34% in patients whose BedGlucavg was in the first tertile to 54% for those who had BedGlucavg in the third tertile (P < .001; Fig. 4, left). Thus, although there was a greater transition to a more intensive insulin regimen with worsening hyperglycemia, a substantial number of patients (46%) whose BedGlucavg was in the third tertile still did not have their insulin regimen intensified to a basal‐bolus program.
Fifty‐four percent of subcutaneous insulin users (N = 1680) had an increase in the amount of insulin administered between the first and last 24 hours of hospitalization (average increase, 17 U), 39% had a decrease (average decrease, 12 U), and 7% had no change. With rising hyperglycemia, more patients had their insulin increased by the time of discharge; 41% of persons who had BedGlucavg values in the first tertile were on more insulin by the time of discharge, whereas 65% of those who had average glucose values in the third tertile had insulin increased (Fig. 4, right). However, the pattern of changes in the amount of administered insulin was heterogeneous, with increases, decreases, and no change occurring in all tertiles of BedGlucavg (Fig. 3, right). Nearly 31% of patients whose BedGlucavg values were in the third tertile actually had a decrease in insulin. This decrease occurred despite evidence of a low frequency of hypoglycemia (only 1.2 values < 70 mg/dL per 100 measurements per person) and a high frequency of hyperglycemia (55.4 values > 200 mg/dL per person per 100 measurements).
DISCUSSION
The number of diabetes‐associated hospital discharges has been climbing2, 3; our own data indicate an increase in the number of patients with diabetes as a proportion of the total number of discharged patients. A recent consensus advocates good glucose control in the hospital to optimize outcomes,79 and institutions need to begin the process of assessing their quality of inpatient hyperglycemia management as a first step to enhancing care.
There are no guidelines about which method of glucose measurement (ie, blood glucose or bedside glucose) should be used as the quality measure to evaluate glycemic control in hospital patients. Both blood and bedside glucose measurements have been used in outcomes studies.23, 24 We analyzed capillary bedside values measured by a method subjected to ongoing quality control oversight and stored in the electronic laboratory database. Bedside glucose measurements are typically obtained with far greater frequency than blood glucose measurements and therefore provide better insight into daily changes in glycemic control; in practice, clinicians rely on bedside values when assessing hyperglycemia and making therapeutic decisions.
There is also no consensus about what glucose metric should be used to assess the status of glycemic control in the hospital. Some studies have used single glucose values to examine the relationship between hyperglycemia and outcomes,25, 26 whereas others have used values averaged over various lengths of time.24, 27 To evaluate glucose control, we averaged capillary measurements in the first 24 hours of hospitalization (F24BedGlucavg), the last 24 hours of hospitalization (L24BedGlucavg), and for the entire LOS (BedGlucavg), and we calculated the number of documented hyper‐ and hypoglycemic events. The measures we used to examine hyperglycemia would serve as useful benchmarks for following the progress of future institutional interventions directed at glucose control in hospitalized patients at our hospital.
A substantial number of our patients selected for analysis (ie, noncritically ill with LOS 3 days) were found to have sustained hyperglycemia at the beginning, during, and at the end of their hospital stay. We found very few instances of severe hypoglycemia (values < 50 or < 40 mg/dL), and the low frequency of hypoglycemia compared to that of hyperglycemia could encourage practitioners to be more aggressive in treating hyperglycemia. The high frequency of recorded bedside glucose compared with blood glucose measurements ( 3 per day), the ongoing patient surveillance by medical, nursing, and other staff members, and our institution's written hypoglycemia policy most likely minimize the number of unobserved, undocumented, or untreated hypoglycemic episodes. There are no data or recommendations about what would be an acceptable number of hypoglycemic episodes in the hospital.
Very little is known about the therapeutic strategies being applied to hyperglycemia in the hospital. Our data show that subcutaneous insulin (either alone or in combination with oral agents) was used at some point during hospitalization for nearly three‐fourths of noncritically patients who were in the hospital for 3 days or longer. Moreover, as hyperglycemia worsened, use of oral hypoglycemic agents declined, there was a shift toward greater use of a scheduled basal‐bolus insulin program, and a greater proportion of patients had more insulin administered.
Although these latter findings are encouraging and suggest that practitioners are responding to the severity of hyperglycemia, further examination of the data suggests that a substantial number of patients in the highest glucose tertile did not have insulin therapy intensified. Nearly half our patients whose glucose values were in the highest tertile were treated with short‐acting insulin aloneprobably an ineffective regimen23, 28or did not have more insulin administered. The higher doses administered were not likely solely a result of using more sliding‐scale insulin, as previous investigators actually found no correlation between intensity of the sliding scale and total daily insulin dose.14 Although evidence here is circumstantial (we did not examine changes in provider orders in response to glucose levels), these findings, together with those in our previous study15 and in another study,14 provide indirect evidence of clinical inertia in the hospital.
Beyond clinical inertia, however, there was evidence of negative therapeutic momentum: nearly one‐third of patients whose glucose was in the highest tertile had insulin decreased rather than increased, despite the low frequency of hypoglycemia and the high frequency of hyperglycemia. It is likely that even a single episode of hypoglycemia concerned practitioners, but the clinical response in these situations should be to investigate and correct the circumstances leading to the hypoglycemia, rather than to necessarily deintensify therapy in the face of continued hyperglycemia. The analysis of this larger data set corroborated our observations of clinical inertia and negative therapeutic momentum from an earlier study of chart reviews of a smaller patient sample.15
The variable application of insulin therapy to the treatment of hyperglycemia may be an indication of the level of comfort practitioners have about using this pharmacologic agent. A recently completed survey of resident physicians at our institution indicated that understanding how to use insulin was the most common barrier to successful management of inpatient hyperglycemia.29 These observations reinforce the need for institutions to develop standardized insulin order sets and develop programs to educate the staff on the use of insulin.
This study differs from our original analysis based on chart review in 4 ways. First, the sample size in our first study (n = 90) was small and derived from discharges from a single year (2003), whereas the sample in the present study spanned several years and included several thousand cases. Second, in our prior study we did not have detailed pharmacologic data on glucose management and how treatment approaches varied relative to severity of hyperglycemia. In general, there is very limited data on what therapeutic strategies are being applied to inpatient hyperglycemia, and this analysis of a large sample of cases provides more insight into how practitioners are managing glucose.
Third, we wanted to corroborate observations made in our previous report using a different methodologyin this instance, adapting existing information systems to assessment of inpatient diabetes care. For example, our last study was based on a limited number of glucose observations but suggested that the prevalence of hypoglycemia in our hospital was low compared with that of hyperglycemia; the present analysis of a very large number of glucose values confirmed these initial findings. In addition, use of information systems versus a chart review approach to assessing inpatient diabetes care corroborates our earlier suspicions about the presence of clinical inertia and negative therapeutic momentum in glucose management.
Fourth and finally, this study gave us experience with use of electronic records as a means to assess the status of inpatient diabetes care. Electronic data sources will likely be common tools to monitor quality of inpatient diabetes care and will likely figure prominently in future accreditation processes.10, 11 Unlike chart abstraction, which would require extensive man‐hours to extract data on few patients, use of electronic records allows examination of large numbers of hospital cases. Queries of information systems could be automated, and report cards potentially generated and feedback given to providers on the status of inpatient glycemic control. The industry is actively pursuing software development to assist hospitals in assessing the quality of inpatient glycemic control (eg, RALS‐TGCM, available at
However, there are also limitations to using electronic records as the sole method of assessing inpatient diabetes care. For instance, retrospective review of electronic records does not allow assessment of reasons underlying decision‐making behavior of clinicians (eg, why they did or did not change therapy). Diabetes and hyperglycemia associated hospitalizations must be identified by discharge diagnosis codes, so some cases of diabetes and hyperglycemia were likely missed.30, 31 Recent guidelines propose preprandial targets for glucose in the hospital.8 It is not easy to determine from an electronic data source which is a preprandial bedside glucose and which is a postprandial bedside glucose. Pre‐ and postpyramidal glucose categories would be difficult to define even during prospective studies, given the varying nature of nutritional support (ie, enteral, parenteral) used in the hospital and the administration of continuous dextrose infusions. Some type of quality control, such as conducting reviews of small samples of randomly selected charts to see how they compare with the electronic data, will need to be conducted.
From electronic discharge data, we cannot establish who had preexisting diabetes, who was admitted with new‐onset diabetes, and who developed hyperglycemia as a result of the hospital stay. Our previous random chart review15 indicated it is likely that most (more than 90%) had an established diagnosis of diabetes before admission. However, the recommendation to treat hyperglycemia should apply to all patients regardless of whether they had diagnosed diabetes prior to hospitalization or manifested hyperglycemia only during the hospital stay.79
As hospitals move toward making efforts to improve performance related to treating inpatient hyperglycemia, they must be cognizant of the heterogeneity of the inpatient population and the challenges to managing hospital hyperglycemia before drawing conclusions about their management. Inpatients with hyperglycemia are a diverse group, comprising patients with preexisting diabetes, with previously undiagnosed diabetes, and stress‐caused hyperglycemia. The unpredictable timing of procedures, various and changing forms of nutritional support, and different levels of staff expertise all contribute to the challenges of managing inpatient hyperglycemia. Inpatient practitioners may be forced to attempt glycemic control catch‐up for hospitalized persons who had poor outpatient glucose control. Patients who have required a stay in the intensive care unit may have very different glycemic outcomes than those who have not. Patients whose LOS was short (< 3days) may have different glycemic outcomes than persons whose LOS was longer ( 3 days as defined here) because of the length of time practitioners have to work to control their hyperglycemia. These and other variables may have to be taken into account when developing and assessing the impact of interventions.
Despite these limitations, our analysis was helpful in providing direction for enhancing the care of hospitalized patients with hyperglycemia in our facility. For instance, our generalists and surgeons are the principal caretakers of noncritically ill patients with diabetes, and these practitioners could be targeted for the first continuing educational programs about inpatient care of hyperglycemia. In addition, institutional guidelines on when and how to initiate and change therapyparticularly insulincan be designed so that hyperglycemia in noncritically ill hospital patients can be managed more effectively. These and other ongoing educational initiatives are necessary to ensure delivery of the highest quality of inpatient glucose care.
- ,,,.Hospitalization in the United States,1997.Rockville, MD:Agency for Healthcare Research and Quality;2000. Report No.: HCUP Fact Book No. 1; AHRQ Publication No. 00‐0031.
- Hospitalization for Diabetes as First‐Listed Diagnosis. Available at: http://www.cdc.gov/diabetes/statistics/dmfirst/index.htm. Accessed November 29,2006.
- Hospitalizations for Diabetes as Any‐Listed Diagnosis. Available at: http://www.cdc.gov/diabetes/statistics/dmany/index.htm. Accessed November 29,2006,
- ,,,.Multiple hospitalizations for patients with diabetes.Diabetes Care.2003;26:1421–1426.
- ,,.Economic costs of diabetes in the US in 2002.Diabetes Care.2003;26:917–932.
- ,,.Inpatient diabetology. The new frontier.J Gen Intern Med.2004;19:466–471.
- ,,, et al.American Diabetes Association Diabetes in Hospitals Writing Committee: Management of diabetes and hyperglycemia in hospitals.Diabetes Care.2004;27:553–591.
- ACE Task Force on Inpatient Diabetes and Metabolic Control.American College of Endocrinology position statement on inpatient diabetes and metabolic control.Endocr Pract,2004;10:77–82.
- ACE/ADA Task Force on Inpatient Diabetes.American College of Endocrinology and American Diabetes Association consensus statement on inpatient diabetes and glycemic control.Endocr Pract.2006;12:459–468.
- Getting started kit: prevent surgical site infections.2006 Available at: www.ihi.org/NR/rdonlyres/00EBAF1F‐A29F‐4822‐ABCE‐829573255AB8/0/SSIHowtoGuideFINAL.pdf. Accessed November 29,year="2006"2006.
- Joint Commission on Accreditation of Healthcare Organizations. American Diabetes Association and Joint Commission Collaborate on Joint Commission Inpatient Diabetes Care Certification.2006. Available at: http://www.jointcommission.org/NewsRoom/NewsReleases/jc_nr_072006.htm. Accessed November 29,year="2006"2006,
- ,.Glycemic chaos (not glycemic control) still the rule for inpatient care: How do we stop the insanity?J Hosp Med.2006;1:141–144.
- ,,,,.Unrecognized diabetes among hospitalized patients.Diabetes Care.1998;21(2):246–249.
- ,,,,.Inpatient management of diabetes and hyperglycemia among general medicine patients at a large teaching hospital.J Hosp Med.2006;1(3):145–150.
- ,,, et al.Diabetes care in the non‐ICU setting: is there clinical inertia in the hospital?J Hosp Med,2006;1(3):151–160.
- ,,, et al.Diabetes in urban African‐Americans. XVI. Overcoming clinical inertia improves glycemic control in patients with type 2 diabetes.Diabetes Care.1999;22:1494–500.
- ,,, et al.Clinical Inertia.Ann Intern Med.2001;135:825–834.
- ,,,Team UHCUDBP.Quality of diabetes care in U.S. academic medical centers: low rates of medical regimen change.Diabetes Care.2005;28:337–442.
- ,,, et al.Clinical inertia in the management of type 2 diabetes metabolic risk factors.Diabet Med,2004;21:150–155.
- ,.Clinical inertia: errors of omission in drug therapy.Am J Health Syst Pharm.2004;61:401–404.
- .Overcome clinical inertia to control systolic blood pressure.Arch Intern Med,2003;163:2677–2678.
- ,,,,.Clinical inertia in response to inadequate glycemic control: do specialists differ from primary care physicians?Diabetes Care.2005;28:600–606.
- ,,.Glycemic Control and Sliding Scale Insulin Use in Medical Inpatients With Diabetes Mellitus.Arch Intern Med.1997;157:545–552.
- ,,.Effect of hyperglycemia and continuous intraveneous insulin infusions on outcomes of cardiac surgical procedures: the Portland Diabetic Project.Endocr Pract.2004;10(2):21–33.
- ,,, et al.Plasma glucose at hospital admission and previous metabolic control determine myocardial infarct size and survival in patients with and without type 2 diabetes: the Langendreer Myocardial Infarction and Blood Glucose in Diabetic Patients Assessment (LAMBDA).Diabetes Care.2005;28:2551–2553.
- ,,.Admission hyperglycemia as a prognostic indicator in trauma.J Trauma Inj Infect Crit Care.2003;55(1):33–38.
- ,,, et al.Intraoperative hyperglycemia and perioperative outcomes in cardiac surgery patients.Mayo Clin Proc.2005;80:862–866.
- ,,,,.Efficacy of sliding‐scale insulin therapy: a comparison with prospective regimens.Fam Pract Res J.1994;14:313–22.
- ,,, et al.Management of inpatient hyperglycemia: assessing perceptions and barriers to care among resident physicians.Endocr Pract., to appear.
- ,,,,.Diabetes‐related hospitalization and hospital utilization. In:Diabetes in America.Bethesda, MD:National Institutes of Diabetes and Digestive Diseases;1995:553–563.
- ,,, et al.Hospital discharge records under‐report the prevalence of diabetes in inpatients.Diabetes Res Clin Pract.2003;59(2):145–151.
Copyright © 2007 Society of Hospital Medicine
