User login
Hospital Medicine Has a Specialty Code. Is the Memo Still in the Mail?
In recognizing the importance of Hospital Medicine (HM) and its practitioners, the Centers for Medicare and Medicaid Services (CMS) awarded the field a specialty designation in 2016. The code is self-selected by hospitalists and used by the CMS for programmatic and claims processing purposes. The HM code (“C6”), submitted to the CMS by the provider or their designee through the Provider Enrollment Chain and Ownership System (PECOS), in turn links to the National Provider Identification provider data.
The Society of Hospital Medicine® sought the designation given the growth of hospitalists practicing nationally, their impact on the practice of medicine in the inpatient setting,1 and their secondary effects on global care.2 In fact, early efforts by the CMS to transition physician payments to the value-based payment used specialty designations to create benchmarks in cost metrics, heightening the importance for hospitalists to be able to assess their performance. The need to identify any shifts in resource utilization and workforce mix in the broader context of health reforms necessitated action. Essentially, to understand the “why’s” of hospital medicine, the field required an accounting of the “who’s” and “where’s.”
The CMS granted the C6 designation in 2016, and it went live in April 2017. Despite the code’s brief two-year tenure, calls for its creation long predated its existence. As such, the new modifier requires an initial look to help steer the role of HM in any future CMS and managed care organization (MCO) quality, payment, or practice improvement activities.
METHODS
We analyzed publicly available 2017 Medicare Part B utilization data3 to explore the rates of Evaluation & Management (E&M) codes used across specialties, using the C6 designation to identify hospitalists.
To try to estimate the percentage of hospitalists who were likely billing under the C6 designation, we then compared the rates of C6 billing to expected rates of hospitalist E&M billing based on an analysis of hospitalist prevalence in the 2012 Medicare physician payment data. Prior work to identify hospitalists before the implementation of the C6 designation relied on thresholds of inpatient codes for various inpatient E&M services.4,5 We used our previously published approach of a threshold of 60% of inpatient E&M hospital services to differentiate hospitalists from their parent specialties.6 We also calculated the expected rates of E&M billing for other select specialty services by applying the 2012 E&M coding trends to the 2017 data.
RESULTS
Table 1 shows the distribution of inpatient E&M codes billed by hospitalists using the C6 identification, as well as the use of those codes by other specialists. Hospitalists identified by the C6 designation billed only 2%-5% of inpatient and 6% of observation codes. As an example, in 2017, discharge CPT codes 99238 and 99239 were used 7,872,323 times. However, C6-identified hospitalists accounted for only 441,420 of these codes.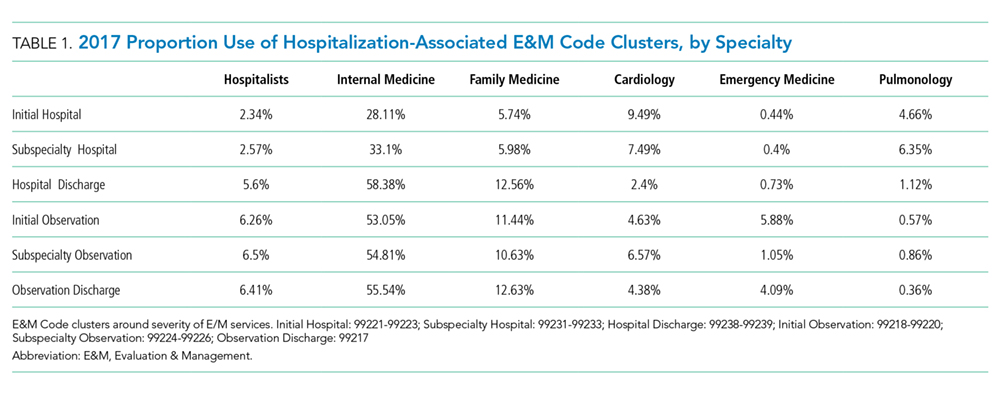
Table 2 compares the observed billing rates by specialty using the C6 designation to identify hospitalists with what would be the expected rates with the 2012 threshold-based specialty billing designation applied to the 2017 data. This comparison demonstrates that hospitalist billing based on the C6 modifier use is approximately one-tenth of what would have been their expected volume of E&M services.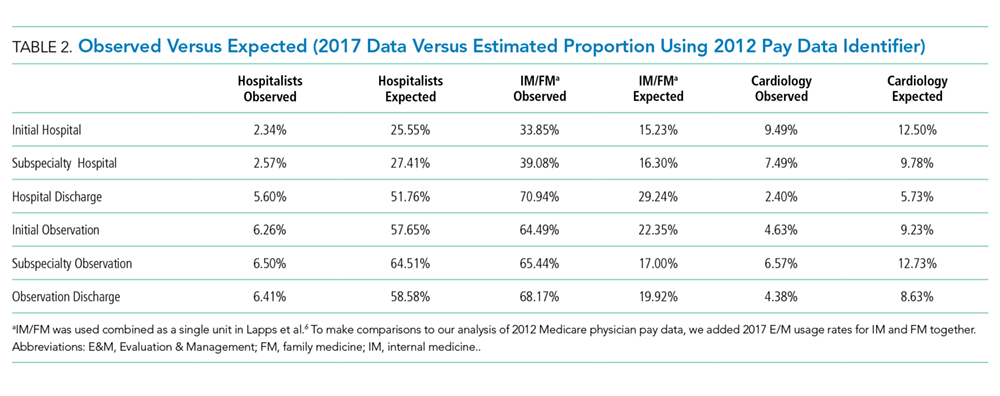
DISCUSSION
We examined the patterns of hospitalist billing using the C6 hospital medicine specialty modifier, comparing billing patterns with what we would expect hospitalist activity to be if we had used a threshold-based approach. The difference between the C6 and the threshold-based approaches to assessing hospitalist activity suggests that as few as 10% of hospitalists have adopted the C6 code.
Why is the adoption of the C6 modifier so low? Although administrative data do not allow us to identify the reasons why providers chose to disregard the C6 designation, we can speculate on causes. There are, to date, low direct risks and recognized benefits with using the code. We hypothesize that several factors could be impeding whether providers use the modifier to bring about potential gains. The first may be knowledge-related; ie, hospitalists might not be familiar with the specialty code or unaware of the importance of accurately capturing hospitalist practice patterns. They may also wrongly assume that their practices are aware of the revision or have submitted the appropriate paperwork. Similarly, practice personnel may lack knowledge regarding the code or the importance of its use. The second factor may be logistical; ie, administrative barriers such as difficulty accessing the Provider Enrollment, Chain and Ownership System (PECOS) and out-of-date paper registration forms impede fast uptake. The final reason might be related to professionals whose tenures as hospitalists will be brief, and their unease of carrying an identifier into their next non-HM position prompts hesitation. Providers may have a misperception that using the C6 code may somehow impact or limit their future scope of practice, when, in fact, they may change their Medicare specialty designation at any time.
Changes in reimbursement models, including the Bundled Payments for Care Improvement Advanced (BPCI-A) and other value-based initiatives, heighten the need for a more accurate identification of the specialty. Classifying individual providers and groups to make valid performance comparisons is relevant for the same reasons. The CMS continues to advance cost and efficiency measures in its publicly accessible physiciancompare.gov website.7 Without an improved ability to identify services provided by hospitalists—by both CMS and commercial entities—the potential benefits delivered by hospitalists in terms of improved care quality, safety, or efficiency could go undetected by payers and policymakers. Moreover, C6 may be used in other ways by the CMS throughout its payment systems and programmatic efforts that use specialty to differentiate between Medicare providers.8 Finally, the C6 is an identifier for the Medicare fee-for-service system; state programs and MCOs may not identify hospitalists in the same manner, or at all. Therefore, it may make it more difficult for those groups and HM researchers to study the trends in care delivery changes. The specialty needs to engage with these other payers to assist in revising their information systems to better account for how hospitalists care for their insured populations.
Although we would expect a natural increase in C6 adoption over time, optimally meeting stakeholders’ data needs requires more rapid uptake. Our analysis is limited by our assumption that specialty patterns of code use remain similar from 2012 to 2017. Regardless, the magnitude of the difference between the estimate of hospitalists using the C6 versus billing thresholds strongly suggests underuse of the C6 designation. The CMS and MCOs have an increasing need for valid and representative data, and C6 can be used to assess “HM-adjusted” resource utilization, relative value units (RVUs), and performance evaluations. Therefore, hospitalists may see more incentives to use the C6 specialty code in a manner consistent with other recognized subspecialties.
Disclaimer
The research reported here was supported by the Department of Veterans Affairs, Veterans Health Administration, and the Health Services Research and Development Service. The views expressed in this article are those of the authors and do not necessarily reflect the position or policy of the Department of Veterans Affairs.
1. Wachter RM, Goldman L. Zero to 50,000—The 20th Anniversary of the Hospitalist. N Engl J Med. 2016;375(11):1009-1011. https://doi.org/10.1056/NEJMp1607958.
2. Quinn R. HM 2016: A year in review. The Hospitalist. 2016;12. https://www.the-hospitalist.org/hospitalist/article/121419/everything-you-need-know-about-bundled-payments-care-improvement
3. Centers for Medicare and Medicaid Services. Medicare Utilization for Part B. https://www.cms.gov/research-statistics-data-and-systems/statistics-trends-and-reports/medicarefeeforsvcpartsab/medicareutilizationforpartb.html. Accessed June 14, 2019.
4. Saint S, Christakis DA, Baldwin L-M, Rosenblatt R. Is hospitalism new? An analysis of Medicare data from Washington State in 1994. Eff Clin Pract. 2000;3(1):35-39.
5. Welch WP, Stearns SC, Cuellar AE, Bindman AB. Use of hospitalists by Medicare beneficiaries: a national picture. Medicare Medicaid Res Rev. 2014;4(2). https://doi.org/10.5600/mmrr2014-004-02-b01.
6. Lapps J, Flansbaum B, Leykum L, Boswell J, Haines L. Updating threshold-based identification of hospitalists in 2012 medicare pay data. J Hosp Med. 2016;11(1):45-47. https://doi.org/10.1002/jhm.2480.
7. Centers for Medicare & Medicaid Services. Physician Compare Initiative. https://www.cms.gov/Medicare/Quality-Initiatives-Patient-Assessment-Instruments/physician-compare-initiative/index.html. Accessed June 14, 2019.
8. Centers for Medicare & Medicaid Services. Revisions to Payment Policies under the Medicare Physician Fee Schedule, Quality Payment Program and Other Revisions to Part B for CY 2020 (CMS-1715-P). Accessed prior to publishing in the Federal Register through www.regulations.gov.
In recognizing the importance of Hospital Medicine (HM) and its practitioners, the Centers for Medicare and Medicaid Services (CMS) awarded the field a specialty designation in 2016. The code is self-selected by hospitalists and used by the CMS for programmatic and claims processing purposes. The HM code (“C6”), submitted to the CMS by the provider or their designee through the Provider Enrollment Chain and Ownership System (PECOS), in turn links to the National Provider Identification provider data.
The Society of Hospital Medicine® sought the designation given the growth of hospitalists practicing nationally, their impact on the practice of medicine in the inpatient setting,1 and their secondary effects on global care.2 In fact, early efforts by the CMS to transition physician payments to the value-based payment used specialty designations to create benchmarks in cost metrics, heightening the importance for hospitalists to be able to assess their performance. The need to identify any shifts in resource utilization and workforce mix in the broader context of health reforms necessitated action. Essentially, to understand the “why’s” of hospital medicine, the field required an accounting of the “who’s” and “where’s.”
The CMS granted the C6 designation in 2016, and it went live in April 2017. Despite the code’s brief two-year tenure, calls for its creation long predated its existence. As such, the new modifier requires an initial look to help steer the role of HM in any future CMS and managed care organization (MCO) quality, payment, or practice improvement activities.
METHODS
We analyzed publicly available 2017 Medicare Part B utilization data3 to explore the rates of Evaluation & Management (E&M) codes used across specialties, using the C6 designation to identify hospitalists.
To try to estimate the percentage of hospitalists who were likely billing under the C6 designation, we then compared the rates of C6 billing to expected rates of hospitalist E&M billing based on an analysis of hospitalist prevalence in the 2012 Medicare physician payment data. Prior work to identify hospitalists before the implementation of the C6 designation relied on thresholds of inpatient codes for various inpatient E&M services.4,5 We used our previously published approach of a threshold of 60% of inpatient E&M hospital services to differentiate hospitalists from their parent specialties.6 We also calculated the expected rates of E&M billing for other select specialty services by applying the 2012 E&M coding trends to the 2017 data.
RESULTS
Table 1 shows the distribution of inpatient E&M codes billed by hospitalists using the C6 identification, as well as the use of those codes by other specialists. Hospitalists identified by the C6 designation billed only 2%-5% of inpatient and 6% of observation codes. As an example, in 2017, discharge CPT codes 99238 and 99239 were used 7,872,323 times. However, C6-identified hospitalists accounted for only 441,420 of these codes.
Table 2 compares the observed billing rates by specialty using the C6 designation to identify hospitalists with what would be the expected rates with the 2012 threshold-based specialty billing designation applied to the 2017 data. This comparison demonstrates that hospitalist billing based on the C6 modifier use is approximately one-tenth of what would have been their expected volume of E&M services.
DISCUSSION
We examined the patterns of hospitalist billing using the C6 hospital medicine specialty modifier, comparing billing patterns with what we would expect hospitalist activity to be if we had used a threshold-based approach. The difference between the C6 and the threshold-based approaches to assessing hospitalist activity suggests that as few as 10% of hospitalists have adopted the C6 code.
Why is the adoption of the C6 modifier so low? Although administrative data do not allow us to identify the reasons why providers chose to disregard the C6 designation, we can speculate on causes. There are, to date, low direct risks and recognized benefits with using the code. We hypothesize that several factors could be impeding whether providers use the modifier to bring about potential gains. The first may be knowledge-related; ie, hospitalists might not be familiar with the specialty code or unaware of the importance of accurately capturing hospitalist practice patterns. They may also wrongly assume that their practices are aware of the revision or have submitted the appropriate paperwork. Similarly, practice personnel may lack knowledge regarding the code or the importance of its use. The second factor may be logistical; ie, administrative barriers such as difficulty accessing the Provider Enrollment, Chain and Ownership System (PECOS) and out-of-date paper registration forms impede fast uptake. The final reason might be related to professionals whose tenures as hospitalists will be brief, and their unease of carrying an identifier into their next non-HM position prompts hesitation. Providers may have a misperception that using the C6 code may somehow impact or limit their future scope of practice, when, in fact, they may change their Medicare specialty designation at any time.
Changes in reimbursement models, including the Bundled Payments for Care Improvement Advanced (BPCI-A) and other value-based initiatives, heighten the need for a more accurate identification of the specialty. Classifying individual providers and groups to make valid performance comparisons is relevant for the same reasons. The CMS continues to advance cost and efficiency measures in its publicly accessible physiciancompare.gov website.7 Without an improved ability to identify services provided by hospitalists—by both CMS and commercial entities—the potential benefits delivered by hospitalists in terms of improved care quality, safety, or efficiency could go undetected by payers and policymakers. Moreover, C6 may be used in other ways by the CMS throughout its payment systems and programmatic efforts that use specialty to differentiate between Medicare providers.8 Finally, the C6 is an identifier for the Medicare fee-for-service system; state programs and MCOs may not identify hospitalists in the same manner, or at all. Therefore, it may make it more difficult for those groups and HM researchers to study the trends in care delivery changes. The specialty needs to engage with these other payers to assist in revising their information systems to better account for how hospitalists care for their insured populations.
Although we would expect a natural increase in C6 adoption over time, optimally meeting stakeholders’ data needs requires more rapid uptake. Our analysis is limited by our assumption that specialty patterns of code use remain similar from 2012 to 2017. Regardless, the magnitude of the difference between the estimate of hospitalists using the C6 versus billing thresholds strongly suggests underuse of the C6 designation. The CMS and MCOs have an increasing need for valid and representative data, and C6 can be used to assess “HM-adjusted” resource utilization, relative value units (RVUs), and performance evaluations. Therefore, hospitalists may see more incentives to use the C6 specialty code in a manner consistent with other recognized subspecialties.
Disclaimer
The research reported here was supported by the Department of Veterans Affairs, Veterans Health Administration, and the Health Services Research and Development Service. The views expressed in this article are those of the authors and do not necessarily reflect the position or policy of the Department of Veterans Affairs.
1. Wachter RM, Goldman L. Zero to 50,000—The 20th Anniversary of the Hospitalist. N Engl J Med. 2016;375(11):1009-1011. https://doi.org/10.1056/NEJMp1607958.
2. Quinn R. HM 2016: A year in review. The Hospitalist. 2016;12. https://www.the-hospitalist.org/hospitalist/article/121419/everything-you-need-know-about-bundled-payments-care-improvement
3. Centers for Medicare and Medicaid Services. Medicare Utilization for Part B. https://www.cms.gov/research-statistics-data-and-systems/statistics-trends-and-reports/medicarefeeforsvcpartsab/medicareutilizationforpartb.html. Accessed June 14, 2019.
4. Saint S, Christakis DA, Baldwin L-M, Rosenblatt R. Is hospitalism new? An analysis of Medicare data from Washington State in 1994. Eff Clin Pract. 2000;3(1):35-39.
5. Welch WP, Stearns SC, Cuellar AE, Bindman AB. Use of hospitalists by Medicare beneficiaries: a national picture. Medicare Medicaid Res Rev. 2014;4(2). https://doi.org/10.5600/mmrr2014-004-02-b01.
6. Lapps J, Flansbaum B, Leykum L, Boswell J, Haines L. Updating threshold-based identification of hospitalists in 2012 medicare pay data. J Hosp Med. 2016;11(1):45-47. https://doi.org/10.1002/jhm.2480.
7. Centers for Medicare & Medicaid Services. Physician Compare Initiative. https://www.cms.gov/Medicare/Quality-Initiatives-Patient-Assessment-Instruments/physician-compare-initiative/index.html. Accessed June 14, 2019.
8. Centers for Medicare & Medicaid Services. Revisions to Payment Policies under the Medicare Physician Fee Schedule, Quality Payment Program and Other Revisions to Part B for CY 2020 (CMS-1715-P). Accessed prior to publishing in the Federal Register through www.regulations.gov.
© 2019 Society of Hospital Medicine
Identification of Hospitalists
A seminal 1996 New England Journal of Medicine article introduced the term hospitalist to describe the emerging trend of primary care physicians practicing in inpatient hospital settings.[1] Although physicians had practice patterns akin to hospitalists prior to the introduction of the term,[2] the field continues to grow and formalize as a unique specialty in medicine.
There is currently no board certification or specialty billing code associated with hospitalists. In 2009, the American Board of Internal Medicine and American Board of Family Medicine introduced a Focused Practice in Hospital Medicine optional recertification pathway.[3] However, absent a unique identifier, it remains difficult to identify the number of hospitalists practicing today. Issues with identification notwithstanding, published data consistently suggest that the number of hospitalists has grown dramatically over the last 2 decades.[4, 5, 6]
The Centers for Medicare and Medicaid Services (CMS), along with other payers, classify hospitalists based on their board certificationmost commonly internal medicine or family practice. Other approaches for more precise assessment utilized billing data or hospital designation. Saint et al. identified hospital‐based providers practicing in Washington State in 1994 using variable thresholds of billing for inpatient services.[2] In 2011, Welch et al. identified 25,787 hospitalists nationwide, using a 90% threshold of billing inpatient services in Medicare data.[6] That same year, an American Hospital Association survey identified 34,411 hospitalists based on self‐reporting.[4]
Building on the work of previous researchers, we applied an updated threshold of inpatient services in publicly available 2012 Medicare Provider Utilization and Payment Data to identify a range of hospitalists practicing in the United States. We also examine the codes billed by providers identified in different decile billing thresholds to assess the validity of using lower thresholds to identify hospitalists.
METHODS
Approach to Identifying Hospitalists
In April 2014, CMS publicly released Medicare Provider Utilization and Payment data from all 880,000 providers who billed Medicare Part B in 2012. The dataset included services charged for 2012 Medicare Part B fee‐for‐service claims. The data omitted claims billed by a unique National Provider Identifier (NPI) for fewer than 10 Medicare beneficiaries. CMS assigned a specialty designation to each provider in the pay data based on the Medicare specialty billing code listed most frequently on his or her claims.
We explored the number of hospitalists in the 2012 Medicare pay data using specialty designation in combination with patterns of billing data. We first grouped physicians with specialty designations of internal medicine and family practice (IM/FP), the most common board certifications for hospitalists. We then selected 4 Healthcare Common Procedure Coding System (HCPCS) code clusters commonly associated with hospitalist practice: acute inpatient (HCPCS codes 9922199223, 9923199233, and 9923899239), observation (9921899220, 9922499226, and 99217), observation/emnpatient same day (9923499236), and critical care (9929199292). We included observation services codes given the significant role hospitalists play in their use[7, 8] and CMS incorporation of observation services for a threshold to identify and exempt hospital‐based providers in meaningful use.[9]
Analysis of Billing Thresholds and Other Codes Billed by Hospitalists
We examined the numbers of hospitalists who would be identified using a 50%, 60%, 70%, 80%, or 90% threshold, and compared the level of change in the size of the group with each change in decile.
We then analyzed the services billed by hospitalists who billed our threshold codes between 60% and 70% of the time. We looked at all codes billed with a frequency of greater than 0.1%, grouping clusters of similar services to identify patterns of clinical activity performed by these physicians.
RESULTS
The 2012 Medicare pay data included 664,253 physicians with unique NPIs. Of these, 169,317 had IM/FP specialty designations, whereas just under half (46.25%) of those physicians billed any of the inpatient HCPCS codes associated with our threshold.
Table 1 describes the range of number of hospitalists identified by varying the threshold of inpatient services. A total of 28,473 providers bill the threshold‐associated inpatient codes almost exclusively, whereas each descending decile increases in size by an average of 7.29%.
| Threshold (%) | Unique NPIs | % of IM/FP Physicians | % of All Physicians |
|---|---|---|---|
| |||
| 90 | 28,473 | 16.8 | 4.3 |
| 80 | 30,866 | 18.2 | 4.6 |
| 70 | 32,834 | 19.4 | 4.9 |
| 60 | 35,116 | 20.7 | 5.3 |
| 50 | 37,646 | 22.2 | 5.7 |
We also analyzed billing patterns of a subset of physicians who billed our threshold codes between 60% and 70% of the time to better characterize the remainder of clinical work they perform. This group included 2282 physicians and only 56 unique HCPCS codes with frequencies greater than 0.1%. After clustering related codes, we identified 4 common code groups that account for the majority of the remaining billing beyond inpatient threshold codes (Table 2).
| Clinical Service Cluster | HCPCS Codes Included | % |
|---|---|---|
| ||
| Threshold codes | 99217, 99219, 99220, 99221, 99222, 99223, 99231, 99232, 99233, 99238, 99239, 99291 | 64.5 |
| Office visit (new and established) | 99203, 99204, 99205, 99211, 99212, 99213, 99214, 99215 | 15.3 |
| SNF care (initial and subsequent) | 99305, 99306, 99307, 99308, 99309, 99310, 99315 | 7.1 |
| ECG‐related codes | 93000, 93010, 93042 | 2.5 |
| Routine venipuncture | 36415 | 1.0 |
| Other codes with f>0.1%* | 25 codes | 5.1 |
| Codes with f<0.1% | 439 codes | 4.5 |
| Total | 495 codes | 100.0 |
DISCUSSION
Hospitalists make up approximately 5% of the practicing physicians nationwide, performing a critical role caring for hospitalized patients. Saint et al. defined a pure hospitalist as a physician who meets a 90% threshold of inpatient services.[2] This approach has been replicated in subsequent studies that used a 90% threshold to identify hospitalists.[5, 6] Our results with the same threshold reveal more than 28,000 hospitalists with nearly uniform practice patterns, a 10% growth in the number of hospitalists from the Welch et al. analysis in 2011.[6]
A threshold is not a perfect tool for identifying groups of practicing physicians, as it creates an arbitrary cutoff within a dataset. Undoubtedly our analysis could include providers who would not consider themselves hospitalists, or alternatively, appear to have a hospital‐based practice when they do not. Our results suggest that a 90% threshold may identify a majority of practicing hospitalists, but excludes providers who likely identify as hospitalists albeit with divergent practice and billing patterns.
A lower threshold may be more inclusive of the current realities of hospitalist practice, accounting for the myriad other services provided during, immediately prior to, or following a hospitalization. With hospitalists commonly practicing in diverse facility settings, rotating through rehabilitation or nursing home facilities, discharge clinics, and preoperative medicine practices, the continued use of a 90% threshold appears to exclude a sizable number of practicing hospitalists.
In the absence of a formal identifier, developing identification methodologies that account for the diversity of hospitalist practice is crucial. As physician payment transitions to value‐based reimbursement, systems must have the ability to account for and allocate the most efficient mix of providers for their patient populations. Because provider alignment and coordination are structural features of these programs, these systems‐based changes in effect require accurate identification of hospitalists, yet currently lack the tools to do so.
Disclosures
The research reported here was supported by the Department of Veterans Affairs, Veterans Health Administration. Investigator salary support is provided through the South Texas Veterans Health Care System. The views expressed in this article are those of the authors and do not necessarily reflect the position or policy of the Department of Veterans Affairs. The authors report no conflicts of interest.