User login
Practicing High-Value Pediatric Care During a Pandemic: The Challenges and Opportunities
High-value care (HVC) is a philosophy and approach to medicine that focuses on achieving the best patient outcomes through evidence-based practice while minimizing harm to patients, wasted healthcare resources, and costs. Incorporating HVC principles in pediatric clinical decision-making is particularly important owing to the harms of hospitalization, overutilization, and overdiagnosis, as well as rising costs of pediatric care.1-4 How can we maintain these principles in the face of a global pandemic and new emerging syndrome, multisystem inflammatory syndrome in children (MIS-C), which has dramatically impacted healthcare systems for children?
In this article, we discuss the barriers and opportunities around practicing HVC in our evolving approach to novel COVID-19 management in hospitalized children. We also draw lessons from our experiences on how we can respond to future events that rapidly shift our approach to care.
BARRIERS TO PROVIDING HVC FOR HOSPITALIZED CHILDREN DURING COVID-19
As children’s hospitals and pediatric providers responded to the COVID-19 pandemic, practice recommendations were implemented rapidly and changed rapidly. A major challenge with an event like this is how we respond to the unknown and uncertainty, something most healthcare workers are not comfortable doing at baseline,5,6 particularly trainees and early-career physicians.7 With the benefit of hindsight, many early clinical approaches to care may now be seen as low-value care (LVC). For example, COVID-19 test availability was initially limited, and many hospitals utilized respiratory viral panels (RVPs) to potentially eliminate COVID-19 as an etiology of symptoms. RVP use increased during this time8; however, studies have shown that the co-infection rate of SARS-CoV2 with other respiratory viruses varies widely, so a positive RVP was of uncertain benefit.9 In addition, routine RVP use is often low value and may lead to overdiagnosis, additional overtesting cascades, and, at times, false reassurance and premature closure of the diagnostic workup.10
As our understanding of COVID-19 has expanded, rapid changes in treatment have also occurred. Early data were often preliminary and based on small trials of adults, and treatments ranged from inexpensive and available (dexamethasone) to quite expensive (remdesivir, monoclonal antibodies). Pragmatic randomized controlled trials (RCTs) are an important tool that may have been underutilized in pediatrics. Similar to our adult hospitalist colleagues’ experience,11 the rapid rise in cases provided an opportunity to collaborate across institutions to assess which treatments were most effective. In particular, the predictable rise in rates of MIS-C after a surge in COVID-19 cases could have provided an avenue to evaluate the relative effectiveness of the various treatments used.12 However, there were limited pediatric RCTs and thus a missed opportunity to establish an evidence-based pediatric standard of care for COVID-19 and MIS-C. This resulted in the development and dissemination of care practices before they were fully tested in children.
Similarly, the medical community has become increasingly aware of laboratory findings that may be predictive of clinical course.13 The outcomes of COVID and MIS-C are potentially severe, so looking for “early warning signs” with diagnostic testing is appealing. Clinicians responding to early data, and with a fear of missing something, may order a full panel of bloodwork for admitted patients to assist with decision-making and may underestimate the perceived minor harms and cost of unnecessary testing/admissions.3 However, most of the evidence regarding lab values came from the adult population. There is little understanding of how lab values impact pediatric-specific outcomes.14 Even for MIS-C, a pediatric-specific condition, early protocols emphasize broad testing approaches.15 A focus on grave (but rare) outcomes from a novel virus may also distract from more common causes of symptoms and lead to missed common diagnoses that are less severe.16 For both testing and treatment, having this early information before clear evidence on how it guided care may have caused more harm than benefit. Again, RCTs may have helped guide MIS-C therapies and protocol development.
Changing workflows may also create new barriers to HVC. One of the recommendations from Choosing Wisely® during the COVID-19 pandemic was to batch lab draws17 to reduce the risk of exposure to healthcare workers performing phlebotomy, as well as staff who transport, handle, and process bloodwork in the lab. This may inadvertently encourage the approach of getting a lab test “in case” we need it with a single daily blood draw. In trying to avoid multiple encounters (and conserve personal protective equipment [PPE]), we may be taking a less stepwise approach than in prepandemic times.
Finally, children’s hospitals witnessed significant financial challenges and reductions in patient volume related to the pandemic.18 Reductions in patient volume could present a potential opportunity for practicing HVC (eg, more time to discuss downstream effects) or alternatively could inadvertently incentivize low-value, low-priority care via messaging around preserving financial viability.
For clinicians and healthcare systems, these examples highlight why we may be predisposed to practicing LVC during a pandemic or similar emerging threat.
STRATEGIES FOR HVC PRACTICE DURING FUTURE MAJOR EVENTS
In light of these challenging clinical scenarios and nonclinical factors that predispose us to LVC, how can we reinforce a high-value approach to care during a pandemic or similar emerging threat? The following five specific concepts may help providers and organizations optimize HVC during this pandemic and in future situations:
- Utilize pediatric RCTs to provide evidence-based recommendations. In the face of a novel virus with unclear manifestations, treatment options were rapidly implemented without time for careful evaluation. In the future, collaboratively utilizing shared resources in the research community could help rapidly and rigorously evaluate outcomes in the pursuit of evidence-based practice.
- Use standardization as a tool to mitigate uncertainty. Knowing that uncertainty can be a driver of overuse and that during emerging threats, evidence is scarce and rapidly changing, a structured method for standardizing practice across your institution or multiple institutions can be helpful in many ways. Electronic health record–based orders and guidelines provide a standard of care to relieve uncertainty and have been shown to reduce overtesting.19 These resources can also be adapted rapidly as evidence emerges, reducing the burden on providers to know the latest evolving best practice. Experts who have reviewed the literature should have a method to quickly disseminate these findings through standardized practice, providing a venue for rapid learning and implementation.20
- Plan for active deimplementation from the outset. It is inevitable that some practices implemented early in pandemic response may need to be deimplemented later as the evidence and situation evolve. However, there is ample evidence that deimplementation can be difficult.21 Building in deimplementation mechanisms, such as standing educational sessions or hospital committees dedicated to value that review practices, from the beginning may ease these changes.
- Take advantage of novel opportunities to improve value. Early stop-gap interventions may be wasteful, but the upheaval from major events may also create novel opportunities to improve value in other ways. Some of these efforts, like PPE conservation and as-needed follow-up visits, may become useful methods to improve value even after the pandemic ends.22,23 The decreased pursuit of healthcare during the pandemic may also have given us an opportunity to better define when delayed diagnosis or even nondiagnosis for certain conditions is acceptable and when it may cause harm.
- Highlight harms of overuse. While avoiding unnecessary costs is an important aspect of reducing overuse, often the other human-centered harms of overuse are better motivators for HVC. Especially during the response to an emerging threat, the impacts of overuse may be compounded. Laboratory resources that are strained to meet COVID-19 testing demand will be further stretched by overuse of other laboratory testing. Overuse of ineffective treatments adds stress to nurses, pharmacists, and other front-line staff taking care of ill patients. Side effects of unnecessary interventions, including those that could prolong hospitalization, would also increase strain on the system. Reducing overuse is also a way to reduce workload for hospital staff during a time of crisis. Improved efficiency of practice and less time spent on practices that do not add value to patient care can insulate staff against burnout.24 Hospitalization and healthcare costs can add to the stress and financial burden of patients and families.25 Clinicians can highlight harms of overuse through openly talking about it on rounds with the patients, families, and entire care team and incorporating it into health system–wide messaging.
CONCLUSION
As vaccine distribution continues, like many clinicians, we are hopeful that the worst days of the pandemic are behind us. The crucible of the COVID-19 pandemic has undoubtedly changed us as clinicians and impacted our future practice patterns. We believe there is a need to challenge ourselves to continue to think from a value mindset even in times of crisis. Furthermore, there are important opportunities to learn from our response to the COVID-19 pandemic and find strategies for minimizing LVC outside the pandemic. We believe the lessons learned around improving value during this pandemic can strengthen our response to the next novel, widespread threat and reduce waste in our care systems, with a potential to increase the resilience of systems in the future.
1. Rokach A. Psychological, emotional and physical experiences of hospitalized children. Clin Case Rep Rev. 2016;2. https://doi.org/10.15761/CCRR.1000227
2. Stockwell DC, Landrigan CP, Toomey SL, et al. Adverse events in hospitalized pediatric patients. Pediatrics. 2018;142(2):e20173360. https://doi.org/10.1542/peds.2017-3360
3. Coon ER, Quinonez RA, Moyer VA, Schroeder AR. Overdiagnosis: how our compulsion for diagnosis may be harming children. Pediatrics. 2014;134(5):1013-1023. https://doi.org/10.1542/peds.2014-1778
4. Bui AL, Dieleman JL, Hamavid H, et al. Spending on children’s personal health care in the United States, 1996-2013. JAMA Pediatr. 2017;171(2):181-189. https://doi.org/10.1001/jamapediatrics.2016.4086
5. Ilgen JS, Eva KW, de Bruin A, Cook DA, Regehr G. Comfort with uncertainty: reframing our conceptions of how clinicians navigate complex clinical situations. Adv Health Sci Theory Pract. 2019;24(4):797-809. https://doi.org/10.1007/s10459-018-9859-5
6. Allison JJ, Kiefe CI, Cook EF, Gerrity MS, Orav EJ, Centor R. The association of physician attitudes about uncertainty and risk taking with resource use in a Medicare HMO. Med Decis Making. 1998;18(3):320-329. https://doi.org/10.1177/0272989X9801800310
7. Beck JB, Long M, Ryan MS. Into the unknown: helping learners become more comfortable with diagnostic uncertainty. Pediatrics. 2020;146(5):e2020027300. https://doi.org/10.1542/peds.2020-027300
8. Marshall NC, Kariyawasam RM, Zelyas N, Kanji JN, Diggle MA. Broad respiratory testing to identify SARS-CoV-2 viral co-circulation and inform diagnostic stewardship in the COVID-19 pandemic. Virol J. 2021;18(1):93. https://doi.org/10.1186/s12985-021-01545-9
9. Zimmermann P, Curtis N. Coronavirus infections in children including COVID-19: an overview of the epidemiology, clinical features, diagnosis, treatment and prevention options in children. Pediatr Infect Dis J. 2020;39(5):355-368. https://doi.org/10.1097/INF.0000000000002660
10. Morrison JM, Dudas RA, Collins K. The power and peril of panels. Hosp Pediatr. 2018;8(11):729-732. https://doi.org/10.1542/hpeds.2018-0093
11. Wise J, Coombes R. Covid-19: the inside story of the RECOVERY trial. BMJ. 2020;370:m2670. https://doi.org/10.1136/bmj.m2670.
12. Feldstein LR, Rose EB, Horwitz SM, et al. Multisystem inflammatory syndrome in U.S. children and adolescents. N Engl J Med. 2020;383(4):334-346.
13. Pourbagheri-Sigaroodi A, Bashash D, Fateh F, Abolghasemi H. Laboratory findings in COVID-19 diagnosis and prognosis. Clin Chim Acta. 2020;510:475-482. https://doi.org/10.1056/NEJMoa2021680
14. Henry BM, Benoit SW, de Oliveira MHS, et al. Laboratory abnormalities in children with mild and severe coronavirus disease 2019 (COVID-19): a pooled analysis and review. Clin Biochem. 2020;81:1-8. https://doi.org/10.1016/j.clinbiochem.2020.05.012
15. Centers for Disease Control and Prevention. Information for healthcare providers about multisystem inflammatory syndrome in children (MIS-C). Accessed July 7, 2021. https://www.cdc.gov/mis/hcp/index.html
16. Molloy M, Jerardi K, Marshall T. What are we missing in our search for MIS-C? Hosp Pediatr. 2021;11(4):e66-e69. https://doi.org/10.1542/hpeds.2020-005579
17. Cho HJ, Feldman LS, Keller S, Hoffman A, Pahwa AK, Krouss M. Choosing Wisely in the COVID-19 era: preventing harm to healthcare workers. J Hosp Med. 2020;15(6):360-362. https://doi.org/10.12788/jhm.3457
18. Synhorst DC, Bettenhausen JL, Hall M, et al. Healthcare encounter and financial impact of COVID-19 on children’s hospitals. J Hosp Med. 2021;16(4):223-226. https://doi.org/10.12788/jhm.3572
19. Algaze CA, Wood M, Pageler NM, Sharek PJ, Longhurst CA, Shin AY. Use of a checklist and clinical decision support tool reduces laboratory use and improves cost. Pediatrics. 2016;137(1). https://doi.org/10.1542/peds.2014-3019
20. Rao S, Kwan BM, Curtis DJ, et al. Implementation of a rapid evidence assessment infrastructure during the coronavirus disease 2019 (COVID-19) pandemic to develop policies, clinical pathways, stimulate academic research, and create educational opportunities. J Pediatr. 2021;230:4-8.e2. https://doi.org/10.1016/j.jpeds.2020.10.029
21. Gill PJ, Mahant S. Deimplementation of established medical practice without intervention: does it actually happen? J Hosp Med. 2020;15(12):765-766. https://doi.org/10.12788/jhm.3467
22. Coon ER, Destino LA, Greene TH, Vukin E, Stoddard G, Schroeder AR. Comparison of as-needed and scheduled posthospitalization follow-up for children hospitalized for bronchiolitis: the Bronchiolitis Follow-up Intervention Trial (BeneFIT) randomized clinical trial. JAMA Pediatr. 2020;174(9):e201937. https://doi.org/10.1001/jamapediatrics.2020.1937
23. Steuart R, Huang FS, Schaffzin JK, Thomson J. Finding the value in personal protective equipment for hospitalized patients during a pandemic and beyond. J Hosp Med. 2020;15(5):295-298. https://doi.org/10.12788/jhm.3429
24. Pierce RG, Diaz M, Kneeland P. Optimizing well-being, practice culture, and professional thriving in an era of turbulence. J Hosp Med. 2019;14(2):126-128. https://doi.org/10.12788/jhm.3101
25. Commodari E. Children staying in hospital: a research on psychological stress of caregivers. Ital J Pediatr. 2010;36:40. https://doi.org/10.1186/1824-7288-36-40
High-value care (HVC) is a philosophy and approach to medicine that focuses on achieving the best patient outcomes through evidence-based practice while minimizing harm to patients, wasted healthcare resources, and costs. Incorporating HVC principles in pediatric clinical decision-making is particularly important owing to the harms of hospitalization, overutilization, and overdiagnosis, as well as rising costs of pediatric care.1-4 How can we maintain these principles in the face of a global pandemic and new emerging syndrome, multisystem inflammatory syndrome in children (MIS-C), which has dramatically impacted healthcare systems for children?
In this article, we discuss the barriers and opportunities around practicing HVC in our evolving approach to novel COVID-19 management in hospitalized children. We also draw lessons from our experiences on how we can respond to future events that rapidly shift our approach to care.
BARRIERS TO PROVIDING HVC FOR HOSPITALIZED CHILDREN DURING COVID-19
As children’s hospitals and pediatric providers responded to the COVID-19 pandemic, practice recommendations were implemented rapidly and changed rapidly. A major challenge with an event like this is how we respond to the unknown and uncertainty, something most healthcare workers are not comfortable doing at baseline,5,6 particularly trainees and early-career physicians.7 With the benefit of hindsight, many early clinical approaches to care may now be seen as low-value care (LVC). For example, COVID-19 test availability was initially limited, and many hospitals utilized respiratory viral panels (RVPs) to potentially eliminate COVID-19 as an etiology of symptoms. RVP use increased during this time8; however, studies have shown that the co-infection rate of SARS-CoV2 with other respiratory viruses varies widely, so a positive RVP was of uncertain benefit.9 In addition, routine RVP use is often low value and may lead to overdiagnosis, additional overtesting cascades, and, at times, false reassurance and premature closure of the diagnostic workup.10
As our understanding of COVID-19 has expanded, rapid changes in treatment have also occurred. Early data were often preliminary and based on small trials of adults, and treatments ranged from inexpensive and available (dexamethasone) to quite expensive (remdesivir, monoclonal antibodies). Pragmatic randomized controlled trials (RCTs) are an important tool that may have been underutilized in pediatrics. Similar to our adult hospitalist colleagues’ experience,11 the rapid rise in cases provided an opportunity to collaborate across institutions to assess which treatments were most effective. In particular, the predictable rise in rates of MIS-C after a surge in COVID-19 cases could have provided an avenue to evaluate the relative effectiveness of the various treatments used.12 However, there were limited pediatric RCTs and thus a missed opportunity to establish an evidence-based pediatric standard of care for COVID-19 and MIS-C. This resulted in the development and dissemination of care practices before they were fully tested in children.
Similarly, the medical community has become increasingly aware of laboratory findings that may be predictive of clinical course.13 The outcomes of COVID and MIS-C are potentially severe, so looking for “early warning signs” with diagnostic testing is appealing. Clinicians responding to early data, and with a fear of missing something, may order a full panel of bloodwork for admitted patients to assist with decision-making and may underestimate the perceived minor harms and cost of unnecessary testing/admissions.3 However, most of the evidence regarding lab values came from the adult population. There is little understanding of how lab values impact pediatric-specific outcomes.14 Even for MIS-C, a pediatric-specific condition, early protocols emphasize broad testing approaches.15 A focus on grave (but rare) outcomes from a novel virus may also distract from more common causes of symptoms and lead to missed common diagnoses that are less severe.16 For both testing and treatment, having this early information before clear evidence on how it guided care may have caused more harm than benefit. Again, RCTs may have helped guide MIS-C therapies and protocol development.
Changing workflows may also create new barriers to HVC. One of the recommendations from Choosing Wisely® during the COVID-19 pandemic was to batch lab draws17 to reduce the risk of exposure to healthcare workers performing phlebotomy, as well as staff who transport, handle, and process bloodwork in the lab. This may inadvertently encourage the approach of getting a lab test “in case” we need it with a single daily blood draw. In trying to avoid multiple encounters (and conserve personal protective equipment [PPE]), we may be taking a less stepwise approach than in prepandemic times.
Finally, children’s hospitals witnessed significant financial challenges and reductions in patient volume related to the pandemic.18 Reductions in patient volume could present a potential opportunity for practicing HVC (eg, more time to discuss downstream effects) or alternatively could inadvertently incentivize low-value, low-priority care via messaging around preserving financial viability.
For clinicians and healthcare systems, these examples highlight why we may be predisposed to practicing LVC during a pandemic or similar emerging threat.
STRATEGIES FOR HVC PRACTICE DURING FUTURE MAJOR EVENTS
In light of these challenging clinical scenarios and nonclinical factors that predispose us to LVC, how can we reinforce a high-value approach to care during a pandemic or similar emerging threat? The following five specific concepts may help providers and organizations optimize HVC during this pandemic and in future situations:
- Utilize pediatric RCTs to provide evidence-based recommendations. In the face of a novel virus with unclear manifestations, treatment options were rapidly implemented without time for careful evaluation. In the future, collaboratively utilizing shared resources in the research community could help rapidly and rigorously evaluate outcomes in the pursuit of evidence-based practice.
- Use standardization as a tool to mitigate uncertainty. Knowing that uncertainty can be a driver of overuse and that during emerging threats, evidence is scarce and rapidly changing, a structured method for standardizing practice across your institution or multiple institutions can be helpful in many ways. Electronic health record–based orders and guidelines provide a standard of care to relieve uncertainty and have been shown to reduce overtesting.19 These resources can also be adapted rapidly as evidence emerges, reducing the burden on providers to know the latest evolving best practice. Experts who have reviewed the literature should have a method to quickly disseminate these findings through standardized practice, providing a venue for rapid learning and implementation.20
- Plan for active deimplementation from the outset. It is inevitable that some practices implemented early in pandemic response may need to be deimplemented later as the evidence and situation evolve. However, there is ample evidence that deimplementation can be difficult.21 Building in deimplementation mechanisms, such as standing educational sessions or hospital committees dedicated to value that review practices, from the beginning may ease these changes.
- Take advantage of novel opportunities to improve value. Early stop-gap interventions may be wasteful, but the upheaval from major events may also create novel opportunities to improve value in other ways. Some of these efforts, like PPE conservation and as-needed follow-up visits, may become useful methods to improve value even after the pandemic ends.22,23 The decreased pursuit of healthcare during the pandemic may also have given us an opportunity to better define when delayed diagnosis or even nondiagnosis for certain conditions is acceptable and when it may cause harm.
- Highlight harms of overuse. While avoiding unnecessary costs is an important aspect of reducing overuse, often the other human-centered harms of overuse are better motivators for HVC. Especially during the response to an emerging threat, the impacts of overuse may be compounded. Laboratory resources that are strained to meet COVID-19 testing demand will be further stretched by overuse of other laboratory testing. Overuse of ineffective treatments adds stress to nurses, pharmacists, and other front-line staff taking care of ill patients. Side effects of unnecessary interventions, including those that could prolong hospitalization, would also increase strain on the system. Reducing overuse is also a way to reduce workload for hospital staff during a time of crisis. Improved efficiency of practice and less time spent on practices that do not add value to patient care can insulate staff against burnout.24 Hospitalization and healthcare costs can add to the stress and financial burden of patients and families.25 Clinicians can highlight harms of overuse through openly talking about it on rounds with the patients, families, and entire care team and incorporating it into health system–wide messaging.
CONCLUSION
As vaccine distribution continues, like many clinicians, we are hopeful that the worst days of the pandemic are behind us. The crucible of the COVID-19 pandemic has undoubtedly changed us as clinicians and impacted our future practice patterns. We believe there is a need to challenge ourselves to continue to think from a value mindset even in times of crisis. Furthermore, there are important opportunities to learn from our response to the COVID-19 pandemic and find strategies for minimizing LVC outside the pandemic. We believe the lessons learned around improving value during this pandemic can strengthen our response to the next novel, widespread threat and reduce waste in our care systems, with a potential to increase the resilience of systems in the future.
1. Rokach A. Psychological, emotional and physical experiences of hospitalized children. Clin Case Rep Rev. 2016;2. https://doi.org/10.15761/CCRR.1000227
2. Stockwell DC, Landrigan CP, Toomey SL, et al. Adverse events in hospitalized pediatric patients. Pediatrics. 2018;142(2):e20173360. https://doi.org/10.1542/peds.2017-3360
3. Coon ER, Quinonez RA, Moyer VA, Schroeder AR. Overdiagnosis: how our compulsion for diagnosis may be harming children. Pediatrics. 2014;134(5):1013-1023. https://doi.org/10.1542/peds.2014-1778
4. Bui AL, Dieleman JL, Hamavid H, et al. Spending on children’s personal health care in the United States, 1996-2013. JAMA Pediatr. 2017;171(2):181-189. https://doi.org/10.1001/jamapediatrics.2016.4086
5. Ilgen JS, Eva KW, de Bruin A, Cook DA, Regehr G. Comfort with uncertainty: reframing our conceptions of how clinicians navigate complex clinical situations. Adv Health Sci Theory Pract. 2019;24(4):797-809. https://doi.org/10.1007/s10459-018-9859-5
6. Allison JJ, Kiefe CI, Cook EF, Gerrity MS, Orav EJ, Centor R. The association of physician attitudes about uncertainty and risk taking with resource use in a Medicare HMO. Med Decis Making. 1998;18(3):320-329. https://doi.org/10.1177/0272989X9801800310
7. Beck JB, Long M, Ryan MS. Into the unknown: helping learners become more comfortable with diagnostic uncertainty. Pediatrics. 2020;146(5):e2020027300. https://doi.org/10.1542/peds.2020-027300
8. Marshall NC, Kariyawasam RM, Zelyas N, Kanji JN, Diggle MA. Broad respiratory testing to identify SARS-CoV-2 viral co-circulation and inform diagnostic stewardship in the COVID-19 pandemic. Virol J. 2021;18(1):93. https://doi.org/10.1186/s12985-021-01545-9
9. Zimmermann P, Curtis N. Coronavirus infections in children including COVID-19: an overview of the epidemiology, clinical features, diagnosis, treatment and prevention options in children. Pediatr Infect Dis J. 2020;39(5):355-368. https://doi.org/10.1097/INF.0000000000002660
10. Morrison JM, Dudas RA, Collins K. The power and peril of panels. Hosp Pediatr. 2018;8(11):729-732. https://doi.org/10.1542/hpeds.2018-0093
11. Wise J, Coombes R. Covid-19: the inside story of the RECOVERY trial. BMJ. 2020;370:m2670. https://doi.org/10.1136/bmj.m2670.
12. Feldstein LR, Rose EB, Horwitz SM, et al. Multisystem inflammatory syndrome in U.S. children and adolescents. N Engl J Med. 2020;383(4):334-346.
13. Pourbagheri-Sigaroodi A, Bashash D, Fateh F, Abolghasemi H. Laboratory findings in COVID-19 diagnosis and prognosis. Clin Chim Acta. 2020;510:475-482. https://doi.org/10.1056/NEJMoa2021680
14. Henry BM, Benoit SW, de Oliveira MHS, et al. Laboratory abnormalities in children with mild and severe coronavirus disease 2019 (COVID-19): a pooled analysis and review. Clin Biochem. 2020;81:1-8. https://doi.org/10.1016/j.clinbiochem.2020.05.012
15. Centers for Disease Control and Prevention. Information for healthcare providers about multisystem inflammatory syndrome in children (MIS-C). Accessed July 7, 2021. https://www.cdc.gov/mis/hcp/index.html
16. Molloy M, Jerardi K, Marshall T. What are we missing in our search for MIS-C? Hosp Pediatr. 2021;11(4):e66-e69. https://doi.org/10.1542/hpeds.2020-005579
17. Cho HJ, Feldman LS, Keller S, Hoffman A, Pahwa AK, Krouss M. Choosing Wisely in the COVID-19 era: preventing harm to healthcare workers. J Hosp Med. 2020;15(6):360-362. https://doi.org/10.12788/jhm.3457
18. Synhorst DC, Bettenhausen JL, Hall M, et al. Healthcare encounter and financial impact of COVID-19 on children’s hospitals. J Hosp Med. 2021;16(4):223-226. https://doi.org/10.12788/jhm.3572
19. Algaze CA, Wood M, Pageler NM, Sharek PJ, Longhurst CA, Shin AY. Use of a checklist and clinical decision support tool reduces laboratory use and improves cost. Pediatrics. 2016;137(1). https://doi.org/10.1542/peds.2014-3019
20. Rao S, Kwan BM, Curtis DJ, et al. Implementation of a rapid evidence assessment infrastructure during the coronavirus disease 2019 (COVID-19) pandemic to develop policies, clinical pathways, stimulate academic research, and create educational opportunities. J Pediatr. 2021;230:4-8.e2. https://doi.org/10.1016/j.jpeds.2020.10.029
21. Gill PJ, Mahant S. Deimplementation of established medical practice without intervention: does it actually happen? J Hosp Med. 2020;15(12):765-766. https://doi.org/10.12788/jhm.3467
22. Coon ER, Destino LA, Greene TH, Vukin E, Stoddard G, Schroeder AR. Comparison of as-needed and scheduled posthospitalization follow-up for children hospitalized for bronchiolitis: the Bronchiolitis Follow-up Intervention Trial (BeneFIT) randomized clinical trial. JAMA Pediatr. 2020;174(9):e201937. https://doi.org/10.1001/jamapediatrics.2020.1937
23. Steuart R, Huang FS, Schaffzin JK, Thomson J. Finding the value in personal protective equipment for hospitalized patients during a pandemic and beyond. J Hosp Med. 2020;15(5):295-298. https://doi.org/10.12788/jhm.3429
24. Pierce RG, Diaz M, Kneeland P. Optimizing well-being, practice culture, and professional thriving in an era of turbulence. J Hosp Med. 2019;14(2):126-128. https://doi.org/10.12788/jhm.3101
25. Commodari E. Children staying in hospital: a research on psychological stress of caregivers. Ital J Pediatr. 2010;36:40. https://doi.org/10.1186/1824-7288-36-40
© 2021 Society of Hospital Medicine
Financial Difficulties in Families of Hospitalized Children
Rising US healthcare costs coupled with high cost-sharing insurance plans have led to increased out-of-pocket healthcare expenditures, especially for those who are low income or in poorer health.1-7 Increased out-of-pocket expenditures can lead to “financial distress” (defined as the subjective level of stress felt toward one’s personal financial situation) and to “medical financial burden” (defined as the subjective assessment of financial problems relating specifically to medical costs). Financial distress and medical financial burden (defined together as “financial difficulty”) lead to impaired access and delayed presentation to care and treatment nonadherence in hopes of alleviating costs.8-12
Between 20% and 50% of families with children requiring frequent medical care report that their child’s healthcare has caused a financial difficulty.13,14 In addition to direct medical costs, these parents can also suffer from indirect costs of their child’s care, such as unemployment or missed work.15-17 Along with these families, families who are low income (generally defined as living below 200% of the Federal Poverty Level) also have higher absolute and relative out-of-pocket healthcare costs, and both groups are more likely to have unmet medical needs or to delay or forgo care.18-20 Medically complex children also represent an increasing percentage of patients admitted to children’s hospitals21,22 where their families may be more vulnerable to worsening financial difficulties caused by direct costs and income depletion—due to lost wages, transportation, and meals—associated with hospitalization.23
The hospitalized population can be readily screened and provided interventions. Although evidence on effective inpatient financial interventions is lacking, financial navigation programs piloted in the ambulatory setting that standardize financial screening and support trained financial navigators could prove a promising model for inpatient care.24-26 Therefore, understanding the prevalence of financial difficulties in this population and potential high-yield screening characteristics is critical in laying the groundwork for more robust in-hospital financial screening and support systems.
Our primary objective was to assess the prevalence of financial distress and medical financial burden in families of hospitalized children. Our secondary objective was to examine measurable factors during hospitalization that could identify families at risk for these financial difficulties to better understand how to target and implement hospital-based interventions.
METHODS
We conducted a cross-sectional survey at six university-affiliated children’s hospitals (Table 1). Each site’s institutional review board approved the study. All participants were verbally informed of the research goals of the study and provided with a research information document. Need for written informed consent was determined by each institutional review board.

Study enrollment occurred between October 2017 and November 2018, with individual sites having shorter active enrollment periods (ranging from 25 to 100 days) until sample size goals were met as explained below. Participants represented a convenience sample of parents or guardians (hereafter referred to only as “parents”), who were eligible for enrollment if their child was admitted to one of the six hospitals during the active enrollment period at that site. To avoid sampling bias, each site made an effort to enroll a consecutive sample of parents, but this was limited by resources and investigator availability. Parents were excluded if their child was admitted to a neonatal unit because of difficulty in complexity categorization and the confounding issue of mothers often being admitted simultaneously. There were no other unit-, diagnosis-, or service-based exclusions to participation. Parents were also excluded if their child was 18 years or older or if they themselves were younger than 18 years. Parents were approached once their child was identified for discharge from the hospital within 48 hours. Surveys were self-administered at the time of enrollment on provided electronic tablets. Participants at some sites were offered a $5 gift card as an incentive for survey completion.
The survey included a previously published financial distress scale (InCharge Financial Distress/Financial Wellbeing Scale [IFDFW])(Appendix).27 A question in addition to the IFDFW assessed whether families were currently experiencing financial burden from medical care28,29 and whether that burden was caused by their child (Appendix) because the IFDFW does not address the source of financial distress. The survey also included questions assessing perspectives on healthcare costs (data not presented here). The survey was refined through review by psychometric experts and members of the Family Advisory Council at the primary research site, which led to minor modifications. The final survey consisted of 40 items and was professionally translated into Spanish by a third-party company (Idem Translations). It was pilot tested by 10 parents of hospitalized children to assess for adequate comprehension and clarity; these parents were not included in the final data analysis.
Variables
The primary outcome variables were level of financial distress as defined by the IFDFW scale27 and the presence of medical financial burden. The IFDFW scale has eight questions answered on a scale of 1-10, and the final score is calculated by averaging these answers. The scale defines three categories of financial distress (high, 1-3.9; average, 4-6.9; low, 7-10); however, we dichotomized our outcome as high (<4) or not high (≥4). The outcome was analyzed as both continuous and dichotomous variables because small differences in continuous scores, if detected, may be less clinically relevant. Medical financial burden was categorized as child related, child unrelated, and none.

Our secondary aim was to identify predictors of financial distress and medical financial burden. The primary predictor variable of interest was the hospitalized child’s level of chronic disease (complex chronic disease, C-CD; noncomplex chronic disease, NC-CD; no chronic disease, no-CD) as categorized by the consensus definitions from the Center of Excellence on Quality of Care Measures for Children with Complex Needs (Appendix).30 We assigned level of chronic disease based on manual review of problem lists and diagnoses in the electronic health record (EHR) from up to 3 years prior. At sites with multiple researchers, the first five to ten charts were reviewed together to ensure consistency in categorization, but no formal assessment of interrater reliability was conducted. Other predictor variables are listed in Tables 2 and 3. Insurance payer was defined as “public” or “private” based on the documented insurance plan in the EHR. Patients with dual public and private insurance were categorized as public.

Statistical Analysis
We estimated sample size requirements using an expected mean IFDFW score with standard deviation of 5.7 ± 2 based on preliminary data from the primary study site and previously published data.27 We used a significance level of P = .05, power of 0.80, and an effect size of 0.5 points difference on the IFDFW scale between the families of children with C-CD and those with either NC-CD or no-CD. We assumed there would be unequal representation of chronic disease states, with an expectation that children with C-CD would make up approximately 40% of the total population.21,22,31 Under these assumptions, we calculated a desired total sample size of 519. This would also allow us to detect a 12% absolute difference in the rate of high financial distress between families with and without C-CD, assuming a baseline level of high financial distress of 30%.27 Our goal enrollment was 150 parents at the primary site and 75 parents at each of the other 5 sites.
We fit mixed effects logistic regression models to evaluate the odds of high financial distress and polytomous logistic regression models (for our three-level outcome) to evaluate the odds of having child-related medical financial burden vs having child-unrelated burden vs having no burden. We fit linear mixed effects models to evaluate the effect of chronic disease level and medical financial burden on mean IFDFW scores. Respondents who answered “I don’t know” to the medical financial burden question were aggregated with those who reported no medical financial burden. Models were fit as a function of chronic disease level, race, ethnicity, percentage of Federal Poverty Level (FPL), insurance payer, and having a deductible less than $1,000 per year. These models included a random intercept for facility. We also fit logistic regression models that used an interaction term between chronic disease level and percentage of FPL, as well as insurance payer and percentage of FPL, to explore potential effect modification between poverty and both chronic disease level and insurance payer on financial distress. For our models, we used the MICE package for multiple imputation to fill in missing data. We imputed 25 data sets with 25 iterations each and pooled model results using Rubin’s Rules.32 All analyses were performed in R 3.5.33
RESULTS
Of 644 parents who were invited to participate, 526 (82%) were enrolled. Participants and their hospitalized children were mostly White/Caucasian (69%) and not Hispanic/Latino (76%), with 34% of families living below 200% FPL and 274 (52%) having private insurance (Table 1). Of the hospitalized children, 225 (43%) were categorized as C-CD, 143 (27%) as NC-CD, and 157 (30%) as no-CD. All participants completed the IFDFW; however, there were five missing responses to the medical financial burden question. Table 1 lists missing demographic and financial difficulty data.
Financial Distress
The mean IFDFW score of all participants was 5.6 ± 2.1, with 125 having high financial distress (24%; 95% CI, 20-28) (Table 1). There was no difference in mean IFDFW scores among families of children with different chronic disease levels (Figure). On unadjusted and adjusted analyses, there was no association between level of chronic disease and high financial distress when C-CD and NC-CD groups were each compared with no-CD (Table 2). However, families living below 400% FPL (annual income of $100,400 for a family of four) were significantly more likely than families living at 400% FPL and above to have high financial distress. Families tended to have lower financial distress (as indicated by mean IFDFW scores) with increasing percentage of FPL; however, there were families in every FPL bracket who experienced high financial distress (Appendix Figure 1a). A secondary analysis of families below and those at or above 200% FPL did not find any significant interactions between percentage of FPL and either chronic disease level (P = .86) or insurance payer (P = .83) on financial distress.

Medical Financial Burden
Overall, 160 parents (30%; 95% CI, 27-35) reported having medical financial burden, with 86 of those parents (54%) indicating their financial burden was related to their child’s medical care (Table 1). Compared with families with no such medical financial burden, respondents with medical financial burden, either child related or child unrelated, had significantly lower mean IFDFW scores (Figure), which indicates overall higher financial distress in these families. However, some families with low financial distress also reported medical financial burden.
Adjusted analyses demonstrated that, compared with families of children with no-CD, families of children with C-CD (adjusted odds ratio [AOR], 4.98; 95% CI, 2.41-10.29) or NC-CD (AOR, 2.57; 95% CI, 1.11-5.93) had significantly higher odds of having child-related medical financial burden (Table 3). Families of children with NC-CD were also more likely than families of children with no-CD to have child-unrelated medical burden (Table 3). Percentage of FPL was the only other significant predictor of child-related and child-unrelated medical financial burden (Table 3), but as with the distribution of financial distress, medical financial burden was seen across family income brackets (Appendix Figure 1b).
DISCUSSION
In this multicenter study of parents of hospitalized children, almost one in four families experienced high financial distress and almost one in three families reported having medical financial burden, with both measures of financial difficulty affecting families across all income levels. While these percentages are not substantially higher than those seen in the general population,27,34 70% of our population was composed of children with chronic disease who are more likely to have short-term and long-term healthcare needs, which places them at risk for significant ongoing medical costs.
We hypothesized that families of children with complex chronic disease would have higher levels of financial difficulties,13,35,36 but we found that level of chronic disease was associated only with medical financial burden and not with high financial distress. Financial distress is likely multifactorial and dynamic, with different drivers across various income levels. Therefore, while medical financial burden likely contributes to high financial distress, there may be other contributing factors not captured by the IFDFW. However, subjective medical financial burden has still been associated with impaired access to care.10,34 Therefore, our results suggest that families of children with chronic diseases might be at higher risk for barriers to consistent healthcare because of the financial burden their frequent healthcare utilization incurs.
Household poverty level was also associated with financial distress and medical financial burden, although surprisingly both measures of financial difficulty were present in all FPL brackets. This highlights an important reality that financial vulnerability extends beyond income and federally defined “poverty.” Non-income factors, such as high local costs of living and the growing problem of underinsurance, may significantly contribute to financial difficulty, which may render static financial metrics such as percentage of FPL insufficient screeners. Furthermore, as evidenced by the nearly 10% of our respondents who declined to provide their income information, this is a sensitive topic for some families, so gathering income data during admission could likely be a nonstarter.
In the absence of other consistent predictors of financial difficulty that could trigger interventions such as an automatic financial counselor consult, hospitals and healthcare providers could consider implementing routine non-income based financial screening questions on admission, such as one assessing medical financial burden, as a nondiscriminatory way of identifying at-risk families and provide further education and assistance regarding their financial needs. Systematically gathering this data may also further demonstrate the need for broad financial navigation programs as a mainstay in comprehensive inpatient care.
We acknowledge several limitations of this study. Primarily, we surveyed families prior to discharge and receipt of hospitalization-related bills, and these bills could contribute significantly to financial difficulties. While the families of children with chronic disease, who likely have recurrent medical bills, did not demonstrate higher financial distress, it is possible that the overall rate of financial difficulties would have been higher had we surveyed families several weeks after discharge. Our measures of financial difficulty were also subjective and, therefore, at risk for response biases (such as recall bias) that could have misestimated the prevalence of these problems in our population. However, published literature on the IFDFW scale demonstrates concordance between the subjective score and tangible outcomes of financial distress (eg, contacting a credit agency). The IFDFW scale was validated in the general population, and although it has been used in studies of medical populations,37-41 none have been in hospitalized populations, which may affect the scale’s applicability in our study. The study was also conducted only at university-affiliated children’s hospitals, and although these hospitals are geographically diverse, most children in the United States are admitted to general or community hospitals.31 Our population was also largely White, non-Hispanic/Latino, and English speaking. Therefore, our sample may not reflect the general population of hospitalized children and their families. We also assigned levels of chronic disease based on manual EHR review. While the EHR should capture each patient’s breadth of medical issues, inaccurate or missing documentation could have led to misclassification of complexity in some cases. Additionally, our sample size was calculated to detect fairly large differences in our primary outcome, and some of our unexpected results may have resulted from this study being underpowered for detection of smaller, but perhaps still clinically relevant, differences. Finally, we do not have data for several possible confounders in our study, such as employment status, health insurance concordance among family members, or sources of supplemental income, that may impact a family’s overall financial health, along with some potential important hospital-based screening characteristics, such as admitting service team or primary diagnosis.
CONCLUSION
Financial difficulties are common in families of hospitalized pediatric patients. Low-income families and those who have children with chronic conditions are at particular risk; however, all subsets of families can be affected. Given the potential negative health outcomes financial difficulties impose on families and children, the ability to identify and support vulnerable families is a crucial component of care. Hospitalization may be a prime opportunity to identify and support our at-risk families.
Acknowledgments
The authors would like to thank the parents at each of the study sites for their participation, as well as the multiple research coordinators across the study sites for assisting in recruitment of families, survey administration, and data collection. KT Park, MD, MS (Stanford University School of Medicine) served as an adviser for the study’s design.
Disclosures
All authors have no financial relationships or conflicts of interest relevant to this article to disclose.
1. Blumberg LJ, Waidmann TA, Blavin F, Roth J. Trends in health care financial burdens, 2001 to 2009. Milbank Q. 2014;92(1):88-113. https://doi.org/10.1111/1468-0009.12042
2. Claxton G, Rae M, Long M, et al. Employer Health Benefits, 2015 Annual Survey. Kaiser Family Foundation; 2015. http://files.kff.org/attachment/report-2015-employer-health-benefits-survey
3. Long M, Rae M, Claxton G, et al. Recent trends in employer-sponsored insurance premiums. JAMA. 2016;315(1):18. https://doi.org/10.1001/jama.2015.17349
4. Patients’ perspectives on health care in the United States: A look at seven states and the nation. Press release. NPR, Robert Wood Johnson Foundation, Harvard T.H. Chan School of Public Health; February 29, 2016. Accessed February 23, 2018. https://www.rwjf.org/en/library/research/2016/02/patients--perspectives-on-health-care-in-the-united-states.html
5. May JH, Cunningham PJ. Tough trade-offs: medical bills, family finances and access to care. Issue Brief Cent Stud Health Syst Change. 2004;(85):1-4.
6. Tu HT. Rising health costs, medical debt and chronic conditions. Issue Brief Cent Stud Health Syst Change. 2004;(88):1-5.
7. Richman IB, Brodie M. A National study of burdensome health care costs among non-elderly Americans. BMC Health Serv Res. 2014;14:435. https://doi.org/10.1186/1472-6963-14-435
8. Choudhry NK, Saya UY, Shrank WH, et al. Cost-related medication underuse: prevalence among hospitalized managed care patients. J Hosp Med. 2012;7(2):104-109. https://doi.org/10.1002/jhm.948
9. QuickStats: percentage of persons of all ages who delayed or did not receive medical care during the preceding year because of cost, by U.S. Census region of residence—National Health Interview Survey, 2015. MMWR Morb Mortal Wkly Rep. 2017;66(4):121. https://dx.doi.org/10.15585/mmwr.mm6604a9
10. Doty MM, Ho A, Davis K. How High Is Too High? Implications of High-Deductible Health Plans. The Commonwealth Fund; April 1, 2005. Accessed February 24, 2018. http://www.commonwealthfund.org/publications/fund-reports/2005/apr/how-high-is-too-high--implications-of-high-deductible-health-plans
11. Doty MM, Edwards JN, Holmgren AL. Seeing Red: American Driven into Debt by Medical Bills. The Commonwealth Fund; August 1, 2005. Accessed October 24, 2018. https://www.commonwealthfund.org/publications/issue-briefs/2005/aug/seeing-red-americans-driven-debt-medical-bills
12. Altice CK, Banegas MP, Tucker-Seeley RD, Yabroff KR. Financial hardships experienced by cancer survivors: a systematic review. J Natl Cancer Inst. 2016;109(2):djw205. https://doi.org/10.1093/jnci/djw205
13. Ghandour RM, Hirai AH, Blumberg SJ, Strickland BB, Kogan MD. Financial and nonfinancial burden among families of CSHCN: changes between 2001 and 2009-2010. Acad Pediatr. 2014;14(1):92-100. https://doi.org/10.1016/j.acap.2013.10.001
14. Thomson J, Shah SS, Simmons JM, et al. Financial and social hardships in families of children with medical complexity. J Pediatr. 2016;172:187-193.e1. https://doi.org/10.1016/j.jpeds.2016.01.049
15. Kuhlthau K, Kahn R, Hill KS, Gnanasekaran S, Ettner SL. The well-being of parental caregivers of children with activity limitations. Matern Child Health J. 2010;14(2):155-163. https://doi.org/10.1007/s10995-008-0434-1
16. Kuhlthau KA, Perrin JM. Child health status and parental employment. Arch Pediatr Adolesc Med. 2001;155(12):1346-1350. https://doi.org/10.1001/archpedi.155.12.1346
17. Witt WP, Gottlieb CA, Hampton J, Litzelman K. The impact of childhood activity limitations on parental health, mental health, and workdays lost in the United States. Acad Pediatr. 2009;9(4):263-269. https://doi.org/10.1016/j.acap.2009.02.008
18. Wisk LE, Witt WP. Predictors of delayed or forgone needed health care for families with children. Pediatrics. 2012;130(6):1027-1037. https://doi.org/10.1542/peds.2012-0668
19. Davidoff AJ. Insurance for children with special health care needs: patterns of coverage and burden on families to provide adequate insurance. Pediatrics. 2004;114(2):394-403. https://doi.org/10.1542/peds.114.2.394
20. Galbraith AA, Wong ST, Kim SE, Newacheck PW. Out-of-pocket financial burden for low-income families with children: socioeconomic disparities and effects of insurance. Health Serv Res. 2005;40(6 Pt 1):1722-1736. https://doi.org/10.1111/j.1475-6773.2005.00421.x
21. Berry JG, Hall DE, Kuo DZ, et al. Hospital utilization and characteristics of patients experiencing recurrent readmissions within children’s hospitals. JAMA. 2011;305(7):682-690. https://doi.org/10.1001/jama.2011.122
22. Berry JG, Hall M, Hall DE, et al. Inpatient growth and resource use in 28 children’s hospitals: a longitudinal, multi-institutional study. JAMA Pediatrics. 2013;167(2):170-177. https://doi.org/10.1001/jamapediatrics.2013.432
23. Chang LV, Shah AN, Hoefgen ER, et al. Lost earnings and nonmedical expenses of pediatric hospitalizations. Pediatrics. 2018;142(3):e20180195. https://doi.org/10.1542/peds.2018-0195
24. Banegas MP, Dickerson JF, Friedman NL, et al. Evaluation of a novel financial navigator pilot to address patient concerns about medical care costs. Perm J. 2019;23:18-084. https://doi.org/10.7812/tpp/18-084
25. Shankaran V, Leahy T, Steelquist J, et al. Pilot feasibility study of an oncology financial navigation program. J Oncol Pract. 2018;14(2):e122-e129. https://doi.org/10.1200/jop.2017.024927
26. Yezefski T, Steelquist J, Watabayashi K, Sherman D, Shankaran V. Impact of trained oncology financial navigators on patient out-of-pocket spending. Am J Manag Care. 2018;24(5 Suppl):S74-S79.
27. Prawitz AD, Garman ET, Sorhaindo B, O’Neill B, Kim J, Drentea P. InCharge Financial Distress/Financial Well-Being Scale: Development, Administration, and Score Interpretation. J Financial Counseling Plann. 2006;17(1):34-50. https://doi.org/10.1037/t60365-000
28. Cohen RA, Kirzinger WK. Financial burden of medical care: a family perspective. NCHS Data Brief. 2014;(142):1-8.
29. Galbraith AA, Ross-Degnan D, Soumerai SB, Rosenthal MB, Gay C, Lieu TA. Nearly half of families in high-deductible health plans whose members have chronic conditions face substantial financial burden. Health Aff (Millwood). 2011;30(2):322-331. https://doi.org/10.1377/hlthaff.2010.0584
30. Simon TD, Cawthon ML, Stanford S, et al. Pediatric medical complexity algorithm: a new method to stratify children by medical complexity. Pediatrics. 2014;133(6):e1647-e1654. https://doi.org/10.1542/peds.2013-3875
31. Leyenaar JK, Ralston SL, Shieh MS, Pekow PS, Mangione-Smith R, Lindenauer PK. Epidemiology of pediatric hospitalizations at general hospitals and freestanding children’s hospitals in the United States. J Hosp Med. 2016;11(11):743-749. https://doi.org/10.1002/jhm.2624
32. Rubin DB. Multiple Imputation for Nonresponse in Surveys. John Wiley and Sons; 1987.
33. R: A language and environment for statistical computing. R Foundation for Statistical Computing; 2018. https://www.R-project.org/
34. Hamel L, Norton M, Pollitz K, Levitt L, Claxton G, Brodie M. The Burden of Medical Debt: Results from the Kaiser Family Foundation/New York Times Medical Bills Survey. Kaiser Family Foundation; January 5, 2016. Accessed February 26, 2019. https://www.kff.org/wp-content/uploads/2016/01/8806-the-burden-of-medical-debt-results-from-the-kaiser-family-foundation-new-york-times-medical-bills-survey.pdf
35. Witt WP, Litzelman K, Mandic CG, et al. Healthcare-related financial burden among families in the U.S.: the role of childhood activity limitations and income. J Fam Econ Issues. 2011;32(2):308-326. https://doi.org/10.1007/s10834-011-9253-4
36. Zan H, Scharff RL. The heterogeneity in financial and time burden of caregiving to children with chronic conditions. Matern Child Health J. 2015;19(3):615-625. https://doi.org/10.1007/s10995-014-1547-3
37. Irwin B, Kimmick G, Altomare I, et al. Patient experience and attitudes toward addressing the cost of breast cancer care. Oncologist. 2014;19(11):1135-1140. https://doi.org/10.1634/theoncologist.2014-0117
38. Meisenberg BR, Varner A, Ellis E, et al. Patient attitudes regarding the cost of illness in cancer care. Oncologist. 2015;20(10):1199-1204. https://doi.org/10.1634/theoncologist.2015-0168
39. Altomare I, Irwin B, Zafar SY, et al. Physician experience and attitudes toward addressing the cost of cancer care. J Oncol Pract. 2016;12(3):e281-288, 247-288. https://doi.org/10.1200/jop.2015.007401
40. Starkey AJ, Keane CR, Terry MA, Marx JH, Ricci EM. Financial distress and depressive symptoms among African American women: identifying financial priorities and needs and why it matters for mental health. J Urban Health. 2013;90(1):83-100. https://doi.org/10.1007/s11524-012-9755-x
41. Amanatullah DF, Murasko MJ, Chona DV, Crijns TJ, Ring D, Kamal RN. Financial distress and discussing the cost of total joint arthroplasty. J Arthroplasty. 2018;33(11):3394-3397. https://doi.org/10.1016/j.arth.2018.07.010
Rising US healthcare costs coupled with high cost-sharing insurance plans have led to increased out-of-pocket healthcare expenditures, especially for those who are low income or in poorer health.1-7 Increased out-of-pocket expenditures can lead to “financial distress” (defined as the subjective level of stress felt toward one’s personal financial situation) and to “medical financial burden” (defined as the subjective assessment of financial problems relating specifically to medical costs). Financial distress and medical financial burden (defined together as “financial difficulty”) lead to impaired access and delayed presentation to care and treatment nonadherence in hopes of alleviating costs.8-12
Between 20% and 50% of families with children requiring frequent medical care report that their child’s healthcare has caused a financial difficulty.13,14 In addition to direct medical costs, these parents can also suffer from indirect costs of their child’s care, such as unemployment or missed work.15-17 Along with these families, families who are low income (generally defined as living below 200% of the Federal Poverty Level) also have higher absolute and relative out-of-pocket healthcare costs, and both groups are more likely to have unmet medical needs or to delay or forgo care.18-20 Medically complex children also represent an increasing percentage of patients admitted to children’s hospitals21,22 where their families may be more vulnerable to worsening financial difficulties caused by direct costs and income depletion—due to lost wages, transportation, and meals—associated with hospitalization.23
The hospitalized population can be readily screened and provided interventions. Although evidence on effective inpatient financial interventions is lacking, financial navigation programs piloted in the ambulatory setting that standardize financial screening and support trained financial navigators could prove a promising model for inpatient care.24-26 Therefore, understanding the prevalence of financial difficulties in this population and potential high-yield screening characteristics is critical in laying the groundwork for more robust in-hospital financial screening and support systems.
Our primary objective was to assess the prevalence of financial distress and medical financial burden in families of hospitalized children. Our secondary objective was to examine measurable factors during hospitalization that could identify families at risk for these financial difficulties to better understand how to target and implement hospital-based interventions.
METHODS
We conducted a cross-sectional survey at six university-affiliated children’s hospitals (Table 1). Each site’s institutional review board approved the study. All participants were verbally informed of the research goals of the study and provided with a research information document. Need for written informed consent was determined by each institutional review board.
Study enrollment occurred between October 2017 and November 2018, with individual sites having shorter active enrollment periods (ranging from 25 to 100 days) until sample size goals were met as explained below. Participants represented a convenience sample of parents or guardians (hereafter referred to only as “parents”), who were eligible for enrollment if their child was admitted to one of the six hospitals during the active enrollment period at that site. To avoid sampling bias, each site made an effort to enroll a consecutive sample of parents, but this was limited by resources and investigator availability. Parents were excluded if their child was admitted to a neonatal unit because of difficulty in complexity categorization and the confounding issue of mothers often being admitted simultaneously. There were no other unit-, diagnosis-, or service-based exclusions to participation. Parents were also excluded if their child was 18 years or older or if they themselves were younger than 18 years. Parents were approached once their child was identified for discharge from the hospital within 48 hours. Surveys were self-administered at the time of enrollment on provided electronic tablets. Participants at some sites were offered a $5 gift card as an incentive for survey completion.
The survey included a previously published financial distress scale (InCharge Financial Distress/Financial Wellbeing Scale [IFDFW])(Appendix).27 A question in addition to the IFDFW assessed whether families were currently experiencing financial burden from medical care28,29 and whether that burden was caused by their child (Appendix) because the IFDFW does not address the source of financial distress. The survey also included questions assessing perspectives on healthcare costs (data not presented here). The survey was refined through review by psychometric experts and members of the Family Advisory Council at the primary research site, which led to minor modifications. The final survey consisted of 40 items and was professionally translated into Spanish by a third-party company (Idem Translations). It was pilot tested by 10 parents of hospitalized children to assess for adequate comprehension and clarity; these parents were not included in the final data analysis.
Variables
The primary outcome variables were level of financial distress as defined by the IFDFW scale27 and the presence of medical financial burden. The IFDFW scale has eight questions answered on a scale of 1-10, and the final score is calculated by averaging these answers. The scale defines three categories of financial distress (high, 1-3.9; average, 4-6.9; low, 7-10); however, we dichotomized our outcome as high (<4) or not high (≥4). The outcome was analyzed as both continuous and dichotomous variables because small differences in continuous scores, if detected, may be less clinically relevant. Medical financial burden was categorized as child related, child unrelated, and none.
Our secondary aim was to identify predictors of financial distress and medical financial burden. The primary predictor variable of interest was the hospitalized child’s level of chronic disease (complex chronic disease, C-CD; noncomplex chronic disease, NC-CD; no chronic disease, no-CD) as categorized by the consensus definitions from the Center of Excellence on Quality of Care Measures for Children with Complex Needs (Appendix).30 We assigned level of chronic disease based on manual review of problem lists and diagnoses in the electronic health record (EHR) from up to 3 years prior. At sites with multiple researchers, the first five to ten charts were reviewed together to ensure consistency in categorization, but no formal assessment of interrater reliability was conducted. Other predictor variables are listed in Tables 2 and 3. Insurance payer was defined as “public” or “private” based on the documented insurance plan in the EHR. Patients with dual public and private insurance were categorized as public.
Statistical Analysis
We estimated sample size requirements using an expected mean IFDFW score with standard deviation of 5.7 ± 2 based on preliminary data from the primary study site and previously published data.27 We used a significance level of P = .05, power of 0.80, and an effect size of 0.5 points difference on the IFDFW scale between the families of children with C-CD and those with either NC-CD or no-CD. We assumed there would be unequal representation of chronic disease states, with an expectation that children with C-CD would make up approximately 40% of the total population.21,22,31 Under these assumptions, we calculated a desired total sample size of 519. This would also allow us to detect a 12% absolute difference in the rate of high financial distress between families with and without C-CD, assuming a baseline level of high financial distress of 30%.27 Our goal enrollment was 150 parents at the primary site and 75 parents at each of the other 5 sites.
We fit mixed effects logistic regression models to evaluate the odds of high financial distress and polytomous logistic regression models (for our three-level outcome) to evaluate the odds of having child-related medical financial burden vs having child-unrelated burden vs having no burden. We fit linear mixed effects models to evaluate the effect of chronic disease level and medical financial burden on mean IFDFW scores. Respondents who answered “I don’t know” to the medical financial burden question were aggregated with those who reported no medical financial burden. Models were fit as a function of chronic disease level, race, ethnicity, percentage of Federal Poverty Level (FPL), insurance payer, and having a deductible less than $1,000 per year. These models included a random intercept for facility. We also fit logistic regression models that used an interaction term between chronic disease level and percentage of FPL, as well as insurance payer and percentage of FPL, to explore potential effect modification between poverty and both chronic disease level and insurance payer on financial distress. For our models, we used the MICE package for multiple imputation to fill in missing data. We imputed 25 data sets with 25 iterations each and pooled model results using Rubin’s Rules.32 All analyses were performed in R 3.5.33
RESULTS
Of 644 parents who were invited to participate, 526 (82%) were enrolled. Participants and their hospitalized children were mostly White/Caucasian (69%) and not Hispanic/Latino (76%), with 34% of families living below 200% FPL and 274 (52%) having private insurance (Table 1). Of the hospitalized children, 225 (43%) were categorized as C-CD, 143 (27%) as NC-CD, and 157 (30%) as no-CD. All participants completed the IFDFW; however, there were five missing responses to the medical financial burden question. Table 1 lists missing demographic and financial difficulty data.
Financial Distress
The mean IFDFW score of all participants was 5.6 ± 2.1, with 125 having high financial distress (24%; 95% CI, 20-28) (Table 1). There was no difference in mean IFDFW scores among families of children with different chronic disease levels (Figure). On unadjusted and adjusted analyses, there was no association between level of chronic disease and high financial distress when C-CD and NC-CD groups were each compared with no-CD (Table 2). However, families living below 400% FPL (annual income of $100,400 for a family of four) were significantly more likely than families living at 400% FPL and above to have high financial distress. Families tended to have lower financial distress (as indicated by mean IFDFW scores) with increasing percentage of FPL; however, there were families in every FPL bracket who experienced high financial distress (Appendix Figure 1a). A secondary analysis of families below and those at or above 200% FPL did not find any significant interactions between percentage of FPL and either chronic disease level (P = .86) or insurance payer (P = .83) on financial distress.
Medical Financial Burden
Overall, 160 parents (30%; 95% CI, 27-35) reported having medical financial burden, with 86 of those parents (54%) indicating their financial burden was related to their child’s medical care (Table 1). Compared with families with no such medical financial burden, respondents with medical financial burden, either child related or child unrelated, had significantly lower mean IFDFW scores (Figure), which indicates overall higher financial distress in these families. However, some families with low financial distress also reported medical financial burden.
Adjusted analyses demonstrated that, compared with families of children with no-CD, families of children with C-CD (adjusted odds ratio [AOR], 4.98; 95% CI, 2.41-10.29) or NC-CD (AOR, 2.57; 95% CI, 1.11-5.93) had significantly higher odds of having child-related medical financial burden (Table 3). Families of children with NC-CD were also more likely than families of children with no-CD to have child-unrelated medical burden (Table 3). Percentage of FPL was the only other significant predictor of child-related and child-unrelated medical financial burden (Table 3), but as with the distribution of financial distress, medical financial burden was seen across family income brackets (Appendix Figure 1b).
DISCUSSION
In this multicenter study of parents of hospitalized children, almost one in four families experienced high financial distress and almost one in three families reported having medical financial burden, with both measures of financial difficulty affecting families across all income levels. While these percentages are not substantially higher than those seen in the general population,27,34 70% of our population was composed of children with chronic disease who are more likely to have short-term and long-term healthcare needs, which places them at risk for significant ongoing medical costs.
We hypothesized that families of children with complex chronic disease would have higher levels of financial difficulties,13,35,36 but we found that level of chronic disease was associated only with medical financial burden and not with high financial distress. Financial distress is likely multifactorial and dynamic, with different drivers across various income levels. Therefore, while medical financial burden likely contributes to high financial distress, there may be other contributing factors not captured by the IFDFW. However, subjective medical financial burden has still been associated with impaired access to care.10,34 Therefore, our results suggest that families of children with chronic diseases might be at higher risk for barriers to consistent healthcare because of the financial burden their frequent healthcare utilization incurs.
Household poverty level was also associated with financial distress and medical financial burden, although surprisingly both measures of financial difficulty were present in all FPL brackets. This highlights an important reality that financial vulnerability extends beyond income and federally defined “poverty.” Non-income factors, such as high local costs of living and the growing problem of underinsurance, may significantly contribute to financial difficulty, which may render static financial metrics such as percentage of FPL insufficient screeners. Furthermore, as evidenced by the nearly 10% of our respondents who declined to provide their income information, this is a sensitive topic for some families, so gathering income data during admission could likely be a nonstarter.
In the absence of other consistent predictors of financial difficulty that could trigger interventions such as an automatic financial counselor consult, hospitals and healthcare providers could consider implementing routine non-income based financial screening questions on admission, such as one assessing medical financial burden, as a nondiscriminatory way of identifying at-risk families and provide further education and assistance regarding their financial needs. Systematically gathering this data may also further demonstrate the need for broad financial navigation programs as a mainstay in comprehensive inpatient care.
We acknowledge several limitations of this study. Primarily, we surveyed families prior to discharge and receipt of hospitalization-related bills, and these bills could contribute significantly to financial difficulties. While the families of children with chronic disease, who likely have recurrent medical bills, did not demonstrate higher financial distress, it is possible that the overall rate of financial difficulties would have been higher had we surveyed families several weeks after discharge. Our measures of financial difficulty were also subjective and, therefore, at risk for response biases (such as recall bias) that could have misestimated the prevalence of these problems in our population. However, published literature on the IFDFW scale demonstrates concordance between the subjective score and tangible outcomes of financial distress (eg, contacting a credit agency). The IFDFW scale was validated in the general population, and although it has been used in studies of medical populations,37-41 none have been in hospitalized populations, which may affect the scale’s applicability in our study. The study was also conducted only at university-affiliated children’s hospitals, and although these hospitals are geographically diverse, most children in the United States are admitted to general or community hospitals.31 Our population was also largely White, non-Hispanic/Latino, and English speaking. Therefore, our sample may not reflect the general population of hospitalized children and their families. We also assigned levels of chronic disease based on manual EHR review. While the EHR should capture each patient’s breadth of medical issues, inaccurate or missing documentation could have led to misclassification of complexity in some cases. Additionally, our sample size was calculated to detect fairly large differences in our primary outcome, and some of our unexpected results may have resulted from this study being underpowered for detection of smaller, but perhaps still clinically relevant, differences. Finally, we do not have data for several possible confounders in our study, such as employment status, health insurance concordance among family members, or sources of supplemental income, that may impact a family’s overall financial health, along with some potential important hospital-based screening characteristics, such as admitting service team or primary diagnosis.
CONCLUSION
Financial difficulties are common in families of hospitalized pediatric patients. Low-income families and those who have children with chronic conditions are at particular risk; however, all subsets of families can be affected. Given the potential negative health outcomes financial difficulties impose on families and children, the ability to identify and support vulnerable families is a crucial component of care. Hospitalization may be a prime opportunity to identify and support our at-risk families.
Acknowledgments
The authors would like to thank the parents at each of the study sites for their participation, as well as the multiple research coordinators across the study sites for assisting in recruitment of families, survey administration, and data collection. KT Park, MD, MS (Stanford University School of Medicine) served as an adviser for the study’s design.
Disclosures
All authors have no financial relationships or conflicts of interest relevant to this article to disclose.
1. Blumberg LJ, Waidmann TA, Blavin F, Roth J. Trends in health care financial burdens, 2001 to 2009. Milbank Q. 2014;92(1):88-113. https://doi.org/10.1111/1468-0009.12042
2. Claxton G, Rae M, Long M, et al. Employer Health Benefits, 2015 Annual Survey. Kaiser Family Foundation; 2015. http://files.kff.org/attachment/report-2015-employer-health-benefits-survey
3. Long M, Rae M, Claxton G, et al. Recent trends in employer-sponsored insurance premiums. JAMA. 2016;315(1):18. https://doi.org/10.1001/jama.2015.17349
4. Patients’ perspectives on health care in the United States: A look at seven states and the nation. Press release. NPR, Robert Wood Johnson Foundation, Harvard T.H. Chan School of Public Health; February 29, 2016. Accessed February 23, 2018. https://www.rwjf.org/en/library/research/2016/02/patients--perspectives-on-health-care-in-the-united-states.html
5. May JH, Cunningham PJ. Tough trade-offs: medical bills, family finances and access to care. Issue Brief Cent Stud Health Syst Change. 2004;(85):1-4.
6. Tu HT. Rising health costs, medical debt and chronic conditions. Issue Brief Cent Stud Health Syst Change. 2004;(88):1-5.
7. Richman IB, Brodie M. A National study of burdensome health care costs among non-elderly Americans. BMC Health Serv Res. 2014;14:435. https://doi.org/10.1186/1472-6963-14-435
8. Choudhry NK, Saya UY, Shrank WH, et al. Cost-related medication underuse: prevalence among hospitalized managed care patients. J Hosp Med. 2012;7(2):104-109. https://doi.org/10.1002/jhm.948
9. QuickStats: percentage of persons of all ages who delayed or did not receive medical care during the preceding year because of cost, by U.S. Census region of residence—National Health Interview Survey, 2015. MMWR Morb Mortal Wkly Rep. 2017;66(4):121. https://dx.doi.org/10.15585/mmwr.mm6604a9
10. Doty MM, Ho A, Davis K. How High Is Too High? Implications of High-Deductible Health Plans. The Commonwealth Fund; April 1, 2005. Accessed February 24, 2018. http://www.commonwealthfund.org/publications/fund-reports/2005/apr/how-high-is-too-high--implications-of-high-deductible-health-plans
11. Doty MM, Edwards JN, Holmgren AL. Seeing Red: American Driven into Debt by Medical Bills. The Commonwealth Fund; August 1, 2005. Accessed October 24, 2018. https://www.commonwealthfund.org/publications/issue-briefs/2005/aug/seeing-red-americans-driven-debt-medical-bills
12. Altice CK, Banegas MP, Tucker-Seeley RD, Yabroff KR. Financial hardships experienced by cancer survivors: a systematic review. J Natl Cancer Inst. 2016;109(2):djw205. https://doi.org/10.1093/jnci/djw205
13. Ghandour RM, Hirai AH, Blumberg SJ, Strickland BB, Kogan MD. Financial and nonfinancial burden among families of CSHCN: changes between 2001 and 2009-2010. Acad Pediatr. 2014;14(1):92-100. https://doi.org/10.1016/j.acap.2013.10.001
14. Thomson J, Shah SS, Simmons JM, et al. Financial and social hardships in families of children with medical complexity. J Pediatr. 2016;172:187-193.e1. https://doi.org/10.1016/j.jpeds.2016.01.049
15. Kuhlthau K, Kahn R, Hill KS, Gnanasekaran S, Ettner SL. The well-being of parental caregivers of children with activity limitations. Matern Child Health J. 2010;14(2):155-163. https://doi.org/10.1007/s10995-008-0434-1
16. Kuhlthau KA, Perrin JM. Child health status and parental employment. Arch Pediatr Adolesc Med. 2001;155(12):1346-1350. https://doi.org/10.1001/archpedi.155.12.1346
17. Witt WP, Gottlieb CA, Hampton J, Litzelman K. The impact of childhood activity limitations on parental health, mental health, and workdays lost in the United States. Acad Pediatr. 2009;9(4):263-269. https://doi.org/10.1016/j.acap.2009.02.008
18. Wisk LE, Witt WP. Predictors of delayed or forgone needed health care for families with children. Pediatrics. 2012;130(6):1027-1037. https://doi.org/10.1542/peds.2012-0668
19. Davidoff AJ. Insurance for children with special health care needs: patterns of coverage and burden on families to provide adequate insurance. Pediatrics. 2004;114(2):394-403. https://doi.org/10.1542/peds.114.2.394
20. Galbraith AA, Wong ST, Kim SE, Newacheck PW. Out-of-pocket financial burden for low-income families with children: socioeconomic disparities and effects of insurance. Health Serv Res. 2005;40(6 Pt 1):1722-1736. https://doi.org/10.1111/j.1475-6773.2005.00421.x
21. Berry JG, Hall DE, Kuo DZ, et al. Hospital utilization and characteristics of patients experiencing recurrent readmissions within children’s hospitals. JAMA. 2011;305(7):682-690. https://doi.org/10.1001/jama.2011.122
22. Berry JG, Hall M, Hall DE, et al. Inpatient growth and resource use in 28 children’s hospitals: a longitudinal, multi-institutional study. JAMA Pediatrics. 2013;167(2):170-177. https://doi.org/10.1001/jamapediatrics.2013.432
23. Chang LV, Shah AN, Hoefgen ER, et al. Lost earnings and nonmedical expenses of pediatric hospitalizations. Pediatrics. 2018;142(3):e20180195. https://doi.org/10.1542/peds.2018-0195
24. Banegas MP, Dickerson JF, Friedman NL, et al. Evaluation of a novel financial navigator pilot to address patient concerns about medical care costs. Perm J. 2019;23:18-084. https://doi.org/10.7812/tpp/18-084
25. Shankaran V, Leahy T, Steelquist J, et al. Pilot feasibility study of an oncology financial navigation program. J Oncol Pract. 2018;14(2):e122-e129. https://doi.org/10.1200/jop.2017.024927
26. Yezefski T, Steelquist J, Watabayashi K, Sherman D, Shankaran V. Impact of trained oncology financial navigators on patient out-of-pocket spending. Am J Manag Care. 2018;24(5 Suppl):S74-S79.
27. Prawitz AD, Garman ET, Sorhaindo B, O’Neill B, Kim J, Drentea P. InCharge Financial Distress/Financial Well-Being Scale: Development, Administration, and Score Interpretation. J Financial Counseling Plann. 2006;17(1):34-50. https://doi.org/10.1037/t60365-000
28. Cohen RA, Kirzinger WK. Financial burden of medical care: a family perspective. NCHS Data Brief. 2014;(142):1-8.
29. Galbraith AA, Ross-Degnan D, Soumerai SB, Rosenthal MB, Gay C, Lieu TA. Nearly half of families in high-deductible health plans whose members have chronic conditions face substantial financial burden. Health Aff (Millwood). 2011;30(2):322-331. https://doi.org/10.1377/hlthaff.2010.0584
30. Simon TD, Cawthon ML, Stanford S, et al. Pediatric medical complexity algorithm: a new method to stratify children by medical complexity. Pediatrics. 2014;133(6):e1647-e1654. https://doi.org/10.1542/peds.2013-3875
31. Leyenaar JK, Ralston SL, Shieh MS, Pekow PS, Mangione-Smith R, Lindenauer PK. Epidemiology of pediatric hospitalizations at general hospitals and freestanding children’s hospitals in the United States. J Hosp Med. 2016;11(11):743-749. https://doi.org/10.1002/jhm.2624
32. Rubin DB. Multiple Imputation for Nonresponse in Surveys. John Wiley and Sons; 1987.
33. R: A language and environment for statistical computing. R Foundation for Statistical Computing; 2018. https://www.R-project.org/
34. Hamel L, Norton M, Pollitz K, Levitt L, Claxton G, Brodie M. The Burden of Medical Debt: Results from the Kaiser Family Foundation/New York Times Medical Bills Survey. Kaiser Family Foundation; January 5, 2016. Accessed February 26, 2019. https://www.kff.org/wp-content/uploads/2016/01/8806-the-burden-of-medical-debt-results-from-the-kaiser-family-foundation-new-york-times-medical-bills-survey.pdf
35. Witt WP, Litzelman K, Mandic CG, et al. Healthcare-related financial burden among families in the U.S.: the role of childhood activity limitations and income. J Fam Econ Issues. 2011;32(2):308-326. https://doi.org/10.1007/s10834-011-9253-4
36. Zan H, Scharff RL. The heterogeneity in financial and time burden of caregiving to children with chronic conditions. Matern Child Health J. 2015;19(3):615-625. https://doi.org/10.1007/s10995-014-1547-3
37. Irwin B, Kimmick G, Altomare I, et al. Patient experience and attitudes toward addressing the cost of breast cancer care. Oncologist. 2014;19(11):1135-1140. https://doi.org/10.1634/theoncologist.2014-0117
38. Meisenberg BR, Varner A, Ellis E, et al. Patient attitudes regarding the cost of illness in cancer care. Oncologist. 2015;20(10):1199-1204. https://doi.org/10.1634/theoncologist.2015-0168
39. Altomare I, Irwin B, Zafar SY, et al. Physician experience and attitudes toward addressing the cost of cancer care. J Oncol Pract. 2016;12(3):e281-288, 247-288. https://doi.org/10.1200/jop.2015.007401
40. Starkey AJ, Keane CR, Terry MA, Marx JH, Ricci EM. Financial distress and depressive symptoms among African American women: identifying financial priorities and needs and why it matters for mental health. J Urban Health. 2013;90(1):83-100. https://doi.org/10.1007/s11524-012-9755-x
41. Amanatullah DF, Murasko MJ, Chona DV, Crijns TJ, Ring D, Kamal RN. Financial distress and discussing the cost of total joint arthroplasty. J Arthroplasty. 2018;33(11):3394-3397. https://doi.org/10.1016/j.arth.2018.07.010
© 2020 Society of Hospital Medicine
Improving the Transition of Intravenous to Enteral Antibiotics in Pediatric Patients with Pneumonia or Skin and Soft Tissue Infections
Intravenous (IV) antibiotics are commonly used in hospitalized pediatric patients to treat bacterial infections. Antimicrobial stewardship guidelines published by the Infectious Diseases Society of America (IDSA) recommend institutions develop a systematic plan to convert from IV to enteral antibiotics, as early transition may reduce healthcare costs, decrease length of stay (LOS), and avoid prolonged IV access complications1 such as extravasation, thrombosis, and catheter-associated infections.2-5
Pediatric patients with community-acquired pneumonia (CAP) and mild skin and soft tissue infections (SSTI) may not require IV antibiotics, even if the patient is hospitalized.6 Although national guidelines for pediatric CAP and SSTI recommend IV antibiotics for hospitalized patients, these guidelines state that mild infections may be treated with enteral antibiotics and emphasize discontinuation of IV antibiotics when the patient meets discharge criteria.7,8 Furthermore, several enteral antibiotics used for the treatment of CAP and SSTI, such as cephalexin and clindamycin,9 have excellent bioavailability (>90%) or can achieve sufficient concentrations to attain the pharmacodynamic target (ie, amoxicillin and trimethoprim–sulfamethoxazole).10,11 Nonetheless, the guidelines do not explicitly outline criteria regarding the transition from IV to enteral antibiotics.7,8
At our institution, patients admitted to Hospital Medicine (HM) often remained on IV antibiotics until discharge. Data review revealed that antibiotic treatment of CAP and SSTI posed the greatest opportunity for early conversion to enteral therapy based on the high frequency of admissions and the ability of commonly used enteral antibiotics to attain pharmacodynamic targets. We sought to change practice culture by decoupling transition to enteral antibiotics from discharge and use administration of other enteral medications as an objective indicator for transition. Our aim was to increase the proportion of enterally administered antibiotic doses for HM patients aged >60 days admitted with uncomplicated CAP or SSTI from 44% to 75% in eight months.
METHODS
Context
Cincinnati Children’s Hospital Medical Center (CCHMC) is a large, urban, academic hospital. The HM division has 45 attendings and admits >8,000 general pediatric patients annually. The five HM teams at the main campus consist of attendings, fellows, residents, and medical students. One HM team serves as the resident quality improvement (QI) team where residents collaborate in a longitudinal study under the guidance of QI-trained coaches. The focus of this QI initiative was determined by resident consensus and aligned with a high-value care curriculum.12
To identify the target patient population, we investigated IV antimicrobials frequently used in HM patients. Ampicillin and clindamycin are commonly used IV antibiotics, most frequently corresponding with the diagnoses of CAP and SSTI, respectively, accounting for half of all antibiotic use on the HM service. Amoxicillin, the enteral equivalent of ampicillin, can achieve sufficient concentrations to attain the pharmacodynamic target at infection sites, and clindamycin has high bioavailability, making them ideal options for early transition. Our institution’s robust antimicrobial stewardship program has published local guidelines on using amoxicillin as the enteral antibiotic of choice for uncomplicated CAP, but it does not provide guidance on the timing of transition for either CAP or SSTI; the clinical team makes this decision.
HM attendings were surveyed to determine the criteria used to transition from IV to enteral antibiotics for patients with CAP or SSTI. The survey illustrated practice variability with providers using differing clinical criteria to signal the timing of transition. Additionally, only 49% of respondents (n = 37) rated themselves as “very comfortable” with residents making autonomous decisions to transition to enteral antibiotics. We chose to use the administration of other enteral medications, instead of discharge readiness, as an objective indicator of a patient’s readiness to transition to enteral antibiotics, given the low-risk patient population and the ability of the enteral antibiotics commonly used for CAP and SSTI to achieve pharmacodynamic targets.
The study population included patients aged >60 days admitted to HM with CAP or SSTI treated with any antibiotic. We excluded patients with potential complications or significant progression of their disease process, including patients with parapneumonic effusions or chest tubes, patients who underwent bronchoscopy, and patients with osteomyelitis, septic arthritis, or preseptal or orbital cellulitis. Past medical history and clinical status on admission were not used to exclude patients.
Interventions
Our multidisciplinary team, formed in January 2017, included HM attendings, HM fellows, pediatric residents, a critical care attending, a pharmacy resident, and an antimicrobial stewardship pharmacist. Under the guidance of QI coaches, the residents on the HM QI team developed and tested all interventions on their team and then determined which interventions would spread to the other four teams. The nursing director of our primary HM unit disseminated project updates to bedside nurses. A simplified failure mode and effects analysis identified areas for improvement and potential interventions. Interventions focused on the following key drivers (Figure 1): increased prescriber awareness of medication charge, standardization of conversion from IV to enteral antibiotics, clear definition of the patients ready for transition, ongoing evaluation of the antimicrobial plan, timely recognition by prescribers of patients ready for transition, culture shift regarding the appropriate administration route in the inpatient setting, and transparency of data. The team implemented sequential Plan-Do-Study-Act (PDSA) cycles13 to test the interventions.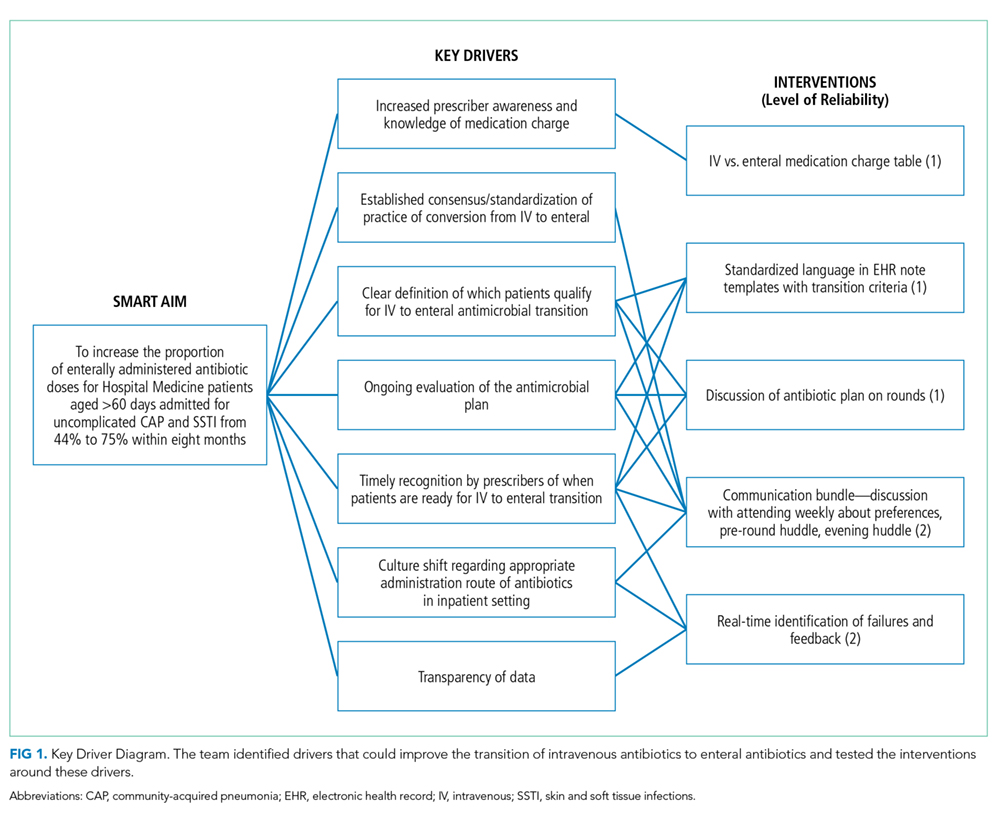
Charge Table
To improve knowledge about the increased charge for commonly used IV medications compared with enteral formulations, a table comparing relative charges was shared during monthly resident morning conferences and at an HM faculty meeting. The table included charge comparisons between ampicillin and amoxicillin and IV and enteral clindamycin.
Standardized Language in Electronic Health Record (EHR) Antibiotic Plan on Rounds
Standardized language to document antibiotic transition plans was added to admission and progress note templates in the EHR. The standard template prompted residents to (1) define clinical transition criteria, (2) discuss attending comfort with transition overnight (based on survey results), and (3) document patient preference of solid or liquid dosage forms. Plans were reviewed and updated daily. We hypothesized that since residents use the information in the daily progress notes, including assessments and plans, to present on rounds, inclusion of the transition criteria in the note would prompt transition plan discussions.
Communication Bundle
To promote early transition to enteral antibiotics, we standardized the discussion about antibiotic transition between residents and attendings. During a weekly preexisting meeting, the resident QI team reviewed preferences for transitions with the new service attending. By identifying attending preferences early, residents were able to proactively transition patients who met the criteria (eg, antibiotic transition in the evening instead of waiting until morning rounds). This discussion also provided an opportunity to engage service attendings in the QI efforts, which were also shared at HM faculty meetings quarterly.
Recognizing that in times of high census, discussion of patient plans may be abbreviated during rounds, residents were asked to identify all patients on IV antibiotics while reviewing patient medication orders prior to rounds. As part of an existing daily prerounds huddle to discuss rounding logistics, residents listed all patients on IV antibiotics and discussed which patients were ready for transition. If patients could not be transitioned immediately, the team identified the transition criteria.
At preexisting evening huddles between overnight shift HM residents and the evening HM attending, residents identified patients who were prescribed IV antibiotics and discussed readiness for enteral transition. If a patient could be transitioned overnight, enteral antibiotic orders were placed. Overnight residents were also encouraged to review the transition criteria with families upon admission.
Real-time Identification of Failures and Feedback
For two weeks, the EHR was queried daily to identify patients admitted for uncomplicated CAP and SSTI who were on antibiotics as well as other enteral medications. A failure was defined as an IV antibiotic dose given to a patient who was administered any enteral medication. Residents on the QI team approached residents on other HM teams whenever patients were identified as a failed transition to learn about failure reasons.
Study of the Interventions
Data for HM patients who met the inclusion criteria were collected weekly from January 2016 through June 2018 via EHR query. We initially searched for diagnoses that fit under the disease categories of pneumonia and SSTI in the EHR, which generated a list of International Classification of Disease-9 and -10 Diagnosis codes (Appendix Figure 1). The query identified patients based on these codes and reported whether the identified patients took a dose of any enteral medication, excluding nystatin, sildenafil, tacrolimus, and mouthwashes, which are commonly continued during NPO status due to no need for absorption or limited parenteral options. It also reported the ordered route of administration for the queried antibiotics (Appendix Figure 1).
The 2016 calendar year established our baseline to account for seasonal variability. Data were reported weekly and reviewed to evaluate the impact of PDSA cycles and inform new interventions.
Measures
Our process measure was the total number of enteral antibiotic doses divided by all antibiotic doses in patients receiving any enteral medication. We reasoned that if patients were well enough to take medications enterally, they could be given an enteral antibiotic that is highly bioavailable or readily achieves concentrations that attain pharmacodynamic targets. This practice change was a culture shift, decoupling the switch to enteral antibiotics from discharge readiness. Our EHR query reported only the antibiotic doses given to patients who took an enteral medication on the day of antibiotic administration and excluded patients who received only IV medications.
Outcome measures included antimicrobial costs per patient encounter using average wholesale prices, which were reported in our EHR query, and LOS. To ensure that transitions of IV to enteral antibiotics were not negatively impacting patient outcomes, patient readmissions within seven days served as a balancing measure.
Analysis
An annotated statistical process control p-chart tracked the impact of interventions on the proportion of antibiotic doses that were enterally administered during hospitalization. An x-bar and an s-chart tracked the impact of interventions on antimicrobial costs per patient encounter and on LOS. A p-chart and an encounters-between g-chart were used to evaluate the impact of our interventions on readmissions. Control chart rules for identifying special cause were used for center line shifts.14
Ethical Considerations
This study was part of a larger study of the residency high-value care curriculum,12 which was deemed exempt by the CCHMC IRB.
RESULTS
The baseline data collected included 372 patients and the postintervention period in 2017 included 326 patients (Table). Approximately two-thirds of patients had a diagnosis of CAP.
The percentage of antibiotic doses given enterally increased from 44% to 80% within eight months (Figure 2). When studying the impact of interventions, residents on the HM QI team found that the standard EHR template added to daily notes did not consistently prompt residents to discuss antibiotic plans and thus was abandoned. Initial improvement coincided with standardizing discussions between residents and attendings regarding transitions. Furthermore, discussion of all patients on IV antibiotics during the prerounds huddle allowed for reliable, daily communication about antibiotic plans and was subsequently spread to and adopted by all HM teams. The percentage of enterally administered antibiotic doses increased to >75% after the evening huddle, which involved all HM teams, and real-time identification of failures on all HM teams with provider feedback. Despite variability when the total number of antibiotic doses prescribed per week was low (<10), we demonstrated sustainability for 11 months (Figure 2), during which the prerounds and evening huddle discussions were continued and an updated control chart was shown monthly to residents during their educational conferences.
Residents on the QI team spoke directly with other HM residents when there were missed opportunities for transition. Based on these discussions and intermittent chart reviews, common reasons for failure to transition in patients with CAP included admission for failed outpatient enteral treatment, recent evaluation by critical care physicians for possible transfer to the intensive care unit, and difficulty weaning oxygen. For patients with SSTI, hand abscesses requiring drainage by surgery and treatment failure with other antibiotics constituted many of the IV antibiotic doses given to patients on enteral medications.
Antimicrobial costs per patient encounter decreased by 70% over one year; the shift in costs coincided with the second shift in our process measure (Appendix Figure 2A). Based on an estimate of 350 patients admitted per year for uncomplicated CAP or SSTI, this translates to an annual cost savings of approximately $29,000. The standard deviation of costs per patient encounter decreased by 84% (Appendix Figure 2B), suggesting a decrease in the variability of prescribing practices.
The average LOS in our patient population prior to intervention was 2.1 days and did not change (Appendix Figure 2C), but the standard deviation decreased by >50% (Appendix Figure 2D). There was no shift in the mean seven-day readmission rate or the number of encounters between readmissions (2.6% and 26, respectively; Appendix Figure 3). In addition, the hospital billing department did not identify an increase in insurance denials related to the route of antibiotic administration.
DISCUSSION
Summary
Using improvement science, we promoted earlier transition to enteral antibiotics for children hospitalized with uncomplicated CAP and SSTI by linking the decision for transition to the ability to take other enteral medications, rather than to discharge readiness. We increased the percentage of enterally administered antibiotic doses in this patient population from 44% to 80% in eight months. Although we did not observe a decrease in LOS as previously noted in a cost analysis study comparing pediatric patients with CAP treated with oral antibiotics versus those treated with IV antibiotics,15 we did find a decrease in LOS variability and in antimicrobial costs to our patients. These cost savings did not include potential savings from nursing or pharmacy labor. In addition, we noted a decrease in the variability in antibiotic prescribing practice, which demonstrates provider ability and willingness to couple antibiotic route transition to an objective characteristic (administration of other enteral medications).
A strength of our study was that residents, the most frequent prescribers of antibiotics on our HM service, were highly involved in the QI initiative, including defining the SMART aim, identifying key drivers, developing interventions, and completing sequential PDSA cycles. Under the guidance of QI-trained coaches, residents developed feasible interventions and assessed their success in real time. Consistent with other studies,16,17 resident buy-in and involvement led to the success of our improvement study.
Interpretation
Despite emerging evidence regarding the timing of transition to enteral antibiotics, several factors impeded early transition at our institution, including physician culture, variable practice habits, and hospital workflow. Evidence supports the use of enteral antibiotics in immunocompetent children hospitalized for uncomplicated CAP who do not have chronic lung disease, are not in shock, and have oxygen saturations >85%.6 Although existing literature suggests that in pediatric patients admitted for SSTIs not involving the eye or bone, IV antibiotics may be transitioned when clinical improvement, evidenced by a reduction in fever or erythema, is noted,6 enteral antibiotics that achieve appropriate concentrations to attain pharmacodynamic targets should have the same efficacy as that of IV antibiotics.9 Using the criterion of administration of any medication enterally to identify a patient’s readiness to transition, we were able to overcome practice variation among providers who may have differing opinions of what constitutes clinical improvement. Of note, new evidence is emerging on predictors of enteral antibiotic treatment failure in patients with CAP and SSTI to guide transition timing, but these studies have largely focused on the adult population or were performed in the outpatient and emergency department (ED) settings.18,19 Regardless, the stable number of encounters between readmissions in our patient population likely indicates that treatment failure in these patients was rare.
Rising healthcare costs have led to concerns around sustainability of the healthcare system;20,21 tackling overuse in clinical practice, as in our study, is one mitigation strategy. Several studies have used QI methods to facilitate the provision of high-value care through the decrease of continuous monitor overuse and extraneous ordering of electrolytes.22,23 Our QI study adds to the high-value care literature by safely decreasing the use of IV antibiotics. One retrospective study demonstrated that a one-day decrease in the use of IV antibiotics in pneumonia resulted in decreased costs without an increase in readmissions, similar to our findings.24 In adults, QI initiatives aimed at improving early transition of antibiotics utilized electronic trigger tools.25,26 Fischer et al. used active orders for scheduled enteral medications or an enteral diet as indication that a patient’s IV medications could be converted to enteral form.26
Our work is not without limitations. The list of ICD-9 and -10 codes used to query the EHR did not capture all diagnoses that would be considered as uncomplicated CAP or SSTI. However, we included an extensive list of diagnoses to ensure that the majority of patients meeting our inclusion criteria were captured. Our process measure did not account for patients on IV antibiotics who were not administered other enteral medications but tolerating an enteral diet. These patients were not identified in our EHR query and were not included in our process measure as a failure. However, in latter interventions, residents identified all patients on IV antibiotics, so that patients not identified by our EHR query benefited from our work. Furthermore, this QI study was conducted at a single institution and several interventions took advantage of preexisting structured huddles and a resident QI curriculum, which may not exist at other institutions. Our study does highlight that engaging frontline providers, such as residents, to review antibiotic orders consistently and question the appropriateness of the administration route is key to making incremental changes in prescribing practices.
CONCLUSIONS
Through a partnership between HM and Pharmacy and with substantial resident involvement, we improved the transition of IV antibiotics in patients with CAP or SSTI by increasing the percentage of enterally administered antibiotic doses and reducing antimicrobial costs and variability in antibiotic prescribing practices. This work illustrates how reducing overuse of IV antibiotics promotes high-value care and aligns with initiatives to prevent avoidable harm.27 Our work highlights that standardized discussions about medication orders to create consensus around enteral antibiotic transitions, real-time feedback, and challenging the status quo can influence practice habits and effect change.
Next steps include testing automated methods to notify providers of opportunities for transition from IV to enteral antibiotics through embedded clinical decision support, a method similar to the electronic trigger tools used in adult QI studies.25,26 Since our prerounds huddle includes identifying all patients on IV antibiotics, studying the transition to enteral antibiotics and its effect on prescribing practices in other diagnoses (ie, urinary tract infection and osteomyelitis) may contribute to spreading these efforts. Partnering with our ED colleagues may be an important next step, as several patients admitted to HM on IV antibiotics are given their first dose in the ED.
Acknowledgments
The authors would like to thank the faculty of the James M. Anderson Center for Health Systems Excellence Intermediate Improvement Science Series for their guidance in the planning of this project. The authors would also like to thank Ms. Ursula Bradshaw and Mr. Michael Ponti-Zins for obtaining the hospital data on length of stay and readmissions. The authors acknowledge Dr. Philip Hagedorn for his assistance with the software that queries the electronic health record and Dr. Laura Brower and Dr. Joanna Thomson for their assistance with statistical analysis. The authors are grateful to all the residents and coaches on the QI Hospital Medicine team who contributed ideas on study design and interventions.
1. Dellit TH, Owens RC, McGowan JE, Jr, et al. Infectious diseases society of America and the society for healthcare epidemiology of America guidelines for developing an institutional program to enhance antimicrobial stewardship. Clin Infect Dis. 2007;44(2):159-177. https://doi.org/10.1086/510393.
2. Shah SS, Srivastava R, Wu S, et al. Intravenous Versus oral antibiotics for postdischarge treatment of complicated pneumonia. Pediatrics. 2016;138(6). https://doi.org/10.1542/peds.2016-1692.
3. Keren R, Shah SS, Srivastava R, et al. Comparative effectiveness of intravenous vs oral antibiotics for postdischarge treatment of acute osteomyelitis in children. JAMA Pediatr. 2015;169(2):120-128. https://doi.org/10.1001/jamapediatrics.2014.2822.
4. Jumani K, Advani S, Reich NG, Gosey L, Milstone AM. Risk factors for peripherally inserted central venous catheter complications in children. JAMA Pediatr. 2013;167(5):429-435.https://doi.org/10.1001/jamapediatrics.2013.775.
5. Zaoutis T, Localio AR, Leckerman K, et al. Prolonged intravenous therapy versus early transition to oral antimicrobial therapy for acute osteomyelitis in children. Pediatrics. 2009;123(2):636-642. https://doi.org/10.1542/peds.2008-0596.
6. McMullan BJ, Andresen D, Blyth CC, et al. Antibiotic duration and timing of the switch from intravenous to oral route for bacterial infections in children: systematic review and guidelines. Lancet Infect Dis. 2016;16(8):e139-e152. https://doi.org/10.1016/S1473-3099(16)30024-X.
7. Bradley JS, Byington CL, Shah SS, et al. The management of community-acquired pneumonia in infants and children older than 3 months of age: clinical practice guidelines by the Pediatric Infectious Diseases Society and the Infectious Diseases Society of America. Clin Infect Dis. 2011;53(7):e25-e76. https://doi.org/10.1093/cid/cir531.
8. Stevens DL, Bisno AL, Chambers HF, et al. Executive summary: practice guidelines for the diagnosis and management of skin and soft tissue infections: 2014 update by the infectious diseases society of America. Clin Infect Dis. 2014;59(2):147-159. https://doi.org/10.1093/cid/ciu444.
9. MacGregor RR, Graziani AL. Oral administration of antibiotics: a rational alternative to the parenteral route. Clin Infect Dis. 1997;24(3):457-467. https://doi.org/10.1093/clinids/24.3.457.
10. Downes KJ, Hahn A, Wiles J, Courter JD, Vinks AA. Dose optimisation of antibiotics in children: application of pharmacokinetics/pharmacodynamics in paediatrics. Int J Antimicrob Agents. 2014;43(3):223-230. https://doi.org/10.1016/j.ijantimicag.2013.11.006.
11. Autmizguine J, Melloni C, Hornik CP, et al. Population pharmacokinetics of trimethoprim-sulfamethoxazole in infants and children. Antimicrob Agents Chemother. 2018;62(1):e01813-e01817. https://doi.org/10.1128/AAC.01813-17.
12. Dewan M, Herrmann LE, Tchou MJ, et al. Development and evaluation of high-value pediatrics: a high-value care pediatric resident curriculum. Hosp Pediatr. 2018;8(12):785-792. https://doi.org/10.1542/hpeds.2018-0115
13. Langley GJ, Moen RD, Nolan KM, Nolan TW, Norman CL, Provost LP. The Improvement Guide: A Practical Approach to Enhancing Organizational Performance. New Jersey, US: John Wiley & Sons; 2009.
14. Benneyan JC. Use and interpretation of statistical quality control charts. Int J Qual Health Care. 1998;10(1):69-73. https://doi.org/10.1093/intqhc/10.1.69.
15. Lorgelly PK, Atkinson M, Lakhanpaul M, et al. Oral versus i.v. antibiotics for community-acquired pneumonia in children: a cost-minimisation analysis. Eur Respir J. 2010;35(4):858-864. https://doi.org/10.1183/09031936.00087209.
16. Vidyarthi AR, Green AL, Rosenbluth G, Baron RB. Engaging residents and fellows to improve institution-wide quality: the first six years of a novel financial incentive program. Acad Med. 2014;89(3):460-468. https://doi.org/10.1097/ACM.0000000000000159.
17. Stinnett-Donnelly JM, Stevens PG, Hood VL. Developing a high value care programme from the bottom up: a programme of faculty-resident improvement projects targeting harmful or unnecessary care. BMJ Qual Saf. 2016;25(11):901-908. https://doi.org/10.1136/bmjqs-2015-004546.
18. Peterson D, McLeod S, Woolfrey K, McRae A. Predictors of failure of empiric outpatient antibiotic therapy in emergency department patients with uncomplicated cellulitis. Acad Emerg Med. 2014;21(5):526-531. https://doi.org/10.1111/acem.12371.
19. Yadav K, Suh KN, Eagles D, et al. Predictors of oral antibiotic treatment failure for non-purulent skin and soft tissue infections in the emergency department. Acad Emerg Med. 2018;20(S1):S24-S25. https://doi.org/10.1017/cem.2018.114.
20. Organisation for Economic Co-operation and Development. Healthcare costs unsustainable in advanced economies without reform. http://www.oecd.org/health/healthcarecostsunsustainableinadvancedeconomieswithoutreform.htm. Accessed June 28, 2018; 2015.
21. Berwick DM, Hackbarth AD. Eliminating waste in US health care. JAMA. 2012;307(14):1513-1516. https://doi.org/10.1001/jama.2012.362.
22. Schondelmeyer AC, Simmons JM, Statile AM, et al. Using quality improvement to reduce continuous pulse oximetry use in children with wheezing. Pediatrics. 2015;135(4):e1044-e1051. https://doi.org/10.1542/peds.2014-2295.
23. Tchou MJ, Tang Girdwood S, Wormser B, et al. Reducing electrolyte testing in hospitalized children by using quality improvement methods. Pediatrics. 2018;141(5). https://doi.org/10.1542/peds.2017-3187.
24. Christensen EW, Spaulding AB, Pomputius WF, Grapentine SP. Effects of hospital practice patterns for antibiotic administration for pneumonia on hospital lengths of stay and costs. J Pediatr Infect Dis Soc. 2019;8(2):115-121. https://doi.org/10.1093/jpids/piy003.
25. Berrevoets MAH, Pot JHLW, Houterman AE, et al. An electronic trigger tool to optimise intravenous to oral antibiotic switch: a controlled, interrupted time series study. Antimicrob Resist Infect Control. 2017;6:81. https://doi.org/10.1186/s13756-017-0239-3.
26. Fischer MA, Solomon DH, Teich JM, Avorn J. Conversion from intravenous to oral medications: assessment of a computerized intervention for hospitalized patients. Arch Intern Med. 2003;163(21):2585-2589. https://doi.org/10.1001/archinte.163.21.2585.
27. Schroeder AR, Harris SJ, Newman TB. Safely doing less: a missing component of the patient safety dialogue. Pediatrics. 2011;128(6):e1596-e1597. https://doi.org/10.1542/peds.2011-2726.
Intravenous (IV) antibiotics are commonly used in hospitalized pediatric patients to treat bacterial infections. Antimicrobial stewardship guidelines published by the Infectious Diseases Society of America (IDSA) recommend institutions develop a systematic plan to convert from IV to enteral antibiotics, as early transition may reduce healthcare costs, decrease length of stay (LOS), and avoid prolonged IV access complications1 such as extravasation, thrombosis, and catheter-associated infections.2-5
Pediatric patients with community-acquired pneumonia (CAP) and mild skin and soft tissue infections (SSTI) may not require IV antibiotics, even if the patient is hospitalized.6 Although national guidelines for pediatric CAP and SSTI recommend IV antibiotics for hospitalized patients, these guidelines state that mild infections may be treated with enteral antibiotics and emphasize discontinuation of IV antibiotics when the patient meets discharge criteria.7,8 Furthermore, several enteral antibiotics used for the treatment of CAP and SSTI, such as cephalexin and clindamycin,9 have excellent bioavailability (>90%) or can achieve sufficient concentrations to attain the pharmacodynamic target (ie, amoxicillin and trimethoprim–sulfamethoxazole).10,11 Nonetheless, the guidelines do not explicitly outline criteria regarding the transition from IV to enteral antibiotics.7,8
At our institution, patients admitted to Hospital Medicine (HM) often remained on IV antibiotics until discharge. Data review revealed that antibiotic treatment of CAP and SSTI posed the greatest opportunity for early conversion to enteral therapy based on the high frequency of admissions and the ability of commonly used enteral antibiotics to attain pharmacodynamic targets. We sought to change practice culture by decoupling transition to enteral antibiotics from discharge and use administration of other enteral medications as an objective indicator for transition. Our aim was to increase the proportion of enterally administered antibiotic doses for HM patients aged >60 days admitted with uncomplicated CAP or SSTI from 44% to 75% in eight months.
METHODS
Context
Cincinnati Children’s Hospital Medical Center (CCHMC) is a large, urban, academic hospital. The HM division has 45 attendings and admits >8,000 general pediatric patients annually. The five HM teams at the main campus consist of attendings, fellows, residents, and medical students. One HM team serves as the resident quality improvement (QI) team where residents collaborate in a longitudinal study under the guidance of QI-trained coaches. The focus of this QI initiative was determined by resident consensus and aligned with a high-value care curriculum.12
To identify the target patient population, we investigated IV antimicrobials frequently used in HM patients. Ampicillin and clindamycin are commonly used IV antibiotics, most frequently corresponding with the diagnoses of CAP and SSTI, respectively, accounting for half of all antibiotic use on the HM service. Amoxicillin, the enteral equivalent of ampicillin, can achieve sufficient concentrations to attain the pharmacodynamic target at infection sites, and clindamycin has high bioavailability, making them ideal options for early transition. Our institution’s robust antimicrobial stewardship program has published local guidelines on using amoxicillin as the enteral antibiotic of choice for uncomplicated CAP, but it does not provide guidance on the timing of transition for either CAP or SSTI; the clinical team makes this decision.
HM attendings were surveyed to determine the criteria used to transition from IV to enteral antibiotics for patients with CAP or SSTI. The survey illustrated practice variability with providers using differing clinical criteria to signal the timing of transition. Additionally, only 49% of respondents (n = 37) rated themselves as “very comfortable” with residents making autonomous decisions to transition to enteral antibiotics. We chose to use the administration of other enteral medications, instead of discharge readiness, as an objective indicator of a patient’s readiness to transition to enteral antibiotics, given the low-risk patient population and the ability of the enteral antibiotics commonly used for CAP and SSTI to achieve pharmacodynamic targets.
The study population included patients aged >60 days admitted to HM with CAP or SSTI treated with any antibiotic. We excluded patients with potential complications or significant progression of their disease process, including patients with parapneumonic effusions or chest tubes, patients who underwent bronchoscopy, and patients with osteomyelitis, septic arthritis, or preseptal or orbital cellulitis. Past medical history and clinical status on admission were not used to exclude patients.
Interventions
Our multidisciplinary team, formed in January 2017, included HM attendings, HM fellows, pediatric residents, a critical care attending, a pharmacy resident, and an antimicrobial stewardship pharmacist. Under the guidance of QI coaches, the residents on the HM QI team developed and tested all interventions on their team and then determined which interventions would spread to the other four teams. The nursing director of our primary HM unit disseminated project updates to bedside nurses. A simplified failure mode and effects analysis identified areas for improvement and potential interventions. Interventions focused on the following key drivers (Figure 1): increased prescriber awareness of medication charge, standardization of conversion from IV to enteral antibiotics, clear definition of the patients ready for transition, ongoing evaluation of the antimicrobial plan, timely recognition by prescribers of patients ready for transition, culture shift regarding the appropriate administration route in the inpatient setting, and transparency of data. The team implemented sequential Plan-Do-Study-Act (PDSA) cycles13 to test the interventions.
Charge Table
To improve knowledge about the increased charge for commonly used IV medications compared with enteral formulations, a table comparing relative charges was shared during monthly resident morning conferences and at an HM faculty meeting. The table included charge comparisons between ampicillin and amoxicillin and IV and enteral clindamycin.
Standardized Language in Electronic Health Record (EHR) Antibiotic Plan on Rounds
Standardized language to document antibiotic transition plans was added to admission and progress note templates in the EHR. The standard template prompted residents to (1) define clinical transition criteria, (2) discuss attending comfort with transition overnight (based on survey results), and (3) document patient preference of solid or liquid dosage forms. Plans were reviewed and updated daily. We hypothesized that since residents use the information in the daily progress notes, including assessments and plans, to present on rounds, inclusion of the transition criteria in the note would prompt transition plan discussions.
Communication Bundle
To promote early transition to enteral antibiotics, we standardized the discussion about antibiotic transition between residents and attendings. During a weekly preexisting meeting, the resident QI team reviewed preferences for transitions with the new service attending. By identifying attending preferences early, residents were able to proactively transition patients who met the criteria (eg, antibiotic transition in the evening instead of waiting until morning rounds). This discussion also provided an opportunity to engage service attendings in the QI efforts, which were also shared at HM faculty meetings quarterly.
Recognizing that in times of high census, discussion of patient plans may be abbreviated during rounds, residents were asked to identify all patients on IV antibiotics while reviewing patient medication orders prior to rounds. As part of an existing daily prerounds huddle to discuss rounding logistics, residents listed all patients on IV antibiotics and discussed which patients were ready for transition. If patients could not be transitioned immediately, the team identified the transition criteria.
At preexisting evening huddles between overnight shift HM residents and the evening HM attending, residents identified patients who were prescribed IV antibiotics and discussed readiness for enteral transition. If a patient could be transitioned overnight, enteral antibiotic orders were placed. Overnight residents were also encouraged to review the transition criteria with families upon admission.
Real-time Identification of Failures and Feedback
For two weeks, the EHR was queried daily to identify patients admitted for uncomplicated CAP and SSTI who were on antibiotics as well as other enteral medications. A failure was defined as an IV antibiotic dose given to a patient who was administered any enteral medication. Residents on the QI team approached residents on other HM teams whenever patients were identified as a failed transition to learn about failure reasons.
Study of the Interventions
Data for HM patients who met the inclusion criteria were collected weekly from January 2016 through June 2018 via EHR query. We initially searched for diagnoses that fit under the disease categories of pneumonia and SSTI in the EHR, which generated a list of International Classification of Disease-9 and -10 Diagnosis codes (Appendix Figure 1). The query identified patients based on these codes and reported whether the identified patients took a dose of any enteral medication, excluding nystatin, sildenafil, tacrolimus, and mouthwashes, which are commonly continued during NPO status due to no need for absorption or limited parenteral options. It also reported the ordered route of administration for the queried antibiotics (Appendix Figure 1).
The 2016 calendar year established our baseline to account for seasonal variability. Data were reported weekly and reviewed to evaluate the impact of PDSA cycles and inform new interventions.
Measures
Our process measure was the total number of enteral antibiotic doses divided by all antibiotic doses in patients receiving any enteral medication. We reasoned that if patients were well enough to take medications enterally, they could be given an enteral antibiotic that is highly bioavailable or readily achieves concentrations that attain pharmacodynamic targets. This practice change was a culture shift, decoupling the switch to enteral antibiotics from discharge readiness. Our EHR query reported only the antibiotic doses given to patients who took an enteral medication on the day of antibiotic administration and excluded patients who received only IV medications.
Outcome measures included antimicrobial costs per patient encounter using average wholesale prices, which were reported in our EHR query, and LOS. To ensure that transitions of IV to enteral antibiotics were not negatively impacting patient outcomes, patient readmissions within seven days served as a balancing measure.
Analysis
An annotated statistical process control p-chart tracked the impact of interventions on the proportion of antibiotic doses that were enterally administered during hospitalization. An x-bar and an s-chart tracked the impact of interventions on antimicrobial costs per patient encounter and on LOS. A p-chart and an encounters-between g-chart were used to evaluate the impact of our interventions on readmissions. Control chart rules for identifying special cause were used for center line shifts.14
Ethical Considerations
This study was part of a larger study of the residency high-value care curriculum,12 which was deemed exempt by the CCHMC IRB.
RESULTS
The baseline data collected included 372 patients and the postintervention period in 2017 included 326 patients (Table). Approximately two-thirds of patients had a diagnosis of CAP.
The percentage of antibiotic doses given enterally increased from 44% to 80% within eight months (Figure 2). When studying the impact of interventions, residents on the HM QI team found that the standard EHR template added to daily notes did not consistently prompt residents to discuss antibiotic plans and thus was abandoned. Initial improvement coincided with standardizing discussions between residents and attendings regarding transitions. Furthermore, discussion of all patients on IV antibiotics during the prerounds huddle allowed for reliable, daily communication about antibiotic plans and was subsequently spread to and adopted by all HM teams. The percentage of enterally administered antibiotic doses increased to >75% after the evening huddle, which involved all HM teams, and real-time identification of failures on all HM teams with provider feedback. Despite variability when the total number of antibiotic doses prescribed per week was low (<10), we demonstrated sustainability for 11 months (Figure 2), during which the prerounds and evening huddle discussions were continued and an updated control chart was shown monthly to residents during their educational conferences.
Residents on the QI team spoke directly with other HM residents when there were missed opportunities for transition. Based on these discussions and intermittent chart reviews, common reasons for failure to transition in patients with CAP included admission for failed outpatient enteral treatment, recent evaluation by critical care physicians for possible transfer to the intensive care unit, and difficulty weaning oxygen. For patients with SSTI, hand abscesses requiring drainage by surgery and treatment failure with other antibiotics constituted many of the IV antibiotic doses given to patients on enteral medications.
Antimicrobial costs per patient encounter decreased by 70% over one year; the shift in costs coincided with the second shift in our process measure (Appendix Figure 2A). Based on an estimate of 350 patients admitted per year for uncomplicated CAP or SSTI, this translates to an annual cost savings of approximately $29,000. The standard deviation of costs per patient encounter decreased by 84% (Appendix Figure 2B), suggesting a decrease in the variability of prescribing practices.
The average LOS in our patient population prior to intervention was 2.1 days and did not change (Appendix Figure 2C), but the standard deviation decreased by >50% (Appendix Figure 2D). There was no shift in the mean seven-day readmission rate or the number of encounters between readmissions (2.6% and 26, respectively; Appendix Figure 3). In addition, the hospital billing department did not identify an increase in insurance denials related to the route of antibiotic administration.
DISCUSSION
Summary
Using improvement science, we promoted earlier transition to enteral antibiotics for children hospitalized with uncomplicated CAP and SSTI by linking the decision for transition to the ability to take other enteral medications, rather than to discharge readiness. We increased the percentage of enterally administered antibiotic doses in this patient population from 44% to 80% in eight months. Although we did not observe a decrease in LOS as previously noted in a cost analysis study comparing pediatric patients with CAP treated with oral antibiotics versus those treated with IV antibiotics,15 we did find a decrease in LOS variability and in antimicrobial costs to our patients. These cost savings did not include potential savings from nursing or pharmacy labor. In addition, we noted a decrease in the variability in antibiotic prescribing practice, which demonstrates provider ability and willingness to couple antibiotic route transition to an objective characteristic (administration of other enteral medications).
A strength of our study was that residents, the most frequent prescribers of antibiotics on our HM service, were highly involved in the QI initiative, including defining the SMART aim, identifying key drivers, developing interventions, and completing sequential PDSA cycles. Under the guidance of QI-trained coaches, residents developed feasible interventions and assessed their success in real time. Consistent with other studies,16,17 resident buy-in and involvement led to the success of our improvement study.
Interpretation
Despite emerging evidence regarding the timing of transition to enteral antibiotics, several factors impeded early transition at our institution, including physician culture, variable practice habits, and hospital workflow. Evidence supports the use of enteral antibiotics in immunocompetent children hospitalized for uncomplicated CAP who do not have chronic lung disease, are not in shock, and have oxygen saturations >85%.6 Although existing literature suggests that in pediatric patients admitted for SSTIs not involving the eye or bone, IV antibiotics may be transitioned when clinical improvement, evidenced by a reduction in fever or erythema, is noted,6 enteral antibiotics that achieve appropriate concentrations to attain pharmacodynamic targets should have the same efficacy as that of IV antibiotics.9 Using the criterion of administration of any medication enterally to identify a patient’s readiness to transition, we were able to overcome practice variation among providers who may have differing opinions of what constitutes clinical improvement. Of note, new evidence is emerging on predictors of enteral antibiotic treatment failure in patients with CAP and SSTI to guide transition timing, but these studies have largely focused on the adult population or were performed in the outpatient and emergency department (ED) settings.18,19 Regardless, the stable number of encounters between readmissions in our patient population likely indicates that treatment failure in these patients was rare.
Rising healthcare costs have led to concerns around sustainability of the healthcare system;20,21 tackling overuse in clinical practice, as in our study, is one mitigation strategy. Several studies have used QI methods to facilitate the provision of high-value care through the decrease of continuous monitor overuse and extraneous ordering of electrolytes.22,23 Our QI study adds to the high-value care literature by safely decreasing the use of IV antibiotics. One retrospective study demonstrated that a one-day decrease in the use of IV antibiotics in pneumonia resulted in decreased costs without an increase in readmissions, similar to our findings.24 In adults, QI initiatives aimed at improving early transition of antibiotics utilized electronic trigger tools.25,26 Fischer et al. used active orders for scheduled enteral medications or an enteral diet as indication that a patient’s IV medications could be converted to enteral form.26
Our work is not without limitations. The list of ICD-9 and -10 codes used to query the EHR did not capture all diagnoses that would be considered as uncomplicated CAP or SSTI. However, we included an extensive list of diagnoses to ensure that the majority of patients meeting our inclusion criteria were captured. Our process measure did not account for patients on IV antibiotics who were not administered other enteral medications but tolerating an enteral diet. These patients were not identified in our EHR query and were not included in our process measure as a failure. However, in latter interventions, residents identified all patients on IV antibiotics, so that patients not identified by our EHR query benefited from our work. Furthermore, this QI study was conducted at a single institution and several interventions took advantage of preexisting structured huddles and a resident QI curriculum, which may not exist at other institutions. Our study does highlight that engaging frontline providers, such as residents, to review antibiotic orders consistently and question the appropriateness of the administration route is key to making incremental changes in prescribing practices.
CONCLUSIONS
Through a partnership between HM and Pharmacy and with substantial resident involvement, we improved the transition of IV antibiotics in patients with CAP or SSTI by increasing the percentage of enterally administered antibiotic doses and reducing antimicrobial costs and variability in antibiotic prescribing practices. This work illustrates how reducing overuse of IV antibiotics promotes high-value care and aligns with initiatives to prevent avoidable harm.27 Our work highlights that standardized discussions about medication orders to create consensus around enteral antibiotic transitions, real-time feedback, and challenging the status quo can influence practice habits and effect change.
Next steps include testing automated methods to notify providers of opportunities for transition from IV to enteral antibiotics through embedded clinical decision support, a method similar to the electronic trigger tools used in adult QI studies.25,26 Since our prerounds huddle includes identifying all patients on IV antibiotics, studying the transition to enteral antibiotics and its effect on prescribing practices in other diagnoses (ie, urinary tract infection and osteomyelitis) may contribute to spreading these efforts. Partnering with our ED colleagues may be an important next step, as several patients admitted to HM on IV antibiotics are given their first dose in the ED.
Acknowledgments
The authors would like to thank the faculty of the James M. Anderson Center for Health Systems Excellence Intermediate Improvement Science Series for their guidance in the planning of this project. The authors would also like to thank Ms. Ursula Bradshaw and Mr. Michael Ponti-Zins for obtaining the hospital data on length of stay and readmissions. The authors acknowledge Dr. Philip Hagedorn for his assistance with the software that queries the electronic health record and Dr. Laura Brower and Dr. Joanna Thomson for their assistance with statistical analysis. The authors are grateful to all the residents and coaches on the QI Hospital Medicine team who contributed ideas on study design and interventions.
1. Dellit TH, Owens RC, McGowan JE, Jr, et al. Infectious diseases society of America and the society for healthcare epidemiology of America guidelines for developing an institutional program to enhance antimicrobial stewardship. Clin Infect Dis. 2007;44(2):159-177. https://doi.org/10.1086/510393.
2. Shah SS, Srivastava R, Wu S, et al. Intravenous Versus oral antibiotics for postdischarge treatment of complicated pneumonia. Pediatrics. 2016;138(6). https://doi.org/10.1542/peds.2016-1692.
3. Keren R, Shah SS, Srivastava R, et al. Comparative effectiveness of intravenous vs oral antibiotics for postdischarge treatment of acute osteomyelitis in children. JAMA Pediatr. 2015;169(2):120-128. https://doi.org/10.1001/jamapediatrics.2014.2822.
4. Jumani K, Advani S, Reich NG, Gosey L, Milstone AM. Risk factors for peripherally inserted central venous catheter complications in children. JAMA Pediatr. 2013;167(5):429-435.https://doi.org/10.1001/jamapediatrics.2013.775.
5. Zaoutis T, Localio AR, Leckerman K, et al. Prolonged intravenous therapy versus early transition to oral antimicrobial therapy for acute osteomyelitis in children. Pediatrics. 2009;123(2):636-642. https://doi.org/10.1542/peds.2008-0596.
6. McMullan BJ, Andresen D, Blyth CC, et al. Antibiotic duration and timing of the switch from intravenous to oral route for bacterial infections in children: systematic review and guidelines. Lancet Infect Dis. 2016;16(8):e139-e152. https://doi.org/10.1016/S1473-3099(16)30024-X.
7. Bradley JS, Byington CL, Shah SS, et al. The management of community-acquired pneumonia in infants and children older than 3 months of age: clinical practice guidelines by the Pediatric Infectious Diseases Society and the Infectious Diseases Society of America. Clin Infect Dis. 2011;53(7):e25-e76. https://doi.org/10.1093/cid/cir531.
8. Stevens DL, Bisno AL, Chambers HF, et al. Executive summary: practice guidelines for the diagnosis and management of skin and soft tissue infections: 2014 update by the infectious diseases society of America. Clin Infect Dis. 2014;59(2):147-159. https://doi.org/10.1093/cid/ciu444.
9. MacGregor RR, Graziani AL. Oral administration of antibiotics: a rational alternative to the parenteral route. Clin Infect Dis. 1997;24(3):457-467. https://doi.org/10.1093/clinids/24.3.457.
10. Downes KJ, Hahn A, Wiles J, Courter JD, Vinks AA. Dose optimisation of antibiotics in children: application of pharmacokinetics/pharmacodynamics in paediatrics. Int J Antimicrob Agents. 2014;43(3):223-230. https://doi.org/10.1016/j.ijantimicag.2013.11.006.
11. Autmizguine J, Melloni C, Hornik CP, et al. Population pharmacokinetics of trimethoprim-sulfamethoxazole in infants and children. Antimicrob Agents Chemother. 2018;62(1):e01813-e01817. https://doi.org/10.1128/AAC.01813-17.
12. Dewan M, Herrmann LE, Tchou MJ, et al. Development and evaluation of high-value pediatrics: a high-value care pediatric resident curriculum. Hosp Pediatr. 2018;8(12):785-792. https://doi.org/10.1542/hpeds.2018-0115
13. Langley GJ, Moen RD, Nolan KM, Nolan TW, Norman CL, Provost LP. The Improvement Guide: A Practical Approach to Enhancing Organizational Performance. New Jersey, US: John Wiley & Sons; 2009.
14. Benneyan JC. Use and interpretation of statistical quality control charts. Int J Qual Health Care. 1998;10(1):69-73. https://doi.org/10.1093/intqhc/10.1.69.
15. Lorgelly PK, Atkinson M, Lakhanpaul M, et al. Oral versus i.v. antibiotics for community-acquired pneumonia in children: a cost-minimisation analysis. Eur Respir J. 2010;35(4):858-864. https://doi.org/10.1183/09031936.00087209.
16. Vidyarthi AR, Green AL, Rosenbluth G, Baron RB. Engaging residents and fellows to improve institution-wide quality: the first six years of a novel financial incentive program. Acad Med. 2014;89(3):460-468. https://doi.org/10.1097/ACM.0000000000000159.
17. Stinnett-Donnelly JM, Stevens PG, Hood VL. Developing a high value care programme from the bottom up: a programme of faculty-resident improvement projects targeting harmful or unnecessary care. BMJ Qual Saf. 2016;25(11):901-908. https://doi.org/10.1136/bmjqs-2015-004546.
18. Peterson D, McLeod S, Woolfrey K, McRae A. Predictors of failure of empiric outpatient antibiotic therapy in emergency department patients with uncomplicated cellulitis. Acad Emerg Med. 2014;21(5):526-531. https://doi.org/10.1111/acem.12371.
19. Yadav K, Suh KN, Eagles D, et al. Predictors of oral antibiotic treatment failure for non-purulent skin and soft tissue infections in the emergency department. Acad Emerg Med. 2018;20(S1):S24-S25. https://doi.org/10.1017/cem.2018.114.
20. Organisation for Economic Co-operation and Development. Healthcare costs unsustainable in advanced economies without reform. http://www.oecd.org/health/healthcarecostsunsustainableinadvancedeconomieswithoutreform.htm. Accessed June 28, 2018; 2015.
21. Berwick DM, Hackbarth AD. Eliminating waste in US health care. JAMA. 2012;307(14):1513-1516. https://doi.org/10.1001/jama.2012.362.
22. Schondelmeyer AC, Simmons JM, Statile AM, et al. Using quality improvement to reduce continuous pulse oximetry use in children with wheezing. Pediatrics. 2015;135(4):e1044-e1051. https://doi.org/10.1542/peds.2014-2295.
23. Tchou MJ, Tang Girdwood S, Wormser B, et al. Reducing electrolyte testing in hospitalized children by using quality improvement methods. Pediatrics. 2018;141(5). https://doi.org/10.1542/peds.2017-3187.
24. Christensen EW, Spaulding AB, Pomputius WF, Grapentine SP. Effects of hospital practice patterns for antibiotic administration for pneumonia on hospital lengths of stay and costs. J Pediatr Infect Dis Soc. 2019;8(2):115-121. https://doi.org/10.1093/jpids/piy003.
25. Berrevoets MAH, Pot JHLW, Houterman AE, et al. An electronic trigger tool to optimise intravenous to oral antibiotic switch: a controlled, interrupted time series study. Antimicrob Resist Infect Control. 2017;6:81. https://doi.org/10.1186/s13756-017-0239-3.
26. Fischer MA, Solomon DH, Teich JM, Avorn J. Conversion from intravenous to oral medications: assessment of a computerized intervention for hospitalized patients. Arch Intern Med. 2003;163(21):2585-2589. https://doi.org/10.1001/archinte.163.21.2585.
27. Schroeder AR, Harris SJ, Newman TB. Safely doing less: a missing component of the patient safety dialogue. Pediatrics. 2011;128(6):e1596-e1597. https://doi.org/10.1542/peds.2011-2726.
© 2019 Society of Hospital Medicine