User login
Financial Difficulties in Families of Hospitalized Children
Rising US healthcare costs coupled with high cost-sharing insurance plans have led to increased out-of-pocket healthcare expenditures, especially for those who are low income or in poorer health.1-7 Increased out-of-pocket expenditures can lead to “financial distress” (defined as the subjective level of stress felt toward one’s personal financial situation) and to “medical financial burden” (defined as the subjective assessment of financial problems relating specifically to medical costs). Financial distress and medical financial burden (defined together as “financial difficulty”) lead to impaired access and delayed presentation to care and treatment nonadherence in hopes of alleviating costs.8-12
Between 20% and 50% of families with children requiring frequent medical care report that their child’s healthcare has caused a financial difficulty.13,14 In addition to direct medical costs, these parents can also suffer from indirect costs of their child’s care, such as unemployment or missed work.15-17 Along with these families, families who are low income (generally defined as living below 200% of the Federal Poverty Level) also have higher absolute and relative out-of-pocket healthcare costs, and both groups are more likely to have unmet medical needs or to delay or forgo care.18-20 Medically complex children also represent an increasing percentage of patients admitted to children’s hospitals21,22 where their families may be more vulnerable to worsening financial difficulties caused by direct costs and income depletion—due to lost wages, transportation, and meals—associated with hospitalization.23
The hospitalized population can be readily screened and provided interventions. Although evidence on effective inpatient financial interventions is lacking, financial navigation programs piloted in the ambulatory setting that standardize financial screening and support trained financial navigators could prove a promising model for inpatient care.24-26 Therefore, understanding the prevalence of financial difficulties in this population and potential high-yield screening characteristics is critical in laying the groundwork for more robust in-hospital financial screening and support systems.
Our primary objective was to assess the prevalence of financial distress and medical financial burden in families of hospitalized children. Our secondary objective was to examine measurable factors during hospitalization that could identify families at risk for these financial difficulties to better understand how to target and implement hospital-based interventions.
METHODS
We conducted a cross-sectional survey at six university-affiliated children’s hospitals (Table 1). Each site’s institutional review board approved the study. All participants were verbally informed of the research goals of the study and provided with a research information document. Need for written informed consent was determined by each institutional review board.

Study enrollment occurred between October 2017 and November 2018, with individual sites having shorter active enrollment periods (ranging from 25 to 100 days) until sample size goals were met as explained below. Participants represented a convenience sample of parents or guardians (hereafter referred to only as “parents”), who were eligible for enrollment if their child was admitted to one of the six hospitals during the active enrollment period at that site. To avoid sampling bias, each site made an effort to enroll a consecutive sample of parents, but this was limited by resources and investigator availability. Parents were excluded if their child was admitted to a neonatal unit because of difficulty in complexity categorization and the confounding issue of mothers often being admitted simultaneously. There were no other unit-, diagnosis-, or service-based exclusions to participation. Parents were also excluded if their child was 18 years or older or if they themselves were younger than 18 years. Parents were approached once their child was identified for discharge from the hospital within 48 hours. Surveys were self-administered at the time of enrollment on provided electronic tablets. Participants at some sites were offered a $5 gift card as an incentive for survey completion.
The survey included a previously published financial distress scale (InCharge Financial Distress/Financial Wellbeing Scale [IFDFW])(Appendix).27 A question in addition to the IFDFW assessed whether families were currently experiencing financial burden from medical care28,29 and whether that burden was caused by their child (Appendix) because the IFDFW does not address the source of financial distress. The survey also included questions assessing perspectives on healthcare costs (data not presented here). The survey was refined through review by psychometric experts and members of the Family Advisory Council at the primary research site, which led to minor modifications. The final survey consisted of 40 items and was professionally translated into Spanish by a third-party company (Idem Translations). It was pilot tested by 10 parents of hospitalized children to assess for adequate comprehension and clarity; these parents were not included in the final data analysis.
Variables
The primary outcome variables were level of financial distress as defined by the IFDFW scale27 and the presence of medical financial burden. The IFDFW scale has eight questions answered on a scale of 1-10, and the final score is calculated by averaging these answers. The scale defines three categories of financial distress (high, 1-3.9; average, 4-6.9; low, 7-10); however, we dichotomized our outcome as high (<4) or not high (≥4). The outcome was analyzed as both continuous and dichotomous variables because small differences in continuous scores, if detected, may be less clinically relevant. Medical financial burden was categorized as child related, child unrelated, and none.

Our secondary aim was to identify predictors of financial distress and medical financial burden. The primary predictor variable of interest was the hospitalized child’s level of chronic disease (complex chronic disease, C-CD; noncomplex chronic disease, NC-CD; no chronic disease, no-CD) as categorized by the consensus definitions from the Center of Excellence on Quality of Care Measures for Children with Complex Needs (Appendix).30 We assigned level of chronic disease based on manual review of problem lists and diagnoses in the electronic health record (EHR) from up to 3 years prior. At sites with multiple researchers, the first five to ten charts were reviewed together to ensure consistency in categorization, but no formal assessment of interrater reliability was conducted. Other predictor variables are listed in Tables 2 and 3. Insurance payer was defined as “public” or “private” based on the documented insurance plan in the EHR. Patients with dual public and private insurance were categorized as public.

Statistical Analysis
We estimated sample size requirements using an expected mean IFDFW score with standard deviation of 5.7 ± 2 based on preliminary data from the primary study site and previously published data.27 We used a significance level of P = .05, power of 0.80, and an effect size of 0.5 points difference on the IFDFW scale between the families of children with C-CD and those with either NC-CD or no-CD. We assumed there would be unequal representation of chronic disease states, with an expectation that children with C-CD would make up approximately 40% of the total population.21,22,31 Under these assumptions, we calculated a desired total sample size of 519. This would also allow us to detect a 12% absolute difference in the rate of high financial distress between families with and without C-CD, assuming a baseline level of high financial distress of 30%.27 Our goal enrollment was 150 parents at the primary site and 75 parents at each of the other 5 sites.
We fit mixed effects logistic regression models to evaluate the odds of high financial distress and polytomous logistic regression models (for our three-level outcome) to evaluate the odds of having child-related medical financial burden vs having child-unrelated burden vs having no burden. We fit linear mixed effects models to evaluate the effect of chronic disease level and medical financial burden on mean IFDFW scores. Respondents who answered “I don’t know” to the medical financial burden question were aggregated with those who reported no medical financial burden. Models were fit as a function of chronic disease level, race, ethnicity, percentage of Federal Poverty Level (FPL), insurance payer, and having a deductible less than $1,000 per year. These models included a random intercept for facility. We also fit logistic regression models that used an interaction term between chronic disease level and percentage of FPL, as well as insurance payer and percentage of FPL, to explore potential effect modification between poverty and both chronic disease level and insurance payer on financial distress. For our models, we used the MICE package for multiple imputation to fill in missing data. We imputed 25 data sets with 25 iterations each and pooled model results using Rubin’s Rules.32 All analyses were performed in R 3.5.33
RESULTS
Of 644 parents who were invited to participate, 526 (82%) were enrolled. Participants and their hospitalized children were mostly White/Caucasian (69%) and not Hispanic/Latino (76%), with 34% of families living below 200% FPL and 274 (52%) having private insurance (Table 1). Of the hospitalized children, 225 (43%) were categorized as C-CD, 143 (27%) as NC-CD, and 157 (30%) as no-CD. All participants completed the IFDFW; however, there were five missing responses to the medical financial burden question. Table 1 lists missing demographic and financial difficulty data.
Financial Distress
The mean IFDFW score of all participants was 5.6 ± 2.1, with 125 having high financial distress (24%; 95% CI, 20-28) (Table 1). There was no difference in mean IFDFW scores among families of children with different chronic disease levels (Figure). On unadjusted and adjusted analyses, there was no association between level of chronic disease and high financial distress when C-CD and NC-CD groups were each compared with no-CD (Table 2). However, families living below 400% FPL (annual income of $100,400 for a family of four) were significantly more likely than families living at 400% FPL and above to have high financial distress. Families tended to have lower financial distress (as indicated by mean IFDFW scores) with increasing percentage of FPL; however, there were families in every FPL bracket who experienced high financial distress (Appendix Figure 1a). A secondary analysis of families below and those at or above 200% FPL did not find any significant interactions between percentage of FPL and either chronic disease level (P = .86) or insurance payer (P = .83) on financial distress.

Medical Financial Burden
Overall, 160 parents (30%; 95% CI, 27-35) reported having medical financial burden, with 86 of those parents (54%) indicating their financial burden was related to their child’s medical care (Table 1). Compared with families with no such medical financial burden, respondents with medical financial burden, either child related or child unrelated, had significantly lower mean IFDFW scores (Figure), which indicates overall higher financial distress in these families. However, some families with low financial distress also reported medical financial burden.
Adjusted analyses demonstrated that, compared with families of children with no-CD, families of children with C-CD (adjusted odds ratio [AOR], 4.98; 95% CI, 2.41-10.29) or NC-CD (AOR, 2.57; 95% CI, 1.11-5.93) had significantly higher odds of having child-related medical financial burden (Table 3). Families of children with NC-CD were also more likely than families of children with no-CD to have child-unrelated medical burden (Table 3). Percentage of FPL was the only other significant predictor of child-related and child-unrelated medical financial burden (Table 3), but as with the distribution of financial distress, medical financial burden was seen across family income brackets (Appendix Figure 1b).
DISCUSSION
In this multicenter study of parents of hospitalized children, almost one in four families experienced high financial distress and almost one in three families reported having medical financial burden, with both measures of financial difficulty affecting families across all income levels. While these percentages are not substantially higher than those seen in the general population,27,34 70% of our population was composed of children with chronic disease who are more likely to have short-term and long-term healthcare needs, which places them at risk for significant ongoing medical costs.
We hypothesized that families of children with complex chronic disease would have higher levels of financial difficulties,13,35,36 but we found that level of chronic disease was associated only with medical financial burden and not with high financial distress. Financial distress is likely multifactorial and dynamic, with different drivers across various income levels. Therefore, while medical financial burden likely contributes to high financial distress, there may be other contributing factors not captured by the IFDFW. However, subjective medical financial burden has still been associated with impaired access to care.10,34 Therefore, our results suggest that families of children with chronic diseases might be at higher risk for barriers to consistent healthcare because of the financial burden their frequent healthcare utilization incurs.
Household poverty level was also associated with financial distress and medical financial burden, although surprisingly both measures of financial difficulty were present in all FPL brackets. This highlights an important reality that financial vulnerability extends beyond income and federally defined “poverty.” Non-income factors, such as high local costs of living and the growing problem of underinsurance, may significantly contribute to financial difficulty, which may render static financial metrics such as percentage of FPL insufficient screeners. Furthermore, as evidenced by the nearly 10% of our respondents who declined to provide their income information, this is a sensitive topic for some families, so gathering income data during admission could likely be a nonstarter.
In the absence of other consistent predictors of financial difficulty that could trigger interventions such as an automatic financial counselor consult, hospitals and healthcare providers could consider implementing routine non-income based financial screening questions on admission, such as one assessing medical financial burden, as a nondiscriminatory way of identifying at-risk families and provide further education and assistance regarding their financial needs. Systematically gathering this data may also further demonstrate the need for broad financial navigation programs as a mainstay in comprehensive inpatient care.
We acknowledge several limitations of this study. Primarily, we surveyed families prior to discharge and receipt of hospitalization-related bills, and these bills could contribute significantly to financial difficulties. While the families of children with chronic disease, who likely have recurrent medical bills, did not demonstrate higher financial distress, it is possible that the overall rate of financial difficulties would have been higher had we surveyed families several weeks after discharge. Our measures of financial difficulty were also subjective and, therefore, at risk for response biases (such as recall bias) that could have misestimated the prevalence of these problems in our population. However, published literature on the IFDFW scale demonstrates concordance between the subjective score and tangible outcomes of financial distress (eg, contacting a credit agency). The IFDFW scale was validated in the general population, and although it has been used in studies of medical populations,37-41 none have been in hospitalized populations, which may affect the scale’s applicability in our study. The study was also conducted only at university-affiliated children’s hospitals, and although these hospitals are geographically diverse, most children in the United States are admitted to general or community hospitals.31 Our population was also largely White, non-Hispanic/Latino, and English speaking. Therefore, our sample may not reflect the general population of hospitalized children and their families. We also assigned levels of chronic disease based on manual EHR review. While the EHR should capture each patient’s breadth of medical issues, inaccurate or missing documentation could have led to misclassification of complexity in some cases. Additionally, our sample size was calculated to detect fairly large differences in our primary outcome, and some of our unexpected results may have resulted from this study being underpowered for detection of smaller, but perhaps still clinically relevant, differences. Finally, we do not have data for several possible confounders in our study, such as employment status, health insurance concordance among family members, or sources of supplemental income, that may impact a family’s overall financial health, along with some potential important hospital-based screening characteristics, such as admitting service team or primary diagnosis.
CONCLUSION
Financial difficulties are common in families of hospitalized pediatric patients. Low-income families and those who have children with chronic conditions are at particular risk; however, all subsets of families can be affected. Given the potential negative health outcomes financial difficulties impose on families and children, the ability to identify and support vulnerable families is a crucial component of care. Hospitalization may be a prime opportunity to identify and support our at-risk families.
Acknowledgments
The authors would like to thank the parents at each of the study sites for their participation, as well as the multiple research coordinators across the study sites for assisting in recruitment of families, survey administration, and data collection. KT Park, MD, MS (Stanford University School of Medicine) served as an adviser for the study’s design.
Disclosures
All authors have no financial relationships or conflicts of interest relevant to this article to disclose.
1. Blumberg LJ, Waidmann TA, Blavin F, Roth J. Trends in health care financial burdens, 2001 to 2009. Milbank Q. 2014;92(1):88-113. https://doi.org/10.1111/1468-0009.12042
2. Claxton G, Rae M, Long M, et al. Employer Health Benefits, 2015 Annual Survey. Kaiser Family Foundation; 2015. http://files.kff.org/attachment/report-2015-employer-health-benefits-survey
3. Long M, Rae M, Claxton G, et al. Recent trends in employer-sponsored insurance premiums. JAMA. 2016;315(1):18. https://doi.org/10.1001/jama.2015.17349
4. Patients’ perspectives on health care in the United States: A look at seven states and the nation. Press release. NPR, Robert Wood Johnson Foundation, Harvard T.H. Chan School of Public Health; February 29, 2016. Accessed February 23, 2018. https://www.rwjf.org/en/library/research/2016/02/patients--perspectives-on-health-care-in-the-united-states.html
5. May JH, Cunningham PJ. Tough trade-offs: medical bills, family finances and access to care. Issue Brief Cent Stud Health Syst Change. 2004;(85):1-4.
6. Tu HT. Rising health costs, medical debt and chronic conditions. Issue Brief Cent Stud Health Syst Change. 2004;(88):1-5.
7. Richman IB, Brodie M. A National study of burdensome health care costs among non-elderly Americans. BMC Health Serv Res. 2014;14:435. https://doi.org/10.1186/1472-6963-14-435
8. Choudhry NK, Saya UY, Shrank WH, et al. Cost-related medication underuse: prevalence among hospitalized managed care patients. J Hosp Med. 2012;7(2):104-109. https://doi.org/10.1002/jhm.948
9. QuickStats: percentage of persons of all ages who delayed or did not receive medical care during the preceding year because of cost, by U.S. Census region of residence—National Health Interview Survey, 2015. MMWR Morb Mortal Wkly Rep. 2017;66(4):121. https://dx.doi.org/10.15585/mmwr.mm6604a9
10. Doty MM, Ho A, Davis K. How High Is Too High? Implications of High-Deductible Health Plans. The Commonwealth Fund; April 1, 2005. Accessed February 24, 2018. http://www.commonwealthfund.org/publications/fund-reports/2005/apr/how-high-is-too-high--implications-of-high-deductible-health-plans
11. Doty MM, Edwards JN, Holmgren AL. Seeing Red: American Driven into Debt by Medical Bills. The Commonwealth Fund; August 1, 2005. Accessed October 24, 2018. https://www.commonwealthfund.org/publications/issue-briefs/2005/aug/seeing-red-americans-driven-debt-medical-bills
12. Altice CK, Banegas MP, Tucker-Seeley RD, Yabroff KR. Financial hardships experienced by cancer survivors: a systematic review. J Natl Cancer Inst. 2016;109(2):djw205. https://doi.org/10.1093/jnci/djw205
13. Ghandour RM, Hirai AH, Blumberg SJ, Strickland BB, Kogan MD. Financial and nonfinancial burden among families of CSHCN: changes between 2001 and 2009-2010. Acad Pediatr. 2014;14(1):92-100. https://doi.org/10.1016/j.acap.2013.10.001
14. Thomson J, Shah SS, Simmons JM, et al. Financial and social hardships in families of children with medical complexity. J Pediatr. 2016;172:187-193.e1. https://doi.org/10.1016/j.jpeds.2016.01.049
15. Kuhlthau K, Kahn R, Hill KS, Gnanasekaran S, Ettner SL. The well-being of parental caregivers of children with activity limitations. Matern Child Health J. 2010;14(2):155-163. https://doi.org/10.1007/s10995-008-0434-1
16. Kuhlthau KA, Perrin JM. Child health status and parental employment. Arch Pediatr Adolesc Med. 2001;155(12):1346-1350. https://doi.org/10.1001/archpedi.155.12.1346
17. Witt WP, Gottlieb CA, Hampton J, Litzelman K. The impact of childhood activity limitations on parental health, mental health, and workdays lost in the United States. Acad Pediatr. 2009;9(4):263-269. https://doi.org/10.1016/j.acap.2009.02.008
18. Wisk LE, Witt WP. Predictors of delayed or forgone needed health care for families with children. Pediatrics. 2012;130(6):1027-1037. https://doi.org/10.1542/peds.2012-0668
19. Davidoff AJ. Insurance for children with special health care needs: patterns of coverage and burden on families to provide adequate insurance. Pediatrics. 2004;114(2):394-403. https://doi.org/10.1542/peds.114.2.394
20. Galbraith AA, Wong ST, Kim SE, Newacheck PW. Out-of-pocket financial burden for low-income families with children: socioeconomic disparities and effects of insurance. Health Serv Res. 2005;40(6 Pt 1):1722-1736. https://doi.org/10.1111/j.1475-6773.2005.00421.x
21. Berry JG, Hall DE, Kuo DZ, et al. Hospital utilization and characteristics of patients experiencing recurrent readmissions within children’s hospitals. JAMA. 2011;305(7):682-690. https://doi.org/10.1001/jama.2011.122
22. Berry JG, Hall M, Hall DE, et al. Inpatient growth and resource use in 28 children’s hospitals: a longitudinal, multi-institutional study. JAMA Pediatrics. 2013;167(2):170-177. https://doi.org/10.1001/jamapediatrics.2013.432
23. Chang LV, Shah AN, Hoefgen ER, et al. Lost earnings and nonmedical expenses of pediatric hospitalizations. Pediatrics. 2018;142(3):e20180195. https://doi.org/10.1542/peds.2018-0195
24. Banegas MP, Dickerson JF, Friedman NL, et al. Evaluation of a novel financial navigator pilot to address patient concerns about medical care costs. Perm J. 2019;23:18-084. https://doi.org/10.7812/tpp/18-084
25. Shankaran V, Leahy T, Steelquist J, et al. Pilot feasibility study of an oncology financial navigation program. J Oncol Pract. 2018;14(2):e122-e129. https://doi.org/10.1200/jop.2017.024927
26. Yezefski T, Steelquist J, Watabayashi K, Sherman D, Shankaran V. Impact of trained oncology financial navigators on patient out-of-pocket spending. Am J Manag Care. 2018;24(5 Suppl):S74-S79.
27. Prawitz AD, Garman ET, Sorhaindo B, O’Neill B, Kim J, Drentea P. InCharge Financial Distress/Financial Well-Being Scale: Development, Administration, and Score Interpretation. J Financial Counseling Plann. 2006;17(1):34-50. https://doi.org/10.1037/t60365-000
28. Cohen RA, Kirzinger WK. Financial burden of medical care: a family perspective. NCHS Data Brief. 2014;(142):1-8.
29. Galbraith AA, Ross-Degnan D, Soumerai SB, Rosenthal MB, Gay C, Lieu TA. Nearly half of families in high-deductible health plans whose members have chronic conditions face substantial financial burden. Health Aff (Millwood). 2011;30(2):322-331. https://doi.org/10.1377/hlthaff.2010.0584
30. Simon TD, Cawthon ML, Stanford S, et al. Pediatric medical complexity algorithm: a new method to stratify children by medical complexity. Pediatrics. 2014;133(6):e1647-e1654. https://doi.org/10.1542/peds.2013-3875
31. Leyenaar JK, Ralston SL, Shieh MS, Pekow PS, Mangione-Smith R, Lindenauer PK. Epidemiology of pediatric hospitalizations at general hospitals and freestanding children’s hospitals in the United States. J Hosp Med. 2016;11(11):743-749. https://doi.org/10.1002/jhm.2624
32. Rubin DB. Multiple Imputation for Nonresponse in Surveys. John Wiley and Sons; 1987.
33. R: A language and environment for statistical computing. R Foundation for Statistical Computing; 2018. https://www.R-project.org/
34. Hamel L, Norton M, Pollitz K, Levitt L, Claxton G, Brodie M. The Burden of Medical Debt: Results from the Kaiser Family Foundation/New York Times Medical Bills Survey. Kaiser Family Foundation; January 5, 2016. Accessed February 26, 2019. https://www.kff.org/wp-content/uploads/2016/01/8806-the-burden-of-medical-debt-results-from-the-kaiser-family-foundation-new-york-times-medical-bills-survey.pdf
35. Witt WP, Litzelman K, Mandic CG, et al. Healthcare-related financial burden among families in the U.S.: the role of childhood activity limitations and income. J Fam Econ Issues. 2011;32(2):308-326. https://doi.org/10.1007/s10834-011-9253-4
36. Zan H, Scharff RL. The heterogeneity in financial and time burden of caregiving to children with chronic conditions. Matern Child Health J. 2015;19(3):615-625. https://doi.org/10.1007/s10995-014-1547-3
37. Irwin B, Kimmick G, Altomare I, et al. Patient experience and attitudes toward addressing the cost of breast cancer care. Oncologist. 2014;19(11):1135-1140. https://doi.org/10.1634/theoncologist.2014-0117
38. Meisenberg BR, Varner A, Ellis E, et al. Patient attitudes regarding the cost of illness in cancer care. Oncologist. 2015;20(10):1199-1204. https://doi.org/10.1634/theoncologist.2015-0168
39. Altomare I, Irwin B, Zafar SY, et al. Physician experience and attitudes toward addressing the cost of cancer care. J Oncol Pract. 2016;12(3):e281-288, 247-288. https://doi.org/10.1200/jop.2015.007401
40. Starkey AJ, Keane CR, Terry MA, Marx JH, Ricci EM. Financial distress and depressive symptoms among African American women: identifying financial priorities and needs and why it matters for mental health. J Urban Health. 2013;90(1):83-100. https://doi.org/10.1007/s11524-012-9755-x
41. Amanatullah DF, Murasko MJ, Chona DV, Crijns TJ, Ring D, Kamal RN. Financial distress and discussing the cost of total joint arthroplasty. J Arthroplasty. 2018;33(11):3394-3397. https://doi.org/10.1016/j.arth.2018.07.010
Rising US healthcare costs coupled with high cost-sharing insurance plans have led to increased out-of-pocket healthcare expenditures, especially for those who are low income or in poorer health.1-7 Increased out-of-pocket expenditures can lead to “financial distress” (defined as the subjective level of stress felt toward one’s personal financial situation) and to “medical financial burden” (defined as the subjective assessment of financial problems relating specifically to medical costs). Financial distress and medical financial burden (defined together as “financial difficulty”) lead to impaired access and delayed presentation to care and treatment nonadherence in hopes of alleviating costs.8-12
Between 20% and 50% of families with children requiring frequent medical care report that their child’s healthcare has caused a financial difficulty.13,14 In addition to direct medical costs, these parents can also suffer from indirect costs of their child’s care, such as unemployment or missed work.15-17 Along with these families, families who are low income (generally defined as living below 200% of the Federal Poverty Level) also have higher absolute and relative out-of-pocket healthcare costs, and both groups are more likely to have unmet medical needs or to delay or forgo care.18-20 Medically complex children also represent an increasing percentage of patients admitted to children’s hospitals21,22 where their families may be more vulnerable to worsening financial difficulties caused by direct costs and income depletion—due to lost wages, transportation, and meals—associated with hospitalization.23
The hospitalized population can be readily screened and provided interventions. Although evidence on effective inpatient financial interventions is lacking, financial navigation programs piloted in the ambulatory setting that standardize financial screening and support trained financial navigators could prove a promising model for inpatient care.24-26 Therefore, understanding the prevalence of financial difficulties in this population and potential high-yield screening characteristics is critical in laying the groundwork for more robust in-hospital financial screening and support systems.
Our primary objective was to assess the prevalence of financial distress and medical financial burden in families of hospitalized children. Our secondary objective was to examine measurable factors during hospitalization that could identify families at risk for these financial difficulties to better understand how to target and implement hospital-based interventions.
METHODS
We conducted a cross-sectional survey at six university-affiliated children’s hospitals (Table 1). Each site’s institutional review board approved the study. All participants were verbally informed of the research goals of the study and provided with a research information document. Need for written informed consent was determined by each institutional review board.
Study enrollment occurred between October 2017 and November 2018, with individual sites having shorter active enrollment periods (ranging from 25 to 100 days) until sample size goals were met as explained below. Participants represented a convenience sample of parents or guardians (hereafter referred to only as “parents”), who were eligible for enrollment if their child was admitted to one of the six hospitals during the active enrollment period at that site. To avoid sampling bias, each site made an effort to enroll a consecutive sample of parents, but this was limited by resources and investigator availability. Parents were excluded if their child was admitted to a neonatal unit because of difficulty in complexity categorization and the confounding issue of mothers often being admitted simultaneously. There were no other unit-, diagnosis-, or service-based exclusions to participation. Parents were also excluded if their child was 18 years or older or if they themselves were younger than 18 years. Parents were approached once their child was identified for discharge from the hospital within 48 hours. Surveys were self-administered at the time of enrollment on provided electronic tablets. Participants at some sites were offered a $5 gift card as an incentive for survey completion.
The survey included a previously published financial distress scale (InCharge Financial Distress/Financial Wellbeing Scale [IFDFW])(Appendix).27 A question in addition to the IFDFW assessed whether families were currently experiencing financial burden from medical care28,29 and whether that burden was caused by their child (Appendix) because the IFDFW does not address the source of financial distress. The survey also included questions assessing perspectives on healthcare costs (data not presented here). The survey was refined through review by psychometric experts and members of the Family Advisory Council at the primary research site, which led to minor modifications. The final survey consisted of 40 items and was professionally translated into Spanish by a third-party company (Idem Translations). It was pilot tested by 10 parents of hospitalized children to assess for adequate comprehension and clarity; these parents were not included in the final data analysis.
Variables
The primary outcome variables were level of financial distress as defined by the IFDFW scale27 and the presence of medical financial burden. The IFDFW scale has eight questions answered on a scale of 1-10, and the final score is calculated by averaging these answers. The scale defines three categories of financial distress (high, 1-3.9; average, 4-6.9; low, 7-10); however, we dichotomized our outcome as high (<4) or not high (≥4). The outcome was analyzed as both continuous and dichotomous variables because small differences in continuous scores, if detected, may be less clinically relevant. Medical financial burden was categorized as child related, child unrelated, and none.
Our secondary aim was to identify predictors of financial distress and medical financial burden. The primary predictor variable of interest was the hospitalized child’s level of chronic disease (complex chronic disease, C-CD; noncomplex chronic disease, NC-CD; no chronic disease, no-CD) as categorized by the consensus definitions from the Center of Excellence on Quality of Care Measures for Children with Complex Needs (Appendix).30 We assigned level of chronic disease based on manual review of problem lists and diagnoses in the electronic health record (EHR) from up to 3 years prior. At sites with multiple researchers, the first five to ten charts were reviewed together to ensure consistency in categorization, but no formal assessment of interrater reliability was conducted. Other predictor variables are listed in Tables 2 and 3. Insurance payer was defined as “public” or “private” based on the documented insurance plan in the EHR. Patients with dual public and private insurance were categorized as public.
Statistical Analysis
We estimated sample size requirements using an expected mean IFDFW score with standard deviation of 5.7 ± 2 based on preliminary data from the primary study site and previously published data.27 We used a significance level of P = .05, power of 0.80, and an effect size of 0.5 points difference on the IFDFW scale between the families of children with C-CD and those with either NC-CD or no-CD. We assumed there would be unequal representation of chronic disease states, with an expectation that children with C-CD would make up approximately 40% of the total population.21,22,31 Under these assumptions, we calculated a desired total sample size of 519. This would also allow us to detect a 12% absolute difference in the rate of high financial distress between families with and without C-CD, assuming a baseline level of high financial distress of 30%.27 Our goal enrollment was 150 parents at the primary site and 75 parents at each of the other 5 sites.
We fit mixed effects logistic regression models to evaluate the odds of high financial distress and polytomous logistic regression models (for our three-level outcome) to evaluate the odds of having child-related medical financial burden vs having child-unrelated burden vs having no burden. We fit linear mixed effects models to evaluate the effect of chronic disease level and medical financial burden on mean IFDFW scores. Respondents who answered “I don’t know” to the medical financial burden question were aggregated with those who reported no medical financial burden. Models were fit as a function of chronic disease level, race, ethnicity, percentage of Federal Poverty Level (FPL), insurance payer, and having a deductible less than $1,000 per year. These models included a random intercept for facility. We also fit logistic regression models that used an interaction term between chronic disease level and percentage of FPL, as well as insurance payer and percentage of FPL, to explore potential effect modification between poverty and both chronic disease level and insurance payer on financial distress. For our models, we used the MICE package for multiple imputation to fill in missing data. We imputed 25 data sets with 25 iterations each and pooled model results using Rubin’s Rules.32 All analyses were performed in R 3.5.33
RESULTS
Of 644 parents who were invited to participate, 526 (82%) were enrolled. Participants and their hospitalized children were mostly White/Caucasian (69%) and not Hispanic/Latino (76%), with 34% of families living below 200% FPL and 274 (52%) having private insurance (Table 1). Of the hospitalized children, 225 (43%) were categorized as C-CD, 143 (27%) as NC-CD, and 157 (30%) as no-CD. All participants completed the IFDFW; however, there were five missing responses to the medical financial burden question. Table 1 lists missing demographic and financial difficulty data.
Financial Distress
The mean IFDFW score of all participants was 5.6 ± 2.1, with 125 having high financial distress (24%; 95% CI, 20-28) (Table 1). There was no difference in mean IFDFW scores among families of children with different chronic disease levels (Figure). On unadjusted and adjusted analyses, there was no association between level of chronic disease and high financial distress when C-CD and NC-CD groups were each compared with no-CD (Table 2). However, families living below 400% FPL (annual income of $100,400 for a family of four) were significantly more likely than families living at 400% FPL and above to have high financial distress. Families tended to have lower financial distress (as indicated by mean IFDFW scores) with increasing percentage of FPL; however, there were families in every FPL bracket who experienced high financial distress (Appendix Figure 1a). A secondary analysis of families below and those at or above 200% FPL did not find any significant interactions between percentage of FPL and either chronic disease level (P = .86) or insurance payer (P = .83) on financial distress.
Medical Financial Burden
Overall, 160 parents (30%; 95% CI, 27-35) reported having medical financial burden, with 86 of those parents (54%) indicating their financial burden was related to their child’s medical care (Table 1). Compared with families with no such medical financial burden, respondents with medical financial burden, either child related or child unrelated, had significantly lower mean IFDFW scores (Figure), which indicates overall higher financial distress in these families. However, some families with low financial distress also reported medical financial burden.
Adjusted analyses demonstrated that, compared with families of children with no-CD, families of children with C-CD (adjusted odds ratio [AOR], 4.98; 95% CI, 2.41-10.29) or NC-CD (AOR, 2.57; 95% CI, 1.11-5.93) had significantly higher odds of having child-related medical financial burden (Table 3). Families of children with NC-CD were also more likely than families of children with no-CD to have child-unrelated medical burden (Table 3). Percentage of FPL was the only other significant predictor of child-related and child-unrelated medical financial burden (Table 3), but as with the distribution of financial distress, medical financial burden was seen across family income brackets (Appendix Figure 1b).
DISCUSSION
In this multicenter study of parents of hospitalized children, almost one in four families experienced high financial distress and almost one in three families reported having medical financial burden, with both measures of financial difficulty affecting families across all income levels. While these percentages are not substantially higher than those seen in the general population,27,34 70% of our population was composed of children with chronic disease who are more likely to have short-term and long-term healthcare needs, which places them at risk for significant ongoing medical costs.
We hypothesized that families of children with complex chronic disease would have higher levels of financial difficulties,13,35,36 but we found that level of chronic disease was associated only with medical financial burden and not with high financial distress. Financial distress is likely multifactorial and dynamic, with different drivers across various income levels. Therefore, while medical financial burden likely contributes to high financial distress, there may be other contributing factors not captured by the IFDFW. However, subjective medical financial burden has still been associated with impaired access to care.10,34 Therefore, our results suggest that families of children with chronic diseases might be at higher risk for barriers to consistent healthcare because of the financial burden their frequent healthcare utilization incurs.
Household poverty level was also associated with financial distress and medical financial burden, although surprisingly both measures of financial difficulty were present in all FPL brackets. This highlights an important reality that financial vulnerability extends beyond income and federally defined “poverty.” Non-income factors, such as high local costs of living and the growing problem of underinsurance, may significantly contribute to financial difficulty, which may render static financial metrics such as percentage of FPL insufficient screeners. Furthermore, as evidenced by the nearly 10% of our respondents who declined to provide their income information, this is a sensitive topic for some families, so gathering income data during admission could likely be a nonstarter.
In the absence of other consistent predictors of financial difficulty that could trigger interventions such as an automatic financial counselor consult, hospitals and healthcare providers could consider implementing routine non-income based financial screening questions on admission, such as one assessing medical financial burden, as a nondiscriminatory way of identifying at-risk families and provide further education and assistance regarding their financial needs. Systematically gathering this data may also further demonstrate the need for broad financial navigation programs as a mainstay in comprehensive inpatient care.
We acknowledge several limitations of this study. Primarily, we surveyed families prior to discharge and receipt of hospitalization-related bills, and these bills could contribute significantly to financial difficulties. While the families of children with chronic disease, who likely have recurrent medical bills, did not demonstrate higher financial distress, it is possible that the overall rate of financial difficulties would have been higher had we surveyed families several weeks after discharge. Our measures of financial difficulty were also subjective and, therefore, at risk for response biases (such as recall bias) that could have misestimated the prevalence of these problems in our population. However, published literature on the IFDFW scale demonstrates concordance between the subjective score and tangible outcomes of financial distress (eg, contacting a credit agency). The IFDFW scale was validated in the general population, and although it has been used in studies of medical populations,37-41 none have been in hospitalized populations, which may affect the scale’s applicability in our study. The study was also conducted only at university-affiliated children’s hospitals, and although these hospitals are geographically diverse, most children in the United States are admitted to general or community hospitals.31 Our population was also largely White, non-Hispanic/Latino, and English speaking. Therefore, our sample may not reflect the general population of hospitalized children and their families. We also assigned levels of chronic disease based on manual EHR review. While the EHR should capture each patient’s breadth of medical issues, inaccurate or missing documentation could have led to misclassification of complexity in some cases. Additionally, our sample size was calculated to detect fairly large differences in our primary outcome, and some of our unexpected results may have resulted from this study being underpowered for detection of smaller, but perhaps still clinically relevant, differences. Finally, we do not have data for several possible confounders in our study, such as employment status, health insurance concordance among family members, or sources of supplemental income, that may impact a family’s overall financial health, along with some potential important hospital-based screening characteristics, such as admitting service team or primary diagnosis.
CONCLUSION
Financial difficulties are common in families of hospitalized pediatric patients. Low-income families and those who have children with chronic conditions are at particular risk; however, all subsets of families can be affected. Given the potential negative health outcomes financial difficulties impose on families and children, the ability to identify and support vulnerable families is a crucial component of care. Hospitalization may be a prime opportunity to identify and support our at-risk families.
Acknowledgments
The authors would like to thank the parents at each of the study sites for their participation, as well as the multiple research coordinators across the study sites for assisting in recruitment of families, survey administration, and data collection. KT Park, MD, MS (Stanford University School of Medicine) served as an adviser for the study’s design.
Disclosures
All authors have no financial relationships or conflicts of interest relevant to this article to disclose.
1. Blumberg LJ, Waidmann TA, Blavin F, Roth J. Trends in health care financial burdens, 2001 to 2009. Milbank Q. 2014;92(1):88-113. https://doi.org/10.1111/1468-0009.12042
2. Claxton G, Rae M, Long M, et al. Employer Health Benefits, 2015 Annual Survey. Kaiser Family Foundation; 2015. http://files.kff.org/attachment/report-2015-employer-health-benefits-survey
3. Long M, Rae M, Claxton G, et al. Recent trends in employer-sponsored insurance premiums. JAMA. 2016;315(1):18. https://doi.org/10.1001/jama.2015.17349
4. Patients’ perspectives on health care in the United States: A look at seven states and the nation. Press release. NPR, Robert Wood Johnson Foundation, Harvard T.H. Chan School of Public Health; February 29, 2016. Accessed February 23, 2018. https://www.rwjf.org/en/library/research/2016/02/patients--perspectives-on-health-care-in-the-united-states.html
5. May JH, Cunningham PJ. Tough trade-offs: medical bills, family finances and access to care. Issue Brief Cent Stud Health Syst Change. 2004;(85):1-4.
6. Tu HT. Rising health costs, medical debt and chronic conditions. Issue Brief Cent Stud Health Syst Change. 2004;(88):1-5.
7. Richman IB, Brodie M. A National study of burdensome health care costs among non-elderly Americans. BMC Health Serv Res. 2014;14:435. https://doi.org/10.1186/1472-6963-14-435
8. Choudhry NK, Saya UY, Shrank WH, et al. Cost-related medication underuse: prevalence among hospitalized managed care patients. J Hosp Med. 2012;7(2):104-109. https://doi.org/10.1002/jhm.948
9. QuickStats: percentage of persons of all ages who delayed or did not receive medical care during the preceding year because of cost, by U.S. Census region of residence—National Health Interview Survey, 2015. MMWR Morb Mortal Wkly Rep. 2017;66(4):121. https://dx.doi.org/10.15585/mmwr.mm6604a9
10. Doty MM, Ho A, Davis K. How High Is Too High? Implications of High-Deductible Health Plans. The Commonwealth Fund; April 1, 2005. Accessed February 24, 2018. http://www.commonwealthfund.org/publications/fund-reports/2005/apr/how-high-is-too-high--implications-of-high-deductible-health-plans
11. Doty MM, Edwards JN, Holmgren AL. Seeing Red: American Driven into Debt by Medical Bills. The Commonwealth Fund; August 1, 2005. Accessed October 24, 2018. https://www.commonwealthfund.org/publications/issue-briefs/2005/aug/seeing-red-americans-driven-debt-medical-bills
12. Altice CK, Banegas MP, Tucker-Seeley RD, Yabroff KR. Financial hardships experienced by cancer survivors: a systematic review. J Natl Cancer Inst. 2016;109(2):djw205. https://doi.org/10.1093/jnci/djw205
13. Ghandour RM, Hirai AH, Blumberg SJ, Strickland BB, Kogan MD. Financial and nonfinancial burden among families of CSHCN: changes between 2001 and 2009-2010. Acad Pediatr. 2014;14(1):92-100. https://doi.org/10.1016/j.acap.2013.10.001
14. Thomson J, Shah SS, Simmons JM, et al. Financial and social hardships in families of children with medical complexity. J Pediatr. 2016;172:187-193.e1. https://doi.org/10.1016/j.jpeds.2016.01.049
15. Kuhlthau K, Kahn R, Hill KS, Gnanasekaran S, Ettner SL. The well-being of parental caregivers of children with activity limitations. Matern Child Health J. 2010;14(2):155-163. https://doi.org/10.1007/s10995-008-0434-1
16. Kuhlthau KA, Perrin JM. Child health status and parental employment. Arch Pediatr Adolesc Med. 2001;155(12):1346-1350. https://doi.org/10.1001/archpedi.155.12.1346
17. Witt WP, Gottlieb CA, Hampton J, Litzelman K. The impact of childhood activity limitations on parental health, mental health, and workdays lost in the United States. Acad Pediatr. 2009;9(4):263-269. https://doi.org/10.1016/j.acap.2009.02.008
18. Wisk LE, Witt WP. Predictors of delayed or forgone needed health care for families with children. Pediatrics. 2012;130(6):1027-1037. https://doi.org/10.1542/peds.2012-0668
19. Davidoff AJ. Insurance for children with special health care needs: patterns of coverage and burden on families to provide adequate insurance. Pediatrics. 2004;114(2):394-403. https://doi.org/10.1542/peds.114.2.394
20. Galbraith AA, Wong ST, Kim SE, Newacheck PW. Out-of-pocket financial burden for low-income families with children: socioeconomic disparities and effects of insurance. Health Serv Res. 2005;40(6 Pt 1):1722-1736. https://doi.org/10.1111/j.1475-6773.2005.00421.x
21. Berry JG, Hall DE, Kuo DZ, et al. Hospital utilization and characteristics of patients experiencing recurrent readmissions within children’s hospitals. JAMA. 2011;305(7):682-690. https://doi.org/10.1001/jama.2011.122
22. Berry JG, Hall M, Hall DE, et al. Inpatient growth and resource use in 28 children’s hospitals: a longitudinal, multi-institutional study. JAMA Pediatrics. 2013;167(2):170-177. https://doi.org/10.1001/jamapediatrics.2013.432
23. Chang LV, Shah AN, Hoefgen ER, et al. Lost earnings and nonmedical expenses of pediatric hospitalizations. Pediatrics. 2018;142(3):e20180195. https://doi.org/10.1542/peds.2018-0195
24. Banegas MP, Dickerson JF, Friedman NL, et al. Evaluation of a novel financial navigator pilot to address patient concerns about medical care costs. Perm J. 2019;23:18-084. https://doi.org/10.7812/tpp/18-084
25. Shankaran V, Leahy T, Steelquist J, et al. Pilot feasibility study of an oncology financial navigation program. J Oncol Pract. 2018;14(2):e122-e129. https://doi.org/10.1200/jop.2017.024927
26. Yezefski T, Steelquist J, Watabayashi K, Sherman D, Shankaran V. Impact of trained oncology financial navigators on patient out-of-pocket spending. Am J Manag Care. 2018;24(5 Suppl):S74-S79.
27. Prawitz AD, Garman ET, Sorhaindo B, O’Neill B, Kim J, Drentea P. InCharge Financial Distress/Financial Well-Being Scale: Development, Administration, and Score Interpretation. J Financial Counseling Plann. 2006;17(1):34-50. https://doi.org/10.1037/t60365-000
28. Cohen RA, Kirzinger WK. Financial burden of medical care: a family perspective. NCHS Data Brief. 2014;(142):1-8.
29. Galbraith AA, Ross-Degnan D, Soumerai SB, Rosenthal MB, Gay C, Lieu TA. Nearly half of families in high-deductible health plans whose members have chronic conditions face substantial financial burden. Health Aff (Millwood). 2011;30(2):322-331. https://doi.org/10.1377/hlthaff.2010.0584
30. Simon TD, Cawthon ML, Stanford S, et al. Pediatric medical complexity algorithm: a new method to stratify children by medical complexity. Pediatrics. 2014;133(6):e1647-e1654. https://doi.org/10.1542/peds.2013-3875
31. Leyenaar JK, Ralston SL, Shieh MS, Pekow PS, Mangione-Smith R, Lindenauer PK. Epidemiology of pediatric hospitalizations at general hospitals and freestanding children’s hospitals in the United States. J Hosp Med. 2016;11(11):743-749. https://doi.org/10.1002/jhm.2624
32. Rubin DB. Multiple Imputation for Nonresponse in Surveys. John Wiley and Sons; 1987.
33. R: A language and environment for statistical computing. R Foundation for Statistical Computing; 2018. https://www.R-project.org/
34. Hamel L, Norton M, Pollitz K, Levitt L, Claxton G, Brodie M. The Burden of Medical Debt: Results from the Kaiser Family Foundation/New York Times Medical Bills Survey. Kaiser Family Foundation; January 5, 2016. Accessed February 26, 2019. https://www.kff.org/wp-content/uploads/2016/01/8806-the-burden-of-medical-debt-results-from-the-kaiser-family-foundation-new-york-times-medical-bills-survey.pdf
35. Witt WP, Litzelman K, Mandic CG, et al. Healthcare-related financial burden among families in the U.S.: the role of childhood activity limitations and income. J Fam Econ Issues. 2011;32(2):308-326. https://doi.org/10.1007/s10834-011-9253-4
36. Zan H, Scharff RL. The heterogeneity in financial and time burden of caregiving to children with chronic conditions. Matern Child Health J. 2015;19(3):615-625. https://doi.org/10.1007/s10995-014-1547-3
37. Irwin B, Kimmick G, Altomare I, et al. Patient experience and attitudes toward addressing the cost of breast cancer care. Oncologist. 2014;19(11):1135-1140. https://doi.org/10.1634/theoncologist.2014-0117
38. Meisenberg BR, Varner A, Ellis E, et al. Patient attitudes regarding the cost of illness in cancer care. Oncologist. 2015;20(10):1199-1204. https://doi.org/10.1634/theoncologist.2015-0168
39. Altomare I, Irwin B, Zafar SY, et al. Physician experience and attitudes toward addressing the cost of cancer care. J Oncol Pract. 2016;12(3):e281-288, 247-288. https://doi.org/10.1200/jop.2015.007401
40. Starkey AJ, Keane CR, Terry MA, Marx JH, Ricci EM. Financial distress and depressive symptoms among African American women: identifying financial priorities and needs and why it matters for mental health. J Urban Health. 2013;90(1):83-100. https://doi.org/10.1007/s11524-012-9755-x
41. Amanatullah DF, Murasko MJ, Chona DV, Crijns TJ, Ring D, Kamal RN. Financial distress and discussing the cost of total joint arthroplasty. J Arthroplasty. 2018;33(11):3394-3397. https://doi.org/10.1016/j.arth.2018.07.010
© 2020 Society of Hospital Medicine
Diagnosis and Management of UTI in Febrile Infants Age 0–2 Months: Applicability of the AAP Guideline
Urinary tract infections (UTIs) are the most common bacterial infection and one of the most common reasons for hospitalization in young infants.1,2 The American Academy of Pediatrics (AAP) has published several clinical practice guidelines for the evaluation and management of febrile children ages 2-24 months with first-time UTIs, most recently in 2011 and affirmed in 2016.3 These guidelines do not provide recommendations for infants aged <2 months, which leads to uncertainty regarding the diagnosis and management of UTIs for infants in this age group. We assess the applicability of the AAP UTI Guideline’s action statements for infants aged <2 months presenting with first-time UTIs, with an emphasis on recent evidence. Because the considerations for bacterial infections differ for febrile infants aged <2 months compared with older infants, we do not discuss action statements one and two (determination of the likelihood of UTIs and decision to test urine) and statement seven (medical evaluation for fever after first UTI).3 Additionally, because concomitant bacteremia and meningitis are more common in this age group than in older infants, we review some of the controversies surrounding the diagnosis and treatment of these disease entities.
DIAGNOSIS
“Action Statement 3: To establish the diagnosis of UTI, clinicians should require both urinalysis results that suggest infection (pyuria and/or bacteriuria) and the presence of at least 50,000 colony-forming units (CFUs) per mL of a uropathogen cultured from a urine specimen obtained through catheterization or SPA.”3
To distinguish asymptomatic bacteriuria or contamination from a true UTI, the AAP Guideline requires both a positive urinalysis (UA) and culture for a diagnosis of a UTI.3 Historically, the UA was considered to be poorly sensitive for infections in young infants, with older studies reporting sensitivities ranging from 40% to 82% using urine culture as the gold standard.4-7 Thus, infants aged <2 months with positive urine cultures and negative UAs are often treated as having true UTIs, though this practice varies by institution.8 Possible explanations for the low UA sensitivity in this population include rapid bladder emptying, immature immune systems, and inability to concentrate urine. However, a negative UA plus a positive urine culture could also represent a “true negative” UA and a “false positive” culture, a finding that may be more common in young infants in whom sterile urine obtainment is often challenging.
Two recent studies have addressed this issue by evaluating the UA sensitivity in patients with bacteremic UTIs, as growth of the same pathogenic organism from the blood and urine almost certainly represents true infection.9,10 In a retrospective study of 203 infants aged <3 months with bacteremic UTIs, the presence of any leukocyte esterase (LE) or pyuria (>3 white blood cells per high-powered field [WBC/HPF]) had a sensitivity of 99.5% (95% CI: 98.5%-100%) and specificity of 93.9% (95% CI: 87.8%-93.2%).9 In a prospective, multicenter study of 4,147 febrile infants aged ≤60 days, of whom 27 infants had bacteremic UTIs, a positive UA (any LE, >5 WBC/HPF, or nitrite) had a sensitivity and specificity of 1.00 (95% CI: 0.87-1.00) and 0.91 (95% CI: 0.90-0.91), respectively.10 Although screening tests may appear to have higher sensitivity in more severely diseased populations (“spectrum bias”),11 it is not clear that infants with bacteremic UTIs are definitively sicker than infants with nonbacteremic UTIs (see “bacteremic UTI” section below). Additionally, this study found similarly excellent sensitivity (0.94 [95% CI: 0.90-0.96]) and specificity (0.91 [95% CI: 0.90-0.91]) of the UA among infants with nonbacteremic UTIs, including infants <28 days old.10
UA sensitivity (using urine culture as the gold standard) may be lower for non-Escherichia coli UTIs.9,10,12 In a retrospective study that included 90 infants <2 months old with UTIs, urine cultures yielding Pseudomonas aeruginosa, Enterococcus, or Klebsiella species were significantly less likely (odds ratio [95% CI]: 0.19 [0.06-0.60]; 0.14 [0.07-0.28]; 0.34 [0.17-0.68], respectively) to have pyuria (≥5 WBC/HPF) or LE (1+ or greater) than urine cultures yielding E. coli.,12 though an alternative explanation for this finding is that these organisms may be more likely to cause asymptomatic bacteriuria or contamination.13
The appropriate CFU/mL threshold to define a UTI and the extent that this threshold should vary by urine collection methods are still unclear. In the aforementioned bacteremic UTI study,9 12 patients with E. coli bacteremia had urine cultures with <50,000 CFU/mL plus pyuria (WBC or LE) in the UA, indicating that true UTIs may occur with <50,000 CFU/mL.
Based on these recent studies, we believe that the recommendation to incorporate UA results into the diagnoses of UTIs can be applied to infants <2 months old, as well as consideration for a UTI for colony counts of ≥10,000 CFU/mL if the UA is positive. For infants with positive urine cultures and negative UAs who have not received antibiotics, we suggest repeating both studies if treatment is being considered. For those who have started antibiotics, the pretest probability of a UTI, initial illness severity, and risks and benefits of continuing treatment should be considered.
TREATMENT
“Action Statement 4a: When initiating treatment, the clinician should base the choice of route of administration on practical considerations. Initiating treatment orally or parenterally is equally efficacious. The clinician should base the choice of agent on local antimicrobial sensitivity patterns (if available) and should adjust the choice according to sensitivity testing of the isolated uropathogen.”3
Most infants <2 months old with UTIs are hospitalized initially because of fever. Therefore, the decision point for most clinicians is not whether to hospitalize but for how long to hospitalize and treat with intravenous (IV) antibiotics prior to discharging home on oral antibiotics. Although all-oral antibiotic regimens are used to treat UTIs in older infants and children,14-18 to our knowledge, there are no randomized controlled trials (RCTs) comparing all-IV vs all-oral antibiotics or a longer vs shorter initial IV course that include infants <1 month old. In the trials that do include infants aged 1-2 months,14,18 the number of subjects in this age group is too small to draw conclusions, a finding supported by a 2014 Cochrane review.19 An adequately powered RCT of different IV antibiotic durations in this age group would be challenging. For example, nearly 1,000 subjects would be needed to demonstrate a statistically significant difference between a 5% and 10% relapse risk between groups, a difference that some may find clinically important.
The paucity of evidence in this age group may explain the considerable variability in the approach to IV antibiotic duration in young infants. Concerns about enteral absorption and underdeveloped immune systems may prompt some physicians to treat the youngest patients more aggressively. One study demonstrated that the proportion of patients <2 months old receiving prolonged courses (≥4 days) of IV antibiotics for UTIs in 46 U.S. children’s hospitals ranged from 0% to 67%.20 Similar variability across hospitals has been described in other observational studies21,22 and across subspecialties in one survey of pediatricians.23
Several observational studies provide additional evidence supporting shorter IV courses. In two studies that examined administrative databases, there was no difference in treatment failure rates between infants aged <2 months20 and <6 months21 receiving longer (≥4 days) vs shorter IV courses. In a study of 172 infants <1 month old with UTIs, the median IV duration was 4 days (range 2-12 days), and no subjects experienced treatment failure or relapse.24 In a multicenter study of 251 infants <3 months old with bacteremic UTIs, mean IV antibiotic durations ranged from 5.5–12 days, and no patient had a relapsed bacteremic UTI. Six infants (2.4%) had a relapsed UTI without bacteremia, with no association between IV antibiotic duration and relapse.22
Based on the available data and known risks of hospitalization and prolonged IV therapy, a reasonable approach for infants <1 month old would be to hospitalize for two to three days while awaiting blood and cerebral spinal fluid (CSF) culture results. Given the possibility of Enterococcus or Enterobacteriaceae that are resistant to third-generation cephalosporins, standard therapy of ampicillin and gentamicin for febrile neonates is reasonable, assuming there is no concern for meningitis. Antibiotics should be narrowed when susceptibilities are known. Once culture results return and signs and symptoms have resolved, discharge home on oral antibiotics is justifiable based on the available literature. For well-appearing infants aged 1-2 months with a presumptive UTI (based on UA results), if hospitalization is not warranted for other reasons, then we recommend outpatient treatment with oral or intramuscular therapy based on local susceptibilities (typically a cephalosporin) and close follow-up for one to two days while awaiting culture results. Although empiric cephalosporin therapy may not provide 100% coverage for all potential organisms, clinical deterioration is uncommon in infants and children receiving discordant therapy.25
“Action Statement 4b: The clinician should choose 7 to 14 days as the duration of antimicrobial therapy.”3
The AAP’s recommendation to provide antibiotics (by oral or parenteral route) for a minimum of seven days total stems from a 2002 meta-analysis comparing long (7-14 days) vs short (≤3 days) courses, where the pooled relative risk of treatment failure with short-course therapy was 1.94 (95% CI: 1.19-3.15).26 However, in this analysis, the trials that demonstrated inferiority with short courses were all trials that used single doses of antibiotics, and a similar Cochrane review comparing 2-4 days with 7-14 days demonstrated no differences in outcomes.27 Therefore, shorter total courses, but not a single dose, are probably appropriate for most UTIs in children. Although there are no obvious biologic reasons why longer total courses would be needed in young infants, there are unfortunately limited data comparing different total antibiotic durations in this age group. We believe that 7-14 days of total therapy is a reasonable recommendation for infants <2 months old, and that future studies should investigate shorter total courses.
IMAGING
“Action Statement 5: Febrile infants with UTIs should undergo renal and bladder ultrasonography (RBUS).”3
The AAP Guideline acknowledges that the RBUS is a poor screening test for the detection of genitourinary abnormalities in infants.3 The RBUS can be normal in infants with vesicoureteral reflux (VUR) or show nonspecific findings of unclear clinical significance.28 In a prospective study of 220 infants <3 months old by Tsai et al, 9/39 infants (23%) with grade III-V VUR had normal RBUS.29 Studies that included older infants have found a similar false-negative rate of 0%-40% for detecting grade IV-V VUR by RBUS.28 Nonetheless, since a RBUS is safe and noninvasive, we feel that the benefits of screening for abnormalities such as hydronephrosis (that could indicate posterior urethral valves or ureteropelvic junction obstruction) outweigh the risks (eg, false positives, overdiagnosis, and cost) of performing a RBUS after a first-time UTI.
“Action Statement 6a: Voiding cystourethrography (VCUG) should not be performed routinely after the first febrile UTI; VCUG is indicated if RBUS reveals hydronephrosis, scarring, or other findings that would suggest either high-grade VUR or obstructive uropathy, as well as in other atypical or complex clinical circumstances.”3
“Action Statement 6b: Further evaluation should be conducted if there is a recurrence of febrile UTI.”3
The RBUS may be normal in infants with VUR. Therefore, the AAP’s recommendation to perform a VCUG only if the RBUS is abnormal or after a recurrent UTI concedes that there will be infants with VUR who are missed after the first UTI.3
The United Kingdom’s National Institute for Health and Care Excellence guideline recommends a VCUG for infants <6 months old with a bacteremic or non-E. coli UTI.30 Whether high-grade VUR is more common in young infants with bacteremic UTIs than nonbacteremic UTIs remains inconclusive. In the Honkinen et al. study that included 87 infants <3 months old with bacteremic UTIs, the prevalence of grade IV-V VUR (10%) and obstruction (7%) was higher than that of the 88 nonbacteremic infants (2% grade IV-V VUR and 2% with obstruction). In the multicenter study of 251 infants <3 months old with bacteremic UTIs, the prevalence of grade IV-V VUR was 12.1%.31 This is higher than that of the nonbacteremic infants in Honkinen et al.’s study32 but more similar to the prevalence of grade IV-V VUR found in Tsai et al. (8.2%) and Ismaili et al.’s (7.0%) studies of UTIs in general.29,33
There does appear to be a higher prevalence of urinary tract abnormalities in young infants with non-E. coli vs E. coli UTIs.31,32,34,35 The odds of an abnormal VCUG was 8.0 (95% CI: 2.3-28) times higher for non-E. coli than E. coli UTIs in the study of 251 bacteremic infants.31 In a study of 122 infants <3 months old, the odds of grade III-V VUR was 10 (95% CI 2.6-41) times higher for non-E. coli than E. coli UTIs.35
However, the need for early detection of VUR is controversial, and VCUGs are invasive, involve ionizing radiation, and may require sedation. Two recent trials (one which included only children with VUR and another in which 42% of subjects had VUR) demonstrated a modest effect of prophylactic antibiotics in preventing recurrent UTIs (>5,000 doses of antibiotics needed to prevent one UTI recurrence), but the effect size did not differ by the presence or degree of VUR, and neither demonstrated any benefit in reducing future renal scarring.36, 37 The benefit of surgical interventions for VUR also remains unclear, though studies are limited.38 Overall, there is no evidence suggesting that infants <2 months old require more vigilance for VUR detection than the 2-24 month age group.
SPECIAL CONSIDERATIONS
Bacteremic UTI
The prevalence of bacteremia in infants ≤60 days old with UTIs was 9% in a study conducted from 2008 to 2013 in 26 EDs and has ranged from 3% to 17% in older studies.10, 22 Many studies have described similar clinical and laboratory findings in young infants with bacteremic and nonbacteremic UTIs.39-41 Despite this, bacteremic UTIs have been associated with prolonged parenteral antibiotic courses, resulting in longer hospitalizations and increased costs.40 Two recent multicenter studies of infants with bacteremic UTIs (251 infants <3 months old22 and 115 infants ≤60 days old42) demonstrated variable IV courses and no association between IV duration and relapsed UTI. The latter study showed no risk difference in the adjusted 30-day UTI recurrence (risk difference 3%, 95% CI: −5.8 to 12.7) or all-cause reutilization (risk difference 3%, 95% CI: −14.5 to 20.6) between long and short IV groups.42 Neither study had patients with relapsed bacteremic UTIs or reported that patients suffered clinical deterioration while on oral antibiotics.22,42
Based on these data demonstrating that adverse outcomes are rare in infants with bacteremic UTIs and not associated with parenteral antibiotic duration, we recommend short parenteral courses (2-3 days) with conversion to oral therapy once infants have clinically improved.
Positive Urinalysis and Testing for Meningitis
Multiple risk stratification algorithms for febrile infants aged ≤60 days categorize infants with a positive UA (and therefore likely UTI) as high-risk for having concomitant bacteremia or meningitis, for which lumbar puncture (LP) is typically recommended.43-45 The risk of not testing CSF is the potential to insufficiently treat meningitis because treatment for UTIs and meningitis differ in dosing, route, and duration. Recent studies have challenged the practice of routine LPs for infants aged 1-2 months with a suspected UTI due to the low prevalence (0%-0.3%) of concomitant meningitis.39,46-48 A meta-analysis of 20 studies reporting rates of concomitant meningitis with UTI in infants aged 29-90 days found a pooled prevalence of 0.25% (95% CI: 0.09%-0.70%).49 Furthermore, a study of febrile infants ages 29-60 days found that the prevalence of meningitis did not differ between those with a positive vs negative UA (3/337 [0.9%] vs 5/498 [1.0%], respectively), suggesting that a positive UA alone should not modify the pretest probability of meningitis in this age group.50
Two studies have also examined the risk of delayed meningitis among infants ≤60 days old treated for UTIs without CSF testing. A northern California study that examined 345 episodes among 341 UA-positive infants aged 29-60 days found zero cases (95% CI: 0%-1.1%) of delayed meningitis within 30 days of evaluation.50 A multicenter study of well-appearing febrile infants aged 7-60 days found 0/505 cases (95% CI: 0%-0.6%) of delayed meningitis within 7 days of discharge; 407 (81%) were aged 31-60 days.51 In summary, studies have shown a low rate of concomitant meningitis and a low risk of delayed meningitis in infants aged 1-2 months treated for UTI without CSF testing. Given this, clinically targeted (eg, based on ill appearance and/or lethargy), rather than routine, CSF testing in this age group can be considered.
CONCLUSION
While the AAP UTI Guideline is directed toward 2-24-month-old infants, recent evidence suggests that action statements 3-6 apply to infants <2 months old. Incorporation of pyuria as a diagnostic criterion for UTIs, early transition to oral therapy, and selective VCUG testing are all warranted based on the available evidence and consideration of known risks and benefits. Future studies with larger sample sizes that include infants <2 months old would be beneficial to ensure that the available studies, which have relatively small cohorts, do not suffer from type II error. We propose that future studies examine shorter (<7 days) vs longer total antibiotic duration, shorter vs longer initial IV antibiotics (especially in infants <1 month old or with bacteremic UTIs), and whether RBUS can be performed in a targeted manner. RCTs comparing universal vs targeted imaging strategies would help ascertain whether the increased diagnostic yield that accompanies more aggressive imaging strategies translates into improved outcomes. Application of these AAP guidelines to the <2-month age group and enhancement of the evidence base can promote the high-value care of young infants with UTIs.
1. Greenhow TL, Hung YY, Herz AM, Losada E, Pantell RH. The changing epidemiology of serious bacterial infections in young infants. Pediatr Infect Dis J. 2014;33(6):595-599. https://doi.org/10.1097/INF.0000000000000225.
2. Spencer JD, Schwaderer A, McHugh K, Hains DS. Pediatric urinary tract infections: an analysis of hospitalizations, charges, and costs in the USA. Pediatr Nephrol. 2010;25(12):2469-2475. https://doi.org/10.1007/s00467-010-1625-8.
3. Subcommittee On Urinary Tract Infection. Reaffirmation of AAP Clinical Practice Guideline: the diagnosis and management of the initial urinary tract infection in febrile infants and young children 2-24 months of age. Pediatrics. 2016;138(6):1-5. https://doi.org/10.1542/peds.2016-3026.
4. Crain EF, Gershel JC. Urinary tract infections in febrile infants younger than 8 weeks of age. Pediatrics. 1990;86(3):363-367. https://doi.org/10.1542/peds.105.2.e20
5. Dayan PS, Bennett J, Best R, et al. Test characteristics of the urine Gram stain in infants <or= 60 days of age with fever. Pediatr Emerg Care. 2002;18(1):12-14. https://doi.org/10.1097/00006565-200202000-00004.
6. Bachur R, Harper MB. Reliability of the urinalysis for predicting urinary tract infections in young febrile children. Arch Pediatr Adolesc Med. 2001;155(1):60-65. https://doi.org/10.1001/archpedi.155.1.60.
7. Reardon JM, Carstairs KL, Rudinsky SL, Simon LV, Riffenburgh RH, Tanen DA. Urinalysis is not reliable to detect a urinary tract infection in febrile infants presenting to the ED. Am J Emerg Med. 2009;27(8):930-932. https://doi.org/10.1016/j.ajem.2008.07.015.
8. Schroeder AR, Lucas BP, Garber MD, McCulloh RJ, Joshi-Patel AA, Biondi EA. Negative urinalyses in febrile infants age 7 to 60 days treated for urinary tract infection. J Hosp Med. 2019;14(2):101-104. https://doi.org/10.12788/jhm.3120.
9. Schroeder AR, Chang PW, Shen MW, Biondi EA, Greenhow TL. Diagnostic accuracy of the urinalysis for urinary tract infection in infants <3 months of age. Pediatrics. 2015;135(6):965-971. https://doi.org/10.1542/peds.2015-0012.
10. Tzimenatos L, Mahajan P, Dayan PS, et al. Accuracy of the urinalysis for urinary tract infections in febrile infants 60 days and younger. Pediatrics. 2018;141(2):e20173068. https://doi.org/10.1542/peds.2017-3068.
11. Newman TB, Kohn MA. Evidence-based diagnosis. Practical Guides to Biostatistics and Epidemiology. Cambridge; New York: Cambridge University Press, 2009.
12. Shaikh N, Shope TR, Hoberman A, Vigliotti A, Kurs-Lasky M, Martin JM. Association Between Uropathogen and Pyuria. Pediatrics. 2016;138(1):e20160087. https://doi.org/10.1542/peds.2016-0087.
13. Eliacik K, Kanik A, Yavascan O, et al. A comparison of bladder catheterization and suprapubic aspiration methods for urine sample collection from infants with a suspected urinary tract infection. Clin Pediatr. 2016;55(9):819-824. https://doi.org/10.1177/0009922815608278.
14. Bocquet N, Sergent Alaoui A, Jais JP, et al. Randomized trial of oral versus sequential IV/oral antibiotic for acute pyelonephritis in children. Pediatrics. 2012;129(2):e269-e275. https://doi.org/10.1542/peds.2011-0814.
15. Bouissou F, Munzer C, Decramer S, et al. Prospective, randomized trial comparing short and long intravenous antibiotic treatment of acute pyelonephritis in children: dimercaptosuccinic acid scintigraphic evaluation at 9 months. Pediatrics. 2008;121(3):e553-e560. https://doi.org/10.1542/peds.2006-3632.
16. Hodson EM, Willis NS, Craig JC. Antibiotics for acute pyelonephritis in children. Cochrane Database Syst Rev. 2007(4):CD003772. https://doi.org/10.1002/14651858.CD003772.pub3.
17. Neuhaus TJ, Berger C, Buechner K, et al. Randomised trial of oral versus sequential intravenous/oral cephalosporins in children with pyelonephritis. Eur J Pediatr. 2008;167(9):1037-1047. https://doi.org/10.1007/s00431-007-0638-1
18. Hoberman A, Wald ER, Hickey RW, et al. Oral versus initial intravenous therapy for urinary tract infections in young febrile children. Pediatrics. 1999;104(1 Pt 1):79-86. https://doi.org/10.1542/peds.104.1.79.
19. Strohmeier Y, Hodson EM, Willis NS, Webster AC, Craig JC. Antibiotics for acute pyelonephritis in children. Cochrane Database Syst Rev. 2014(7):CD003772. https://doi.org/10.1002/14651858.CD003772.pub4.
20. Lewis-de Los Angeles WW, Thurm C, Hersh AL, et al. Trends in intravenous antibiotic duration for urinary tract infections in young infants. Pediatrics. 2017;140(6):e20171021. https://doi.org/10.1542/peds.2017-1021.
21. Brady PW, Conway PH, Goudie A. Length of intravenous antibiotic therapy and treatment failure in infants with urinary tract infections. Pediatrics. 2010;126(2):196-203. https://doi.org/10.1542/peds.2009-2948.
22. Schroeder AR, Shen MW, Biondi EA, et al. Bacteraemic urinary tract infection: management and outcomes in young infants. Arch Dis Child. 2016;101(2):125-130. https://doi.org/10.1136/archdischild-2014-307997.
23. Joshi NS, Lucas BP, Schroeder AR. Physician preferences surrounding urinary tract infection management in neonates. Hosp Pediatr. 2018;8(1):21-27. https://doi.org/10.1542/hpeds.2017-0082.
24. Magin EC, Garcia-Garcia JJ, Sert SZ, Giralt AG, Cubells CL. Efficacy of short-term intravenous antibiotic in neonates with urinary tract infection. Pediatr Emerg Care. 2007;23(2):83-86. https://doi.org/10.1097/PEC.0b013e3180302c47.
25. Wang ME, Lee V, Greenhow TL, et al. Clinical response to discordant therapy in third-generation cephalosporin-resistant UTIs. Pediatrics. 2019; In press.
26. Keren R, Chan E. A meta-analysis of randomized, controlled trials comparing short- and long-course antibiotic therapy for urinary tract infections in children. Pediatrics. 2002;109(5):E70. https://doi.org/10.1542/peds.109.5.e70.
27. Michael M, Hodson EM, Craig JC, Martin S, Moyer VA. Short versus standard duration oral antibiotic therapy for acute urinary tract infection in children. Cochrane Database Syst Rev. 2003(1):CD003966. https://doi.org/10.1002/14651858.CD003966.
28. Finnell SM, Carroll AE, Downs SM, Subcommittee on Urinary Tract I. Technical report-Diagnosis and management of an initial UTI in febrile infants and young children. Pediatrics. 2011;128(3):e749-e770. https://doi.org/10.1542/peds.2011-1332.
29. Tsai JD, Huang CT, Lin PY, et al. Screening high-grade vesicoureteral reflux in young infants with a febrile urinary tract infection. Pediatr Nephrol. 2012;27(6):955-963. https://doi.org/10.1007/s00467-012-2104-1.
30. National Institue for Health and Care Excellence. Urinary Tract Infection in Children. http://www.nice.org.uk/guidance/cg54/evidence/cg54-urinary-tract-infection-in-children-full-guideline2. Published August 2007. Accessed August 2019.
31. Chang PW, Abidari JM, Shen MW, et al. Urinary imaging findings in young infants with bacteremic urinary tract infection. Hosp Pediatr. 2016;6(11):647-652. https://doi.org/10.1542/hpeds.2015-0229.
32. Honkinen O, Jahnukainen T, Mertsola J, Eskola J, Ruuskanen O. Bacteremic urinary tract infection in children. Pediatr Infect Dis J. 2000;19(7):630-634. https://doi.org/10.1097/00006454-200007000-00009
33. Ismaili K, Lolin K, Damry N, Alexander M, Lepage P, Hall M. Febrile urinary tract infections in 0- to 3-month-old infants: a prospective follow-up study. J Pediatr. 2011;158(1):91-94. https://doi.org/10.1016/j.jpeds.2010.06.053.
34. Cleper R, Krause I, Eisenstein B, Davidovits M. Prevalence of vesicoureteral reflux in neonatal urinary tract infection. Clin Pediatr. 2004;43(7):619-625. https://doi.org/10.1177/000992280404300706.
35. Pauchard JY, Chehade H, Kies CZ, Girardin E, Cachat F, Gehri M. Avoidance of voiding cystourethrography in infants younger than 3 months with Escherichia coli urinary tract infection and normal renal ultrasound. Arch Dis Child. 2017;102(9):804-808. https://doi.org/10.1136/archdischild-2016-311587.
36. Craig JC, Simpson JM, Williams GJ, et al. Antibiotic prophylaxis and recurrent urinary tract infection in children. N Engl J Med. 2009;361(18):1748-1759. https://doi.org/10.1056/NEJMoa0902295.
37. Hoberman A, Greenfield SP, Mattoo TK, et al. Antimicrobial prophylaxis for children with vesicoureteral reflux. N Engl J Med. 2014;370(25):2367-2376. https://doi.org/10.1056/NEJMoa1401811.
38. Williams G, Hodson EM, Craig JC. Interventions for primary vesicoureteric reflux. Cochrane Database Syst Rev. 2019;(2):CD001532. https://doi.org/10.1002/14651858.CD001532.pub4.
39. Schnadower D, Kuppermann N, Macias CG, et al. Febrile infants with urinary tract infections at very low risk for adverse events and bacteremia. Pediatrics. 2010;126(6):1074-1083. https://doi.org/10.1542/peds.2010-0479,
40. Roman HK, Chang PW, Schroeder AR. Diagnosis and management of bacteremic urinary tract infection in infants. Hosp Pediatr. 2015;5(1):1-8. https://doi.org/10.1542/hpeds.2014-0051.
41. Newman TB, Bernzweig JA, Takayama JI, Finch SA, Wasserman RC, Pantell RH. Urine testing and urinary tract infections in febrile infants seen in office settings: the Pediatric Research in Office Settings’ Febrile Infant Study. Arch Pediatr Adolesc Med. 2002;156(1):44-54. https://doi.org/10.1001/archpedi.156.1.44.
42. Desai S, Aronson PL, Shabanova V, et al. Parenteral antibiotic therapy duration in young infants with bacteremic urinary tract infections. Pediatrics. 2019;144(3):e20183844. https://doi.org/10.1542/peds.2018-3844,
43. Gomez B, Mintegi S, Bressan S, et al. Validation of the “Step-by-Step” approach in the management of young febrile infants. Pediatrics. 2016;138(2):e20154381. https://doi.org/10.1542/peds.2015-4381.
44. Kuppermann N, Dayan PS, Levine DA, et al. A clinical prediction rule to identify febrile infants 60 days and younger at low risk for serious bacterial infections. JAMA Pediatr. 2019;173(4):342-351. https://doi.org/10.1001/jamapediatrics.2018.5501.
45. DePorre AG, Aronson PL, McCulloh RJ. Facing the ongoing challenge of the febrile young infant. Crit Care. 2017;21(1):68. https://doi.org/10.1186/s13054-017-1646-9,
46. Tebruegge M, Pantazidou A, Clifford V, et al. The age-related risk of co-existing meningitis in children with urinary tract infection. PLoS One. 2011;6(11):e26576. https://doi.org/10.1371/journal.pone.0026576.
47. Thomson J, Cruz AT, Nigrovic LE, et al. Concomitant bacterial meningitis in infants with urinary tract infection. Pediatr Infect Dis J. 2017;36(9):908-910. https://doi.org/10.1097/INF.0000000000001626.
48. Wallace SS, Brown DN, Cruz AT. Prevalence of concomitant acute bacterial meningitis in neonates with febrile urinary tract infection: a retrospective cross-sectional study. J Pediatr. 2017;184:199-203. https://doi.org/10.1016/j.jpeds.2017.01.022.
49. Nugent J, Childers M, Singh-Miller N, Howard R, Allard R, Eberly M. Risk of meningitis in infants aged 29 to 90 days with urinary tract infection: a systematic review and meta-analysis. J Pediatr. 2019;212:102-110.e5. https://doi.org/10.1016/j.jpeds.2019.04.053.
50. Young BR, Nguyen THP, Alabaster A, Greenhow TL. The prevalence of bacterial meningitis in febrile infants 29-60 days with positive urinalysis. Hosp Pediatr. 2018;8(8):450-457. https
51. Wang ME, Biondi EA, McCulloh RJ, et al. Testing for meningitis in febrile well-appearing young infants with a positive urinalysis. Pediatrics. 2019;144(3):e20183979. https://doi.org/10.1542/peds.2018-3979.
Urinary tract infections (UTIs) are the most common bacterial infection and one of the most common reasons for hospitalization in young infants.1,2 The American Academy of Pediatrics (AAP) has published several clinical practice guidelines for the evaluation and management of febrile children ages 2-24 months with first-time UTIs, most recently in 2011 and affirmed in 2016.3 These guidelines do not provide recommendations for infants aged <2 months, which leads to uncertainty regarding the diagnosis and management of UTIs for infants in this age group. We assess the applicability of the AAP UTI Guideline’s action statements for infants aged <2 months presenting with first-time UTIs, with an emphasis on recent evidence. Because the considerations for bacterial infections differ for febrile infants aged <2 months compared with older infants, we do not discuss action statements one and two (determination of the likelihood of UTIs and decision to test urine) and statement seven (medical evaluation for fever after first UTI).3 Additionally, because concomitant bacteremia and meningitis are more common in this age group than in older infants, we review some of the controversies surrounding the diagnosis and treatment of these disease entities.
DIAGNOSIS
“Action Statement 3: To establish the diagnosis of UTI, clinicians should require both urinalysis results that suggest infection (pyuria and/or bacteriuria) and the presence of at least 50,000 colony-forming units (CFUs) per mL of a uropathogen cultured from a urine specimen obtained through catheterization or SPA.”3
To distinguish asymptomatic bacteriuria or contamination from a true UTI, the AAP Guideline requires both a positive urinalysis (UA) and culture for a diagnosis of a UTI.3 Historically, the UA was considered to be poorly sensitive for infections in young infants, with older studies reporting sensitivities ranging from 40% to 82% using urine culture as the gold standard.4-7 Thus, infants aged <2 months with positive urine cultures and negative UAs are often treated as having true UTIs, though this practice varies by institution.8 Possible explanations for the low UA sensitivity in this population include rapid bladder emptying, immature immune systems, and inability to concentrate urine. However, a negative UA plus a positive urine culture could also represent a “true negative” UA and a “false positive” culture, a finding that may be more common in young infants in whom sterile urine obtainment is often challenging.
Two recent studies have addressed this issue by evaluating the UA sensitivity in patients with bacteremic UTIs, as growth of the same pathogenic organism from the blood and urine almost certainly represents true infection.9,10 In a retrospective study of 203 infants aged <3 months with bacteremic UTIs, the presence of any leukocyte esterase (LE) or pyuria (>3 white blood cells per high-powered field [WBC/HPF]) had a sensitivity of 99.5% (95% CI: 98.5%-100%) and specificity of 93.9% (95% CI: 87.8%-93.2%).9 In a prospective, multicenter study of 4,147 febrile infants aged ≤60 days, of whom 27 infants had bacteremic UTIs, a positive UA (any LE, >5 WBC/HPF, or nitrite) had a sensitivity and specificity of 1.00 (95% CI: 0.87-1.00) and 0.91 (95% CI: 0.90-0.91), respectively.10 Although screening tests may appear to have higher sensitivity in more severely diseased populations (“spectrum bias”),11 it is not clear that infants with bacteremic UTIs are definitively sicker than infants with nonbacteremic UTIs (see “bacteremic UTI” section below). Additionally, this study found similarly excellent sensitivity (0.94 [95% CI: 0.90-0.96]) and specificity (0.91 [95% CI: 0.90-0.91]) of the UA among infants with nonbacteremic UTIs, including infants <28 days old.10
UA sensitivity (using urine culture as the gold standard) may be lower for non-Escherichia coli UTIs.9,10,12 In a retrospective study that included 90 infants <2 months old with UTIs, urine cultures yielding Pseudomonas aeruginosa, Enterococcus, or Klebsiella species were significantly less likely (odds ratio [95% CI]: 0.19 [0.06-0.60]; 0.14 [0.07-0.28]; 0.34 [0.17-0.68], respectively) to have pyuria (≥5 WBC/HPF) or LE (1+ or greater) than urine cultures yielding E. coli.,12 though an alternative explanation for this finding is that these organisms may be more likely to cause asymptomatic bacteriuria or contamination.13
The appropriate CFU/mL threshold to define a UTI and the extent that this threshold should vary by urine collection methods are still unclear. In the aforementioned bacteremic UTI study,9 12 patients with E. coli bacteremia had urine cultures with <50,000 CFU/mL plus pyuria (WBC or LE) in the UA, indicating that true UTIs may occur with <50,000 CFU/mL.
Based on these recent studies, we believe that the recommendation to incorporate UA results into the diagnoses of UTIs can be applied to infants <2 months old, as well as consideration for a UTI for colony counts of ≥10,000 CFU/mL if the UA is positive. For infants with positive urine cultures and negative UAs who have not received antibiotics, we suggest repeating both studies if treatment is being considered. For those who have started antibiotics, the pretest probability of a UTI, initial illness severity, and risks and benefits of continuing treatment should be considered.
TREATMENT
“Action Statement 4a: When initiating treatment, the clinician should base the choice of route of administration on practical considerations. Initiating treatment orally or parenterally is equally efficacious. The clinician should base the choice of agent on local antimicrobial sensitivity patterns (if available) and should adjust the choice according to sensitivity testing of the isolated uropathogen.”3
Most infants <2 months old with UTIs are hospitalized initially because of fever. Therefore, the decision point for most clinicians is not whether to hospitalize but for how long to hospitalize and treat with intravenous (IV) antibiotics prior to discharging home on oral antibiotics. Although all-oral antibiotic regimens are used to treat UTIs in older infants and children,14-18 to our knowledge, there are no randomized controlled trials (RCTs) comparing all-IV vs all-oral antibiotics or a longer vs shorter initial IV course that include infants <1 month old. In the trials that do include infants aged 1-2 months,14,18 the number of subjects in this age group is too small to draw conclusions, a finding supported by a 2014 Cochrane review.19 An adequately powered RCT of different IV antibiotic durations in this age group would be challenging. For example, nearly 1,000 subjects would be needed to demonstrate a statistically significant difference between a 5% and 10% relapse risk between groups, a difference that some may find clinically important.
The paucity of evidence in this age group may explain the considerable variability in the approach to IV antibiotic duration in young infants. Concerns about enteral absorption and underdeveloped immune systems may prompt some physicians to treat the youngest patients more aggressively. One study demonstrated that the proportion of patients <2 months old receiving prolonged courses (≥4 days) of IV antibiotics for UTIs in 46 U.S. children’s hospitals ranged from 0% to 67%.20 Similar variability across hospitals has been described in other observational studies21,22 and across subspecialties in one survey of pediatricians.23
Several observational studies provide additional evidence supporting shorter IV courses. In two studies that examined administrative databases, there was no difference in treatment failure rates between infants aged <2 months20 and <6 months21 receiving longer (≥4 days) vs shorter IV courses. In a study of 172 infants <1 month old with UTIs, the median IV duration was 4 days (range 2-12 days), and no subjects experienced treatment failure or relapse.24 In a multicenter study of 251 infants <3 months old with bacteremic UTIs, mean IV antibiotic durations ranged from 5.5–12 days, and no patient had a relapsed bacteremic UTI. Six infants (2.4%) had a relapsed UTI without bacteremia, with no association between IV antibiotic duration and relapse.22
Based on the available data and known risks of hospitalization and prolonged IV therapy, a reasonable approach for infants <1 month old would be to hospitalize for two to three days while awaiting blood and cerebral spinal fluid (CSF) culture results. Given the possibility of Enterococcus or Enterobacteriaceae that are resistant to third-generation cephalosporins, standard therapy of ampicillin and gentamicin for febrile neonates is reasonable, assuming there is no concern for meningitis. Antibiotics should be narrowed when susceptibilities are known. Once culture results return and signs and symptoms have resolved, discharge home on oral antibiotics is justifiable based on the available literature. For well-appearing infants aged 1-2 months with a presumptive UTI (based on UA results), if hospitalization is not warranted for other reasons, then we recommend outpatient treatment with oral or intramuscular therapy based on local susceptibilities (typically a cephalosporin) and close follow-up for one to two days while awaiting culture results. Although empiric cephalosporin therapy may not provide 100% coverage for all potential organisms, clinical deterioration is uncommon in infants and children receiving discordant therapy.25
“Action Statement 4b: The clinician should choose 7 to 14 days as the duration of antimicrobial therapy.”3
The AAP’s recommendation to provide antibiotics (by oral or parenteral route) for a minimum of seven days total stems from a 2002 meta-analysis comparing long (7-14 days) vs short (≤3 days) courses, where the pooled relative risk of treatment failure with short-course therapy was 1.94 (95% CI: 1.19-3.15).26 However, in this analysis, the trials that demonstrated inferiority with short courses were all trials that used single doses of antibiotics, and a similar Cochrane review comparing 2-4 days with 7-14 days demonstrated no differences in outcomes.27 Therefore, shorter total courses, but not a single dose, are probably appropriate for most UTIs in children. Although there are no obvious biologic reasons why longer total courses would be needed in young infants, there are unfortunately limited data comparing different total antibiotic durations in this age group. We believe that 7-14 days of total therapy is a reasonable recommendation for infants <2 months old, and that future studies should investigate shorter total courses.
IMAGING
“Action Statement 5: Febrile infants with UTIs should undergo renal and bladder ultrasonography (RBUS).”3
The AAP Guideline acknowledges that the RBUS is a poor screening test for the detection of genitourinary abnormalities in infants.3 The RBUS can be normal in infants with vesicoureteral reflux (VUR) or show nonspecific findings of unclear clinical significance.28 In a prospective study of 220 infants <3 months old by Tsai et al, 9/39 infants (23%) with grade III-V VUR had normal RBUS.29 Studies that included older infants have found a similar false-negative rate of 0%-40% for detecting grade IV-V VUR by RBUS.28 Nonetheless, since a RBUS is safe and noninvasive, we feel that the benefits of screening for abnormalities such as hydronephrosis (that could indicate posterior urethral valves or ureteropelvic junction obstruction) outweigh the risks (eg, false positives, overdiagnosis, and cost) of performing a RBUS after a first-time UTI.
“Action Statement 6a: Voiding cystourethrography (VCUG) should not be performed routinely after the first febrile UTI; VCUG is indicated if RBUS reveals hydronephrosis, scarring, or other findings that would suggest either high-grade VUR or obstructive uropathy, as well as in other atypical or complex clinical circumstances.”3
“Action Statement 6b: Further evaluation should be conducted if there is a recurrence of febrile UTI.”3
The RBUS may be normal in infants with VUR. Therefore, the AAP’s recommendation to perform a VCUG only if the RBUS is abnormal or after a recurrent UTI concedes that there will be infants with VUR who are missed after the first UTI.3
The United Kingdom’s National Institute for Health and Care Excellence guideline recommends a VCUG for infants <6 months old with a bacteremic or non-E. coli UTI.30 Whether high-grade VUR is more common in young infants with bacteremic UTIs than nonbacteremic UTIs remains inconclusive. In the Honkinen et al. study that included 87 infants <3 months old with bacteremic UTIs, the prevalence of grade IV-V VUR (10%) and obstruction (7%) was higher than that of the 88 nonbacteremic infants (2% grade IV-V VUR and 2% with obstruction). In the multicenter study of 251 infants <3 months old with bacteremic UTIs, the prevalence of grade IV-V VUR was 12.1%.31 This is higher than that of the nonbacteremic infants in Honkinen et al.’s study32 but more similar to the prevalence of grade IV-V VUR found in Tsai et al. (8.2%) and Ismaili et al.’s (7.0%) studies of UTIs in general.29,33
There does appear to be a higher prevalence of urinary tract abnormalities in young infants with non-E. coli vs E. coli UTIs.31,32,34,35 The odds of an abnormal VCUG was 8.0 (95% CI: 2.3-28) times higher for non-E. coli than E. coli UTIs in the study of 251 bacteremic infants.31 In a study of 122 infants <3 months old, the odds of grade III-V VUR was 10 (95% CI 2.6-41) times higher for non-E. coli than E. coli UTIs.35
However, the need for early detection of VUR is controversial, and VCUGs are invasive, involve ionizing radiation, and may require sedation. Two recent trials (one which included only children with VUR and another in which 42% of subjects had VUR) demonstrated a modest effect of prophylactic antibiotics in preventing recurrent UTIs (>5,000 doses of antibiotics needed to prevent one UTI recurrence), but the effect size did not differ by the presence or degree of VUR, and neither demonstrated any benefit in reducing future renal scarring.36, 37 The benefit of surgical interventions for VUR also remains unclear, though studies are limited.38 Overall, there is no evidence suggesting that infants <2 months old require more vigilance for VUR detection than the 2-24 month age group.
SPECIAL CONSIDERATIONS
Bacteremic UTI
The prevalence of bacteremia in infants ≤60 days old with UTIs was 9% in a study conducted from 2008 to 2013 in 26 EDs and has ranged from 3% to 17% in older studies.10, 22 Many studies have described similar clinical and laboratory findings in young infants with bacteremic and nonbacteremic UTIs.39-41 Despite this, bacteremic UTIs have been associated with prolonged parenteral antibiotic courses, resulting in longer hospitalizations and increased costs.40 Two recent multicenter studies of infants with bacteremic UTIs (251 infants <3 months old22 and 115 infants ≤60 days old42) demonstrated variable IV courses and no association between IV duration and relapsed UTI. The latter study showed no risk difference in the adjusted 30-day UTI recurrence (risk difference 3%, 95% CI: −5.8 to 12.7) or all-cause reutilization (risk difference 3%, 95% CI: −14.5 to 20.6) between long and short IV groups.42 Neither study had patients with relapsed bacteremic UTIs or reported that patients suffered clinical deterioration while on oral antibiotics.22,42
Based on these data demonstrating that adverse outcomes are rare in infants with bacteremic UTIs and not associated with parenteral antibiotic duration, we recommend short parenteral courses (2-3 days) with conversion to oral therapy once infants have clinically improved.
Positive Urinalysis and Testing for Meningitis
Multiple risk stratification algorithms for febrile infants aged ≤60 days categorize infants with a positive UA (and therefore likely UTI) as high-risk for having concomitant bacteremia or meningitis, for which lumbar puncture (LP) is typically recommended.43-45 The risk of not testing CSF is the potential to insufficiently treat meningitis because treatment for UTIs and meningitis differ in dosing, route, and duration. Recent studies have challenged the practice of routine LPs for infants aged 1-2 months with a suspected UTI due to the low prevalence (0%-0.3%) of concomitant meningitis.39,46-48 A meta-analysis of 20 studies reporting rates of concomitant meningitis with UTI in infants aged 29-90 days found a pooled prevalence of 0.25% (95% CI: 0.09%-0.70%).49 Furthermore, a study of febrile infants ages 29-60 days found that the prevalence of meningitis did not differ between those with a positive vs negative UA (3/337 [0.9%] vs 5/498 [1.0%], respectively), suggesting that a positive UA alone should not modify the pretest probability of meningitis in this age group.50
Two studies have also examined the risk of delayed meningitis among infants ≤60 days old treated for UTIs without CSF testing. A northern California study that examined 345 episodes among 341 UA-positive infants aged 29-60 days found zero cases (95% CI: 0%-1.1%) of delayed meningitis within 30 days of evaluation.50 A multicenter study of well-appearing febrile infants aged 7-60 days found 0/505 cases (95% CI: 0%-0.6%) of delayed meningitis within 7 days of discharge; 407 (81%) were aged 31-60 days.51 In summary, studies have shown a low rate of concomitant meningitis and a low risk of delayed meningitis in infants aged 1-2 months treated for UTI without CSF testing. Given this, clinically targeted (eg, based on ill appearance and/or lethargy), rather than routine, CSF testing in this age group can be considered.
CONCLUSION
While the AAP UTI Guideline is directed toward 2-24-month-old infants, recent evidence suggests that action statements 3-6 apply to infants <2 months old. Incorporation of pyuria as a diagnostic criterion for UTIs, early transition to oral therapy, and selective VCUG testing are all warranted based on the available evidence and consideration of known risks and benefits. Future studies with larger sample sizes that include infants <2 months old would be beneficial to ensure that the available studies, which have relatively small cohorts, do not suffer from type II error. We propose that future studies examine shorter (<7 days) vs longer total antibiotic duration, shorter vs longer initial IV antibiotics (especially in infants <1 month old or with bacteremic UTIs), and whether RBUS can be performed in a targeted manner. RCTs comparing universal vs targeted imaging strategies would help ascertain whether the increased diagnostic yield that accompanies more aggressive imaging strategies translates into improved outcomes. Application of these AAP guidelines to the <2-month age group and enhancement of the evidence base can promote the high-value care of young infants with UTIs.
1. Greenhow TL, Hung YY, Herz AM, Losada E, Pantell RH. The changing epidemiology of serious bacterial infections in young infants. Pediatr Infect Dis J. 2014;33(6):595-599. https://doi.org/10.1097/INF.0000000000000225.
2. Spencer JD, Schwaderer A, McHugh K, Hains DS. Pediatric urinary tract infections: an analysis of hospitalizations, charges, and costs in the USA. Pediatr Nephrol. 2010;25(12):2469-2475. https://doi.org/10.1007/s00467-010-1625-8.
3. Subcommittee On Urinary Tract Infection. Reaffirmation of AAP Clinical Practice Guideline: the diagnosis and management of the initial urinary tract infection in febrile infants and young children 2-24 months of age. Pediatrics. 2016;138(6):1-5. https://doi.org/10.1542/peds.2016-3026.
4. Crain EF, Gershel JC. Urinary tract infections in febrile infants younger than 8 weeks of age. Pediatrics. 1990;86(3):363-367. https://doi.org/10.1542/peds.105.2.e20
5. Dayan PS, Bennett J, Best R, et al. Test characteristics of the urine Gram stain in infants <or= 60 days of age with fever. Pediatr Emerg Care. 2002;18(1):12-14. https://doi.org/10.1097/00006565-200202000-00004.
6. Bachur R, Harper MB. Reliability of the urinalysis for predicting urinary tract infections in young febrile children. Arch Pediatr Adolesc Med. 2001;155(1):60-65. https://doi.org/10.1001/archpedi.155.1.60.
7. Reardon JM, Carstairs KL, Rudinsky SL, Simon LV, Riffenburgh RH, Tanen DA. Urinalysis is not reliable to detect a urinary tract infection in febrile infants presenting to the ED. Am J Emerg Med. 2009;27(8):930-932. https://doi.org/10.1016/j.ajem.2008.07.015.
8. Schroeder AR, Lucas BP, Garber MD, McCulloh RJ, Joshi-Patel AA, Biondi EA. Negative urinalyses in febrile infants age 7 to 60 days treated for urinary tract infection. J Hosp Med. 2019;14(2):101-104. https://doi.org/10.12788/jhm.3120.
9. Schroeder AR, Chang PW, Shen MW, Biondi EA, Greenhow TL. Diagnostic accuracy of the urinalysis for urinary tract infection in infants <3 months of age. Pediatrics. 2015;135(6):965-971. https://doi.org/10.1542/peds.2015-0012.
10. Tzimenatos L, Mahajan P, Dayan PS, et al. Accuracy of the urinalysis for urinary tract infections in febrile infants 60 days and younger. Pediatrics. 2018;141(2):e20173068. https://doi.org/10.1542/peds.2017-3068.
11. Newman TB, Kohn MA. Evidence-based diagnosis. Practical Guides to Biostatistics and Epidemiology. Cambridge; New York: Cambridge University Press, 2009.
12. Shaikh N, Shope TR, Hoberman A, Vigliotti A, Kurs-Lasky M, Martin JM. Association Between Uropathogen and Pyuria. Pediatrics. 2016;138(1):e20160087. https://doi.org/10.1542/peds.2016-0087.
13. Eliacik K, Kanik A, Yavascan O, et al. A comparison of bladder catheterization and suprapubic aspiration methods for urine sample collection from infants with a suspected urinary tract infection. Clin Pediatr. 2016;55(9):819-824. https://doi.org/10.1177/0009922815608278.
14. Bocquet N, Sergent Alaoui A, Jais JP, et al. Randomized trial of oral versus sequential IV/oral antibiotic for acute pyelonephritis in children. Pediatrics. 2012;129(2):e269-e275. https://doi.org/10.1542/peds.2011-0814.
15. Bouissou F, Munzer C, Decramer S, et al. Prospective, randomized trial comparing short and long intravenous antibiotic treatment of acute pyelonephritis in children: dimercaptosuccinic acid scintigraphic evaluation at 9 months. Pediatrics. 2008;121(3):e553-e560. https://doi.org/10.1542/peds.2006-3632.
16. Hodson EM, Willis NS, Craig JC. Antibiotics for acute pyelonephritis in children. Cochrane Database Syst Rev. 2007(4):CD003772. https://doi.org/10.1002/14651858.CD003772.pub3.
17. Neuhaus TJ, Berger C, Buechner K, et al. Randomised trial of oral versus sequential intravenous/oral cephalosporins in children with pyelonephritis. Eur J Pediatr. 2008;167(9):1037-1047. https://doi.org/10.1007/s00431-007-0638-1
18. Hoberman A, Wald ER, Hickey RW, et al. Oral versus initial intravenous therapy for urinary tract infections in young febrile children. Pediatrics. 1999;104(1 Pt 1):79-86. https://doi.org/10.1542/peds.104.1.79.
19. Strohmeier Y, Hodson EM, Willis NS, Webster AC, Craig JC. Antibiotics for acute pyelonephritis in children. Cochrane Database Syst Rev. 2014(7):CD003772. https://doi.org/10.1002/14651858.CD003772.pub4.
20. Lewis-de Los Angeles WW, Thurm C, Hersh AL, et al. Trends in intravenous antibiotic duration for urinary tract infections in young infants. Pediatrics. 2017;140(6):e20171021. https://doi.org/10.1542/peds.2017-1021.
21. Brady PW, Conway PH, Goudie A. Length of intravenous antibiotic therapy and treatment failure in infants with urinary tract infections. Pediatrics. 2010;126(2):196-203. https://doi.org/10.1542/peds.2009-2948.
22. Schroeder AR, Shen MW, Biondi EA, et al. Bacteraemic urinary tract infection: management and outcomes in young infants. Arch Dis Child. 2016;101(2):125-130. https://doi.org/10.1136/archdischild-2014-307997.
23. Joshi NS, Lucas BP, Schroeder AR. Physician preferences surrounding urinary tract infection management in neonates. Hosp Pediatr. 2018;8(1):21-27. https://doi.org/10.1542/hpeds.2017-0082.
24. Magin EC, Garcia-Garcia JJ, Sert SZ, Giralt AG, Cubells CL. Efficacy of short-term intravenous antibiotic in neonates with urinary tract infection. Pediatr Emerg Care. 2007;23(2):83-86. https://doi.org/10.1097/PEC.0b013e3180302c47.
25. Wang ME, Lee V, Greenhow TL, et al. Clinical response to discordant therapy in third-generation cephalosporin-resistant UTIs. Pediatrics. 2019; In press.
26. Keren R, Chan E. A meta-analysis of randomized, controlled trials comparing short- and long-course antibiotic therapy for urinary tract infections in children. Pediatrics. 2002;109(5):E70. https://doi.org/10.1542/peds.109.5.e70.
27. Michael M, Hodson EM, Craig JC, Martin S, Moyer VA. Short versus standard duration oral antibiotic therapy for acute urinary tract infection in children. Cochrane Database Syst Rev. 2003(1):CD003966. https://doi.org/10.1002/14651858.CD003966.
28. Finnell SM, Carroll AE, Downs SM, Subcommittee on Urinary Tract I. Technical report-Diagnosis and management of an initial UTI in febrile infants and young children. Pediatrics. 2011;128(3):e749-e770. https://doi.org/10.1542/peds.2011-1332.
29. Tsai JD, Huang CT, Lin PY, et al. Screening high-grade vesicoureteral reflux in young infants with a febrile urinary tract infection. Pediatr Nephrol. 2012;27(6):955-963. https://doi.org/10.1007/s00467-012-2104-1.
30. National Institue for Health and Care Excellence. Urinary Tract Infection in Children. http://www.nice.org.uk/guidance/cg54/evidence/cg54-urinary-tract-infection-in-children-full-guideline2. Published August 2007. Accessed August 2019.
31. Chang PW, Abidari JM, Shen MW, et al. Urinary imaging findings in young infants with bacteremic urinary tract infection. Hosp Pediatr. 2016;6(11):647-652. https://doi.org/10.1542/hpeds.2015-0229.
32. Honkinen O, Jahnukainen T, Mertsola J, Eskola J, Ruuskanen O. Bacteremic urinary tract infection in children. Pediatr Infect Dis J. 2000;19(7):630-634. https://doi.org/10.1097/00006454-200007000-00009
33. Ismaili K, Lolin K, Damry N, Alexander M, Lepage P, Hall M. Febrile urinary tract infections in 0- to 3-month-old infants: a prospective follow-up study. J Pediatr. 2011;158(1):91-94. https://doi.org/10.1016/j.jpeds.2010.06.053.
34. Cleper R, Krause I, Eisenstein B, Davidovits M. Prevalence of vesicoureteral reflux in neonatal urinary tract infection. Clin Pediatr. 2004;43(7):619-625. https://doi.org/10.1177/000992280404300706.
35. Pauchard JY, Chehade H, Kies CZ, Girardin E, Cachat F, Gehri M. Avoidance of voiding cystourethrography in infants younger than 3 months with Escherichia coli urinary tract infection and normal renal ultrasound. Arch Dis Child. 2017;102(9):804-808. https://doi.org/10.1136/archdischild-2016-311587.
36. Craig JC, Simpson JM, Williams GJ, et al. Antibiotic prophylaxis and recurrent urinary tract infection in children. N Engl J Med. 2009;361(18):1748-1759. https://doi.org/10.1056/NEJMoa0902295.
37. Hoberman A, Greenfield SP, Mattoo TK, et al. Antimicrobial prophylaxis for children with vesicoureteral reflux. N Engl J Med. 2014;370(25):2367-2376. https://doi.org/10.1056/NEJMoa1401811.
38. Williams G, Hodson EM, Craig JC. Interventions for primary vesicoureteric reflux. Cochrane Database Syst Rev. 2019;(2):CD001532. https://doi.org/10.1002/14651858.CD001532.pub4.
39. Schnadower D, Kuppermann N, Macias CG, et al. Febrile infants with urinary tract infections at very low risk for adverse events and bacteremia. Pediatrics. 2010;126(6):1074-1083. https://doi.org/10.1542/peds.2010-0479,
40. Roman HK, Chang PW, Schroeder AR. Diagnosis and management of bacteremic urinary tract infection in infants. Hosp Pediatr. 2015;5(1):1-8. https://doi.org/10.1542/hpeds.2014-0051.
41. Newman TB, Bernzweig JA, Takayama JI, Finch SA, Wasserman RC, Pantell RH. Urine testing and urinary tract infections in febrile infants seen in office settings: the Pediatric Research in Office Settings’ Febrile Infant Study. Arch Pediatr Adolesc Med. 2002;156(1):44-54. https://doi.org/10.1001/archpedi.156.1.44.
42. Desai S, Aronson PL, Shabanova V, et al. Parenteral antibiotic therapy duration in young infants with bacteremic urinary tract infections. Pediatrics. 2019;144(3):e20183844. https://doi.org/10.1542/peds.2018-3844,
43. Gomez B, Mintegi S, Bressan S, et al. Validation of the “Step-by-Step” approach in the management of young febrile infants. Pediatrics. 2016;138(2):e20154381. https://doi.org/10.1542/peds.2015-4381.
44. Kuppermann N, Dayan PS, Levine DA, et al. A clinical prediction rule to identify febrile infants 60 days and younger at low risk for serious bacterial infections. JAMA Pediatr. 2019;173(4):342-351. https://doi.org/10.1001/jamapediatrics.2018.5501.
45. DePorre AG, Aronson PL, McCulloh RJ. Facing the ongoing challenge of the febrile young infant. Crit Care. 2017;21(1):68. https://doi.org/10.1186/s13054-017-1646-9,
46. Tebruegge M, Pantazidou A, Clifford V, et al. The age-related risk of co-existing meningitis in children with urinary tract infection. PLoS One. 2011;6(11):e26576. https://doi.org/10.1371/journal.pone.0026576.
47. Thomson J, Cruz AT, Nigrovic LE, et al. Concomitant bacterial meningitis in infants with urinary tract infection. Pediatr Infect Dis J. 2017;36(9):908-910. https://doi.org/10.1097/INF.0000000000001626.
48. Wallace SS, Brown DN, Cruz AT. Prevalence of concomitant acute bacterial meningitis in neonates with febrile urinary tract infection: a retrospective cross-sectional study. J Pediatr. 2017;184:199-203. https://doi.org/10.1016/j.jpeds.2017.01.022.
49. Nugent J, Childers M, Singh-Miller N, Howard R, Allard R, Eberly M. Risk of meningitis in infants aged 29 to 90 days with urinary tract infection: a systematic review and meta-analysis. J Pediatr. 2019;212:102-110.e5. https://doi.org/10.1016/j.jpeds.2019.04.053.
50. Young BR, Nguyen THP, Alabaster A, Greenhow TL. The prevalence of bacterial meningitis in febrile infants 29-60 days with positive urinalysis. Hosp Pediatr. 2018;8(8):450-457. https
51. Wang ME, Biondi EA, McCulloh RJ, et al. Testing for meningitis in febrile well-appearing young infants with a positive urinalysis. Pediatrics. 2019;144(3):e20183979. https://doi.org/10.1542/peds.2018-3979.
© 2020 Society of Hospital Medicine
Negative Urinalyses in Febrile Infants Age 7 to 60 Days Treated for Urinary Tract Infection
The sensitivity of the urinalysis (UA) in young infants has been reported to be in the 75% to 85% range.1-4 This suboptimal sensitivity has prevented a widespread adoption of the UA as a true screening test for urinary tract infection (UTI). Although infants with a positive urine culture and a negative UA may have asymptomatic bacteriuria (AB) or contamination,5-7 they are often treated for UTI.
Due to these concerns, the American Academy of Pediatrics (AAP) recommended in their 2011 UTI Practice Guidelines that UA criteria should be incorporated into the definition of UTI.1 However, these guidelines were intended for the 2-24 month age range, leaving a gap in our understanding of the appropriate management of infants <2 months. It is unknown how UA results influence the current management of UTI in young, febrile infants. Using data from a large, nationally representative quality improvement project surrounding the management of febrile infants, this investigation aimed to examine how frequently infants are treated for UTI despite having normal UAs and to determine whether infant and hospital characteristics are different in infants treated for UTI with a positive UA as compared to those treated for UTI with a negative UA.
METHODS
Subjects and Setting
This is a secondary analysis of the AAP’s Reducing Excessive Variability in the Infant Sepsis Evaluation (REVISE) project that involved 20,570 well-appearing infants 7-60 days of age evaluated in the emergency department and/or inpatient setting for fever ≥38◦C without a source between September 2015 and November 2017 at 124 community- and university-based hospitals in the United States. Data were collected via chart review and entered into a standardized tool for the project. This project was deemed exempt by the AAP Institutional Review Board. Because all data were de-identified, some sites did not require Institutional Review Board approval while others required data sharing agreements.
Variables and Definitions
A positive UA was defined as having any leukocyte esterase, positive nitrites, or >5 white blood cells (WBCs) per high power field. Treatment for UTI was defined using the question “Did the urine culture grow an organism that was treated as a pathogen with a full course of antibiotics?” Subjects treated for meningitis or bacteremia were excluded in order to focus on uncomplicated UTI. “Abnormal inflammatory markers” were defined as having a WBC count <5,000 or >15,000 cells/mm3, an absolute band count ≥ 1,500 cells/mm3, a band to neutrophil ratio of >0.2, cerebrospinal fluid (CSF) WBC count of >8/mm3, a positive CSF gram stain, or an elevated C-reactive protein or procalcitonin level, as defined by the institutional range. Although technically not an “inflammatory marker,” CSF gram stain was included in this composite variable because in the rare cases that it is positive, the result would likely influence risk stratification and immediate management. Infants’ ages were categorized as either 7-30 days or 31-60 days. Hospital length-of-stay (LOS) was recorded to the nearest hour and infants who were not hospitalized were assigned a LOS of 0 hours. Hospital characteristics were determined through a survey completed by site leads.
Statistics
Proportions were compared using chi-square test. We used multilevel mixed-effects logistic regression to determine associations between patients and hospital characteristics and UA-positivity in subjects treated for UTI. We accounted for the hospital clustering effect with a random effect that did not vary with patient characteristics. We “marginalized” the regression coefficients to reflect the average effect across hospitals.8,9 We tested the overall importance of the hospital clustering effect on the treatment by comparing our multilevel model to a single-level model without hospital random effects using the likelihood ratio test.
RESULTS
A total of 20,570 infants from 124 hospitals were enrolled in the REVISE project, and 648 (3.2%) were treated for bacteremia and/or meningitis. Of the remaining 19,922 infants, 2,407 (12.1%) were treated for UTI, of whom 2,298 (95.5%) had an initial UA performed. Urine cultures were obtained by catheterization or suprapubic aspirate in 90.3% and “other/unknown” in 9.7% of these 2,298 subjects.
UAs were negative in 337/2,298 (14.7%) treated subjects. UA-negative subjects were more likely to be 7-30 days old (adjusted odds ratio [aOR] 1.3, 95% CI 1.02-1.7) and have upper respiratory symptoms (aOR 1.7, 95% CI 1.3-2.3) and were less likely to have abnormal inflammatory markers (aOR 0.3, 95% CI 0.3-0.4) than UA+ subjects (Table). Even after accounting for the hospital characteristics depicted in the Table, treatment of UA-negative UTI was affected by the hospital (P < .001), and the intraclass correlation coefficient was 6% (95% CI, 3% to 14%). The Figure illustrates substantial site variability in the proportion of infants treated for UTIs that were UA-negative, ranging from 0% to 35% in hospitals with ≥20 UTI cases.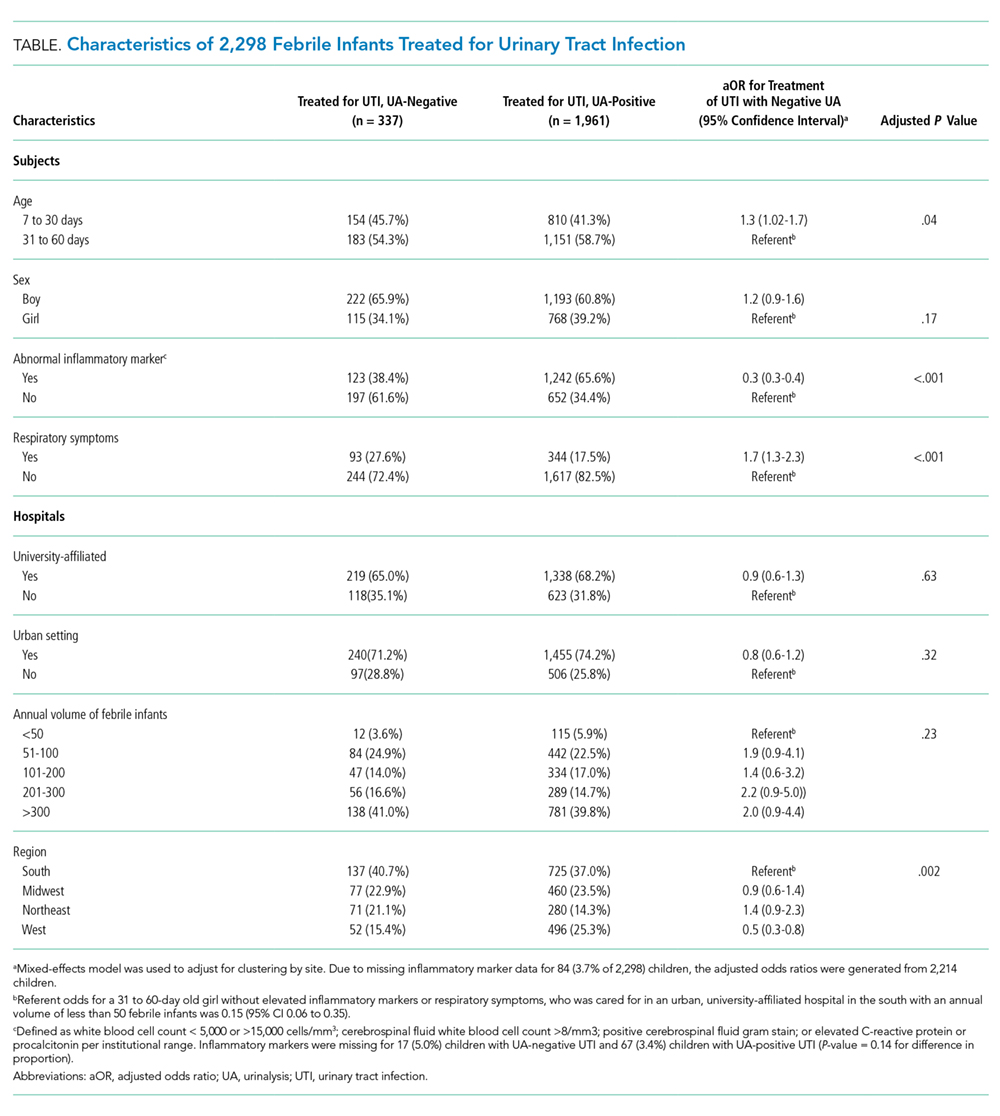
There was no significant difference in the proportion of catheterized specimens in infants treated for UTIs with negative versus positive UAs (90% vs 92%, P = .26). The median hospital (interquartile range) LOS in infants treated for UTI with positive UAs was 58 (45-78) hours, compared to 54 (38-76) hours in infants treated for UTI with negative UAs and 34 (0-49) hours in infants who were not treated for UTI, meningitis, or bacteremia.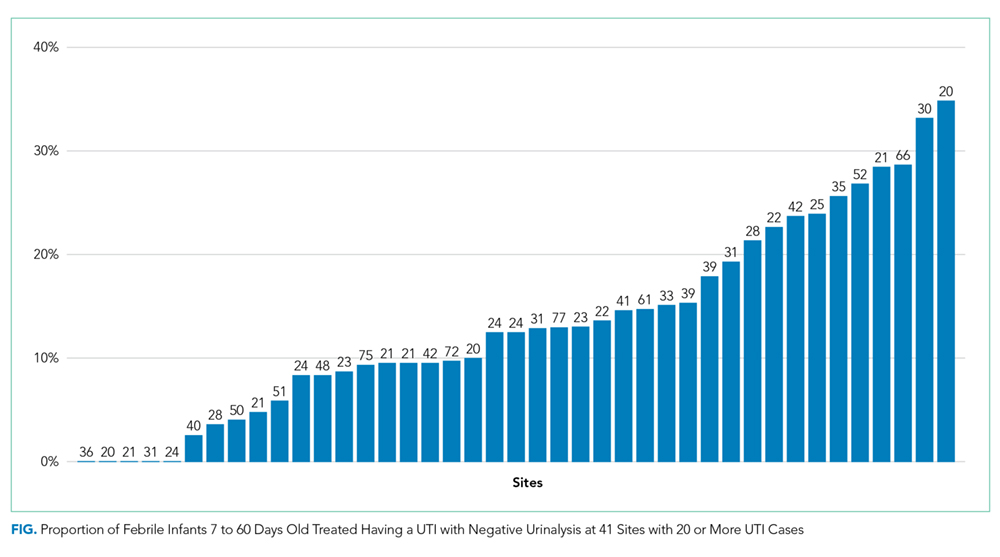
DISCUSSION
In this large, nationally representative sample of febrile infants 7-60 days of age, we demonstrate that nearly 15% of young febrile infants who are treated for UTIs have normal UAs. This proportion varied considerably among hospitals, suggesting that there are institutional differences in the approach to the UA. Infants treated for UA-negative UTIs were more likely to have respiratory symptoms and less likely to have abnormal inflammatory markers than infants treated for UA-positive UTIs, indicating that these infants are either developing a milder inflammatory response to their underlying illness and/or might not have true UTIs (eg due to AB or contamination).
The AAP recently updated their UTI practice parameter to recommend inclusion of UA results as diagnostic criteria for UTI.1 However, the fact that these guidelines do not include infants <2 months creates a gap in our understanding of the appropriate diagnostic criteria in this age group, as reflected by the site variability demonstrated in our investigation. The fact that up to 35% of infants treated for UTI at these different sites have normal UAs suggests that many practitioners continue to treat positive urine cultures regardless of UA values.
Several prior studies provide insight into the clinical significance of a positive urine culture in the absence of pyuria. Wettergren et al.6,7,10 reported growth from suprapubic aspirate in 1.4% of infants who were screened periodically with urine cultures obtained by bag at well-child checks over the course of the first year (with a point prevalence as high as 1.5% in boys aged 0.25 to 1.9 months).10 These infants were not more likely to have subsequent UTIs7 or renal damage6 than infants without asymptomatic growth, leading the authors to conclude that this growth likely represented AB. These findings emphasize that the probability of a positive urine culture in any infant, even asymptomatic infants, is not insignificant.
Hoberman et al.11 demonstrated that dimercaptosuccinic acid scans did not reveal signs of pyelonephritis in 14/15 children < 2 years of age with urine cultures growing >50,000 CFU/mL but no pyuria on UA, and concluded that AB was the most likely explanation for this combination of findings. Schroeder et al.5 and Tzimenatos et al.12 examined infants <2-3 months with UTI and bacteremia caused by the same organism (and hence a true infection that cannot be explained by AB or contamination) and demonstrated that the UA sensitivity in this population was 99.5% and 100%, respectively, suggesting that the prior lower estimates of UA sensitivity in UTI in general, may have been biased by inclusion of positive urine cultures that did not represent UTI.
On the other hand, Shaikh et al.13 recently demonstrated that the sensitivity of the UA appears to vary by organism, with lower reported sensitivity in non-Escherichia coli organisms, leading the authors to conclude that this variability is evidence of suboptimal UA sensitivity. However, an alternative explanation for their findings is that non-E coli organisms may be more likely to cause AB or contamination.14 The fact that follow-up suprapubic aspirates on infants with untreated catheterized cultures yielding these organisms are often negative supports this alternative explanation.15
The median LOS in infants with UA-negative UTI was nearly one day longer than infants not treated for serious bacterial infection. These infants may have also undergone urinary imaging and possibly prophylactic antibiotics, indicating high resource burden created by this subgroup of infants. Expanding AAP UTI guidelines to infants <2 months of age would likely reduce resource utilization, but continued research is needed to assess the safety of this approach. Young infants have immature immune systems and may not develop a timely inflammatory response to UTI, which raises concerns about missing bacterial infections.
Our investigation has several strengths, including the large, nationally representative sample that includes both children’s and non-children’s hospitals. Similar febrile infant investigations of this size have previously been possible only using administrative databases, but our investigation required chart review for all enrolled infants, ensuring that the subjects were febrile, well-appearing, and were treated for UTI. However, our findings are limited in that data were collected primarily as part of a quality improvement initiative, and some of our thresholds for “abnormal” laboratory values might be controversial. For example, urine WBC thresholds differ across studies, and our CSF WBC threshold of >8/mm3 may be somewhat low given prior reports that values slightly above this threshold might be normal in infants under one month of age.16 The original intent of the inflammatory marker composite variable was to aid in risk stratification, but we were unable to collect granular data for all potentially relevant variables. In planning the REVISE project, we attempted to create straightforward, unambiguous variables to facilitate the anticipated high volume of chart reviews. Although patients categorized as having UTI might not have had true UTIs, by linking the “UTI” variable to practitioner management (rather than UA and microbiologic definitions), our data reflect real-world practice.
Acknowledgments
The authors would like to thank all of the site directors who participated in the REVISE project, and Brittany Jennings, Naji Hattar, Faiza Wasif, and Vanessa Shorte at the American Academy of Pediatrics for their leadership and management.
Disclosures
Dr. Schroeder has received honoraria for grand rounds presentations on the subject of urinary tract infections, and Dr. Biondi has received consulting fees from McKesson Inc. The other authors have no financial relationships to disclose.
1. Roberts KB. Urinary tract infection: Clinical practice guideline for the diagnosis and management of the initial UTI in febrile infants and children 2 to 24 months. Pediatrics. 2011;128(3):595-610. doi: 10.1542/peds.2011-1330. PubMed
2. Bachur R, Harper MB. Reliability of the urinalysis for predicting urinary tract infections in young febrile children. Arch Pediatr Adolesc Med. 2001;155(1):60. doi: 10.1001/archpedi.155.1.60. PubMed
3. Bonadio W, Maida G. Urinary tract infection in outpatient febrile infants younger than 30 days of age. Pediatr Infect Dis J. 2014;33(4):342-344. doi: 10.1097/inf.0000000000000110. PubMed
4. Hoberman A, Wald ER. Urinary tract infections in young febrile children. Pediatr Infect Dis J. 1997;16(1):11-17. doi: 10.1097/00006454-199701000-00004. PubMed
5. Schroeder AR, Chang PW, Shen MW, Biondi EA, Greenhow TL. Diagnostic accuracy of the urinalysis for urinary tract infection in infants <3 months of age. Pediatrics. 2015;135(6). doi: 10.1542/peds.2015-0012d. PubMed
6. Wettergren B, Hellstrom M, Stokland E, Jodal U. Six-year follow up of infants with bacteriuria on screening. BMJ. 1990;301(6756):845-848. doi: 10.1136/bmj.301.6756.845. PubMed
7. Wettergren B, Jodal U. Spontaneous clearance of asymptomatic bacteriuria in infants. Acta Paediatrica. 1990;79(3):300-304. doi: 10.1111/j.1651-2227.1990.tb11460.x. PubMed
8. Hedeker D, Toit SHCD, Demirtas H, Gibbons RD. A note on the marginalization of regression parameters from mixed models of binary outcomes. Biometrics. 2017;74(1):354-361. doi: 10.1111/biom.12707. PubMed
9. Neuhaus JM, Kalbfleisch JD, Hauck WW. A comparison of cluster-specific and population-averaged approaches for analyzing correlated binary data. Int Stat Rev. 1991;59(1):25. doi: 10.2307/1403572.
10. Wettergren B, Jodal U, Jonasson G. Epidemiology of bacteriuria during the first year of life. Acta Paediatrica. 1985;74(6):925-933. doi: 10.1111/j.1651-2227.1985.tb10059.x. PubMed
11. Hoberman A, Wald ER, Reynolds EA, Penchansky L, Charron M. Is urine culture necessary to rule out urinary tract infection in young febrile children? Pediatr Infect Dis J. 1996;15(4):304-309. doi: 10.1097/00006454-199604000-00005. PubMed
12. Tzimenatos L, Mahajan P, Dayan PS, et al. Accuracy of the urinalysis for urinary tract infections in febrile infants 60 days and younger. Pediatrics. 2018;141(2). doi: 10.1542/peds.2017-3068. PubMed
13. Shaikh N, Shope TR, Hoberman A, Vigliotti A, Kurs-Lasky M, Martin JM. Association between uropathogen and pyuria. Pediatrics. 2016;138(1). doi: 10.1542/peds.2016-0087. PubMed
14. Schroeder AR. UTI and faulty gold standards. Pediatrics. 2017;139(3). doi: 10.1542/peds.2016-3814a. PubMed
15. Eliacik K, Kanik A, Yavascan O, et al. A comparison of bladder catheterization and suprapubic aspiration methods for urine sample collection from infants with a suspected urinary tract infection. Clinical Pediatrics. 2016;55(9):819-824. doi: 10.1177/0009922815608278. PubMed
16. Thomson J, Sucharew H, Cruz AT, et al. Cerebrospinal fluid reference values for young infants undergoing lumbar puncture. Pediatrics. 2018;141(3). doi: 10.1542/peds.2017-3405. PubMed
The sensitivity of the urinalysis (UA) in young infants has been reported to be in the 75% to 85% range.1-4 This suboptimal sensitivity has prevented a widespread adoption of the UA as a true screening test for urinary tract infection (UTI). Although infants with a positive urine culture and a negative UA may have asymptomatic bacteriuria (AB) or contamination,5-7 they are often treated for UTI.
Due to these concerns, the American Academy of Pediatrics (AAP) recommended in their 2011 UTI Practice Guidelines that UA criteria should be incorporated into the definition of UTI.1 However, these guidelines were intended for the 2-24 month age range, leaving a gap in our understanding of the appropriate management of infants <2 months. It is unknown how UA results influence the current management of UTI in young, febrile infants. Using data from a large, nationally representative quality improvement project surrounding the management of febrile infants, this investigation aimed to examine how frequently infants are treated for UTI despite having normal UAs and to determine whether infant and hospital characteristics are different in infants treated for UTI with a positive UA as compared to those treated for UTI with a negative UA.
METHODS
Subjects and Setting
This is a secondary analysis of the AAP’s Reducing Excessive Variability in the Infant Sepsis Evaluation (REVISE) project that involved 20,570 well-appearing infants 7-60 days of age evaluated in the emergency department and/or inpatient setting for fever ≥38◦C without a source between September 2015 and November 2017 at 124 community- and university-based hospitals in the United States. Data were collected via chart review and entered into a standardized tool for the project. This project was deemed exempt by the AAP Institutional Review Board. Because all data were de-identified, some sites did not require Institutional Review Board approval while others required data sharing agreements.
Variables and Definitions
A positive UA was defined as having any leukocyte esterase, positive nitrites, or >5 white blood cells (WBCs) per high power field. Treatment for UTI was defined using the question “Did the urine culture grow an organism that was treated as a pathogen with a full course of antibiotics?” Subjects treated for meningitis or bacteremia were excluded in order to focus on uncomplicated UTI. “Abnormal inflammatory markers” were defined as having a WBC count <5,000 or >15,000 cells/mm3, an absolute band count ≥ 1,500 cells/mm3, a band to neutrophil ratio of >0.2, cerebrospinal fluid (CSF) WBC count of >8/mm3, a positive CSF gram stain, or an elevated C-reactive protein or procalcitonin level, as defined by the institutional range. Although technically not an “inflammatory marker,” CSF gram stain was included in this composite variable because in the rare cases that it is positive, the result would likely influence risk stratification and immediate management. Infants’ ages were categorized as either 7-30 days or 31-60 days. Hospital length-of-stay (LOS) was recorded to the nearest hour and infants who were not hospitalized were assigned a LOS of 0 hours. Hospital characteristics were determined through a survey completed by site leads.
Statistics
Proportions were compared using chi-square test. We used multilevel mixed-effects logistic regression to determine associations between patients and hospital characteristics and UA-positivity in subjects treated for UTI. We accounted for the hospital clustering effect with a random effect that did not vary with patient characteristics. We “marginalized” the regression coefficients to reflect the average effect across hospitals.8,9 We tested the overall importance of the hospital clustering effect on the treatment by comparing our multilevel model to a single-level model without hospital random effects using the likelihood ratio test.
RESULTS
A total of 20,570 infants from 124 hospitals were enrolled in the REVISE project, and 648 (3.2%) were treated for bacteremia and/or meningitis. Of the remaining 19,922 infants, 2,407 (12.1%) were treated for UTI, of whom 2,298 (95.5%) had an initial UA performed. Urine cultures were obtained by catheterization or suprapubic aspirate in 90.3% and “other/unknown” in 9.7% of these 2,298 subjects.
UAs were negative in 337/2,298 (14.7%) treated subjects. UA-negative subjects were more likely to be 7-30 days old (adjusted odds ratio [aOR] 1.3, 95% CI 1.02-1.7) and have upper respiratory symptoms (aOR 1.7, 95% CI 1.3-2.3) and were less likely to have abnormal inflammatory markers (aOR 0.3, 95% CI 0.3-0.4) than UA+ subjects (Table). Even after accounting for the hospital characteristics depicted in the Table, treatment of UA-negative UTI was affected by the hospital (P < .001), and the intraclass correlation coefficient was 6% (95% CI, 3% to 14%). The Figure illustrates substantial site variability in the proportion of infants treated for UTIs that were UA-negative, ranging from 0% to 35% in hospitals with ≥20 UTI cases.
There was no significant difference in the proportion of catheterized specimens in infants treated for UTIs with negative versus positive UAs (90% vs 92%, P = .26). The median hospital (interquartile range) LOS in infants treated for UTI with positive UAs was 58 (45-78) hours, compared to 54 (38-76) hours in infants treated for UTI with negative UAs and 34 (0-49) hours in infants who were not treated for UTI, meningitis, or bacteremia.
DISCUSSION
In this large, nationally representative sample of febrile infants 7-60 days of age, we demonstrate that nearly 15% of young febrile infants who are treated for UTIs have normal UAs. This proportion varied considerably among hospitals, suggesting that there are institutional differences in the approach to the UA. Infants treated for UA-negative UTIs were more likely to have respiratory symptoms and less likely to have abnormal inflammatory markers than infants treated for UA-positive UTIs, indicating that these infants are either developing a milder inflammatory response to their underlying illness and/or might not have true UTIs (eg due to AB or contamination).
The AAP recently updated their UTI practice parameter to recommend inclusion of UA results as diagnostic criteria for UTI.1 However, the fact that these guidelines do not include infants <2 months creates a gap in our understanding of the appropriate diagnostic criteria in this age group, as reflected by the site variability demonstrated in our investigation. The fact that up to 35% of infants treated for UTI at these different sites have normal UAs suggests that many practitioners continue to treat positive urine cultures regardless of UA values.
Several prior studies provide insight into the clinical significance of a positive urine culture in the absence of pyuria. Wettergren et al.6,7,10 reported growth from suprapubic aspirate in 1.4% of infants who were screened periodically with urine cultures obtained by bag at well-child checks over the course of the first year (with a point prevalence as high as 1.5% in boys aged 0.25 to 1.9 months).10 These infants were not more likely to have subsequent UTIs7 or renal damage6 than infants without asymptomatic growth, leading the authors to conclude that this growth likely represented AB. These findings emphasize that the probability of a positive urine culture in any infant, even asymptomatic infants, is not insignificant.
Hoberman et al.11 demonstrated that dimercaptosuccinic acid scans did not reveal signs of pyelonephritis in 14/15 children < 2 years of age with urine cultures growing >50,000 CFU/mL but no pyuria on UA, and concluded that AB was the most likely explanation for this combination of findings. Schroeder et al.5 and Tzimenatos et al.12 examined infants <2-3 months with UTI and bacteremia caused by the same organism (and hence a true infection that cannot be explained by AB or contamination) and demonstrated that the UA sensitivity in this population was 99.5% and 100%, respectively, suggesting that the prior lower estimates of UA sensitivity in UTI in general, may have been biased by inclusion of positive urine cultures that did not represent UTI.
On the other hand, Shaikh et al.13 recently demonstrated that the sensitivity of the UA appears to vary by organism, with lower reported sensitivity in non-Escherichia coli organisms, leading the authors to conclude that this variability is evidence of suboptimal UA sensitivity. However, an alternative explanation for their findings is that non-E coli organisms may be more likely to cause AB or contamination.14 The fact that follow-up suprapubic aspirates on infants with untreated catheterized cultures yielding these organisms are often negative supports this alternative explanation.15
The median LOS in infants with UA-negative UTI was nearly one day longer than infants not treated for serious bacterial infection. These infants may have also undergone urinary imaging and possibly prophylactic antibiotics, indicating high resource burden created by this subgroup of infants. Expanding AAP UTI guidelines to infants <2 months of age would likely reduce resource utilization, but continued research is needed to assess the safety of this approach. Young infants have immature immune systems and may not develop a timely inflammatory response to UTI, which raises concerns about missing bacterial infections.
Our investigation has several strengths, including the large, nationally representative sample that includes both children’s and non-children’s hospitals. Similar febrile infant investigations of this size have previously been possible only using administrative databases, but our investigation required chart review for all enrolled infants, ensuring that the subjects were febrile, well-appearing, and were treated for UTI. However, our findings are limited in that data were collected primarily as part of a quality improvement initiative, and some of our thresholds for “abnormal” laboratory values might be controversial. For example, urine WBC thresholds differ across studies, and our CSF WBC threshold of >8/mm3 may be somewhat low given prior reports that values slightly above this threshold might be normal in infants under one month of age.16 The original intent of the inflammatory marker composite variable was to aid in risk stratification, but we were unable to collect granular data for all potentially relevant variables. In planning the REVISE project, we attempted to create straightforward, unambiguous variables to facilitate the anticipated high volume of chart reviews. Although patients categorized as having UTI might not have had true UTIs, by linking the “UTI” variable to practitioner management (rather than UA and microbiologic definitions), our data reflect real-world practice.
Acknowledgments
The authors would like to thank all of the site directors who participated in the REVISE project, and Brittany Jennings, Naji Hattar, Faiza Wasif, and Vanessa Shorte at the American Academy of Pediatrics for their leadership and management.
Disclosures
Dr. Schroeder has received honoraria for grand rounds presentations on the subject of urinary tract infections, and Dr. Biondi has received consulting fees from McKesson Inc. The other authors have no financial relationships to disclose.
1. Roberts KB. Urinary tract infection: Clinical practice guideline for the diagnosis and management of the initial UTI in febrile infants and children 2 to 24 months. Pediatrics. 2011;128(3):595-610. doi: 10.1542/peds.2011-1330. PubMed
2. Bachur R, Harper MB. Reliability of the urinalysis for predicting urinary tract infections in young febrile children. Arch Pediatr Adolesc Med. 2001;155(1):60. doi: 10.1001/archpedi.155.1.60. PubMed
3. Bonadio W, Maida G. Urinary tract infection in outpatient febrile infants younger than 30 days of age. Pediatr Infect Dis J. 2014;33(4):342-344. doi: 10.1097/inf.0000000000000110. PubMed
4. Hoberman A, Wald ER. Urinary tract infections in young febrile children. Pediatr Infect Dis J. 1997;16(1):11-17. doi: 10.1097/00006454-199701000-00004. PubMed
5. Schroeder AR, Chang PW, Shen MW, Biondi EA, Greenhow TL. Diagnostic accuracy of the urinalysis for urinary tract infection in infants <3 months of age. Pediatrics. 2015;135(6). doi: 10.1542/peds.2015-0012d. PubMed
6. Wettergren B, Hellstrom M, Stokland E, Jodal U. Six-year follow up of infants with bacteriuria on screening. BMJ. 1990;301(6756):845-848. doi: 10.1136/bmj.301.6756.845. PubMed
7. Wettergren B, Jodal U. Spontaneous clearance of asymptomatic bacteriuria in infants. Acta Paediatrica. 1990;79(3):300-304. doi: 10.1111/j.1651-2227.1990.tb11460.x. PubMed
8. Hedeker D, Toit SHCD, Demirtas H, Gibbons RD. A note on the marginalization of regression parameters from mixed models of binary outcomes. Biometrics. 2017;74(1):354-361. doi: 10.1111/biom.12707. PubMed
9. Neuhaus JM, Kalbfleisch JD, Hauck WW. A comparison of cluster-specific and population-averaged approaches for analyzing correlated binary data. Int Stat Rev. 1991;59(1):25. doi: 10.2307/1403572.
10. Wettergren B, Jodal U, Jonasson G. Epidemiology of bacteriuria during the first year of life. Acta Paediatrica. 1985;74(6):925-933. doi: 10.1111/j.1651-2227.1985.tb10059.x. PubMed
11. Hoberman A, Wald ER, Reynolds EA, Penchansky L, Charron M. Is urine culture necessary to rule out urinary tract infection in young febrile children? Pediatr Infect Dis J. 1996;15(4):304-309. doi: 10.1097/00006454-199604000-00005. PubMed
12. Tzimenatos L, Mahajan P, Dayan PS, et al. Accuracy of the urinalysis for urinary tract infections in febrile infants 60 days and younger. Pediatrics. 2018;141(2). doi: 10.1542/peds.2017-3068. PubMed
13. Shaikh N, Shope TR, Hoberman A, Vigliotti A, Kurs-Lasky M, Martin JM. Association between uropathogen and pyuria. Pediatrics. 2016;138(1). doi: 10.1542/peds.2016-0087. PubMed
14. Schroeder AR. UTI and faulty gold standards. Pediatrics. 2017;139(3). doi: 10.1542/peds.2016-3814a. PubMed
15. Eliacik K, Kanik A, Yavascan O, et al. A comparison of bladder catheterization and suprapubic aspiration methods for urine sample collection from infants with a suspected urinary tract infection. Clinical Pediatrics. 2016;55(9):819-824. doi: 10.1177/0009922815608278. PubMed
16. Thomson J, Sucharew H, Cruz AT, et al. Cerebrospinal fluid reference values for young infants undergoing lumbar puncture. Pediatrics. 2018;141(3). doi: 10.1542/peds.2017-3405. PubMed
© 2019 Society of Hospital Medicine