User login
HCAHPS Surveys and Patient Satisfaction
The Hospital Consumer Assessment of Healthcare Providers and Systems (HCAHPS) is the first national, standardized, publicly reported survey of patients' perception of hospital care. HCAHPS mandates a standard method of collecting and reporting perception of health care by patients to enable valid comparisons across all hospitals.[1, 2, 3] Voluntary collection of HCAHPS data for public reporting began in July 2006, mandatory collection of data for hospitals that participate in Inpatient Prospective Payment Program of Medicare began in July 2007, and public reporting of mandated HCAHPS scores began in 2008.[2]
Using data from the first 2‐year period, an earlier study had reported an increase in HCAHPS patient satisfaction scores in all domains except in the domain of satisfaction with physician communication.[4] Since then, data from additional years have become available, allowing assessment of satisfaction of hospitalized patients with physician communication over a longer period. Therefore, our objective was to examine changes in patient satisfaction with physician communication from 2007 to 2013, the last reported date, and to explore hospital and local population characteristics that may be associated with patient satisfaction.
METHODS
Publicly available data from 3 sources were used for this study. Patient satisfaction scores with physician communication and hospital characteristics were obtained from the HCAHPS data files available at the Hospital Compare database maintained by the Centers for Medicare and Medicaid Services (CMS).[5] HCAHPS files contain data for the preceding 12 months and are updated quarterly. We used files that reported data from the first to the fourth quarter of the year for 2007 to 2013. The HCAHPS survey contains 32 questions, of which 3 questions are about physician communication.[6] We used the percentage of survey participants who responded that physicians always communicated well as a measure of patient satisfaction with physician communication (the other 2 questions were not included). Hospitals that reported data on patient satisfaction during 2007 were divided into quartiles based on their satisfaction scores, and this quartile allocation was maintained during each subsequent year. Survey response rate, in percentage, was obtained from HCAHPS data files for each year. Hospital characteristics, such as ownership of the hospital, teaching hospital status, and designation of critical access hospital were obtained from the Hospital Compare website. Hospital ownership was defined as government (owned by federal, state, Veterans Affairs, or tribal authorities), for profit (owned by physicians or another proprietary), or nonprofit (owned by a nonprofit organization such as a church). A hospital was considered a teaching hospital if it obtained graduate medical education funding from CMS.
We obtained local population data from 2010 decennial census files and from the American Community Survey 5‐year data profile from 2009 to 2013; both datasets are maintained by the Unites States Census Bureau.[7] Census is mandated by Article I, Section 2 of the United States Constitution and takes place every 10 years. The American Community Survey is also a mandatory, ongoing statistical survey that samples a small percentage of the population every year giving communities the information they need to plan investments and services. We chose to use 5‐year estimates as these are more precise and are reliable in analyzing small populations. For each zip code, we extracted data on total population, percentage of African Americans in the population, median income, poverty level, and insurance status from the Census Bureau data files.
Local population characteristics at zip code level were mapped to hospitals using hospital service area (HSA) crosswalk files from the Dartmouth Atlas of Health Care.[7, 8] The Dartmouth Atlas defined 3436 HSAs by assigning zip codes to the hospital area where the greatest proportion of its Medicare residents were hospitalized. The number of acute care hospital beds and the number of physicians within the HSA were also obtained from the Dartmouth Atlas. Merging data from these 3 sources generated a dataset that contained information about patient satisfaction scores from a particular hospital, hospital characteristics, and population characteristics of the healthcare market.
Data were summarized as mean and standard deviation (SD). To model the dependence of observations from the same hospital and the correlation between hospitals within the same state due to similar regulations, and to assess the relative contribution of satisfaction scores over time within hospital, hospitals within states, and across states, 3‐level hierarchical regression models were examined.[9, 10] At the within‐hospital level, survey response rate was used as a time‐varying variable in addition to the year of observation. However, only year of observation was used to explore differences in patient satisfaction trajectories between hospitals. At the hospitals‐within‐states level, hospital characteristics and local population characteristics within the HSA were included. At the states level, only random effects were obtained, and no additional variables were included in the models.
Four models were built to assess the relationship between satisfaction scores and predictors. The basic model used only random effects without any predictors to determine the relative contribution of each level (within hospitals, hospitals within states, and across states) to variation in patient satisfaction scores and thus was consistent with the variance component analysis. The first model included the year of observation as a predictor at the within‐hospital level to examine trends in patient satisfaction scores during the observation period. For the second model, we added baseline satisfaction quartiles to the second model, whereas remaining predictors (HSA population, African American percentage in HSA, survey response rate, HSA median income, ownership of hospital, percentage with private any insurance in HSA, acute care hospital beds in HSA, teaching hospital status, and percentage of people living in poverty within HSA) were added in the third model. Quartiles for baseline satisfaction were generated using satisfaction scores from 2007. As a larger number of hospitals reported results for 2008 than for 2007 (2273 vs 3746), we conducted a sensitivity analysis using satisfaction quartiles in 2008 as baseline and examined subsequent trends over time for the 4 models noted above. All multilevel models were specified using the nlme package in R to account for clustering of observations within hospitals and hospitals within states, using hospital and state level random effects.[11]
RESULTS
Of the 4353 hospitals with data for the 7‐year period, the majority were in the Southern region (South = 1669, Midwest = 1239, Northeast = 607, West = 838). Texas had the largest number of hospital (N = 358) followed by California (N = 340). The largest number of hospitals were nonprofit (N = 2637, 60.6%). Mean (SD) patient satisfaction with physician communication was 78.9% (5.7%) in 2007 that increased to 81.7% (5.4%) in 2013. Throughout the observation period, the highest patient satisfaction was in the South (80.6% [6.6%] in 2007 and 83.2% [5.4%] in 2013). Of the 2273 hospitals that reported data in 2007, the mean satisfaction score of the lowest quartile was 72% (3.2%), and the highest quartile was 86.9% (3.2%) (Table 1). As a group, hospitals in the highest quartile in 2007 still had higher satisfaction scores in 2013 than the hospitals in the lowest quartile (85% [4.2%] vs 77% [3.6%], respectively). Only 4 of the 584 hospitals in the lowest quartile in 2007 climbed up to the highest quartile in 2013, whereas 22 hospitals that were in the upper quartile in 2007 dropped to the lowest quartile in 2013.
| Characteristic | Quartiles Based on 2007 Satisfaction Scores | |||
|---|---|---|---|---|
| Highest Quartile | 2nd Quartile | 3rd Quartile | Lowest Quartile | |
| ||||
| Total no. of hospitals, N (%) | 461 (20.3) | 545 (24.0) | 683 (30.0) | 584 (25.7) |
| Hospital ownership, N (%) | ||||
| For profit | 50 (14.4) | 60 (17.3) | 96 (27.7) | 140 (40.5) |
| Nonprofit | 269 (17.4) | 380 (24.6) | 515 (33.4) | 378 (24.5) |
| Government | 142 (36.9) | 105 (27.3) | 72 (18.7) | 66 (17.1) |
| HSA population, in 1,000, median (IQR) | 33.2 (70.5) | 88.5 (186) | 161.8 (374) | 222.2 (534) |
| Racial distribution of HSA population, median (IQR) | ||||
| White, % | 82.6 (26.2) | 82.5 (28.5) | 74.2 (32.9) | 66.8 (35.3) |
| Black, % | 4.3 (21.7) | 3.7 (16.3) | 5.9 (14.8) | 7.4 (12.1) |
| Other, % | 6.4 (7.1) | 8.8 (10.8) | 12.9 (19.8) | 20.0 (33.1) |
| HSA mean median income in $1,000, mean (SD) | 44.6 (11.7) | 52.4 (17.8) | 58.4 (17.1) | 57.5 (15.7) |
| Satisfaction scores (at baseline), mean (SD) | 86.9 (3.1) | 81.4 (1.1) | 77.5 (1.1) | 72.0 (3.2) |
| Satisfaction scores (in 2013), mean (SD) | 85.0 (4.3) | 82.0 (3.4) | 79.7 (3.0) | 77.0 (3.5) |
| Survey response rate (at baseline), mean (SD) | 43.2 (19.8) | 34.5 (9.4) | 32.6 (8.0) | 30.3 (7.8) |
| Survey response rate (20072013), mean (SD) | 32.8 (7.8) | 32.6 (7.5) | 30.8 (6.5) | 29.3 (6.5) |
| Percentage with any insurance in HSA, mean (SD) | 84.0 (5.4) | 84.8 (6.6) | 85.5 (6.3) | 83.9 (6.6) |
| Teaching hospital, N (%) | 42 (9.1) | 155 (28.4) | 277 (40.5) | 274 (46.9%) |
| Acute care hospital beds in HSA (per 1,000), mean (SD) | 3.2 (1.2) | 2.6 (0.8) | 2.5 (0.8) | 2.4 (0.7) |
| Number of physicians in HSA (per 100,000), mean (SD) | 190 (36) | 197 (43) | 204 (47) | 199 (45) |
| Percentage with poverty in HSA, mean (SD)[7] | 16.9 (6.6) | 15.5 (6.5) | 14.4 (5.7) | 15.5 (6.0) |
Using variance component analysis, we found that 23% of the variation in patient satisfaction scores with physician communication was due to differences between states, 52% was due to differences between hospitals within states, and 24% was due to changes over time within a hospital. When examining time trends of satisfaction during the 7‐year period without adjusting for other predictors, we found a statistically significant increasing trend in patient satisfaction with physician communication (0.33% per year; P < 0.001). We also found a significant negative correlation (0.62, P < 0.001) between the random effects for baseline satisfaction (intercept) and change over time (slope), suggesting that initial patient satisfaction with physicians at a hospital was negatively correlated with subsequent change in satisfaction scores during the observation period.
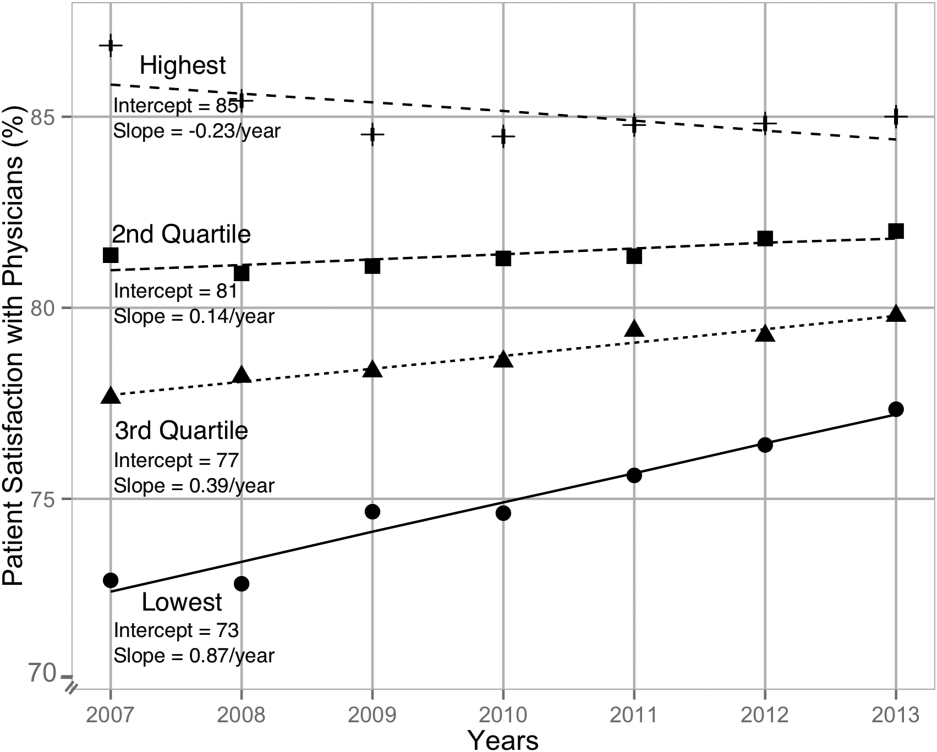
When examining the effect of satisfaction ranking in 2007, hospitals within the lowest quartile of patient satisfaction in 2007 had significantly larger increase in satisfaction scores during the subsequent period as compared to the hospitals in each of the other 3 quartiles (all P < 0.001, Table 2). The difference in the magnitude of the rate of increase in satisfaction scores was greatest between the lowest quartile and the highest quartile (1.10% per year; P < 0.001). In fact, the highest quartile had a statistically significant absolute decrease in patient satisfaction during the observation period (0.23% per year; P < 0.001, Figure 1).
| Variable | Model 1: ; P Value | Model 2: ; P Value | Model 3: ; P Value |
|---|---|---|---|
| |||
| Time (in years) | 0.33; <0.001 | 0.87; <0.001 | 0.89; <0.001 |
| Satisfaction quartiles at baseline | |||
| Highest quartile | 12.1; <0.001 | 10.4; <0.001 | |
| 2nd quartile | 7.9; <0.001 | 7.1; <0.001 | |
| 3rd quartile | 4.5; <0.001 | 4.1; <0.001 | |
| Lowest quartile (REF) | REF | REF | |
| Interaction with time | |||
| Highest quartile | 1.10; <0.001 | 0.94; <0.001 | |
| 2nd quartile | 0.73; <0.001 | 0.71; <0.001 | |
| 3rd quartile | 0.48; <0.001 | 0.47;<0.001 | |
| Survey response rate (%) | 0.12; <0.001 | ||
| Total population, in 10,000 | 0.002; 0.02 | ||
| African American (%) | 0.004; 0.13 | ||
| HSA median Income in $10,000 | 0.02; 0.58 | ||
| Ownership | |||
| Government (REF) | REF | ||
| Nonprofit | 0.01; 0.88 | ||
| For profit | 0.21; 0.11 | ||
| Percentage with insurance in HSA | 0.007; 0.27 | ||
| Acute care beds in HSA (per 1,000) | 0.60; <0.001 | ||
| Physicians in HSA (per 100,000) | 0.003; 0.007 | ||
| Teaching hospital | 0.34; 0.001 | ||
| Percentage in poverty in HSA | 0.01; 0.27 | ||
After adjusting for hospital characteristics and population characteristics of the HSA, the 2007 satisfaction quartiles remained significantly associated with subsequent change in satisfaction scores during the 7‐year observation period (Table 2). In addition, survey response rate, number of physicians, and the number of acute‐care hospital beds within the HSA were positively associated with patient satisfaction, whereas higher HSA population density and being a teaching hospital were negatively associated with patient satisfaction. Using 2008 satisfaction scores as baseline, the results did not change except that the number of physicians in the HSA and being a teaching hospital were no longer associated with satisfaction scores with physicians.
DISCUSSION
Using hierarchical modelling, we have shown that national patient satisfaction scores with physicians have consistently improved since 2007, the year when reporting of satisfaction scores began. We further show that the improvement in satisfaction scores has not been consistent through all hospitals. The largest increase in satisfaction scores was in hospitals that were in the lowest quartile of satisfaction scores in 2007. In contrast, satisfaction scores decreased in hospitals that were in the uppermost quartile of satisfaction scores. The difference between the lowest and uppermost quartile was so large in 2007 that despite the difference in the direction of change in satisfaction scores, hospitals in the uppermost quartile continued to have higher satisfaction scores in 2013 than hospitals in the lowest quartile.
Consistent with our findings for patient satisfaction, other studies have found that public reporting is associated with improvement in healthcare quality measures across nursing homes, physician groups, and hospitals.[12, 13, 14] However, it is unclear how public reporting can change patient satisfaction. The main purpose of public reporting of quality of healthcare measures, such as patient satisfaction with the healthcare they receive, is to generate value by increasing transparency and accountability, thereby increasing the quality of healthcare delivery. Healthcare consumers may also utilize the reported measures to choose providers that deliver high‐quality healthcare. Contrary to expectations, there is very little evidence that consumers choose healthcare facilities based on public reporting, and it is likely that other mechanisms may explain the observed association.[15, 16]
Physicians have historically had low adoption of strategies to improve patient satisfaction and often cite suboptimal data and lack of evidence for data‐driven strategies.[17, 18] Hospitals and healthcare organizations have deployed a broad range of strategies to engage physicians. These include emphasizing relationship between patient satisfaction and patient compliance, complaints and malpractice lawsuits, appealing to physicians' sense of competitiveness by publishing individual provider satisfaction scores, educating physicians on HCAHPS and providing them with regularly updated data, and development of specific techniques for improving patient‐physician interaction.[19, 20, 21, 22, 23, 24] Administrators may also enhance physician engagement by improving physician satisfaction, decreasing their turnover, support development of physicians in administrative leadership roles, and improving financial transparency.[25] Thus, involvement of hospital leadership has been instrumental in encouraging physicians to focus on quality measures including patient satisfaction. Some evidence suggests that public reporting exerts strong influence on hospital leaders for adequate resource allocation, local planning, and improvement efforts.[26, 27, 28]
Perhaps the most intriguing finding in our study is that hospitals in the uppermost quartile of satisfaction scores in 2007 had a statistically significant steady decline in scores during the following period as compared to hospitals in the lowest quartile that had a steady increase. A possible explanation for this finding can be that high‐performing hospitals become complacent and do not invest in developing the effort‐intensive resources required to maintain and improve performance in the physician‐related patient satisfaction domain. These resources may be diverted to competing needs that include addressing improvement efforts for a large number of other publicly reported healthcare quality measures. Thus, an unintended consequence of quality improvement may be that improvement in 1 domain may be at the expense of quality of care in another domain.[29, 30, 31] On the other hand, it is likely that hospitals in the lower quartile see a larger improvement in their scores for the same degree of investment as hospitals in the higher quartiles. It is also likely that hospitals, particularly those in the lowest quartile, develop their individual benchmarks and expend effort that is in line with their perceived need for improvement to achieve their strategic and marketing goals.
Our study has significant implications for the healthcare system, clinical practice, and future research. Whereas public reporting of quality measures is associated with an overall improvement in the reported quality measure, hospitals with high scores may move resources away from that metric or become complacent. Health policy makers need to design policies that encourage all hospitals and providers to perform better or continue to perform well. We further show that differences between hospitals and between local healthcare markets are the biggest factor determining the variation in patient satisfaction with physician communication, and an adjustment in reported score for these factors may be needed. Although local healthcare market factors may not be modifiable, an exchange of knowledge between hospitals with low and high patient satisfaction scores may improve overall satisfaction scores. Similarly, hospitals that are successful in increasing patient satisfaction scores should identify and share useful interventions.
The main strength of our study is that we used data on patient satisfaction with physician communication that were reported annually by most hospitals within the United States. These longitudinal data allowed us to examine not only the effect of public reporting on patient satisfaction with physician communication but also its trend over time. As we had 7 years of data, we were able to eliminate the possibility of regression to mean; an extreme result on first measurement is followed by a second measurement that tends to be closer to the average. Further, we adjusted satisfaction scores based on hospital and local healthcare market characteristics allowing us to compare satisfaction scores across hospitals. However, because units of observation were hospitals and not patients, we could not examine the effect of patient characteristics on satisfaction scores. In addition, HCAHPS surveys have low response rates and may have response and selection bias. Furthermore, we were unable to examine the strategies implemented by hospitals to improve satisfaction scores or the effect of such strategies on satisfaction scores. Data on hospital strategies to increase satisfaction scores are not available for most hospitals and could not have been included in the study.
In summary, we have found that public reporting was followed by an improvement in patient satisfaction scores with physician communication between 2007 and 2013. The rate of improvement was significantly greater in hospitals that had satisfaction scores in the lowest quartiles, whereas hospitals in the highest quartile had a small but statistically significant decline in patient satisfaction scores.
- Centers for Medicare Medicaid Services. Medicare program; hospital outpatient prospective payment system and CY 2007 payment rates; CY 2007 update to the ambulatory surgical center covered procedures list; Medicare administrative contractors; and reporting hospital quality data for FY 2008 inpatient prospective payment system annual payment update program‐‐HCAHPS survey, SCIP, and mortality. Final rule with comment period and final rule. Fed Regist. 2006;71(226):67959–68401.
- , , , , . Development, implementation, and public reporting of the HCAHPS survey. Med Care Res Rev. 2010;67(1):27–37.
- , , , . Comparison of Hospital Consumer Assessment of Healthcare Providers and Systems patient satisfaction scores for specialty hospitals and general medical hospitals: confounding effect of survey response rate. J Hosp Med. 2014;9(9):590–593.
- , , , et al. Hospital survey shows improvements in patient experience. Health Aff (Millwood). 2010;29(11):2061–2067.
- Centers for Medicare 2010:496829.
- , , , , , . The normal liver harbors the vitamin D nuclear receptor in nonparenchymal and biliary epithelial cells. Hepatology. 2003;37(5):1034–1042.
- , . Applied Longitudinal Data Analysis: Modeling Change and Event Occurrence. Oxford, United Kingdom: Oxford University Press; 2003.
- , . Data Analysis Using Regression and Multilevel/Hierarchical Models. Cambridge, United Kingdom: Cambridge University Press; 2007.
- nlme: Linear and Nonlinear Mixed Effects Models [computer program]. Version R package version 2015;3:1–121.
- , , , . Public reporting helped drive quality improvement in outpatient diabetes care among Wisconsin physician groups. Health Aff (Millwood). 2012;31(3):570–577.
- , , , , , . Governing healthcare through performance measurement in Massachusetts and the Netherlands. Health Policy. 2014;116(1):18–26.
- , , . Public reporting drove quality gains at nursing homes. Health Aff (Millwood). 2010;29(9):1706–1713.
- , , . Users of public reports of hospital quality: who, what, why, and how?: An aggregate analysis of 16 online public reporting Web sites and users' and experts' suggestions for improvement. Agency for Healthcare Research and Quality. Available at: http://archive.ahrq.gov/professionals/quality‐patient‐safety/quality‐resources/value/pubreportusers/index.html. Updated December 2011. Accessed April 2, 2015.
- Kaiser Family Foundation. 2008 update on consumers' views of patient safety and quality information. Available at: http://kff.org/health‐reform/poll‐finding/2008‐update‐on‐consumers‐views‐of‐patient‐2/. Published September 30, 2008. Accessed April 2, 2015.
- , . A report card on continuous quality improvement. Milbank Q. 1998;76(4):625–648, 511.
- , , . Assessing the impact of continuous quality improvement on clinical practice: what it will take to accelerate progress. Milbank Q. 1998;76(4):593–624, 510.
- , . Health care competition, strategic mission, and patient satisfaction: research model and propositions. J Health Organ Manag. 2008;22(6):627–641.
- , , . The effects of physician empathy on patient satisfaction and compliance. Eval Health Prof. 2004;27(3):237–251.
- , , , , . Association between vitamin D and hepatitis C virus infection: a meta‐analysis. World J Gastroenterol. 2013;19(35):5917–5924.
- , , , . The relation of patient satisfaction with complaints against physicians and malpractice lawsuits. Am J Med. 2005;118(10):1126–1133.
- , , , , , . Relation of patients' experiences with individual physicians to malpractice risk. Int J Qual Health Care. 2008;20(1):5–12.
- , , , . Association of patient satisfaction with complaints and risk management among emergency physicians. J Emerg Med. 2011;41(4):405–411.
- , , , , . Secrets of physician satisfaction. Study identifies pressure points and reveals life practices of highly satisfied doctors. Physician Exec. 2006;32(6):30–39.
- , , , et al. Attitudes of hospital leaders toward publicly reported measures of health care quality. JAMA Intern Med. 2014;174(12):1904–1911.
- , , , , , . Closing the quality gap: revisiting the state of the science (vol. 5: public reporting as a quality improvement strategy). Evid Rep Technol Assess (Full Rep). 2012(208.5):1–645.
- , , , , . Systematic review: the evidence that publishing patient care performance data improves quality of care. Ann Intern Med. 2008;148(2):111–123.
- , . The unintended consequences of quality improvement. Curr Opin Pediatr. 2009;21(6):777–782.
- , , , et al. Unintended consequences of implementing a national performance measurement system into local practice. J Gen Intern Med. 2012;27(4):405–412.
- , . Quality assessment by external bodies: intended and unintended impact on healthcare delivery. Curr Opin Anaesthesiol. 2009;22(2):237–241.
The Hospital Consumer Assessment of Healthcare Providers and Systems (HCAHPS) is the first national, standardized, publicly reported survey of patients' perception of hospital care. HCAHPS mandates a standard method of collecting and reporting perception of health care by patients to enable valid comparisons across all hospitals.[1, 2, 3] Voluntary collection of HCAHPS data for public reporting began in July 2006, mandatory collection of data for hospitals that participate in Inpatient Prospective Payment Program of Medicare began in July 2007, and public reporting of mandated HCAHPS scores began in 2008.[2]
Using data from the first 2‐year period, an earlier study had reported an increase in HCAHPS patient satisfaction scores in all domains except in the domain of satisfaction with physician communication.[4] Since then, data from additional years have become available, allowing assessment of satisfaction of hospitalized patients with physician communication over a longer period. Therefore, our objective was to examine changes in patient satisfaction with physician communication from 2007 to 2013, the last reported date, and to explore hospital and local population characteristics that may be associated with patient satisfaction.
METHODS
Publicly available data from 3 sources were used for this study. Patient satisfaction scores with physician communication and hospital characteristics were obtained from the HCAHPS data files available at the Hospital Compare database maintained by the Centers for Medicare and Medicaid Services (CMS).[5] HCAHPS files contain data for the preceding 12 months and are updated quarterly. We used files that reported data from the first to the fourth quarter of the year for 2007 to 2013. The HCAHPS survey contains 32 questions, of which 3 questions are about physician communication.[6] We used the percentage of survey participants who responded that physicians always communicated well as a measure of patient satisfaction with physician communication (the other 2 questions were not included). Hospitals that reported data on patient satisfaction during 2007 were divided into quartiles based on their satisfaction scores, and this quartile allocation was maintained during each subsequent year. Survey response rate, in percentage, was obtained from HCAHPS data files for each year. Hospital characteristics, such as ownership of the hospital, teaching hospital status, and designation of critical access hospital were obtained from the Hospital Compare website. Hospital ownership was defined as government (owned by federal, state, Veterans Affairs, or tribal authorities), for profit (owned by physicians or another proprietary), or nonprofit (owned by a nonprofit organization such as a church). A hospital was considered a teaching hospital if it obtained graduate medical education funding from CMS.
We obtained local population data from 2010 decennial census files and from the American Community Survey 5‐year data profile from 2009 to 2013; both datasets are maintained by the Unites States Census Bureau.[7] Census is mandated by Article I, Section 2 of the United States Constitution and takes place every 10 years. The American Community Survey is also a mandatory, ongoing statistical survey that samples a small percentage of the population every year giving communities the information they need to plan investments and services. We chose to use 5‐year estimates as these are more precise and are reliable in analyzing small populations. For each zip code, we extracted data on total population, percentage of African Americans in the population, median income, poverty level, and insurance status from the Census Bureau data files.
Local population characteristics at zip code level were mapped to hospitals using hospital service area (HSA) crosswalk files from the Dartmouth Atlas of Health Care.[7, 8] The Dartmouth Atlas defined 3436 HSAs by assigning zip codes to the hospital area where the greatest proportion of its Medicare residents were hospitalized. The number of acute care hospital beds and the number of physicians within the HSA were also obtained from the Dartmouth Atlas. Merging data from these 3 sources generated a dataset that contained information about patient satisfaction scores from a particular hospital, hospital characteristics, and population characteristics of the healthcare market.
Data were summarized as mean and standard deviation (SD). To model the dependence of observations from the same hospital and the correlation between hospitals within the same state due to similar regulations, and to assess the relative contribution of satisfaction scores over time within hospital, hospitals within states, and across states, 3‐level hierarchical regression models were examined.[9, 10] At the within‐hospital level, survey response rate was used as a time‐varying variable in addition to the year of observation. However, only year of observation was used to explore differences in patient satisfaction trajectories between hospitals. At the hospitals‐within‐states level, hospital characteristics and local population characteristics within the HSA were included. At the states level, only random effects were obtained, and no additional variables were included in the models.
Four models were built to assess the relationship between satisfaction scores and predictors. The basic model used only random effects without any predictors to determine the relative contribution of each level (within hospitals, hospitals within states, and across states) to variation in patient satisfaction scores and thus was consistent with the variance component analysis. The first model included the year of observation as a predictor at the within‐hospital level to examine trends in patient satisfaction scores during the observation period. For the second model, we added baseline satisfaction quartiles to the second model, whereas remaining predictors (HSA population, African American percentage in HSA, survey response rate, HSA median income, ownership of hospital, percentage with private any insurance in HSA, acute care hospital beds in HSA, teaching hospital status, and percentage of people living in poverty within HSA) were added in the third model. Quartiles for baseline satisfaction were generated using satisfaction scores from 2007. As a larger number of hospitals reported results for 2008 than for 2007 (2273 vs 3746), we conducted a sensitivity analysis using satisfaction quartiles in 2008 as baseline and examined subsequent trends over time for the 4 models noted above. All multilevel models were specified using the nlme package in R to account for clustering of observations within hospitals and hospitals within states, using hospital and state level random effects.[11]
RESULTS
Of the 4353 hospitals with data for the 7‐year period, the majority were in the Southern region (South = 1669, Midwest = 1239, Northeast = 607, West = 838). Texas had the largest number of hospital (N = 358) followed by California (N = 340). The largest number of hospitals were nonprofit (N = 2637, 60.6%). Mean (SD) patient satisfaction with physician communication was 78.9% (5.7%) in 2007 that increased to 81.7% (5.4%) in 2013. Throughout the observation period, the highest patient satisfaction was in the South (80.6% [6.6%] in 2007 and 83.2% [5.4%] in 2013). Of the 2273 hospitals that reported data in 2007, the mean satisfaction score of the lowest quartile was 72% (3.2%), and the highest quartile was 86.9% (3.2%) (Table 1). As a group, hospitals in the highest quartile in 2007 still had higher satisfaction scores in 2013 than the hospitals in the lowest quartile (85% [4.2%] vs 77% [3.6%], respectively). Only 4 of the 584 hospitals in the lowest quartile in 2007 climbed up to the highest quartile in 2013, whereas 22 hospitals that were in the upper quartile in 2007 dropped to the lowest quartile in 2013.
| Characteristic | Quartiles Based on 2007 Satisfaction Scores | |||
|---|---|---|---|---|
| Highest Quartile | 2nd Quartile | 3rd Quartile | Lowest Quartile | |
| ||||
| Total no. of hospitals, N (%) | 461 (20.3) | 545 (24.0) | 683 (30.0) | 584 (25.7) |
| Hospital ownership, N (%) | ||||
| For profit | 50 (14.4) | 60 (17.3) | 96 (27.7) | 140 (40.5) |
| Nonprofit | 269 (17.4) | 380 (24.6) | 515 (33.4) | 378 (24.5) |
| Government | 142 (36.9) | 105 (27.3) | 72 (18.7) | 66 (17.1) |
| HSA population, in 1,000, median (IQR) | 33.2 (70.5) | 88.5 (186) | 161.8 (374) | 222.2 (534) |
| Racial distribution of HSA population, median (IQR) | ||||
| White, % | 82.6 (26.2) | 82.5 (28.5) | 74.2 (32.9) | 66.8 (35.3) |
| Black, % | 4.3 (21.7) | 3.7 (16.3) | 5.9 (14.8) | 7.4 (12.1) |
| Other, % | 6.4 (7.1) | 8.8 (10.8) | 12.9 (19.8) | 20.0 (33.1) |
| HSA mean median income in $1,000, mean (SD) | 44.6 (11.7) | 52.4 (17.8) | 58.4 (17.1) | 57.5 (15.7) |
| Satisfaction scores (at baseline), mean (SD) | 86.9 (3.1) | 81.4 (1.1) | 77.5 (1.1) | 72.0 (3.2) |
| Satisfaction scores (in 2013), mean (SD) | 85.0 (4.3) | 82.0 (3.4) | 79.7 (3.0) | 77.0 (3.5) |
| Survey response rate (at baseline), mean (SD) | 43.2 (19.8) | 34.5 (9.4) | 32.6 (8.0) | 30.3 (7.8) |
| Survey response rate (20072013), mean (SD) | 32.8 (7.8) | 32.6 (7.5) | 30.8 (6.5) | 29.3 (6.5) |
| Percentage with any insurance in HSA, mean (SD) | 84.0 (5.4) | 84.8 (6.6) | 85.5 (6.3) | 83.9 (6.6) |
| Teaching hospital, N (%) | 42 (9.1) | 155 (28.4) | 277 (40.5) | 274 (46.9%) |
| Acute care hospital beds in HSA (per 1,000), mean (SD) | 3.2 (1.2) | 2.6 (0.8) | 2.5 (0.8) | 2.4 (0.7) |
| Number of physicians in HSA (per 100,000), mean (SD) | 190 (36) | 197 (43) | 204 (47) | 199 (45) |
| Percentage with poverty in HSA, mean (SD)[7] | 16.9 (6.6) | 15.5 (6.5) | 14.4 (5.7) | 15.5 (6.0) |
Using variance component analysis, we found that 23% of the variation in patient satisfaction scores with physician communication was due to differences between states, 52% was due to differences between hospitals within states, and 24% was due to changes over time within a hospital. When examining time trends of satisfaction during the 7‐year period without adjusting for other predictors, we found a statistically significant increasing trend in patient satisfaction with physician communication (0.33% per year; P < 0.001). We also found a significant negative correlation (0.62, P < 0.001) between the random effects for baseline satisfaction (intercept) and change over time (slope), suggesting that initial patient satisfaction with physicians at a hospital was negatively correlated with subsequent change in satisfaction scores during the observation period.
When examining the effect of satisfaction ranking in 2007, hospitals within the lowest quartile of patient satisfaction in 2007 had significantly larger increase in satisfaction scores during the subsequent period as compared to the hospitals in each of the other 3 quartiles (all P < 0.001, Table 2). The difference in the magnitude of the rate of increase in satisfaction scores was greatest between the lowest quartile and the highest quartile (1.10% per year; P < 0.001). In fact, the highest quartile had a statistically significant absolute decrease in patient satisfaction during the observation period (0.23% per year; P < 0.001, Figure 1).
| Variable | Model 1: ; P Value | Model 2: ; P Value | Model 3: ; P Value |
|---|---|---|---|
| |||
| Time (in years) | 0.33; <0.001 | 0.87; <0.001 | 0.89; <0.001 |
| Satisfaction quartiles at baseline | |||
| Highest quartile | 12.1; <0.001 | 10.4; <0.001 | |
| 2nd quartile | 7.9; <0.001 | 7.1; <0.001 | |
| 3rd quartile | 4.5; <0.001 | 4.1; <0.001 | |
| Lowest quartile (REF) | REF | REF | |
| Interaction with time | |||
| Highest quartile | 1.10; <0.001 | 0.94; <0.001 | |
| 2nd quartile | 0.73; <0.001 | 0.71; <0.001 | |
| 3rd quartile | 0.48; <0.001 | 0.47;<0.001 | |
| Survey response rate (%) | 0.12; <0.001 | ||
| Total population, in 10,000 | 0.002; 0.02 | ||
| African American (%) | 0.004; 0.13 | ||
| HSA median Income in $10,000 | 0.02; 0.58 | ||
| Ownership | |||
| Government (REF) | REF | ||
| Nonprofit | 0.01; 0.88 | ||
| For profit | 0.21; 0.11 | ||
| Percentage with insurance in HSA | 0.007; 0.27 | ||
| Acute care beds in HSA (per 1,000) | 0.60; <0.001 | ||
| Physicians in HSA (per 100,000) | 0.003; 0.007 | ||
| Teaching hospital | 0.34; 0.001 | ||
| Percentage in poverty in HSA | 0.01; 0.27 | ||
After adjusting for hospital characteristics and population characteristics of the HSA, the 2007 satisfaction quartiles remained significantly associated with subsequent change in satisfaction scores during the 7‐year observation period (Table 2). In addition, survey response rate, number of physicians, and the number of acute‐care hospital beds within the HSA were positively associated with patient satisfaction, whereas higher HSA population density and being a teaching hospital were negatively associated with patient satisfaction. Using 2008 satisfaction scores as baseline, the results did not change except that the number of physicians in the HSA and being a teaching hospital were no longer associated with satisfaction scores with physicians.
DISCUSSION
Using hierarchical modelling, we have shown that national patient satisfaction scores with physicians have consistently improved since 2007, the year when reporting of satisfaction scores began. We further show that the improvement in satisfaction scores has not been consistent through all hospitals. The largest increase in satisfaction scores was in hospitals that were in the lowest quartile of satisfaction scores in 2007. In contrast, satisfaction scores decreased in hospitals that were in the uppermost quartile of satisfaction scores. The difference between the lowest and uppermost quartile was so large in 2007 that despite the difference in the direction of change in satisfaction scores, hospitals in the uppermost quartile continued to have higher satisfaction scores in 2013 than hospitals in the lowest quartile.
Consistent with our findings for patient satisfaction, other studies have found that public reporting is associated with improvement in healthcare quality measures across nursing homes, physician groups, and hospitals.[12, 13, 14] However, it is unclear how public reporting can change patient satisfaction. The main purpose of public reporting of quality of healthcare measures, such as patient satisfaction with the healthcare they receive, is to generate value by increasing transparency and accountability, thereby increasing the quality of healthcare delivery. Healthcare consumers may also utilize the reported measures to choose providers that deliver high‐quality healthcare. Contrary to expectations, there is very little evidence that consumers choose healthcare facilities based on public reporting, and it is likely that other mechanisms may explain the observed association.[15, 16]
Physicians have historically had low adoption of strategies to improve patient satisfaction and often cite suboptimal data and lack of evidence for data‐driven strategies.[17, 18] Hospitals and healthcare organizations have deployed a broad range of strategies to engage physicians. These include emphasizing relationship between patient satisfaction and patient compliance, complaints and malpractice lawsuits, appealing to physicians' sense of competitiveness by publishing individual provider satisfaction scores, educating physicians on HCAHPS and providing them with regularly updated data, and development of specific techniques for improving patient‐physician interaction.[19, 20, 21, 22, 23, 24] Administrators may also enhance physician engagement by improving physician satisfaction, decreasing their turnover, support development of physicians in administrative leadership roles, and improving financial transparency.[25] Thus, involvement of hospital leadership has been instrumental in encouraging physicians to focus on quality measures including patient satisfaction. Some evidence suggests that public reporting exerts strong influence on hospital leaders for adequate resource allocation, local planning, and improvement efforts.[26, 27, 28]
Perhaps the most intriguing finding in our study is that hospitals in the uppermost quartile of satisfaction scores in 2007 had a statistically significant steady decline in scores during the following period as compared to hospitals in the lowest quartile that had a steady increase. A possible explanation for this finding can be that high‐performing hospitals become complacent and do not invest in developing the effort‐intensive resources required to maintain and improve performance in the physician‐related patient satisfaction domain. These resources may be diverted to competing needs that include addressing improvement efforts for a large number of other publicly reported healthcare quality measures. Thus, an unintended consequence of quality improvement may be that improvement in 1 domain may be at the expense of quality of care in another domain.[29, 30, 31] On the other hand, it is likely that hospitals in the lower quartile see a larger improvement in their scores for the same degree of investment as hospitals in the higher quartiles. It is also likely that hospitals, particularly those in the lowest quartile, develop their individual benchmarks and expend effort that is in line with their perceived need for improvement to achieve their strategic and marketing goals.
Our study has significant implications for the healthcare system, clinical practice, and future research. Whereas public reporting of quality measures is associated with an overall improvement in the reported quality measure, hospitals with high scores may move resources away from that metric or become complacent. Health policy makers need to design policies that encourage all hospitals and providers to perform better or continue to perform well. We further show that differences between hospitals and between local healthcare markets are the biggest factor determining the variation in patient satisfaction with physician communication, and an adjustment in reported score for these factors may be needed. Although local healthcare market factors may not be modifiable, an exchange of knowledge between hospitals with low and high patient satisfaction scores may improve overall satisfaction scores. Similarly, hospitals that are successful in increasing patient satisfaction scores should identify and share useful interventions.
The main strength of our study is that we used data on patient satisfaction with physician communication that were reported annually by most hospitals within the United States. These longitudinal data allowed us to examine not only the effect of public reporting on patient satisfaction with physician communication but also its trend over time. As we had 7 years of data, we were able to eliminate the possibility of regression to mean; an extreme result on first measurement is followed by a second measurement that tends to be closer to the average. Further, we adjusted satisfaction scores based on hospital and local healthcare market characteristics allowing us to compare satisfaction scores across hospitals. However, because units of observation were hospitals and not patients, we could not examine the effect of patient characteristics on satisfaction scores. In addition, HCAHPS surveys have low response rates and may have response and selection bias. Furthermore, we were unable to examine the strategies implemented by hospitals to improve satisfaction scores or the effect of such strategies on satisfaction scores. Data on hospital strategies to increase satisfaction scores are not available for most hospitals and could not have been included in the study.
In summary, we have found that public reporting was followed by an improvement in patient satisfaction scores with physician communication between 2007 and 2013. The rate of improvement was significantly greater in hospitals that had satisfaction scores in the lowest quartiles, whereas hospitals in the highest quartile had a small but statistically significant decline in patient satisfaction scores.
- Centers for Medicare Medicaid Services. Medicare program; hospital outpatient prospective payment system and CY 2007 payment rates; CY 2007 update to the ambulatory surgical center covered procedures list; Medicare administrative contractors; and reporting hospital quality data for FY 2008 inpatient prospective payment system annual payment update program‐‐HCAHPS survey, SCIP, and mortality. Final rule with comment period and final rule. Fed Regist. 2006;71(226):67959–68401.
- , , , , . Development, implementation, and public reporting of the HCAHPS survey. Med Care Res Rev. 2010;67(1):27–37.
- , , , . Comparison of Hospital Consumer Assessment of Healthcare Providers and Systems patient satisfaction scores for specialty hospitals and general medical hospitals: confounding effect of survey response rate. J Hosp Med. 2014;9(9):590–593.
- , , , et al. Hospital survey shows improvements in patient experience. Health Aff (Millwood). 2010;29(11):2061–2067.
- Centers for Medicare 2010:496829.
- , , , , , . The normal liver harbors the vitamin D nuclear receptor in nonparenchymal and biliary epithelial cells. Hepatology. 2003;37(5):1034–1042.
- , . Applied Longitudinal Data Analysis: Modeling Change and Event Occurrence. Oxford, United Kingdom: Oxford University Press; 2003.
- , . Data Analysis Using Regression and Multilevel/Hierarchical Models. Cambridge, United Kingdom: Cambridge University Press; 2007.
- nlme: Linear and Nonlinear Mixed Effects Models [computer program]. Version R package version 2015;3:1–121.
- , , , . Public reporting helped drive quality improvement in outpatient diabetes care among Wisconsin physician groups. Health Aff (Millwood). 2012;31(3):570–577.
- , , , , , . Governing healthcare through performance measurement in Massachusetts and the Netherlands. Health Policy. 2014;116(1):18–26.
- , , . Public reporting drove quality gains at nursing homes. Health Aff (Millwood). 2010;29(9):1706–1713.
- , , . Users of public reports of hospital quality: who, what, why, and how?: An aggregate analysis of 16 online public reporting Web sites and users' and experts' suggestions for improvement. Agency for Healthcare Research and Quality. Available at: http://archive.ahrq.gov/professionals/quality‐patient‐safety/quality‐resources/value/pubreportusers/index.html. Updated December 2011. Accessed April 2, 2015.
- Kaiser Family Foundation. 2008 update on consumers' views of patient safety and quality information. Available at: http://kff.org/health‐reform/poll‐finding/2008‐update‐on‐consumers‐views‐of‐patient‐2/. Published September 30, 2008. Accessed April 2, 2015.
- , . A report card on continuous quality improvement. Milbank Q. 1998;76(4):625–648, 511.
- , , . Assessing the impact of continuous quality improvement on clinical practice: what it will take to accelerate progress. Milbank Q. 1998;76(4):593–624, 510.
- , . Health care competition, strategic mission, and patient satisfaction: research model and propositions. J Health Organ Manag. 2008;22(6):627–641.
- , , . The effects of physician empathy on patient satisfaction and compliance. Eval Health Prof. 2004;27(3):237–251.
- , , , , . Association between vitamin D and hepatitis C virus infection: a meta‐analysis. World J Gastroenterol. 2013;19(35):5917–5924.
- , , , . The relation of patient satisfaction with complaints against physicians and malpractice lawsuits. Am J Med. 2005;118(10):1126–1133.
- , , , , , . Relation of patients' experiences with individual physicians to malpractice risk. Int J Qual Health Care. 2008;20(1):5–12.
- , , , . Association of patient satisfaction with complaints and risk management among emergency physicians. J Emerg Med. 2011;41(4):405–411.
- , , , , . Secrets of physician satisfaction. Study identifies pressure points and reveals life practices of highly satisfied doctors. Physician Exec. 2006;32(6):30–39.
- , , , et al. Attitudes of hospital leaders toward publicly reported measures of health care quality. JAMA Intern Med. 2014;174(12):1904–1911.
- , , , , , . Closing the quality gap: revisiting the state of the science (vol. 5: public reporting as a quality improvement strategy). Evid Rep Technol Assess (Full Rep). 2012(208.5):1–645.
- , , , , . Systematic review: the evidence that publishing patient care performance data improves quality of care. Ann Intern Med. 2008;148(2):111–123.
- , . The unintended consequences of quality improvement. Curr Opin Pediatr. 2009;21(6):777–782.
- , , , et al. Unintended consequences of implementing a national performance measurement system into local practice. J Gen Intern Med. 2012;27(4):405–412.
- , . Quality assessment by external bodies: intended and unintended impact on healthcare delivery. Curr Opin Anaesthesiol. 2009;22(2):237–241.
© 2015 Society of Hospital Medicine
