User login
Does Patient Experience Predict 30-Day Readmission? A Patient-Level Analysis of HCAHPS Data
Patient experience and 30-day readmission are important measures of quality of care for hospitalized patients. Performance on both of these measures impact hospitals financially. Performance on the Hospital Consumer Assessment of Healthcare Systems and Providers (HCAHPS) survey is linked to 25% of the incentive payment under Value Based Purchasing (VBP) Program.1 Starting in 2012, the Centers for Medicare and Medicaid Services (CMS) introduced the Readmission Reduction Program, penalizing hospitals financially for excessive readmissions.2
A relationship between patient experience and readmissions has been explored at the hospital level. Studies have mostly found that higher patient experience scores are associated with lower 30-day readmission rates. In a study of the relationship between 30-day risk-standardized readmission rates for three medical conditions (acute myocardial infarction, heart failure, and pneumonia) and patient experience, the authors noted that higher experience scores for overall care and discharge planning were associated with lower readmission rates for these conditions. They also concluded that patient experience scores were more predictive of 30-day readmission than clinical performance measures. Additionally, the authors predicted that if a hospital increased its total experience scores from the 25th percentile to the 75th percentile, there would be an associated decrease in readmissions by at least 2.3% for each of these conditions.3 Practice management companies and the media have cited this finding to conclude that higher patient experience drives clinical outcomes such as 30-day readmission and that patients are often the best judges of the quality of care delivered.4,5
Other hospital-level studies have found that high 30-day readmission rates are associated with lower overall experience scores in a mixed surgical patient population; worse reports of pain control and overall care in the colorectal surgery population; lower experience scores with discharge preparedness in vascular surgery patients; and lower experience scores with physician communication, nurse communication, and discharge preparedness.6-9 A patient-level study noted higher readmissions are associated with worse experience with physician and nursing communication along with a paradoxically better experience with discharge information.10
Because these studies used an observational design, they demonstrated associations rather than causality. An alternative hypothesis is that readmitted patients complete their patient experience survey after readmission and the low experience is the result, rather than the cause, of their readmission. For patients who are readmitted, it is unclear whether there is an opportunity to complete the survey prior to readmission and whether being readmitted may impact patient perception of quality of care. Using patient-level data, we sought to assess HCAHPS patient-experience responses linked to the index admission of the patients who were readmitted in 30 days and compare it with those patients who were not readmitted during this time period. We paid particular attention to when the surveys were returned.
METHODS
Study Design
We conducted a retrospective analysis of prospectively collected 10-year HCAHPS and Press Ganey patient survey data for a single tertiary care academic hospital.
Participants
All adult patients discharged from the hospital and who responded to the routinely sent patient-experience survey were included. Surveys were sent to a random sample of 50% of the discharged patients.
The exposure group was comprised of patients who responded to the survey and were readmitted within 30 days of discharge. After subtracting 5 days from the survey receipt date for expected delays related to mail delivery time and processing time, survey response date was calculated. The exposure group was further divided into patients who responded to the survey prior to their 30-day readmission (“Pre-readmission responders”) and those that responded to the survey after their readmission (“Postreadmission responders”). A sensitivity analysis was performed by changing the number of days subtracted from the survey receipt date by 2 days in either direction. This approach did not result in any significant changes in the results.
The control group comprised patients who were not readmitted to the hospital within 30 days of discharge and who did not have an admission in the previous 30 days as well (“Not readmitted” group). An additional comparison group for exploratory analysis included patients who had experienced an admission in the prior 30 days but were not readmitted after the admission linked to the survey. These patients responded to the patient-experience surveys that were linked to their second admission in 30 days (“2nd-admission responders” group; Figure).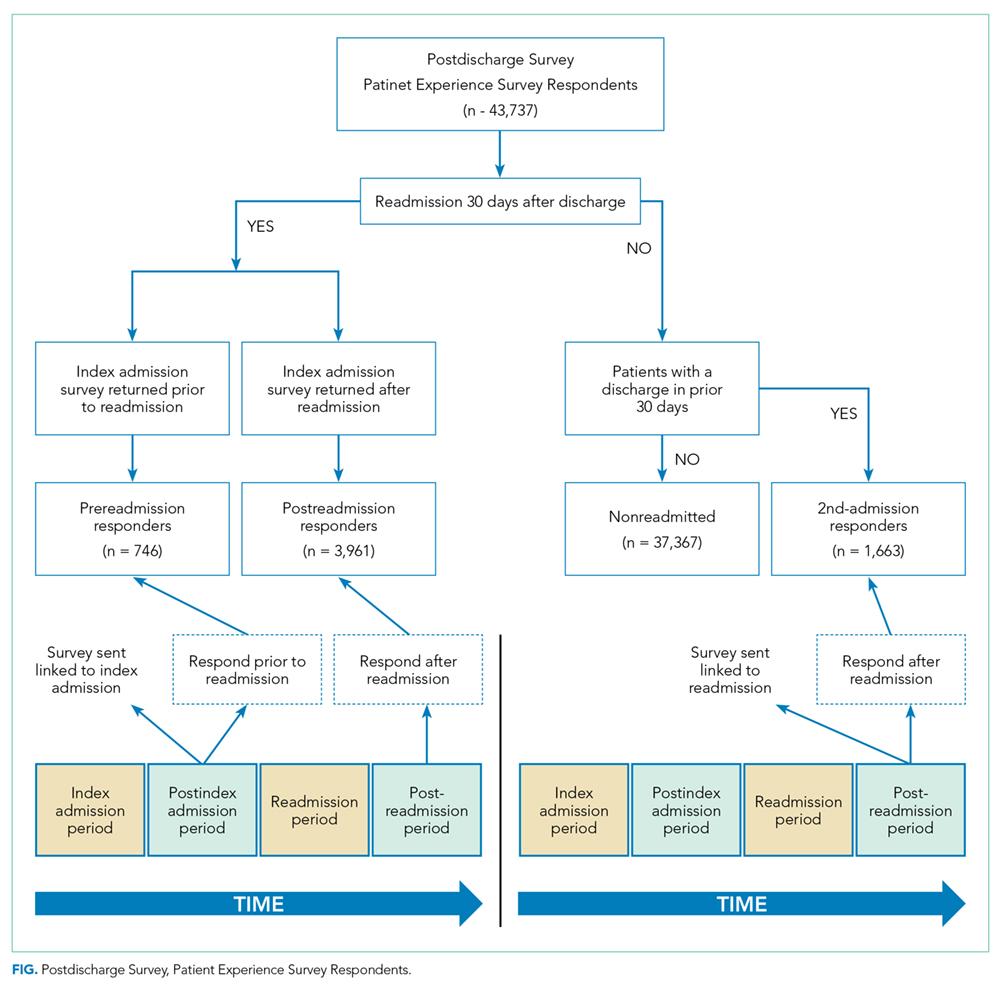
Time Periods
All survey responders from the third quarter of 2006 to the first quarter of 2016 were included in the study. Additionally, administrative data on non-responders were available from 7/2006 to 8/2012. These data were used to estimate response rates. Patient level experience and administrative data were obtained in a linked fashion for these time periods.
Instruments
Press Ganey and HCAHPS surveys were sent via mail in the same envelope. Fifty percent of the discharged patients were randomized to receive the surveys. The Press Ganey survey contained 33 items encompassing several subdomains, including room, meal, nursing, physician, ancillary staff, visitor, discharge, and overall experience.
The HCAHPS survey contained 29 CMS-mandated items, of which 21 are related to patient experience. The development, testing, and methods for administration and reporting of the HCAHPS survey have been previously described and studies using this instrument have been reported in the literature.11 Press Ganey patient satisfaction survey results have also been reported in the literature.12
Outcome Variables and Covariates
HCAHPS and Press Ganey experience survey individual item responses were the primary outcome variables of this study. Age, self-reported health status, education, primary language spoken, service line, and time taken to respond to the surveys served as the covariates. These variables are used by CMS for patient-mix adjustment and are collected on the HCAHPS survey. Additionally, the number of days to respond to the survey were included in all regression analysis to adjust for early responder effect.13-15
Statistical Analysis
“Percent top-box” scores were calculated for each survey item for patients in each group. The percent top-box scores were calculated as the percent of patients who responded “very good” for a given item on Press Ganey survey items and “always” or “definitely yes” or “yes” or “9” or “10” on HCAHPS survey items. CMS utilizes “percent top-box scores” to calculate payments under the VBP program and to report the results publicly. Numerous studies have also reported percent top-box scores for HCAHPS survey results.12
We hypothesized that whether patients complete the HCAHPS survey before or after the readmission influences their reporting of experience. To test this hypothesis, HCAHPS and Press Ganey item top-box scores of “Pre-readmission responders” and “Postreadmission responders” were compared with those of the control group using multivariate logistic regression. “Pre-readmission responders” were also compared with “Postreadmission responders”.
“2nd-admission responders” were similarly compared with the control group for an exploratory analysis. Finally, “Postreadmission responders” and “2nd-admission responders” were compared in another exploratory analysis since both these groups responded to the survey after being exposed to the readmission, even though the “Postreadmission responders” group is administratively linked to the index admission.
The Johns Hopkins Institutional Review Board approved this study.
RESULTS
There were 43,737 survey responders, among whom 4,707 were subsequently readmitted within 30 days of discharge. Among the readmitted patients who responded to the surveys linked to their index admission, only 15.8% returned the survey before readmission (pre-readmission responders’) and 84.2% returned the survey after readmission (postreadmission responders). Additionally, 1,663 patients responded to experience surveys linked to their readmission. There were 37,365 patients in the control arm (ie, patients who responded to the survey and were not readmitted within 30 days of discharge or in the prior 30 days; Figure 1). The readmission rate among survey responders was 10.6%. Among the readmitted patients, the median number of days to readmission was 10 days while the median number of days to respond to the survey for this group was 33 days. Among the nonreadmitted patients, the median number of days to return the survey was 29 days.

We also conducted an exploratory analysis of the postreadmission responders, comparing them with patients who received patient-experience surveys linked to their second admission in 30 days. Both of these groups were exposed to a readmission before they completed the surveys. There were no significant differences between these two groups on patient experience scores. Additionally, the patients who received the survey linked to their readmission had a broad dissatisfaction pattern on HCAHPS survey items that appeared similar to that of the postreadmission group when compared to the non-readmitted group (Table 3).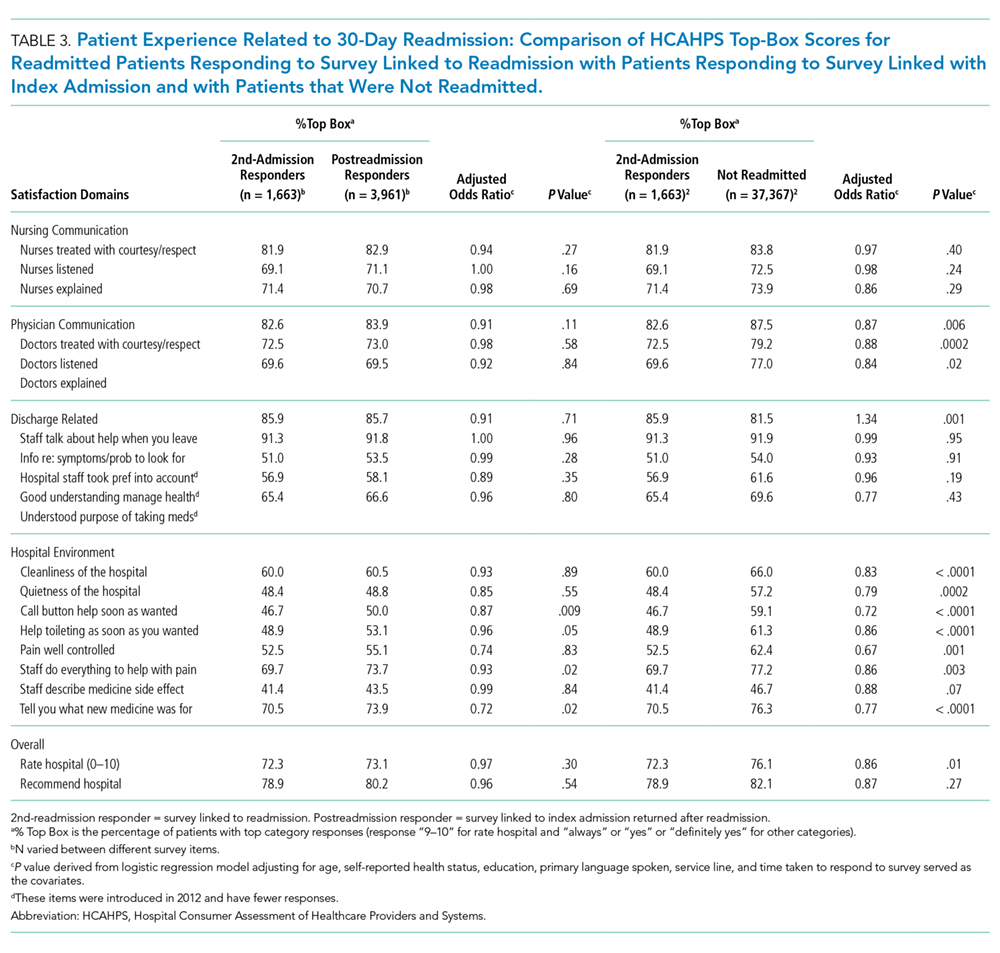
DISCUSSION
In this retrospective analysis of prospectively collected Press Ganey and HCAHPS patient-experience survey data, we found that the overwhelming majority of patients readmitted within 30 days of discharge respond to HCAHPS surveys after readmission even though the survey is sent linked to the first admission. This is not unexpected since the median time to survey response is 33 days for this group, while median time to readmission is 10 days. The dissatisfaction pattern of Postreadmission responders was similar to those who responded to the survey linked to the readmission. When a patient is readmitted prior to completing the survey, their responses appear to reflect the cumulative experience of the index admission and the readmission. The lower scores of those who respond to the survey after their readmission appear to be a driver for lower patient-experience scores related to readmissions. Overall, readmission was associated with lower scores on items in five of the nine domains used to calculate patient experience related payments under VBP.16
These findings have important implications in inferring the direction of potential causal relationship between readmissions and patient experience at the hospital level. Additionally, these patients show broad dissatisfaction with areas beyond physician communication and discharge planning. These include staff responsiveness, phlebotomy, meals, hospital cleanliness, and noise level. This pattern of dissatisfaction may represent impatience and frustration with spending additional time in the hospital environment.
Our results are consistent with findings of many of the earlier studies, but our study goes a step further by using patient-level data and incorporating survey response time in our analysis.3,7,9,10 By separating out the readmitted patients who responded to the survey prior to admission, we attempted to address the ability of patients’ perception of care to predict future readmissions. Our results do not support this idea, since pre-readmission responders had similar experience scores to non-readmitted patients. However, because of the low numbers of pre-readmission responders, the comparison lacks precision. Current HCAHPS and Press Ganey questions may lack the ability to predict future readmissions because of the timing of the survey (postdischarge) or the questions themselves.
Overall, postreadmission responders are dissatisfied with multiple domains of hospital care. Many of these survey responses may simply be related to general frustration. Alternatively, they may represent a patient population with a high degree of needs that are not as easily met by a hospital’s routine processes of care. Even though the readmission rates were 10.6% among survey responders, 14.6% of the survey responses were associated with readmissions after accounting for those who respond to surveys linked to readmission. These patients could have significant impact on cumulative experience scores.
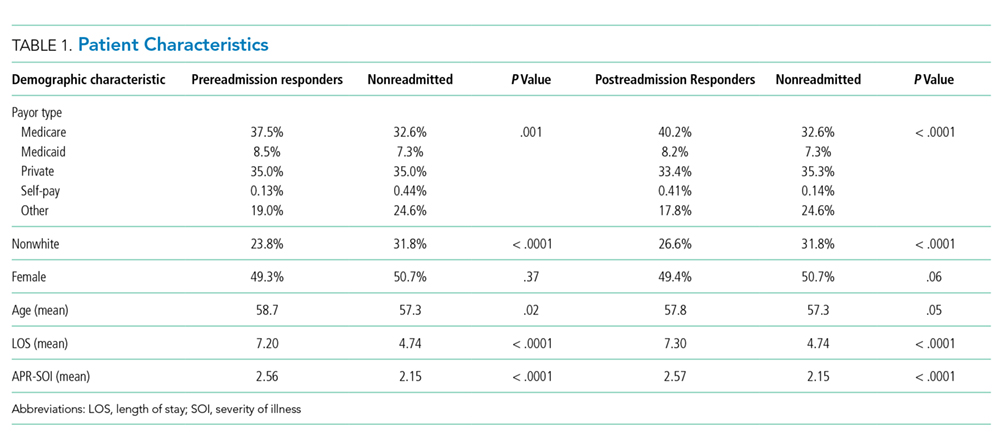
Our study has a few limitations. First, it involves a single tertiary care academic center study, and our results may not be generalizable. Second, we did not adjust for some of the patient characteristics associated with readmissions. Patients who were admitted within 30 days are different than those not readmitted based on payor, race, length of stay, and severity of illness, and we did not adjust for these factors in our analysis. This was intentional, however. Our goal was to better understand the relationship between 30-day readmission and patient experience scores as they are used for hospital-level studies, VBP, and public reporting. For these purposes, the scores are not adjusted for factors, such as payor and length of stay. We did adjust for patient-mix adjustment factors used by CMS. Third, the response rates to the HCAHPS were low and may have biased the scores. However, HCAHPS is widely used for comparisons between hospitals has been validated, and our study results have implications with regard to comparing hospital-level performance. HCAHPS results are relevant to policy and have financial consequences.17 Fourth, our study did not directly compare whether the relationship between patient experience for the postreadmission group and nonreadmitted group was different from the relationship between the pre-readmission group and postreadmission group. It is possible that there is no difference in relationship between the groups. However, despite the small number of pre-readmission responders, these patients tended to have more favorable experience responses than those who responded after being readmitted, even after adjusting for response time. Although the P values are nonsignificant for many comparisons, the directionality of the effect is relatively consistent. Also, the vast majority of the patients fall in the postreadmission group, and these patients appear to drive the overall experience related to readmissions. Finally, since relatively few patients turned in surveys prior to readmission, we had limited power to detect a significant difference between these pre-readmission responders and nonreadmitted patients.
Our study has implications for policy makers, researchers, and providers. The HCAHPS scores of patients who are readmitted and completed the survey after being readmitted reflects their experience of both the index admission and the readmission. We did not find evidence to support that HCAHPS survey responses predict future readmissions at the patient level. Our findings do support the concept that lower readmissions rates (whether due to the patient population or processes of care that decrease readmission rates) may improve HCAHPS scores. We suggest caution in assuming that improving patient experience is likely to reduce readmission rates.
Disclosures
The authors declare no conflicts of interest.
1. Hospital value-based purchasing. https://www.cms.gov/Outreach-and-Education/Medicare-Learning-Network-MLN/MLNProducts/downloads/Hospital_VBPurchasing_Fact_Sheet_ICN907664.pdf. Accessed June 25, 2016.
2. Readmissions reduction program (HRRP). Centers for Medicare & Medicaid Services. https://www.cms.gov/medicare/medicare-fee-for-service-payment/acuteinpatientpps/readmissions-reduction-program.html. Accessed June 25, 2016.
3. Boulding W, Glickman SW, Manary MP, Schulman KA, Staelin R. Relationship between patient satisfaction with inpatient care and hospital readmission within 30 days. Am J Manag Care. 2011;17(1):41-48. PubMed
4. Buum HA, Duran-Nelson AM, Menk J, Nixon LJ. Duty-hours monitoring revisited: self-report may not be adequate. Am J Med. 2013;126(4):362-365. doi: 10.1016/j.amjmed.2012.12.003 PubMed
5. Choma NN, Vasilevskis EE, Sponsler KC, Hathaway J, Kripalani S. Effect of the ACGME 16-hour rule on efficiency and quality of care: duty hours 2.0. JAMA Int Med. 2013;173(9):819-821. doi: 10.1001/jamainternmed.2013.3014 PubMed
6. Brooke BS, Samourjian E, Sarfati MR, Nguyen TT, Greer D, Kraiss LW. RR3. Patient-reported readiness at time of discharge predicts readmission following vascular surgery. J Vasc Surg. 2015;61(6):188S. doi: 10.1016/j.jvs.2015.04.356
7. Duraes LC, Merlino J, Stocchi L, et al. 756 readmission decreases patient satisfaction in colorectal surgery. Gastroenterology. 2014;146(5):S-1029. doi: 10.1016/S0016-5085(14)63751-3
8. Mitchell JP. Association of provider communication and discharge instructions on lower readmissions. J Healthc Qual. 2015;37(1):33-40. doi: 10.1097/01.JHQ.0000460126.88382.13 PubMed
9. Tsai TC, Orav EJ, Jha AK. Patient satisfaction and quality of surgical care in US hospitals. Ann Surg. 2015;261(1):2-8. doi: 10.1097/SLA.0000000000000765 PubMed
10. Hachem F, Canar J, Fullam M, Andrew S, Hohmann S, Johnson C. The relationships between HCAHPS communication and discharge satisfaction items and hospital readmissions. Patient Exp J. 2014;1(2):71-77.
11. Irby DM, Cooke M, Lowenstein D, Richards B. The academy movement: a structural approach to reinvigorating the educational mission. Acad Med. 2004;79(8):729-736. doi: 10.1097/00001888-200408000-00003 PubMed
12. Siddiqui ZK, Zuccarelli R, Durkin N, Wu AW, Brotman DJ. Changes in patient satisfaction related to hospital renovation: experience with a new clinical building. J Hosp Med. 2015;10(3):165-171. doi: 10.1002/jhm.2297 PubMed
13. Nair BR, Coughlan JL, Hensley MJ. Student and patient perspectives on bedside teaching. Med Educ. 1997;31(5):341-346. doi: 10.1046/j.1365-2923.1997.00673.x PubMed
14. Elliott MN, Zaslavsky AM, Goldstein E, et al. Effects of survey mode, patient mix, and nonresponse on CAHPS® hospital survey scores. BMC Health Serv Res. 2009;44(2p1):501-518. doi: 10.1111/j.1475-6773.2008.00914.x PubMed
15. Saunders CL, Elliott MN, Lyratzopoulos G, Abel GA. Do differential response rates to patient surveys between organizations lead to unfair performance comparisons?: evidence from the English Cancer Patient Experience Survey. Medical care. 2016;54(1):45. doi: 10.1097/MLR.0000000000000457 PubMed
16. Sabel E, Archer J. “Medical education is the ugly duckling of the medical world” and other challenges to medical educators’ identity construction: a qualitative study. Acad Med. 2014;89(11):1474-1480. doi: 10.1097/ACM.0000000000000420 PubMed
17. O’Malley AJ, Zaslavsky AM, Elliott MN, Zaborski L, Cleary PD. Case‐Mix adjustment of the CAHPS® Hospital Survey. BMC Health Serv Res. 2005;40(6p2):2162-2181. doi: 10.1111/j.1475-6773.2005.00470.x
Patient experience and 30-day readmission are important measures of quality of care for hospitalized patients. Performance on both of these measures impact hospitals financially. Performance on the Hospital Consumer Assessment of Healthcare Systems and Providers (HCAHPS) survey is linked to 25% of the incentive payment under Value Based Purchasing (VBP) Program.1 Starting in 2012, the Centers for Medicare and Medicaid Services (CMS) introduced the Readmission Reduction Program, penalizing hospitals financially for excessive readmissions.2
A relationship between patient experience and readmissions has been explored at the hospital level. Studies have mostly found that higher patient experience scores are associated with lower 30-day readmission rates. In a study of the relationship between 30-day risk-standardized readmission rates for three medical conditions (acute myocardial infarction, heart failure, and pneumonia) and patient experience, the authors noted that higher experience scores for overall care and discharge planning were associated with lower readmission rates for these conditions. They also concluded that patient experience scores were more predictive of 30-day readmission than clinical performance measures. Additionally, the authors predicted that if a hospital increased its total experience scores from the 25th percentile to the 75th percentile, there would be an associated decrease in readmissions by at least 2.3% for each of these conditions.3 Practice management companies and the media have cited this finding to conclude that higher patient experience drives clinical outcomes such as 30-day readmission and that patients are often the best judges of the quality of care delivered.4,5
Other hospital-level studies have found that high 30-day readmission rates are associated with lower overall experience scores in a mixed surgical patient population; worse reports of pain control and overall care in the colorectal surgery population; lower experience scores with discharge preparedness in vascular surgery patients; and lower experience scores with physician communication, nurse communication, and discharge preparedness.6-9 A patient-level study noted higher readmissions are associated with worse experience with physician and nursing communication along with a paradoxically better experience with discharge information.10
Because these studies used an observational design, they demonstrated associations rather than causality. An alternative hypothesis is that readmitted patients complete their patient experience survey after readmission and the low experience is the result, rather than the cause, of their readmission. For patients who are readmitted, it is unclear whether there is an opportunity to complete the survey prior to readmission and whether being readmitted may impact patient perception of quality of care. Using patient-level data, we sought to assess HCAHPS patient-experience responses linked to the index admission of the patients who were readmitted in 30 days and compare it with those patients who were not readmitted during this time period. We paid particular attention to when the surveys were returned.
METHODS
Study Design
We conducted a retrospective analysis of prospectively collected 10-year HCAHPS and Press Ganey patient survey data for a single tertiary care academic hospital.
Participants
All adult patients discharged from the hospital and who responded to the routinely sent patient-experience survey were included. Surveys were sent to a random sample of 50% of the discharged patients.
The exposure group was comprised of patients who responded to the survey and were readmitted within 30 days of discharge. After subtracting 5 days from the survey receipt date for expected delays related to mail delivery time and processing time, survey response date was calculated. The exposure group was further divided into patients who responded to the survey prior to their 30-day readmission (“Pre-readmission responders”) and those that responded to the survey after their readmission (“Postreadmission responders”). A sensitivity analysis was performed by changing the number of days subtracted from the survey receipt date by 2 days in either direction. This approach did not result in any significant changes in the results.
The control group comprised patients who were not readmitted to the hospital within 30 days of discharge and who did not have an admission in the previous 30 days as well (“Not readmitted” group). An additional comparison group for exploratory analysis included patients who had experienced an admission in the prior 30 days but were not readmitted after the admission linked to the survey. These patients responded to the patient-experience surveys that were linked to their second admission in 30 days (“2nd-admission responders” group; Figure).
Time Periods
All survey responders from the third quarter of 2006 to the first quarter of 2016 were included in the study. Additionally, administrative data on non-responders were available from 7/2006 to 8/2012. These data were used to estimate response rates. Patient level experience and administrative data were obtained in a linked fashion for these time periods.
Instruments
Press Ganey and HCAHPS surveys were sent via mail in the same envelope. Fifty percent of the discharged patients were randomized to receive the surveys. The Press Ganey survey contained 33 items encompassing several subdomains, including room, meal, nursing, physician, ancillary staff, visitor, discharge, and overall experience.
The HCAHPS survey contained 29 CMS-mandated items, of which 21 are related to patient experience. The development, testing, and methods for administration and reporting of the HCAHPS survey have been previously described and studies using this instrument have been reported in the literature.11 Press Ganey patient satisfaction survey results have also been reported in the literature.12
Outcome Variables and Covariates
HCAHPS and Press Ganey experience survey individual item responses were the primary outcome variables of this study. Age, self-reported health status, education, primary language spoken, service line, and time taken to respond to the surveys served as the covariates. These variables are used by CMS for patient-mix adjustment and are collected on the HCAHPS survey. Additionally, the number of days to respond to the survey were included in all regression analysis to adjust for early responder effect.13-15
Statistical Analysis
“Percent top-box” scores were calculated for each survey item for patients in each group. The percent top-box scores were calculated as the percent of patients who responded “very good” for a given item on Press Ganey survey items and “always” or “definitely yes” or “yes” or “9” or “10” on HCAHPS survey items. CMS utilizes “percent top-box scores” to calculate payments under the VBP program and to report the results publicly. Numerous studies have also reported percent top-box scores for HCAHPS survey results.12
We hypothesized that whether patients complete the HCAHPS survey before or after the readmission influences their reporting of experience. To test this hypothesis, HCAHPS and Press Ganey item top-box scores of “Pre-readmission responders” and “Postreadmission responders” were compared with those of the control group using multivariate logistic regression. “Pre-readmission responders” were also compared with “Postreadmission responders”.
“2nd-admission responders” were similarly compared with the control group for an exploratory analysis. Finally, “Postreadmission responders” and “2nd-admission responders” were compared in another exploratory analysis since both these groups responded to the survey after being exposed to the readmission, even though the “Postreadmission responders” group is administratively linked to the index admission.
The Johns Hopkins Institutional Review Board approved this study.
RESULTS
There were 43,737 survey responders, among whom 4,707 were subsequently readmitted within 30 days of discharge. Among the readmitted patients who responded to the surveys linked to their index admission, only 15.8% returned the survey before readmission (pre-readmission responders’) and 84.2% returned the survey after readmission (postreadmission responders). Additionally, 1,663 patients responded to experience surveys linked to their readmission. There were 37,365 patients in the control arm (ie, patients who responded to the survey and were not readmitted within 30 days of discharge or in the prior 30 days; Figure 1). The readmission rate among survey responders was 10.6%. Among the readmitted patients, the median number of days to readmission was 10 days while the median number of days to respond to the survey for this group was 33 days. Among the nonreadmitted patients, the median number of days to return the survey was 29 days.
We also conducted an exploratory analysis of the postreadmission responders, comparing them with patients who received patient-experience surveys linked to their second admission in 30 days. Both of these groups were exposed to a readmission before they completed the surveys. There were no significant differences between these two groups on patient experience scores. Additionally, the patients who received the survey linked to their readmission had a broad dissatisfaction pattern on HCAHPS survey items that appeared similar to that of the postreadmission group when compared to the non-readmitted group (Table 3).
DISCUSSION
In this retrospective analysis of prospectively collected Press Ganey and HCAHPS patient-experience survey data, we found that the overwhelming majority of patients readmitted within 30 days of discharge respond to HCAHPS surveys after readmission even though the survey is sent linked to the first admission. This is not unexpected since the median time to survey response is 33 days for this group, while median time to readmission is 10 days. The dissatisfaction pattern of Postreadmission responders was similar to those who responded to the survey linked to the readmission. When a patient is readmitted prior to completing the survey, their responses appear to reflect the cumulative experience of the index admission and the readmission. The lower scores of those who respond to the survey after their readmission appear to be a driver for lower patient-experience scores related to readmissions. Overall, readmission was associated with lower scores on items in five of the nine domains used to calculate patient experience related payments under VBP.16
These findings have important implications in inferring the direction of potential causal relationship between readmissions and patient experience at the hospital level. Additionally, these patients show broad dissatisfaction with areas beyond physician communication and discharge planning. These include staff responsiveness, phlebotomy, meals, hospital cleanliness, and noise level. This pattern of dissatisfaction may represent impatience and frustration with spending additional time in the hospital environment.
Our results are consistent with findings of many of the earlier studies, but our study goes a step further by using patient-level data and incorporating survey response time in our analysis.3,7,9,10 By separating out the readmitted patients who responded to the survey prior to admission, we attempted to address the ability of patients’ perception of care to predict future readmissions. Our results do not support this idea, since pre-readmission responders had similar experience scores to non-readmitted patients. However, because of the low numbers of pre-readmission responders, the comparison lacks precision. Current HCAHPS and Press Ganey questions may lack the ability to predict future readmissions because of the timing of the survey (postdischarge) or the questions themselves.
Overall, postreadmission responders are dissatisfied with multiple domains of hospital care. Many of these survey responses may simply be related to general frustration. Alternatively, they may represent a patient population with a high degree of needs that are not as easily met by a hospital’s routine processes of care. Even though the readmission rates were 10.6% among survey responders, 14.6% of the survey responses were associated with readmissions after accounting for those who respond to surveys linked to readmission. These patients could have significant impact on cumulative experience scores.
Our study has a few limitations. First, it involves a single tertiary care academic center study, and our results may not be generalizable. Second, we did not adjust for some of the patient characteristics associated with readmissions. Patients who were admitted within 30 days are different than those not readmitted based on payor, race, length of stay, and severity of illness, and we did not adjust for these factors in our analysis. This was intentional, however. Our goal was to better understand the relationship between 30-day readmission and patient experience scores as they are used for hospital-level studies, VBP, and public reporting. For these purposes, the scores are not adjusted for factors, such as payor and length of stay. We did adjust for patient-mix adjustment factors used by CMS. Third, the response rates to the HCAHPS were low and may have biased the scores. However, HCAHPS is widely used for comparisons between hospitals has been validated, and our study results have implications with regard to comparing hospital-level performance. HCAHPS results are relevant to policy and have financial consequences.17 Fourth, our study did not directly compare whether the relationship between patient experience for the postreadmission group and nonreadmitted group was different from the relationship between the pre-readmission group and postreadmission group. It is possible that there is no difference in relationship between the groups. However, despite the small number of pre-readmission responders, these patients tended to have more favorable experience responses than those who responded after being readmitted, even after adjusting for response time. Although the P values are nonsignificant for many comparisons, the directionality of the effect is relatively consistent. Also, the vast majority of the patients fall in the postreadmission group, and these patients appear to drive the overall experience related to readmissions. Finally, since relatively few patients turned in surveys prior to readmission, we had limited power to detect a significant difference between these pre-readmission responders and nonreadmitted patients.
Our study has implications for policy makers, researchers, and providers. The HCAHPS scores of patients who are readmitted and completed the survey after being readmitted reflects their experience of both the index admission and the readmission. We did not find evidence to support that HCAHPS survey responses predict future readmissions at the patient level. Our findings do support the concept that lower readmissions rates (whether due to the patient population or processes of care that decrease readmission rates) may improve HCAHPS scores. We suggest caution in assuming that improving patient experience is likely to reduce readmission rates.
Disclosures
The authors declare no conflicts of interest.
1. Hospital value-based purchasing. https://www.cms.gov/Outreach-and-Education/Medicare-Learning-Network-MLN/MLNProducts/downloads/Hospital_VBPurchasing_Fact_Sheet_ICN907664.pdf. Accessed June 25, 2016.
2. Readmissions reduction program (HRRP). Centers for Medicare & Medicaid Services. https://www.cms.gov/medicare/medicare-fee-for-service-payment/acuteinpatientpps/readmissions-reduction-program.html. Accessed June 25, 2016.
3. Boulding W, Glickman SW, Manary MP, Schulman KA, Staelin R. Relationship between patient satisfaction with inpatient care and hospital readmission within 30 days. Am J Manag Care. 2011;17(1):41-48. PubMed
4. Buum HA, Duran-Nelson AM, Menk J, Nixon LJ. Duty-hours monitoring revisited: self-report may not be adequate. Am J Med. 2013;126(4):362-365. doi: 10.1016/j.amjmed.2012.12.003 PubMed
5. Choma NN, Vasilevskis EE, Sponsler KC, Hathaway J, Kripalani S. Effect of the ACGME 16-hour rule on efficiency and quality of care: duty hours 2.0. JAMA Int Med. 2013;173(9):819-821. doi: 10.1001/jamainternmed.2013.3014 PubMed
6. Brooke BS, Samourjian E, Sarfati MR, Nguyen TT, Greer D, Kraiss LW. RR3. Patient-reported readiness at time of discharge predicts readmission following vascular surgery. J Vasc Surg. 2015;61(6):188S. doi: 10.1016/j.jvs.2015.04.356
7. Duraes LC, Merlino J, Stocchi L, et al. 756 readmission decreases patient satisfaction in colorectal surgery. Gastroenterology. 2014;146(5):S-1029. doi: 10.1016/S0016-5085(14)63751-3
8. Mitchell JP. Association of provider communication and discharge instructions on lower readmissions. J Healthc Qual. 2015;37(1):33-40. doi: 10.1097/01.JHQ.0000460126.88382.13 PubMed
9. Tsai TC, Orav EJ, Jha AK. Patient satisfaction and quality of surgical care in US hospitals. Ann Surg. 2015;261(1):2-8. doi: 10.1097/SLA.0000000000000765 PubMed
10. Hachem F, Canar J, Fullam M, Andrew S, Hohmann S, Johnson C. The relationships between HCAHPS communication and discharge satisfaction items and hospital readmissions. Patient Exp J. 2014;1(2):71-77.
11. Irby DM, Cooke M, Lowenstein D, Richards B. The academy movement: a structural approach to reinvigorating the educational mission. Acad Med. 2004;79(8):729-736. doi: 10.1097/00001888-200408000-00003 PubMed
12. Siddiqui ZK, Zuccarelli R, Durkin N, Wu AW, Brotman DJ. Changes in patient satisfaction related to hospital renovation: experience with a new clinical building. J Hosp Med. 2015;10(3):165-171. doi: 10.1002/jhm.2297 PubMed
13. Nair BR, Coughlan JL, Hensley MJ. Student and patient perspectives on bedside teaching. Med Educ. 1997;31(5):341-346. doi: 10.1046/j.1365-2923.1997.00673.x PubMed
14. Elliott MN, Zaslavsky AM, Goldstein E, et al. Effects of survey mode, patient mix, and nonresponse on CAHPS® hospital survey scores. BMC Health Serv Res. 2009;44(2p1):501-518. doi: 10.1111/j.1475-6773.2008.00914.x PubMed
15. Saunders CL, Elliott MN, Lyratzopoulos G, Abel GA. Do differential response rates to patient surveys between organizations lead to unfair performance comparisons?: evidence from the English Cancer Patient Experience Survey. Medical care. 2016;54(1):45. doi: 10.1097/MLR.0000000000000457 PubMed
16. Sabel E, Archer J. “Medical education is the ugly duckling of the medical world” and other challenges to medical educators’ identity construction: a qualitative study. Acad Med. 2014;89(11):1474-1480. doi: 10.1097/ACM.0000000000000420 PubMed
17. O’Malley AJ, Zaslavsky AM, Elliott MN, Zaborski L, Cleary PD. Case‐Mix adjustment of the CAHPS® Hospital Survey. BMC Health Serv Res. 2005;40(6p2):2162-2181. doi: 10.1111/j.1475-6773.2005.00470.x
© 2018 Society of Hospital Medicine
Does provider self-reporting of etiquette behaviors improve patient experience? A randomized controlled trial
Physicians have historically had limited adoption of strategies to improve patient experience and often cite suboptimal data and lack of evidence-driven strategies. 1,2 However, public reporting of hospital-level physician domain Hospital Consumer Assessment of Healthcare Providers and Systems (HCAHPS) experience scores, and more recent linking of payments to performance on patient experience metrics, have been associated with significant increases in physician domain scores for most of the hospitals. 3 Hospitals and healthcare organizations have deployed a broad range of strategies to engage physicians. These include emphasizing the relationship between patient experience and patient compliance, complaints, and malpractice lawsuits; appealing to physicians’ sense of competitiveness by publishing individual provider experience scores; educating physicians on HCAHPS and providing them with regularly updated data; and development of specific techniques for improving patient-physician interaction. 4-8
Studies show that educational curricula on improving etiquette and communication skills for physicians lead to improvement in patient experience, and many such training programs are available to hospitals for a significant cost.9-15 Other studies that have focused on providing timely and individual feedback to physicians using tools other than HCAHPS have shown improvement in experience in some instances. 16,17 However, these strategies are resource intensive, require the presence of an independent observer in each patient room, and may not be practical in many settings. Further, long-term sustainability may be problematic.
Since the goal of any educational intervention targeting physicians is routinizing best practices, and since resource-intensive strategies of continuous assessment and feedback may not be practical, we sought to test the impact of periodic physician self-reporting of their etiquette-based behavior on their patient experience scores.
METHODS
Subjects
Hospitalists from 4 hospitals (2 community and 2 academic) that are part of the same healthcare system were the study subjects. Hospitalists who had at least 15 unique patients responding to the routinely administered Press Ganey experience survey during the baseline period were considered eligible. Eligible hospitalists were invited to enroll in the study if their site director confirmed that the provider was likely to stay with the group for the subsequent 12-month study period.

Randomization, Intervention and Control Group
Hospitalists were randomized to the study arm or control arm (1:1 randomization). Study arm participants received biweekly etiquette behavior (EB) surveys and were asked to report how frequently they performed 7 best-practice bedside etiquette behaviors during the previous 2-week period (Table 1). These behaviors were pre-defined by a consensus group of investigators as being amenable to self-report and commonly considered best practice as described in detail below. Control-arm participants received similarly worded survey on quality improvement behaviors (QIB) that would not be expected to impact patient experience (such as reviewing medications to ensure that antithrombotic prophylaxis was prescribed, Table 1).
Baseline and Study Periods
A 12-month period prior to the enrollment of each hospitalist was considered the baseline period for that individual. Hospitalist eligibility was assessed based on number of unique patients for each hospitalist who responded to the survey during this baseline period. Once enrolled, baseline provider-level patient experience scores were calculated based on the survey responses during this 12-month baseline period. Baseline etiquette behavior performance of the study was calculated from the first survey. After the initial survey, hospitalists received biweekly surveys (EB or QIB) for the 12-month study period for a total of 26 surveys (including the initial survey).
Survey Development, Nature of Survey, Survey Distribution Methods
The EB and QIB physician self-report surveys were developed through an iterative process by the study team. The EB survey included elements from an etiquette-based medicine checklist for hospitalized patients described by Kahn et al. 18 We conducted a review of literature to identify evidence-based practices.19-22 Research team members contributed items on best practices in etiquette-based medicine from their experience. Specifically, behaviors were selected if they met the following 4 criteria: 1) performing the behavior did not lead to significant increase in workload and was relatively easy to incorporate in the work flow; 2) occurrence of the behavior would be easy to note for any outside observer or the providers themselves; 3) the practice was considered to be either an evidence-based or consensus-based best-practice; 4) there was consensus among study team members on including the item. The survey was tested for understandability by hospitalists who were not eligible for the study.
The EB survey contained 7 items related to behaviors that were expected to impact patient experience. The QIB survey contained 4 items related to behaviors that were expected to improve quality (Table 1). The initial survey also included questions about demographic characteristics of the participants.
Survey questionnaires were sent via email every 2 weeks for a period of 12 months. The survey questionnaire became available every other week, between Friday morning and Tuesday midnight, during the study period. Hospitalists received daily email reminders on each of these days with a link to the survey website if they did not complete the survey. They had the opportunity to report that they were not on service in the prior week and opt out of the survey for the specific 2-week period. The survey questions were available online as well as on a mobile device format.
Provider Level Patient Experience Scores
Provider-level patient experience scores were calculated from the physician domain Press Ganey survey items, which included the time that the physician spent with patients, the physician addressed questions/worries, the physician kept patients informed, the friendliness/courtesy of physician, and the skill of physician. Press Ganey responses were scored from 1 to 5 based on the Likert scale responses on the survey such that a response “very good” was scored 5 and a response “very poor” was scored 1. Additionally, physician domain HCAHPS item (doctors treat with courtesy/respect, doctors listen carefully, doctors explain in way patients understand) responses were utilized to calculate another set of HCAHPS provider level experience scores. The responses were scored as 1 for “always” response and “0” for any other response, consistent with CMS dichotomization of these results for public reporting. Weighted scores were calculated for individual hospitalists based on the proportion of days each hospitalist billed for the hospitalization so that experience scores of patients who were cared for by multiple providers were assigned to each provider in proportion to the percent of care delivered.23 Separate composite physician scores were generated from the 5 Press Ganey and for the 3 HCAHPS physician items. Each item was weighted equally, with the maximum possible for Press Ganey composite score of 25 (sum of the maximum possible score of 5 on each of the 5 Press Ganey items) and the HCAHPS possible total was 3 (sum of the maximum possible score of 1 on each of the 3 HCAHPS items).
ANALYSIS AND STATISTICAL METHODS
We analyzed the data to assess for changes in frequency of self-reported behavior over the study period, changes in provider-level patient experience between baseline and study period, and the association between the these 2 outcomes. The self-reported etiquette-based behavior responses were scored as 1 for the lowest response (never) to 4 as the highest (always). With 7 questions, the maximum attainable score was 28. The maximum score was normalized to 100 for ease of interpretation (corresponding to percentage of time etiquette behaviors were employed, by self-report). Similarly, the maximum attainable self-reported QIB-related behavior score on the 4 questions was 16. This was also converted to 0-100 scale for ease of comparison.
Two additional sets of analyses were performed to evaluate changes in patient experience during the study period. First, the mean 12-month provider level patient experience composite score in the baseline period was compared with the 12-month composite score during the 12-month study period for the study group and the control group. These were assessed with and without adjusting for age, sex, race, and U.S. medical school graduate (USMG) status. In the second set of unadjusted and adjusted analyses, changes in biweekly composite scores during the study period were compared between the intervention and the control groups while accounting for correlation between observations from the same physician using mixed linear models. Linear mixed models were used to accommodate correlations among multiple observations made on the same physician by including random effects within each regression model. Furthermore, these models allowed us to account for unbalanced design in our data when not all physicians had an equal number of observations and data elements were collected asynchronously.24 Analyses were performed in R version 3.2.2 (The R Project for Statistical Computing, Vienna, Austria); linear mixed models were performed using the ‘nlme’ package.25
We hypothesized that self-reporting on biweekly surveys would result in increases in the frequency of the reported behavior in each arm. We also hypothesized that, because of biweekly reflection and self-reporting on etiquette-based bedside behavior, patient experience scores would increase in the study arm.
RESULTS
Of the 80 hospitalists approached to participate in the study, 64 elected to participate (80% participation rate). The mean response rate to the survey was 57.4% for the intervention arm and 85.7% for the control arm. Higher response rates were not associated with improved patient experience scores. Of the respondents, 43.1% were younger than 35 years of age, 51.5% practiced in academic settings, and 53.1% were female. There was no statistical difference between hospitalists’ baseline composite experience scores based on gender, age, academic hospitalist status, USMG status, and English as a second language status. Similarly, there were no differences in poststudy composite experience scores based on physician characteristics.
Physicians reported high rates of etiquette-based behavior at baseline (mean score, 83.9+/-3.3), and this showed moderate improvement over the study period (5.6 % [3.9%-7.3%, P < 0.0001]). Similarly, there was a moderate increase in frequency of self-reported behavior in the control arm (6.8% [3.5%-10.1%, P < 0.0001]). Hospitalists reported on 80.7% (77.6%-83.4%) of the biweekly surveys that they “almost always” wrapped up by asking, “Do you have any other questions or concerns” or something similar. In contrast, hospitalists reported on only 27.9% (24.7%-31.3%) of the biweekly survey that they “almost always” sat down in the patient room.
The composite physician domain Press Ganey experience scores were no different for the intervention arm and the control arm during the 12-month baseline period (21.8 vs. 21.7; P = 0.90) and the 12-month intervention period (21.6 vs. 21.5; P = 0.75). Baseline self-reported behaviors were not associated with baseline experience scores. Similarly, there were no differences between the arms on composite physician domain HCAHPS experience scores during baseline (2.1 vs. 2.3; P = 0.13) and intervention periods (2.2 vs. 2.1; P = 0.33).
The difference in difference analysis of the baseline and postintervention composite between the intervention arm and the control arm was not statistically significant for Press Ganey composite physician experience scores (-0.163 vs. -0.322; P = 0.71) or HCAHPS composite physician scores (-0.162 vs. -0.071; P = 0.06). The results did not change when controlled for survey response rate (percentage biweekly surveys completed by the hospitalist), age, gender, USMG status, English as a second language status, or percent clinical effort. The difference in difference analysis of the individual Press Ganey and HCAHPS physician domain items that were used to calculate the composite score was also not statistically significant (Table 2).

Changes in self-reported etiquette-based behavior were not associated with any changes in composite Press Ganey and HCAHPS experience score or individual items of the composite experience scores between baseline and intervention period. Similarly, biweekly self-reported etiquette behaviors were not associated with composite and individual item experience scores derived from responses of the patients discharged during the same 2-week reporting period. The intra-class correlation between observations from the same physician was only 0.02%, suggesting that most of the variation in scores was likely due to patient factors and did not result from differences between physicians.
DISCUSSION
This 12-month randomized multicenter study of hospitalists showed that repeated self-reporting of etiquette-based behavior results in modest reported increases in performance of these behaviors. However, there was no associated increase in provider level patient experience scores at the end of the study period when compared to baseline scores of the same physicians or when compared to the scores of the control group. The study demonstrated feasibility of self-reporting of behaviors by physicians with high participation when provided modest incentives.
Educational and feedback strategies used to improve patient experience are very resource intensive. Training sessions provided at some hospitals may take hours, and sustained effects are unproved. The presence of an independent observer in patient rooms to generate feedback for providers is not scalable and sustainable outside of a research study environment.9-11,15,17,26-29 We attempted to use physician repeated self-reporting to reinforce the important and easy to adopt components of etiquette-based behavior to develop a more easily sustainable strategy. This may have failed for several reasons.
When combining “always” and “usually” responses, the physicians in our study reported a high level of etiquette behavior at baseline. If physicians believe that they are performing well at baseline, they would not consider this to be an area in need of improvement. Bigger changes in behavior may have been possible had the physicians rated themselves less favorably at baseline. Inflated or high baseline self-assessment of performance might also have led to limited success of other types of educational interventions had they been employed.
Studies published since the rollout of our study have shown that physicians significantly overestimate how frequently they perform these etiquette behaviors.30,31 It is likely that was the case in our study subjects. This may, at best, indicate that a much higher change in the level of self-reported performance would be needed to result in meaningful actual changes, or worse, may render self-reported etiquette behavior entirely unreliable. Interventions designed to improve etiquette-based behavior might need to provide feedback about performance.
A program that provides education on the importance of etiquette-based behaviors, obtains objective measures of performance of these behaviors, and offers individualized feedback may be more likely to increase the desired behaviors. This is a limitation of our study. However, we aimed to test a method that required limited resources. Additionally, our method for attributing HCAHPS scores to an individual physician, based on weighted scores that were calculated according to the proportion of days each hospitalist billed for the hospitalization, may be inaccurate. It is possible that each interaction does not contribute equally to the overall score. A team-based intervention and experience measurements could overcome this limitation.
CONCLUSION
This randomized trial demonstrated the feasibility of self-assessment of bedside etiquette behaviors by hospitalists but failed to demonstrate a meaningful impact on patient experience through self-report. These findings suggest that more intensive interventions, perhaps involving direct observation, peer-to-peer mentoring, or other techniques may be required to impact significantly physician etiquette behaviors.
Disclosure
Johns Hopkins Hospitalist Scholars Program provided funding support. Dr. Qayyum is a consultant for Sunovion. The other authors have nothing to report.
1. Blumenthal D, Kilo CM. A report card on continuous quality improvement. Milbank Q. 1998;76(4):625-648. PubMed
2. Shortell SM, Bennett CL, Byck GR. Assessing the impact of continuous quality improvement on clinical practice: What it will take to accelerate progress. Milbank Q. 1998;76(4):593-624. PubMed
3. Mann RK, Siddiqui Z, Kurbanova N, Qayyum R. Effect of HCAHPS reporting on patient satisfaction with physician communication. J Hosp Med. 2015;11(2):105-110. PubMed
4. Rivers PA, Glover SH. Health care competition, strategic mission, and patient satisfaction: research model and propositions. J Health Organ Manag. 2008;22(6):627-641. PubMed
5. Kim SS, Kaplowitz S, Johnston MV. The effects of physician empathy on patient satisfaction and compliance. Eval Health Prof. 2004;27(3):237-251. PubMed
6. Stelfox HT, Gandhi TK, Orav EJ, Gustafson ML. The relation of patient satisfaction with complaints against physicians and malpractice lawsuits. Am J Med. 2005;118(10):1126-1133. PubMed
7. Rodriguez HP, Rodday AM, Marshall RE, Nelson KL, Rogers WH, Safran DG. Relation of patients’ experiences with individual physicians to malpractice risk. Int J Qual Health Care. 2008;20(1):5-12. PubMed
8. Cydulka RK, Tamayo-Sarver J, Gage A, Bagnoli D. Association of patient satisfaction with complaints and risk management among emergency physicians. J Emerg Med. 2011;41(4):405-411. PubMed
9. Windover AK, Boissy A, Rice TW, Gilligan T, Velez VJ, Merlino J. The REDE model of healthcare communication: Optimizing relationship as a therapeutic agent. Journal of Patient Experience. 2014;1(1):8-13.
10. Chou CL, Hirschmann K, Fortin AH 6th, Lichstein PR. The impact of a faculty learning community on professional and personal development: the facilitator training program of the American Academy on Communication in Healthcare. Acad Med. 2014;89(7):1051-1056. PubMed
11. Kennedy M, Denise M, Fasolino M, John P, Gullen M, David J. Improving the patient experience through provider communication skills building. Patient Experience Journal. 2014;1(1):56-60.
12. Braverman AM, Kunkel EJ, Katz L, et al. Do I buy it? How AIDET™ training changes residents’ values about patient care. Journal of Patient Experience. 2015;2(1):13-20.
13. Riess H, Kelley JM, Bailey RW, Dunn EJ, Phillips M. Empathy training for resident physicians: a randomized controlled trial of a neuroscience-informed curriculum. J Gen Intern Med. 2012;27(10):1280-1286. PubMed
14. Rothberg MB, Steele JR, Wheeler J, Arora A, Priya A, Lindenauer PK. The relationship between time spent communicating and communication outcomes on a hospital medicine service. J Gen Internl Med. 2012;27(2):185-189. PubMed
15. O’Leary KJ, Cyrus RM. Improving patient satisfaction: timely feedback to specific physicians is essential for success. J Hosp Med. 2015;10(8):555-556. PubMed
16. Indovina K, Keniston A, Reid M, et al. Real‐time patient experience surveys of hospitalized medical patients. J Hosp Med. 2016;10(8):497-502. PubMed
17. Banka G, Edgington S, Kyulo N, et al. Improving patient satisfaction through physician education, feedback, and incentives. J Hosp Med. 2015;10(8):497-502. PubMed
18. Kahn MW. Etiquette-based medicine. N Engl J Med. 2008;358(19):1988-1989. PubMed
19. Arora V, Gangireddy S, Mehrotra A, Ginde R, Tormey M, Meltzer D. Ability of hospitalized patients to identify their in-hospital physicians. Arch Intern Med. 2009;169(2):199-201. PubMed
20. Francis JJ, Pankratz VS, Huddleston JM. Patient satisfaction associated with correct identification of physicians’ photographs. Mayo Clin Proc. 2001;76(6):604-608. PubMed
21. Strasser F, Palmer JL, Willey J, et al. Impact of physician sitting versus standing during inpatient oncology consultations: patients’ preference and perception of compassion and duration. A randomized controlled trial. J Pain Symptom Manage. 2005;29(5):489-497. PubMed
22. Dudas RA, Lemerman H, Barone M, Serwint JR. PHACES (Photographs of Academic Clinicians and Their Educational Status): a tool to improve delivery of family-centered care. Acad Pediatr. 2010;10(2):138-145. PubMed
23. Herzke C, Michtalik H, Durkin N, et al. A method for attributing patient-level metrics to rotating providers in an inpatient setting. J Hosp Med. Under revision.
24. Holden JE, Kelley K, Agarwal R. Analyzing change: a primer on multilevel models with applications to nephrology. Am J Nephrol. 2008;28(5):792-801. PubMed
25. Pinheiro J, Bates D, DebRoy S, Sarkar D. Linear and nonlinear mixed effects models. R package version. 2007;3:57.
26. Braverman AM, Kunkel EJ, Katz L, et al. Do I buy it? How AIDET™ training changes residents’ values about patient care. Journal of Patient Experience. 2015;2(1):13-20.
27. Riess H, Kelley JM, Bailey RW, Dunn EJ, Phillips M. Empathy training for resident physicians: A randomized controlled trial of a neuroscience-informed curriculum. J Gen Intern Med. 2012;27(10):1280-1286. PubMed
28. Raper SE, Gupta M, Okusanya O, Morris JB. Improving communication skills: A course for academic medical center surgery residents and faculty. J Surg Educ. 2015;72(6):e202-e211. PubMed
29. Indovina K, Keniston A, Reid M, et al. Real‐time patient experience surveys of hospitalized medical patients. J Hosp Med. 2016;11(4):251-256. PubMed
30. Block L, Hutzler L, Habicht R, et al. Do internal medicine interns practice etiquette‐based communication? A critical look at the inpatient encounter. J Hosp Med. 2013;8(11):631-634. PubMed
31. Tackett S, Tad-y D, Rios R, Kisuule F, Wright S. Appraising the practice of etiquette-based medicine in the inpatient setting. J Gen Intern Med. 2013;28(7):908-913. PubMed
Physicians have historically had limited adoption of strategies to improve patient experience and often cite suboptimal data and lack of evidence-driven strategies. 1,2 However, public reporting of hospital-level physician domain Hospital Consumer Assessment of Healthcare Providers and Systems (HCAHPS) experience scores, and more recent linking of payments to performance on patient experience metrics, have been associated with significant increases in physician domain scores for most of the hospitals. 3 Hospitals and healthcare organizations have deployed a broad range of strategies to engage physicians. These include emphasizing the relationship between patient experience and patient compliance, complaints, and malpractice lawsuits; appealing to physicians’ sense of competitiveness by publishing individual provider experience scores; educating physicians on HCAHPS and providing them with regularly updated data; and development of specific techniques for improving patient-physician interaction. 4-8
Studies show that educational curricula on improving etiquette and communication skills for physicians lead to improvement in patient experience, and many such training programs are available to hospitals for a significant cost.9-15 Other studies that have focused on providing timely and individual feedback to physicians using tools other than HCAHPS have shown improvement in experience in some instances. 16,17 However, these strategies are resource intensive, require the presence of an independent observer in each patient room, and may not be practical in many settings. Further, long-term sustainability may be problematic.
Since the goal of any educational intervention targeting physicians is routinizing best practices, and since resource-intensive strategies of continuous assessment and feedback may not be practical, we sought to test the impact of periodic physician self-reporting of their etiquette-based behavior on their patient experience scores.
METHODS
Subjects
Hospitalists from 4 hospitals (2 community and 2 academic) that are part of the same healthcare system were the study subjects. Hospitalists who had at least 15 unique patients responding to the routinely administered Press Ganey experience survey during the baseline period were considered eligible. Eligible hospitalists were invited to enroll in the study if their site director confirmed that the provider was likely to stay with the group for the subsequent 12-month study period.
Randomization, Intervention and Control Group
Hospitalists were randomized to the study arm or control arm (1:1 randomization). Study arm participants received biweekly etiquette behavior (EB) surveys and were asked to report how frequently they performed 7 best-practice bedside etiquette behaviors during the previous 2-week period (Table 1). These behaviors were pre-defined by a consensus group of investigators as being amenable to self-report and commonly considered best practice as described in detail below. Control-arm participants received similarly worded survey on quality improvement behaviors (QIB) that would not be expected to impact patient experience (such as reviewing medications to ensure that antithrombotic prophylaxis was prescribed, Table 1).
Baseline and Study Periods
A 12-month period prior to the enrollment of each hospitalist was considered the baseline period for that individual. Hospitalist eligibility was assessed based on number of unique patients for each hospitalist who responded to the survey during this baseline period. Once enrolled, baseline provider-level patient experience scores were calculated based on the survey responses during this 12-month baseline period. Baseline etiquette behavior performance of the study was calculated from the first survey. After the initial survey, hospitalists received biweekly surveys (EB or QIB) for the 12-month study period for a total of 26 surveys (including the initial survey).
Survey Development, Nature of Survey, Survey Distribution Methods
The EB and QIB physician self-report surveys were developed through an iterative process by the study team. The EB survey included elements from an etiquette-based medicine checklist for hospitalized patients described by Kahn et al. 18 We conducted a review of literature to identify evidence-based practices.19-22 Research team members contributed items on best practices in etiquette-based medicine from their experience. Specifically, behaviors were selected if they met the following 4 criteria: 1) performing the behavior did not lead to significant increase in workload and was relatively easy to incorporate in the work flow; 2) occurrence of the behavior would be easy to note for any outside observer or the providers themselves; 3) the practice was considered to be either an evidence-based or consensus-based best-practice; 4) there was consensus among study team members on including the item. The survey was tested for understandability by hospitalists who were not eligible for the study.
The EB survey contained 7 items related to behaviors that were expected to impact patient experience. The QIB survey contained 4 items related to behaviors that were expected to improve quality (Table 1). The initial survey also included questions about demographic characteristics of the participants.
Survey questionnaires were sent via email every 2 weeks for a period of 12 months. The survey questionnaire became available every other week, between Friday morning and Tuesday midnight, during the study period. Hospitalists received daily email reminders on each of these days with a link to the survey website if they did not complete the survey. They had the opportunity to report that they were not on service in the prior week and opt out of the survey for the specific 2-week period. The survey questions were available online as well as on a mobile device format.
Provider Level Patient Experience Scores
Provider-level patient experience scores were calculated from the physician domain Press Ganey survey items, which included the time that the physician spent with patients, the physician addressed questions/worries, the physician kept patients informed, the friendliness/courtesy of physician, and the skill of physician. Press Ganey responses were scored from 1 to 5 based on the Likert scale responses on the survey such that a response “very good” was scored 5 and a response “very poor” was scored 1. Additionally, physician domain HCAHPS item (doctors treat with courtesy/respect, doctors listen carefully, doctors explain in way patients understand) responses were utilized to calculate another set of HCAHPS provider level experience scores. The responses were scored as 1 for “always” response and “0” for any other response, consistent with CMS dichotomization of these results for public reporting. Weighted scores were calculated for individual hospitalists based on the proportion of days each hospitalist billed for the hospitalization so that experience scores of patients who were cared for by multiple providers were assigned to each provider in proportion to the percent of care delivered.23 Separate composite physician scores were generated from the 5 Press Ganey and for the 3 HCAHPS physician items. Each item was weighted equally, with the maximum possible for Press Ganey composite score of 25 (sum of the maximum possible score of 5 on each of the 5 Press Ganey items) and the HCAHPS possible total was 3 (sum of the maximum possible score of 1 on each of the 3 HCAHPS items).
ANALYSIS AND STATISTICAL METHODS
We analyzed the data to assess for changes in frequency of self-reported behavior over the study period, changes in provider-level patient experience between baseline and study period, and the association between the these 2 outcomes. The self-reported etiquette-based behavior responses were scored as 1 for the lowest response (never) to 4 as the highest (always). With 7 questions, the maximum attainable score was 28. The maximum score was normalized to 100 for ease of interpretation (corresponding to percentage of time etiquette behaviors were employed, by self-report). Similarly, the maximum attainable self-reported QIB-related behavior score on the 4 questions was 16. This was also converted to 0-100 scale for ease of comparison.
Two additional sets of analyses were performed to evaluate changes in patient experience during the study period. First, the mean 12-month provider level patient experience composite score in the baseline period was compared with the 12-month composite score during the 12-month study period for the study group and the control group. These were assessed with and without adjusting for age, sex, race, and U.S. medical school graduate (USMG) status. In the second set of unadjusted and adjusted analyses, changes in biweekly composite scores during the study period were compared between the intervention and the control groups while accounting for correlation between observations from the same physician using mixed linear models. Linear mixed models were used to accommodate correlations among multiple observations made on the same physician by including random effects within each regression model. Furthermore, these models allowed us to account for unbalanced design in our data when not all physicians had an equal number of observations and data elements were collected asynchronously.24 Analyses were performed in R version 3.2.2 (The R Project for Statistical Computing, Vienna, Austria); linear mixed models were performed using the ‘nlme’ package.25
We hypothesized that self-reporting on biweekly surveys would result in increases in the frequency of the reported behavior in each arm. We also hypothesized that, because of biweekly reflection and self-reporting on etiquette-based bedside behavior, patient experience scores would increase in the study arm.
RESULTS
Of the 80 hospitalists approached to participate in the study, 64 elected to participate (80% participation rate). The mean response rate to the survey was 57.4% for the intervention arm and 85.7% for the control arm. Higher response rates were not associated with improved patient experience scores. Of the respondents, 43.1% were younger than 35 years of age, 51.5% practiced in academic settings, and 53.1% were female. There was no statistical difference between hospitalists’ baseline composite experience scores based on gender, age, academic hospitalist status, USMG status, and English as a second language status. Similarly, there were no differences in poststudy composite experience scores based on physician characteristics.
Physicians reported high rates of etiquette-based behavior at baseline (mean score, 83.9+/-3.3), and this showed moderate improvement over the study period (5.6 % [3.9%-7.3%, P < 0.0001]). Similarly, there was a moderate increase in frequency of self-reported behavior in the control arm (6.8% [3.5%-10.1%, P < 0.0001]). Hospitalists reported on 80.7% (77.6%-83.4%) of the biweekly surveys that they “almost always” wrapped up by asking, “Do you have any other questions or concerns” or something similar. In contrast, hospitalists reported on only 27.9% (24.7%-31.3%) of the biweekly survey that they “almost always” sat down in the patient room.
The composite physician domain Press Ganey experience scores were no different for the intervention arm and the control arm during the 12-month baseline period (21.8 vs. 21.7; P = 0.90) and the 12-month intervention period (21.6 vs. 21.5; P = 0.75). Baseline self-reported behaviors were not associated with baseline experience scores. Similarly, there were no differences between the arms on composite physician domain HCAHPS experience scores during baseline (2.1 vs. 2.3; P = 0.13) and intervention periods (2.2 vs. 2.1; P = 0.33).
The difference in difference analysis of the baseline and postintervention composite between the intervention arm and the control arm was not statistically significant for Press Ganey composite physician experience scores (-0.163 vs. -0.322; P = 0.71) or HCAHPS composite physician scores (-0.162 vs. -0.071; P = 0.06). The results did not change when controlled for survey response rate (percentage biweekly surveys completed by the hospitalist), age, gender, USMG status, English as a second language status, or percent clinical effort. The difference in difference analysis of the individual Press Ganey and HCAHPS physician domain items that were used to calculate the composite score was also not statistically significant (Table 2).
Changes in self-reported etiquette-based behavior were not associated with any changes in composite Press Ganey and HCAHPS experience score or individual items of the composite experience scores between baseline and intervention period. Similarly, biweekly self-reported etiquette behaviors were not associated with composite and individual item experience scores derived from responses of the patients discharged during the same 2-week reporting period. The intra-class correlation between observations from the same physician was only 0.02%, suggesting that most of the variation in scores was likely due to patient factors and did not result from differences between physicians.
DISCUSSION
This 12-month randomized multicenter study of hospitalists showed that repeated self-reporting of etiquette-based behavior results in modest reported increases in performance of these behaviors. However, there was no associated increase in provider level patient experience scores at the end of the study period when compared to baseline scores of the same physicians or when compared to the scores of the control group. The study demonstrated feasibility of self-reporting of behaviors by physicians with high participation when provided modest incentives.
Educational and feedback strategies used to improve patient experience are very resource intensive. Training sessions provided at some hospitals may take hours, and sustained effects are unproved. The presence of an independent observer in patient rooms to generate feedback for providers is not scalable and sustainable outside of a research study environment.9-11,15,17,26-29 We attempted to use physician repeated self-reporting to reinforce the important and easy to adopt components of etiquette-based behavior to develop a more easily sustainable strategy. This may have failed for several reasons.
When combining “always” and “usually” responses, the physicians in our study reported a high level of etiquette behavior at baseline. If physicians believe that they are performing well at baseline, they would not consider this to be an area in need of improvement. Bigger changes in behavior may have been possible had the physicians rated themselves less favorably at baseline. Inflated or high baseline self-assessment of performance might also have led to limited success of other types of educational interventions had they been employed.
Studies published since the rollout of our study have shown that physicians significantly overestimate how frequently they perform these etiquette behaviors.30,31 It is likely that was the case in our study subjects. This may, at best, indicate that a much higher change in the level of self-reported performance would be needed to result in meaningful actual changes, or worse, may render self-reported etiquette behavior entirely unreliable. Interventions designed to improve etiquette-based behavior might need to provide feedback about performance.
A program that provides education on the importance of etiquette-based behaviors, obtains objective measures of performance of these behaviors, and offers individualized feedback may be more likely to increase the desired behaviors. This is a limitation of our study. However, we aimed to test a method that required limited resources. Additionally, our method for attributing HCAHPS scores to an individual physician, based on weighted scores that were calculated according to the proportion of days each hospitalist billed for the hospitalization, may be inaccurate. It is possible that each interaction does not contribute equally to the overall score. A team-based intervention and experience measurements could overcome this limitation.
CONCLUSION
This randomized trial demonstrated the feasibility of self-assessment of bedside etiquette behaviors by hospitalists but failed to demonstrate a meaningful impact on patient experience through self-report. These findings suggest that more intensive interventions, perhaps involving direct observation, peer-to-peer mentoring, or other techniques may be required to impact significantly physician etiquette behaviors.
Disclosure
Johns Hopkins Hospitalist Scholars Program provided funding support. Dr. Qayyum is a consultant for Sunovion. The other authors have nothing to report.
1. Blumenthal D, Kilo CM. A report card on continuous quality improvement. Milbank Q. 1998;76(4):625-648. PubMed
2. Shortell SM, Bennett CL, Byck GR. Assessing the impact of continuous quality improvement on clinical practice: What it will take to accelerate progress. Milbank Q. 1998;76(4):593-624. PubMed
3. Mann RK, Siddiqui Z, Kurbanova N, Qayyum R. Effect of HCAHPS reporting on patient satisfaction with physician communication. J Hosp Med. 2015;11(2):105-110. PubMed
4. Rivers PA, Glover SH. Health care competition, strategic mission, and patient satisfaction: research model and propositions. J Health Organ Manag. 2008;22(6):627-641. PubMed
5. Kim SS, Kaplowitz S, Johnston MV. The effects of physician empathy on patient satisfaction and compliance. Eval Health Prof. 2004;27(3):237-251. PubMed
6. Stelfox HT, Gandhi TK, Orav EJ, Gustafson ML. The relation of patient satisfaction with complaints against physicians and malpractice lawsuits. Am J Med. 2005;118(10):1126-1133. PubMed
7. Rodriguez HP, Rodday AM, Marshall RE, Nelson KL, Rogers WH, Safran DG. Relation of patients’ experiences with individual physicians to malpractice risk. Int J Qual Health Care. 2008;20(1):5-12. PubMed
8. Cydulka RK, Tamayo-Sarver J, Gage A, Bagnoli D. Association of patient satisfaction with complaints and risk management among emergency physicians. J Emerg Med. 2011;41(4):405-411. PubMed
9. Windover AK, Boissy A, Rice TW, Gilligan T, Velez VJ, Merlino J. The REDE model of healthcare communication: Optimizing relationship as a therapeutic agent. Journal of Patient Experience. 2014;1(1):8-13.
10. Chou CL, Hirschmann K, Fortin AH 6th, Lichstein PR. The impact of a faculty learning community on professional and personal development: the facilitator training program of the American Academy on Communication in Healthcare. Acad Med. 2014;89(7):1051-1056. PubMed
11. Kennedy M, Denise M, Fasolino M, John P, Gullen M, David J. Improving the patient experience through provider communication skills building. Patient Experience Journal. 2014;1(1):56-60.
12. Braverman AM, Kunkel EJ, Katz L, et al. Do I buy it? How AIDET™ training changes residents’ values about patient care. Journal of Patient Experience. 2015;2(1):13-20.
13. Riess H, Kelley JM, Bailey RW, Dunn EJ, Phillips M. Empathy training for resident physicians: a randomized controlled trial of a neuroscience-informed curriculum. J Gen Intern Med. 2012;27(10):1280-1286. PubMed
14. Rothberg MB, Steele JR, Wheeler J, Arora A, Priya A, Lindenauer PK. The relationship between time spent communicating and communication outcomes on a hospital medicine service. J Gen Internl Med. 2012;27(2):185-189. PubMed
15. O’Leary KJ, Cyrus RM. Improving patient satisfaction: timely feedback to specific physicians is essential for success. J Hosp Med. 2015;10(8):555-556. PubMed
16. Indovina K, Keniston A, Reid M, et al. Real‐time patient experience surveys of hospitalized medical patients. J Hosp Med. 2016;10(8):497-502. PubMed
17. Banka G, Edgington S, Kyulo N, et al. Improving patient satisfaction through physician education, feedback, and incentives. J Hosp Med. 2015;10(8):497-502. PubMed
18. Kahn MW. Etiquette-based medicine. N Engl J Med. 2008;358(19):1988-1989. PubMed
19. Arora V, Gangireddy S, Mehrotra A, Ginde R, Tormey M, Meltzer D. Ability of hospitalized patients to identify their in-hospital physicians. Arch Intern Med. 2009;169(2):199-201. PubMed
20. Francis JJ, Pankratz VS, Huddleston JM. Patient satisfaction associated with correct identification of physicians’ photographs. Mayo Clin Proc. 2001;76(6):604-608. PubMed
21. Strasser F, Palmer JL, Willey J, et al. Impact of physician sitting versus standing during inpatient oncology consultations: patients’ preference and perception of compassion and duration. A randomized controlled trial. J Pain Symptom Manage. 2005;29(5):489-497. PubMed
22. Dudas RA, Lemerman H, Barone M, Serwint JR. PHACES (Photographs of Academic Clinicians and Their Educational Status): a tool to improve delivery of family-centered care. Acad Pediatr. 2010;10(2):138-145. PubMed
23. Herzke C, Michtalik H, Durkin N, et al. A method for attributing patient-level metrics to rotating providers in an inpatient setting. J Hosp Med. Under revision.
24. Holden JE, Kelley K, Agarwal R. Analyzing change: a primer on multilevel models with applications to nephrology. Am J Nephrol. 2008;28(5):792-801. PubMed
25. Pinheiro J, Bates D, DebRoy S, Sarkar D. Linear and nonlinear mixed effects models. R package version. 2007;3:57.
26. Braverman AM, Kunkel EJ, Katz L, et al. Do I buy it? How AIDET™ training changes residents’ values about patient care. Journal of Patient Experience. 2015;2(1):13-20.
27. Riess H, Kelley JM, Bailey RW, Dunn EJ, Phillips M. Empathy training for resident physicians: A randomized controlled trial of a neuroscience-informed curriculum. J Gen Intern Med. 2012;27(10):1280-1286. PubMed
28. Raper SE, Gupta M, Okusanya O, Morris JB. Improving communication skills: A course for academic medical center surgery residents and faculty. J Surg Educ. 2015;72(6):e202-e211. PubMed
29. Indovina K, Keniston A, Reid M, et al. Real‐time patient experience surveys of hospitalized medical patients. J Hosp Med. 2016;11(4):251-256. PubMed
30. Block L, Hutzler L, Habicht R, et al. Do internal medicine interns practice etiquette‐based communication? A critical look at the inpatient encounter. J Hosp Med. 2013;8(11):631-634. PubMed
31. Tackett S, Tad-y D, Rios R, Kisuule F, Wright S. Appraising the practice of etiquette-based medicine in the inpatient setting. J Gen Intern Med. 2013;28(7):908-913. PubMed
© 2017 Society of Hospital Medicine
HCAHPS Surveys and Patient Satisfaction
The Hospital Consumer Assessment of Healthcare Providers and Systems (HCAHPS) is the first national, standardized, publicly reported survey of patients' perception of hospital care. HCAHPS mandates a standard method of collecting and reporting perception of health care by patients to enable valid comparisons across all hospitals.[1, 2, 3] Voluntary collection of HCAHPS data for public reporting began in July 2006, mandatory collection of data for hospitals that participate in Inpatient Prospective Payment Program of Medicare began in July 2007, and public reporting of mandated HCAHPS scores began in 2008.[2]
Using data from the first 2‐year period, an earlier study had reported an increase in HCAHPS patient satisfaction scores in all domains except in the domain of satisfaction with physician communication.[4] Since then, data from additional years have become available, allowing assessment of satisfaction of hospitalized patients with physician communication over a longer period. Therefore, our objective was to examine changes in patient satisfaction with physician communication from 2007 to 2013, the last reported date, and to explore hospital and local population characteristics that may be associated with patient satisfaction.
METHODS
Publicly available data from 3 sources were used for this study. Patient satisfaction scores with physician communication and hospital characteristics were obtained from the HCAHPS data files available at the Hospital Compare database maintained by the Centers for Medicare and Medicaid Services (CMS).[5] HCAHPS files contain data for the preceding 12 months and are updated quarterly. We used files that reported data from the first to the fourth quarter of the year for 2007 to 2013. The HCAHPS survey contains 32 questions, of which 3 questions are about physician communication.[6] We used the percentage of survey participants who responded that physicians always communicated well as a measure of patient satisfaction with physician communication (the other 2 questions were not included). Hospitals that reported data on patient satisfaction during 2007 were divided into quartiles based on their satisfaction scores, and this quartile allocation was maintained during each subsequent year. Survey response rate, in percentage, was obtained from HCAHPS data files for each year. Hospital characteristics, such as ownership of the hospital, teaching hospital status, and designation of critical access hospital were obtained from the Hospital Compare website. Hospital ownership was defined as government (owned by federal, state, Veterans Affairs, or tribal authorities), for profit (owned by physicians or another proprietary), or nonprofit (owned by a nonprofit organization such as a church). A hospital was considered a teaching hospital if it obtained graduate medical education funding from CMS.
We obtained local population data from 2010 decennial census files and from the American Community Survey 5‐year data profile from 2009 to 2013; both datasets are maintained by the Unites States Census Bureau.[7] Census is mandated by Article I, Section 2 of the United States Constitution and takes place every 10 years. The American Community Survey is also a mandatory, ongoing statistical survey that samples a small percentage of the population every year giving communities the information they need to plan investments and services. We chose to use 5‐year estimates as these are more precise and are reliable in analyzing small populations. For each zip code, we extracted data on total population, percentage of African Americans in the population, median income, poverty level, and insurance status from the Census Bureau data files.
Local population characteristics at zip code level were mapped to hospitals using hospital service area (HSA) crosswalk files from the Dartmouth Atlas of Health Care.[7, 8] The Dartmouth Atlas defined 3436 HSAs by assigning zip codes to the hospital area where the greatest proportion of its Medicare residents were hospitalized. The number of acute care hospital beds and the number of physicians within the HSA were also obtained from the Dartmouth Atlas. Merging data from these 3 sources generated a dataset that contained information about patient satisfaction scores from a particular hospital, hospital characteristics, and population characteristics of the healthcare market.
Data were summarized as mean and standard deviation (SD). To model the dependence of observations from the same hospital and the correlation between hospitals within the same state due to similar regulations, and to assess the relative contribution of satisfaction scores over time within hospital, hospitals within states, and across states, 3‐level hierarchical regression models were examined.[9, 10] At the within‐hospital level, survey response rate was used as a time‐varying variable in addition to the year of observation. However, only year of observation was used to explore differences in patient satisfaction trajectories between hospitals. At the hospitals‐within‐states level, hospital characteristics and local population characteristics within the HSA were included. At the states level, only random effects were obtained, and no additional variables were included in the models.
Four models were built to assess the relationship between satisfaction scores and predictors. The basic model used only random effects without any predictors to determine the relative contribution of each level (within hospitals, hospitals within states, and across states) to variation in patient satisfaction scores and thus was consistent with the variance component analysis. The first model included the year of observation as a predictor at the within‐hospital level to examine trends in patient satisfaction scores during the observation period. For the second model, we added baseline satisfaction quartiles to the second model, whereas remaining predictors (HSA population, African American percentage in HSA, survey response rate, HSA median income, ownership of hospital, percentage with private any insurance in HSA, acute care hospital beds in HSA, teaching hospital status, and percentage of people living in poverty within HSA) were added in the third model. Quartiles for baseline satisfaction were generated using satisfaction scores from 2007. As a larger number of hospitals reported results for 2008 than for 2007 (2273 vs 3746), we conducted a sensitivity analysis using satisfaction quartiles in 2008 as baseline and examined subsequent trends over time for the 4 models noted above. All multilevel models were specified using the nlme package in R to account for clustering of observations within hospitals and hospitals within states, using hospital and state level random effects.[11]
RESULTS
Of the 4353 hospitals with data for the 7‐year period, the majority were in the Southern region (South = 1669, Midwest = 1239, Northeast = 607, West = 838). Texas had the largest number of hospital (N = 358) followed by California (N = 340). The largest number of hospitals were nonprofit (N = 2637, 60.6%). Mean (SD) patient satisfaction with physician communication was 78.9% (5.7%) in 2007 that increased to 81.7% (5.4%) in 2013. Throughout the observation period, the highest patient satisfaction was in the South (80.6% [6.6%] in 2007 and 83.2% [5.4%] in 2013). Of the 2273 hospitals that reported data in 2007, the mean satisfaction score of the lowest quartile was 72% (3.2%), and the highest quartile was 86.9% (3.2%) (Table 1). As a group, hospitals in the highest quartile in 2007 still had higher satisfaction scores in 2013 than the hospitals in the lowest quartile (85% [4.2%] vs 77% [3.6%], respectively). Only 4 of the 584 hospitals in the lowest quartile in 2007 climbed up to the highest quartile in 2013, whereas 22 hospitals that were in the upper quartile in 2007 dropped to the lowest quartile in 2013.
| Characteristic | Quartiles Based on 2007 Satisfaction Scores | |||
|---|---|---|---|---|
| Highest Quartile | 2nd Quartile | 3rd Quartile | Lowest Quartile | |
| ||||
| Total no. of hospitals, N (%) | 461 (20.3) | 545 (24.0) | 683 (30.0) | 584 (25.7) |
| Hospital ownership, N (%) | ||||
| For profit | 50 (14.4) | 60 (17.3) | 96 (27.7) | 140 (40.5) |
| Nonprofit | 269 (17.4) | 380 (24.6) | 515 (33.4) | 378 (24.5) |
| Government | 142 (36.9) | 105 (27.3) | 72 (18.7) | 66 (17.1) |
| HSA population, in 1,000, median (IQR) | 33.2 (70.5) | 88.5 (186) | 161.8 (374) | 222.2 (534) |
| Racial distribution of HSA population, median (IQR) | ||||
| White, % | 82.6 (26.2) | 82.5 (28.5) | 74.2 (32.9) | 66.8 (35.3) |
| Black, % | 4.3 (21.7) | 3.7 (16.3) | 5.9 (14.8) | 7.4 (12.1) |
| Other, % | 6.4 (7.1) | 8.8 (10.8) | 12.9 (19.8) | 20.0 (33.1) |
| HSA mean median income in $1,000, mean (SD) | 44.6 (11.7) | 52.4 (17.8) | 58.4 (17.1) | 57.5 (15.7) |
| Satisfaction scores (at baseline), mean (SD) | 86.9 (3.1) | 81.4 (1.1) | 77.5 (1.1) | 72.0 (3.2) |
| Satisfaction scores (in 2013), mean (SD) | 85.0 (4.3) | 82.0 (3.4) | 79.7 (3.0) | 77.0 (3.5) |
| Survey response rate (at baseline), mean (SD) | 43.2 (19.8) | 34.5 (9.4) | 32.6 (8.0) | 30.3 (7.8) |
| Survey response rate (20072013), mean (SD) | 32.8 (7.8) | 32.6 (7.5) | 30.8 (6.5) | 29.3 (6.5) |
| Percentage with any insurance in HSA, mean (SD) | 84.0 (5.4) | 84.8 (6.6) | 85.5 (6.3) | 83.9 (6.6) |
| Teaching hospital, N (%) | 42 (9.1) | 155 (28.4) | 277 (40.5) | 274 (46.9%) |
| Acute care hospital beds in HSA (per 1,000), mean (SD) | 3.2 (1.2) | 2.6 (0.8) | 2.5 (0.8) | 2.4 (0.7) |
| Number of physicians in HSA (per 100,000), mean (SD) | 190 (36) | 197 (43) | 204 (47) | 199 (45) |
| Percentage with poverty in HSA, mean (SD)[7] | 16.9 (6.6) | 15.5 (6.5) | 14.4 (5.7) | 15.5 (6.0) |
Using variance component analysis, we found that 23% of the variation in patient satisfaction scores with physician communication was due to differences between states, 52% was due to differences between hospitals within states, and 24% was due to changes over time within a hospital. When examining time trends of satisfaction during the 7‐year period without adjusting for other predictors, we found a statistically significant increasing trend in patient satisfaction with physician communication (0.33% per year; P < 0.001). We also found a significant negative correlation (0.62, P < 0.001) between the random effects for baseline satisfaction (intercept) and change over time (slope), suggesting that initial patient satisfaction with physicians at a hospital was negatively correlated with subsequent change in satisfaction scores during the observation period.
When examining the effect of satisfaction ranking in 2007, hospitals within the lowest quartile of patient satisfaction in 2007 had significantly larger increase in satisfaction scores during the subsequent period as compared to the hospitals in each of the other 3 quartiles (all P < 0.001, Table 2). The difference in the magnitude of the rate of increase in satisfaction scores was greatest between the lowest quartile and the highest quartile (1.10% per year; P < 0.001). In fact, the highest quartile had a statistically significant absolute decrease in patient satisfaction during the observation period (0.23% per year; P < 0.001, Figure 1).
| Variable | Model 1: ; P Value | Model 2: ; P Value | Model 3: ; P Value |
|---|---|---|---|
| |||
| Time (in years) | 0.33; <0.001 | 0.87; <0.001 | 0.89; <0.001 |
| Satisfaction quartiles at baseline | |||
| Highest quartile | 12.1; <0.001 | 10.4; <0.001 | |
| 2nd quartile | 7.9; <0.001 | 7.1; <0.001 | |
| 3rd quartile | 4.5; <0.001 | 4.1; <0.001 | |
| Lowest quartile (REF) | REF | REF | |
| Interaction with time | |||
| Highest quartile | 1.10; <0.001 | 0.94; <0.001 | |
| 2nd quartile | 0.73; <0.001 | 0.71; <0.001 | |
| 3rd quartile | 0.48; <0.001 | 0.47;<0.001 | |
| Survey response rate (%) | 0.12; <0.001 | ||
| Total population, in 10,000 | 0.002; 0.02 | ||
| African American (%) | 0.004; 0.13 | ||
| HSA median Income in $10,000 | 0.02; 0.58 | ||
| Ownership | |||
| Government (REF) | REF | ||
| Nonprofit | 0.01; 0.88 | ||
| For profit | 0.21; 0.11 | ||
| Percentage with insurance in HSA | 0.007; 0.27 | ||
| Acute care beds in HSA (per 1,000) | 0.60; <0.001 | ||
| Physicians in HSA (per 100,000) | 0.003; 0.007 | ||
| Teaching hospital | 0.34; 0.001 | ||
| Percentage in poverty in HSA | 0.01; 0.27 | ||
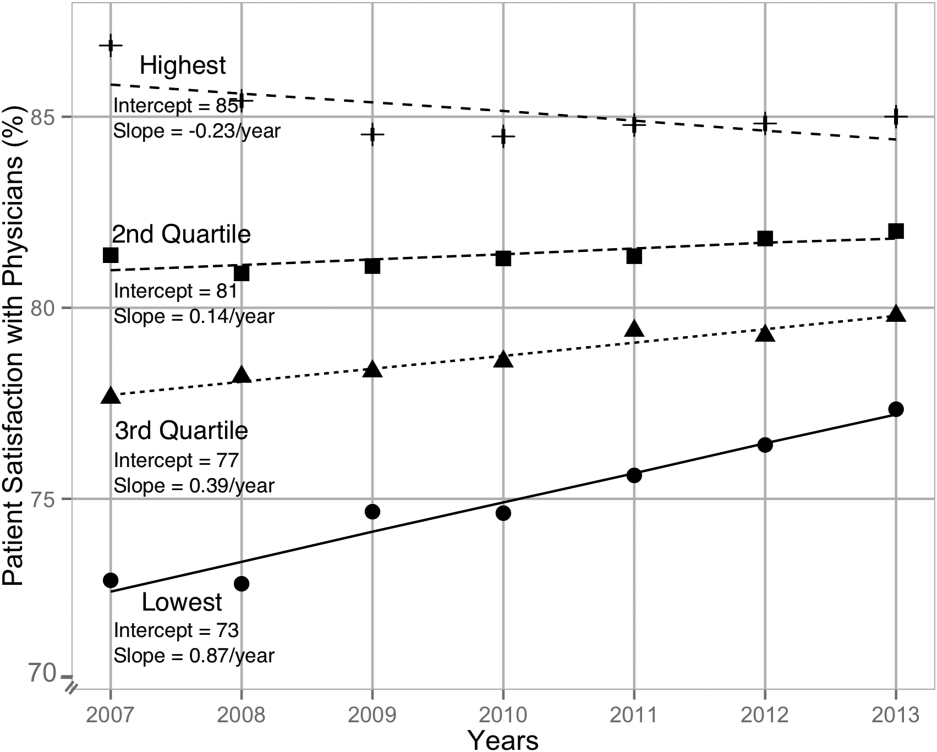
After adjusting for hospital characteristics and population characteristics of the HSA, the 2007 satisfaction quartiles remained significantly associated with subsequent change in satisfaction scores during the 7‐year observation period (Table 2). In addition, survey response rate, number of physicians, and the number of acute‐care hospital beds within the HSA were positively associated with patient satisfaction, whereas higher HSA population density and being a teaching hospital were negatively associated with patient satisfaction. Using 2008 satisfaction scores as baseline, the results did not change except that the number of physicians in the HSA and being a teaching hospital were no longer associated with satisfaction scores with physicians.
DISCUSSION
Using hierarchical modelling, we have shown that national patient satisfaction scores with physicians have consistently improved since 2007, the year when reporting of satisfaction scores began. We further show that the improvement in satisfaction scores has not been consistent through all hospitals. The largest increase in satisfaction scores was in hospitals that were in the lowest quartile of satisfaction scores in 2007. In contrast, satisfaction scores decreased in hospitals that were in the uppermost quartile of satisfaction scores. The difference between the lowest and uppermost quartile was so large in 2007 that despite the difference in the direction of change in satisfaction scores, hospitals in the uppermost quartile continued to have higher satisfaction scores in 2013 than hospitals in the lowest quartile.
Consistent with our findings for patient satisfaction, other studies have found that public reporting is associated with improvement in healthcare quality measures across nursing homes, physician groups, and hospitals.[12, 13, 14] However, it is unclear how public reporting can change patient satisfaction. The main purpose of public reporting of quality of healthcare measures, such as patient satisfaction with the healthcare they receive, is to generate value by increasing transparency and accountability, thereby increasing the quality of healthcare delivery. Healthcare consumers may also utilize the reported measures to choose providers that deliver high‐quality healthcare. Contrary to expectations, there is very little evidence that consumers choose healthcare facilities based on public reporting, and it is likely that other mechanisms may explain the observed association.[15, 16]
Physicians have historically had low adoption of strategies to improve patient satisfaction and often cite suboptimal data and lack of evidence for data‐driven strategies.[17, 18] Hospitals and healthcare organizations have deployed a broad range of strategies to engage physicians. These include emphasizing relationship between patient satisfaction and patient compliance, complaints and malpractice lawsuits, appealing to physicians' sense of competitiveness by publishing individual provider satisfaction scores, educating physicians on HCAHPS and providing them with regularly updated data, and development of specific techniques for improving patient‐physician interaction.[19, 20, 21, 22, 23, 24] Administrators may also enhance physician engagement by improving physician satisfaction, decreasing their turnover, support development of physicians in administrative leadership roles, and improving financial transparency.[25] Thus, involvement of hospital leadership has been instrumental in encouraging physicians to focus on quality measures including patient satisfaction. Some evidence suggests that public reporting exerts strong influence on hospital leaders for adequate resource allocation, local planning, and improvement efforts.[26, 27, 28]
Perhaps the most intriguing finding in our study is that hospitals in the uppermost quartile of satisfaction scores in 2007 had a statistically significant steady decline in scores during the following period as compared to hospitals in the lowest quartile that had a steady increase. A possible explanation for this finding can be that high‐performing hospitals become complacent and do not invest in developing the effort‐intensive resources required to maintain and improve performance in the physician‐related patient satisfaction domain. These resources may be diverted to competing needs that include addressing improvement efforts for a large number of other publicly reported healthcare quality measures. Thus, an unintended consequence of quality improvement may be that improvement in 1 domain may be at the expense of quality of care in another domain.[29, 30, 31] On the other hand, it is likely that hospitals in the lower quartile see a larger improvement in their scores for the same degree of investment as hospitals in the higher quartiles. It is also likely that hospitals, particularly those in the lowest quartile, develop their individual benchmarks and expend effort that is in line with their perceived need for improvement to achieve their strategic and marketing goals.
Our study has significant implications for the healthcare system, clinical practice, and future research. Whereas public reporting of quality measures is associated with an overall improvement in the reported quality measure, hospitals with high scores may move resources away from that metric or become complacent. Health policy makers need to design policies that encourage all hospitals and providers to perform better or continue to perform well. We further show that differences between hospitals and between local healthcare markets are the biggest factor determining the variation in patient satisfaction with physician communication, and an adjustment in reported score for these factors may be needed. Although local healthcare market factors may not be modifiable, an exchange of knowledge between hospitals with low and high patient satisfaction scores may improve overall satisfaction scores. Similarly, hospitals that are successful in increasing patient satisfaction scores should identify and share useful interventions.
The main strength of our study is that we used data on patient satisfaction with physician communication that were reported annually by most hospitals within the United States. These longitudinal data allowed us to examine not only the effect of public reporting on patient satisfaction with physician communication but also its trend over time. As we had 7 years of data, we were able to eliminate the possibility of regression to mean; an extreme result on first measurement is followed by a second measurement that tends to be closer to the average. Further, we adjusted satisfaction scores based on hospital and local healthcare market characteristics allowing us to compare satisfaction scores across hospitals. However, because units of observation were hospitals and not patients, we could not examine the effect of patient characteristics on satisfaction scores. In addition, HCAHPS surveys have low response rates and may have response and selection bias. Furthermore, we were unable to examine the strategies implemented by hospitals to improve satisfaction scores or the effect of such strategies on satisfaction scores. Data on hospital strategies to increase satisfaction scores are not available for most hospitals and could not have been included in the study.
In summary, we have found that public reporting was followed by an improvement in patient satisfaction scores with physician communication between 2007 and 2013. The rate of improvement was significantly greater in hospitals that had satisfaction scores in the lowest quartiles, whereas hospitals in the highest quartile had a small but statistically significant decline in patient satisfaction scores.
- Centers for Medicare Medicaid Services. Medicare program; hospital outpatient prospective payment system and CY 2007 payment rates; CY 2007 update to the ambulatory surgical center covered procedures list; Medicare administrative contractors; and reporting hospital quality data for FY 2008 inpatient prospective payment system annual payment update program‐‐HCAHPS survey, SCIP, and mortality. Final rule with comment period and final rule. Fed Regist. 2006;71(226):67959–68401.
- , , , , . Development, implementation, and public reporting of the HCAHPS survey. Med Care Res Rev. 2010;67(1):27–37.
- , , , . Comparison of Hospital Consumer Assessment of Healthcare Providers and Systems patient satisfaction scores for specialty hospitals and general medical hospitals: confounding effect of survey response rate. J Hosp Med. 2014;9(9):590–593.
- , , , et al. Hospital survey shows improvements in patient experience. Health Aff (Millwood). 2010;29(11):2061–2067.
- Centers for Medicare 2010:496829.
- , , , , , . The normal liver harbors the vitamin D nuclear receptor in nonparenchymal and biliary epithelial cells. Hepatology. 2003;37(5):1034–1042.
- , . Applied Longitudinal Data Analysis: Modeling Change and Event Occurrence. Oxford, United Kingdom: Oxford University Press; 2003.
- , . Data Analysis Using Regression and Multilevel/Hierarchical Models. Cambridge, United Kingdom: Cambridge University Press; 2007.
- nlme: Linear and Nonlinear Mixed Effects Models [computer program]. Version R package version 2015;3:1–121.
- , , , . Public reporting helped drive quality improvement in outpatient diabetes care among Wisconsin physician groups. Health Aff (Millwood). 2012;31(3):570–577.
- , , , , , . Governing healthcare through performance measurement in Massachusetts and the Netherlands. Health Policy. 2014;116(1):18–26.
- , , . Public reporting drove quality gains at nursing homes. Health Aff (Millwood). 2010;29(9):1706–1713.
- , , . Users of public reports of hospital quality: who, what, why, and how?: An aggregate analysis of 16 online public reporting Web sites and users' and experts' suggestions for improvement. Agency for Healthcare Research and Quality. Available at: http://archive.ahrq.gov/professionals/quality‐patient‐safety/quality‐resources/value/pubreportusers/index.html. Updated December 2011. Accessed April 2, 2015.
- Kaiser Family Foundation. 2008 update on consumers' views of patient safety and quality information. Available at: http://kff.org/health‐reform/poll‐finding/2008‐update‐on‐consumers‐views‐of‐patient‐2/. Published September 30, 2008. Accessed April 2, 2015.
- , . A report card on continuous quality improvement. Milbank Q. 1998;76(4):625–648, 511.
- , , . Assessing the impact of continuous quality improvement on clinical practice: what it will take to accelerate progress. Milbank Q. 1998;76(4):593–624, 510.
- , . Health care competition, strategic mission, and patient satisfaction: research model and propositions. J Health Organ Manag. 2008;22(6):627–641.
- , , . The effects of physician empathy on patient satisfaction and compliance. Eval Health Prof. 2004;27(3):237–251.
- , , , , . Association between vitamin D and hepatitis C virus infection: a meta‐analysis. World J Gastroenterol. 2013;19(35):5917–5924.
- , , , . The relation of patient satisfaction with complaints against physicians and malpractice lawsuits. Am J Med. 2005;118(10):1126–1133.
- , , , , , . Relation of patients' experiences with individual physicians to malpractice risk. Int J Qual Health Care. 2008;20(1):5–12.
- , , , . Association of patient satisfaction with complaints and risk management among emergency physicians. J Emerg Med. 2011;41(4):405–411.
- , , , , . Secrets of physician satisfaction. Study identifies pressure points and reveals life practices of highly satisfied doctors. Physician Exec. 2006;32(6):30–39.
- , , , et al. Attitudes of hospital leaders toward publicly reported measures of health care quality. JAMA Intern Med. 2014;174(12):1904–1911.
- , , , , , . Closing the quality gap: revisiting the state of the science (vol. 5: public reporting as a quality improvement strategy). Evid Rep Technol Assess (Full Rep). 2012(208.5):1–645.
- , , , , . Systematic review: the evidence that publishing patient care performance data improves quality of care. Ann Intern Med. 2008;148(2):111–123.
- , . The unintended consequences of quality improvement. Curr Opin Pediatr. 2009;21(6):777–782.
- , , , et al. Unintended consequences of implementing a national performance measurement system into local practice. J Gen Intern Med. 2012;27(4):405–412.
- , . Quality assessment by external bodies: intended and unintended impact on healthcare delivery. Curr Opin Anaesthesiol. 2009;22(2):237–241.
The Hospital Consumer Assessment of Healthcare Providers and Systems (HCAHPS) is the first national, standardized, publicly reported survey of patients' perception of hospital care. HCAHPS mandates a standard method of collecting and reporting perception of health care by patients to enable valid comparisons across all hospitals.[1, 2, 3] Voluntary collection of HCAHPS data for public reporting began in July 2006, mandatory collection of data for hospitals that participate in Inpatient Prospective Payment Program of Medicare began in July 2007, and public reporting of mandated HCAHPS scores began in 2008.[2]
Using data from the first 2‐year period, an earlier study had reported an increase in HCAHPS patient satisfaction scores in all domains except in the domain of satisfaction with physician communication.[4] Since then, data from additional years have become available, allowing assessment of satisfaction of hospitalized patients with physician communication over a longer period. Therefore, our objective was to examine changes in patient satisfaction with physician communication from 2007 to 2013, the last reported date, and to explore hospital and local population characteristics that may be associated with patient satisfaction.
METHODS
Publicly available data from 3 sources were used for this study. Patient satisfaction scores with physician communication and hospital characteristics were obtained from the HCAHPS data files available at the Hospital Compare database maintained by the Centers for Medicare and Medicaid Services (CMS).[5] HCAHPS files contain data for the preceding 12 months and are updated quarterly. We used files that reported data from the first to the fourth quarter of the year for 2007 to 2013. The HCAHPS survey contains 32 questions, of which 3 questions are about physician communication.[6] We used the percentage of survey participants who responded that physicians always communicated well as a measure of patient satisfaction with physician communication (the other 2 questions were not included). Hospitals that reported data on patient satisfaction during 2007 were divided into quartiles based on their satisfaction scores, and this quartile allocation was maintained during each subsequent year. Survey response rate, in percentage, was obtained from HCAHPS data files for each year. Hospital characteristics, such as ownership of the hospital, teaching hospital status, and designation of critical access hospital were obtained from the Hospital Compare website. Hospital ownership was defined as government (owned by federal, state, Veterans Affairs, or tribal authorities), for profit (owned by physicians or another proprietary), or nonprofit (owned by a nonprofit organization such as a church). A hospital was considered a teaching hospital if it obtained graduate medical education funding from CMS.
We obtained local population data from 2010 decennial census files and from the American Community Survey 5‐year data profile from 2009 to 2013; both datasets are maintained by the Unites States Census Bureau.[7] Census is mandated by Article I, Section 2 of the United States Constitution and takes place every 10 years. The American Community Survey is also a mandatory, ongoing statistical survey that samples a small percentage of the population every year giving communities the information they need to plan investments and services. We chose to use 5‐year estimates as these are more precise and are reliable in analyzing small populations. For each zip code, we extracted data on total population, percentage of African Americans in the population, median income, poverty level, and insurance status from the Census Bureau data files.
Local population characteristics at zip code level were mapped to hospitals using hospital service area (HSA) crosswalk files from the Dartmouth Atlas of Health Care.[7, 8] The Dartmouth Atlas defined 3436 HSAs by assigning zip codes to the hospital area where the greatest proportion of its Medicare residents were hospitalized. The number of acute care hospital beds and the number of physicians within the HSA were also obtained from the Dartmouth Atlas. Merging data from these 3 sources generated a dataset that contained information about patient satisfaction scores from a particular hospital, hospital characteristics, and population characteristics of the healthcare market.
Data were summarized as mean and standard deviation (SD). To model the dependence of observations from the same hospital and the correlation between hospitals within the same state due to similar regulations, and to assess the relative contribution of satisfaction scores over time within hospital, hospitals within states, and across states, 3‐level hierarchical regression models were examined.[9, 10] At the within‐hospital level, survey response rate was used as a time‐varying variable in addition to the year of observation. However, only year of observation was used to explore differences in patient satisfaction trajectories between hospitals. At the hospitals‐within‐states level, hospital characteristics and local population characteristics within the HSA were included. At the states level, only random effects were obtained, and no additional variables were included in the models.
Four models were built to assess the relationship between satisfaction scores and predictors. The basic model used only random effects without any predictors to determine the relative contribution of each level (within hospitals, hospitals within states, and across states) to variation in patient satisfaction scores and thus was consistent with the variance component analysis. The first model included the year of observation as a predictor at the within‐hospital level to examine trends in patient satisfaction scores during the observation period. For the second model, we added baseline satisfaction quartiles to the second model, whereas remaining predictors (HSA population, African American percentage in HSA, survey response rate, HSA median income, ownership of hospital, percentage with private any insurance in HSA, acute care hospital beds in HSA, teaching hospital status, and percentage of people living in poverty within HSA) were added in the third model. Quartiles for baseline satisfaction were generated using satisfaction scores from 2007. As a larger number of hospitals reported results for 2008 than for 2007 (2273 vs 3746), we conducted a sensitivity analysis using satisfaction quartiles in 2008 as baseline and examined subsequent trends over time for the 4 models noted above. All multilevel models were specified using the nlme package in R to account for clustering of observations within hospitals and hospitals within states, using hospital and state level random effects.[11]
RESULTS
Of the 4353 hospitals with data for the 7‐year period, the majority were in the Southern region (South = 1669, Midwest = 1239, Northeast = 607, West = 838). Texas had the largest number of hospital (N = 358) followed by California (N = 340). The largest number of hospitals were nonprofit (N = 2637, 60.6%). Mean (SD) patient satisfaction with physician communication was 78.9% (5.7%) in 2007 that increased to 81.7% (5.4%) in 2013. Throughout the observation period, the highest patient satisfaction was in the South (80.6% [6.6%] in 2007 and 83.2% [5.4%] in 2013). Of the 2273 hospitals that reported data in 2007, the mean satisfaction score of the lowest quartile was 72% (3.2%), and the highest quartile was 86.9% (3.2%) (Table 1). As a group, hospitals in the highest quartile in 2007 still had higher satisfaction scores in 2013 than the hospitals in the lowest quartile (85% [4.2%] vs 77% [3.6%], respectively). Only 4 of the 584 hospitals in the lowest quartile in 2007 climbed up to the highest quartile in 2013, whereas 22 hospitals that were in the upper quartile in 2007 dropped to the lowest quartile in 2013.
| Characteristic | Quartiles Based on 2007 Satisfaction Scores | |||
|---|---|---|---|---|
| Highest Quartile | 2nd Quartile | 3rd Quartile | Lowest Quartile | |
| ||||
| Total no. of hospitals, N (%) | 461 (20.3) | 545 (24.0) | 683 (30.0) | 584 (25.7) |
| Hospital ownership, N (%) | ||||
| For profit | 50 (14.4) | 60 (17.3) | 96 (27.7) | 140 (40.5) |
| Nonprofit | 269 (17.4) | 380 (24.6) | 515 (33.4) | 378 (24.5) |
| Government | 142 (36.9) | 105 (27.3) | 72 (18.7) | 66 (17.1) |
| HSA population, in 1,000, median (IQR) | 33.2 (70.5) | 88.5 (186) | 161.8 (374) | 222.2 (534) |
| Racial distribution of HSA population, median (IQR) | ||||
| White, % | 82.6 (26.2) | 82.5 (28.5) | 74.2 (32.9) | 66.8 (35.3) |
| Black, % | 4.3 (21.7) | 3.7 (16.3) | 5.9 (14.8) | 7.4 (12.1) |
| Other, % | 6.4 (7.1) | 8.8 (10.8) | 12.9 (19.8) | 20.0 (33.1) |
| HSA mean median income in $1,000, mean (SD) | 44.6 (11.7) | 52.4 (17.8) | 58.4 (17.1) | 57.5 (15.7) |
| Satisfaction scores (at baseline), mean (SD) | 86.9 (3.1) | 81.4 (1.1) | 77.5 (1.1) | 72.0 (3.2) |
| Satisfaction scores (in 2013), mean (SD) | 85.0 (4.3) | 82.0 (3.4) | 79.7 (3.0) | 77.0 (3.5) |
| Survey response rate (at baseline), mean (SD) | 43.2 (19.8) | 34.5 (9.4) | 32.6 (8.0) | 30.3 (7.8) |
| Survey response rate (20072013), mean (SD) | 32.8 (7.8) | 32.6 (7.5) | 30.8 (6.5) | 29.3 (6.5) |
| Percentage with any insurance in HSA, mean (SD) | 84.0 (5.4) | 84.8 (6.6) | 85.5 (6.3) | 83.9 (6.6) |
| Teaching hospital, N (%) | 42 (9.1) | 155 (28.4) | 277 (40.5) | 274 (46.9%) |
| Acute care hospital beds in HSA (per 1,000), mean (SD) | 3.2 (1.2) | 2.6 (0.8) | 2.5 (0.8) | 2.4 (0.7) |
| Number of physicians in HSA (per 100,000), mean (SD) | 190 (36) | 197 (43) | 204 (47) | 199 (45) |
| Percentage with poverty in HSA, mean (SD)[7] | 16.9 (6.6) | 15.5 (6.5) | 14.4 (5.7) | 15.5 (6.0) |
Using variance component analysis, we found that 23% of the variation in patient satisfaction scores with physician communication was due to differences between states, 52% was due to differences between hospitals within states, and 24% was due to changes over time within a hospital. When examining time trends of satisfaction during the 7‐year period without adjusting for other predictors, we found a statistically significant increasing trend in patient satisfaction with physician communication (0.33% per year; P < 0.001). We also found a significant negative correlation (0.62, P < 0.001) between the random effects for baseline satisfaction (intercept) and change over time (slope), suggesting that initial patient satisfaction with physicians at a hospital was negatively correlated with subsequent change in satisfaction scores during the observation period.
When examining the effect of satisfaction ranking in 2007, hospitals within the lowest quartile of patient satisfaction in 2007 had significantly larger increase in satisfaction scores during the subsequent period as compared to the hospitals in each of the other 3 quartiles (all P < 0.001, Table 2). The difference in the magnitude of the rate of increase in satisfaction scores was greatest between the lowest quartile and the highest quartile (1.10% per year; P < 0.001). In fact, the highest quartile had a statistically significant absolute decrease in patient satisfaction during the observation period (0.23% per year; P < 0.001, Figure 1).
| Variable | Model 1: ; P Value | Model 2: ; P Value | Model 3: ; P Value |
|---|---|---|---|
| |||
| Time (in years) | 0.33; <0.001 | 0.87; <0.001 | 0.89; <0.001 |
| Satisfaction quartiles at baseline | |||
| Highest quartile | 12.1; <0.001 | 10.4; <0.001 | |
| 2nd quartile | 7.9; <0.001 | 7.1; <0.001 | |
| 3rd quartile | 4.5; <0.001 | 4.1; <0.001 | |
| Lowest quartile (REF) | REF | REF | |
| Interaction with time | |||
| Highest quartile | 1.10; <0.001 | 0.94; <0.001 | |
| 2nd quartile | 0.73; <0.001 | 0.71; <0.001 | |
| 3rd quartile | 0.48; <0.001 | 0.47;<0.001 | |
| Survey response rate (%) | 0.12; <0.001 | ||
| Total population, in 10,000 | 0.002; 0.02 | ||
| African American (%) | 0.004; 0.13 | ||
| HSA median Income in $10,000 | 0.02; 0.58 | ||
| Ownership | |||
| Government (REF) | REF | ||
| Nonprofit | 0.01; 0.88 | ||
| For profit | 0.21; 0.11 | ||
| Percentage with insurance in HSA | 0.007; 0.27 | ||
| Acute care beds in HSA (per 1,000) | 0.60; <0.001 | ||
| Physicians in HSA (per 100,000) | 0.003; 0.007 | ||
| Teaching hospital | 0.34; 0.001 | ||
| Percentage in poverty in HSA | 0.01; 0.27 | ||
After adjusting for hospital characteristics and population characteristics of the HSA, the 2007 satisfaction quartiles remained significantly associated with subsequent change in satisfaction scores during the 7‐year observation period (Table 2). In addition, survey response rate, number of physicians, and the number of acute‐care hospital beds within the HSA were positively associated with patient satisfaction, whereas higher HSA population density and being a teaching hospital were negatively associated with patient satisfaction. Using 2008 satisfaction scores as baseline, the results did not change except that the number of physicians in the HSA and being a teaching hospital were no longer associated with satisfaction scores with physicians.
DISCUSSION
Using hierarchical modelling, we have shown that national patient satisfaction scores with physicians have consistently improved since 2007, the year when reporting of satisfaction scores began. We further show that the improvement in satisfaction scores has not been consistent through all hospitals. The largest increase in satisfaction scores was in hospitals that were in the lowest quartile of satisfaction scores in 2007. In contrast, satisfaction scores decreased in hospitals that were in the uppermost quartile of satisfaction scores. The difference between the lowest and uppermost quartile was so large in 2007 that despite the difference in the direction of change in satisfaction scores, hospitals in the uppermost quartile continued to have higher satisfaction scores in 2013 than hospitals in the lowest quartile.
Consistent with our findings for patient satisfaction, other studies have found that public reporting is associated with improvement in healthcare quality measures across nursing homes, physician groups, and hospitals.[12, 13, 14] However, it is unclear how public reporting can change patient satisfaction. The main purpose of public reporting of quality of healthcare measures, such as patient satisfaction with the healthcare they receive, is to generate value by increasing transparency and accountability, thereby increasing the quality of healthcare delivery. Healthcare consumers may also utilize the reported measures to choose providers that deliver high‐quality healthcare. Contrary to expectations, there is very little evidence that consumers choose healthcare facilities based on public reporting, and it is likely that other mechanisms may explain the observed association.[15, 16]
Physicians have historically had low adoption of strategies to improve patient satisfaction and often cite suboptimal data and lack of evidence for data‐driven strategies.[17, 18] Hospitals and healthcare organizations have deployed a broad range of strategies to engage physicians. These include emphasizing relationship between patient satisfaction and patient compliance, complaints and malpractice lawsuits, appealing to physicians' sense of competitiveness by publishing individual provider satisfaction scores, educating physicians on HCAHPS and providing them with regularly updated data, and development of specific techniques for improving patient‐physician interaction.[19, 20, 21, 22, 23, 24] Administrators may also enhance physician engagement by improving physician satisfaction, decreasing their turnover, support development of physicians in administrative leadership roles, and improving financial transparency.[25] Thus, involvement of hospital leadership has been instrumental in encouraging physicians to focus on quality measures including patient satisfaction. Some evidence suggests that public reporting exerts strong influence on hospital leaders for adequate resource allocation, local planning, and improvement efforts.[26, 27, 28]
Perhaps the most intriguing finding in our study is that hospitals in the uppermost quartile of satisfaction scores in 2007 had a statistically significant steady decline in scores during the following period as compared to hospitals in the lowest quartile that had a steady increase. A possible explanation for this finding can be that high‐performing hospitals become complacent and do not invest in developing the effort‐intensive resources required to maintain and improve performance in the physician‐related patient satisfaction domain. These resources may be diverted to competing needs that include addressing improvement efforts for a large number of other publicly reported healthcare quality measures. Thus, an unintended consequence of quality improvement may be that improvement in 1 domain may be at the expense of quality of care in another domain.[29, 30, 31] On the other hand, it is likely that hospitals in the lower quartile see a larger improvement in their scores for the same degree of investment as hospitals in the higher quartiles. It is also likely that hospitals, particularly those in the lowest quartile, develop their individual benchmarks and expend effort that is in line with their perceived need for improvement to achieve their strategic and marketing goals.
Our study has significant implications for the healthcare system, clinical practice, and future research. Whereas public reporting of quality measures is associated with an overall improvement in the reported quality measure, hospitals with high scores may move resources away from that metric or become complacent. Health policy makers need to design policies that encourage all hospitals and providers to perform better or continue to perform well. We further show that differences between hospitals and between local healthcare markets are the biggest factor determining the variation in patient satisfaction with physician communication, and an adjustment in reported score for these factors may be needed. Although local healthcare market factors may not be modifiable, an exchange of knowledge between hospitals with low and high patient satisfaction scores may improve overall satisfaction scores. Similarly, hospitals that are successful in increasing patient satisfaction scores should identify and share useful interventions.
The main strength of our study is that we used data on patient satisfaction with physician communication that were reported annually by most hospitals within the United States. These longitudinal data allowed us to examine not only the effect of public reporting on patient satisfaction with physician communication but also its trend over time. As we had 7 years of data, we were able to eliminate the possibility of regression to mean; an extreme result on first measurement is followed by a second measurement that tends to be closer to the average. Further, we adjusted satisfaction scores based on hospital and local healthcare market characteristics allowing us to compare satisfaction scores across hospitals. However, because units of observation were hospitals and not patients, we could not examine the effect of patient characteristics on satisfaction scores. In addition, HCAHPS surveys have low response rates and may have response and selection bias. Furthermore, we were unable to examine the strategies implemented by hospitals to improve satisfaction scores or the effect of such strategies on satisfaction scores. Data on hospital strategies to increase satisfaction scores are not available for most hospitals and could not have been included in the study.
In summary, we have found that public reporting was followed by an improvement in patient satisfaction scores with physician communication between 2007 and 2013. The rate of improvement was significantly greater in hospitals that had satisfaction scores in the lowest quartiles, whereas hospitals in the highest quartile had a small but statistically significant decline in patient satisfaction scores.
- Centers for Medicare Medicaid Services. Medicare program; hospital outpatient prospective payment system and CY 2007 payment rates; CY 2007 update to the ambulatory surgical center covered procedures list; Medicare administrative contractors; and reporting hospital quality data for FY 2008 inpatient prospective payment system annual payment update program‐‐HCAHPS survey, SCIP, and mortality. Final rule with comment period and final rule. Fed Regist. 2006;71(226):67959–68401.
- , , , , . Development, implementation, and public reporting of the HCAHPS survey. Med Care Res Rev. 2010;67(1):27–37.
- , , , . Comparison of Hospital Consumer Assessment of Healthcare Providers and Systems patient satisfaction scores for specialty hospitals and general medical hospitals: confounding effect of survey response rate. J Hosp Med. 2014;9(9):590–593.
- , , , et al. Hospital survey shows improvements in patient experience. Health Aff (Millwood). 2010;29(11):2061–2067.
- Centers for Medicare 2010:496829.
- , , , , , . The normal liver harbors the vitamin D nuclear receptor in nonparenchymal and biliary epithelial cells. Hepatology. 2003;37(5):1034–1042.
- , . Applied Longitudinal Data Analysis: Modeling Change and Event Occurrence. Oxford, United Kingdom: Oxford University Press; 2003.
- , . Data Analysis Using Regression and Multilevel/Hierarchical Models. Cambridge, United Kingdom: Cambridge University Press; 2007.
- nlme: Linear and Nonlinear Mixed Effects Models [computer program]. Version R package version 2015;3:1–121.
- , , , . Public reporting helped drive quality improvement in outpatient diabetes care among Wisconsin physician groups. Health Aff (Millwood). 2012;31(3):570–577.
- , , , , , . Governing healthcare through performance measurement in Massachusetts and the Netherlands. Health Policy. 2014;116(1):18–26.
- , , . Public reporting drove quality gains at nursing homes. Health Aff (Millwood). 2010;29(9):1706–1713.
- , , . Users of public reports of hospital quality: who, what, why, and how?: An aggregate analysis of 16 online public reporting Web sites and users' and experts' suggestions for improvement. Agency for Healthcare Research and Quality. Available at: http://archive.ahrq.gov/professionals/quality‐patient‐safety/quality‐resources/value/pubreportusers/index.html. Updated December 2011. Accessed April 2, 2015.
- Kaiser Family Foundation. 2008 update on consumers' views of patient safety and quality information. Available at: http://kff.org/health‐reform/poll‐finding/2008‐update‐on‐consumers‐views‐of‐patient‐2/. Published September 30, 2008. Accessed April 2, 2015.
- , . A report card on continuous quality improvement. Milbank Q. 1998;76(4):625–648, 511.
- , , . Assessing the impact of continuous quality improvement on clinical practice: what it will take to accelerate progress. Milbank Q. 1998;76(4):593–624, 510.
- , . Health care competition, strategic mission, and patient satisfaction: research model and propositions. J Health Organ Manag. 2008;22(6):627–641.
- , , . The effects of physician empathy on patient satisfaction and compliance. Eval Health Prof. 2004;27(3):237–251.
- , , , , . Association between vitamin D and hepatitis C virus infection: a meta‐analysis. World J Gastroenterol. 2013;19(35):5917–5924.
- , , , . The relation of patient satisfaction with complaints against physicians and malpractice lawsuits. Am J Med. 2005;118(10):1126–1133.
- , , , , , . Relation of patients' experiences with individual physicians to malpractice risk. Int J Qual Health Care. 2008;20(1):5–12.
- , , , . Association of patient satisfaction with complaints and risk management among emergency physicians. J Emerg Med. 2011;41(4):405–411.
- , , , , . Secrets of physician satisfaction. Study identifies pressure points and reveals life practices of highly satisfied doctors. Physician Exec. 2006;32(6):30–39.
- , , , et al. Attitudes of hospital leaders toward publicly reported measures of health care quality. JAMA Intern Med. 2014;174(12):1904–1911.
- , , , , , . Closing the quality gap: revisiting the state of the science (vol. 5: public reporting as a quality improvement strategy). Evid Rep Technol Assess (Full Rep). 2012(208.5):1–645.
- , , , , . Systematic review: the evidence that publishing patient care performance data improves quality of care. Ann Intern Med. 2008;148(2):111–123.
- , . The unintended consequences of quality improvement. Curr Opin Pediatr. 2009;21(6):777–782.
- , , , et al. Unintended consequences of implementing a national performance measurement system into local practice. J Gen Intern Med. 2012;27(4):405–412.
- , . Quality assessment by external bodies: intended and unintended impact on healthcare delivery. Curr Opin Anaesthesiol. 2009;22(2):237–241.
© 2015 Society of Hospital Medicine
