User login
A STEEEP Hill to Climb: A Scoping Review of Assessments of Individual Hospitalist Performance
Healthcare quality is defined as the extent to which healthcare services result in desired outcomes.1 Quality of care depends on how the healthcare system’s various components, including healthcare practitioners, interact to meet each patient’s needs.2 These components can be shaped to achieve desired outcomes through rules, incentives, and other approaches, but influencing the behaviors of each component, such as the performance of hospitalists, requires defining goals for performance and implementing measurement approaches to assess progress toward these goals.
One set of principles to define goals for quality and guide assessment of desired behaviors is the multidimensional STEEEP framework. This framework, created by the Institute of Medicine, identifies six domains of quality: Safe, Timely, Effective, Efficient, Equitable, and Patient Centered.2 Briefly, “Safe” means avoiding injuries to patients, “Timely” means reducing waits and delays in care, “Effective” means providing care based on evidence, “Efficient” means avoiding waste, “Equitable” means ensuring quality does not vary based on personal characteristics such as race and gender, and “Patient Centered” means providing care that is responsive to patients’ values and preferences. The STEEEP domains are not coequal; rather, they ensure that quality is considered broadly, while avoiding errors such as measuring only an intervention’s impact on effectiveness but not assessing its impact on multiple domains of quality, such as how patient centered, efficient (cost effective), or equitable the resulting care is.
Based on our review of the literature, a multidimensional framework like STEEEP has not been used in defining and assessing the quality of individual hospitalists’ performance. Some quality metrics at the hospital level impact several dimensions simultaneously, such as door to balloon time for acute myocardial infarction, which measures effectiveness and timeliness of care. Programs like pay-for-performance, Hospital Consumer Assessment of Healthcare Providers and Systems (HCAHPS), and the Merit-Based Incentive Payment System (MIPS) have tied reimbursement to assessments aligned with several STEEEP domains at both individual and institutional levels but lack a holistic approach to quality.3-6 The every-other-year State of Hospital Medicine Report, the most widely used description of individual hospitalist performance, reports group-level performance including relative value units and whether groups are accountable for measures of quality such as performance on core measures, timely documentation, and “citizenship” (eg, committee participation or academic work).7 While these are useful benchmarks, the report focuses on performance at the group level. Concurrently, several academic groups have described more complete dashboards or scorecards to assess individual hospitalist performance, primarily designed to facilitate comparison across hospitalist groups or to incentivize overall group performance.8-10 However, these efforts are not guided by an overarching framework and are structured after traditional academic models with components related to teaching and scholarship, which may not translate to nonacademic environments. Finally, the Core Competencies for Hospital Medicine outlines some goals for hospitalist performance but does not speak to specific measurement approaches.11
Overall, assessing individual hospitalist performance is hindered by lack of consensus on important concepts to measure, a limited number of valid measures, and challenges in data collection such as resource limitations and feasibility. Developing and refining measures grounded in the STEEEP framework may provide a more comprehensive assessment of hospitalist quality and identify approaches to improve overall health outcomes. Comparative data could help individual hospitalists improve performance; leaders of hospitalist groups could use this data to guide faculty development and advancement as they ensure quality care at the individual, group, and system levels.
To better inform quality measurement of individual hospitalists, we sought to identify existing publications on individual hospitalist quality. Our goal was to define the published literature about quality measurement at the individual hospitalist level, relate these publications to domains of quality defined by the STEEEP framework, and identify directions for assessment or further research that could affect the overall quality of care.
METHODS
We conducted a scoping review following methods outlined by Arksey and O’Malley12 and Tricco.13 The goal of a scoping review is to map the extent of research within a specific field. This methodology is well suited to characterizing the existing research related to the quality of hospitalist care at the individual level. A protocol for the scoping review was not registered.
Evidence Search
A systematic search for published, English-language literature on hospitalist care was conducted in Medline (Ovid; 1946 - June 4, 2019) on June 5, 2019. The search used a combination of keywords and controlled vocabulary for the concept of hospitalists or hospital medicine. The search strategy used in this review is described in the Appendix. In addition, a hand search of reference lists of articles was used to discover publications not identified in the database searches.
Study Selection
All references were uploaded to Covidence systematic review software (www.covidence.org; Covidence), and duplicates were removed. Four reviewers (A.D., B.C., L.H., R.Q.) conducted title and abstract, as well as full-text, review to identify studies that measured differences in the performance of hospitalists at the individual level. Any disagreements among reviewers were resolved by consensus. Articles included both adult and pediatric populations. Articles that focused on group-level outcomes could be included if nonpooled data at the individual level was also reported. Studies were excluded if they did not focus on individual quality of care indicators or were not published in English.
Data Charting and Synthesis
We extracted the following information using a standardized data collection form: author, title, year of publication, study design, intervention, and outcome measures. Original manuscripts were accessed as needed to supplement analysis. Critical appraisal of individual studies was not conducted in this review because the goal of this review was to analyze which quality indicators have been studied and how they were measured. Articles were then coded for their alignment to the STEEEP framework by two reviewers (AD and BC). After initial coding was conducted, the reviewers met to consolidate codes and resolve any disagreement by consensus. The results of the analysis were summarized in both text and tabular format with studies grouped by focus of assessment with each one’s methods of assessment listed.
RESULTS
Results of the search strategy are shown in the Figure. The search retrieved a total of 2,363 references of which 113 were duplicates, leaving 2,250 to be screened. After title and abstract and full-text screening, 42 studies were included in the review. The final 42 studies were coded for alignment with the STEEEP framework. The Table displays the focus of assessment and methods of assessment within each STEEEP domain.

Eighteen studies were coded into a single domain while the rest were coded into at least two domains. The domain Patient Centered was coded as having the most studies (n = 23), followed by the domain of Safe (n = 15). Timely, Effective, and Efficient domains had 11, 9, and 12 studies, respectively. No studies were coded into the domain of Equitable.

Safe
Nearly all studies coded into the Safe domain focused on transitions of care. These included transfers into a hospital from other hospitals,14 transitions of care to cross-covering providers15,16 and new primary providers,17 and transition out from the acute care setting.18-28 Measures of hospital discharge included measures of both processes18-22 and outcomes.23-27 Methods of assessment varied from use of trained observers or scorers to surveys of individuals and colleagues about performance. Though a few leveraged informatics,22,27 all approaches relied on human interaction, and none were automated.

Timely
All studies coded into the Timely domain were coded into at least one other domain. For example, Anderson et al looked at how hospitalists communicated about potential life-limiting illness at the time of hospital admission and the subsequent effects on plans of care29; this was coded as both Timely and Patient Centered. Likewise, another group of studies centered on application of evidence-based guidelines, such as giving antibiotics within a certain time interval for sepsis and were coded as both Timely and Effective. Another set of authors described dashboards or scorecards that captured a number of group-level metrics of processes of care that span STEEEP domains and may be applicable to individuals, including Fox et al for pediatrics8 and Hwa et al for an adult academic hospitalist group.9 Methods of assessment varied widely across studies and included observations in the clinical environment,28,30,31 performance in simulations,32 and surveys about performance.22-26 A handful of approaches were more automated and made use of informatics8,9,22 or data collected for other health system purposes.8,9
Effective
Effectiveness was most often assessed through adherence to consensus and evidence-based guidelines. Examples included processes of care related to sepsis, venous thromboembolism prophylaxis, COPD, heart failure, pediatric asthma, and antibiotic appropriateness.8,9,23,32-36 Through the review, multiple other studies that included group-level measures of effectiveness for a variety of health conditions were excluded because data on individual-level variation were not reported. Methods of assessment included expert review of cases or discharge summaries, compliance with core measures, performance in simulation, and self-assessment on practice behaviors. Other than those efforts aligned with institutional data collection, most approaches were resource intensive.
Efficient
As with those in the Timely domain, most studies coded into the Efficient domain were coded into at least one other domain. One exception measured unnecessary daily lab work and both showed provider-level variation and demonstrated improvement in quality based on an intervention.37 Another paper coded into the Effective domain evaluated adherence to components of the Choosing Wisely® recommendations.34 In addition to these two studies focusing on cost efficacy, other studies coded to this domain assessed concepts such as ensuring more efficient care from other providers by optimizing transitions of care15-17 and clarifying patients’ goals for care.38 Although integrating insurer information into care plans is emphasized in the Core Competencies of Hospital Medicine,11 this concept was not represented in any of the identified articles. Methods of assessment varied and mostly relied on observation of behaviors or survey of providers. Several approaches were more automated or used Medicare claims data to assess the efficiency of individual providers relative to peers.34,37,39
Equitable
Among the studies reviewed, none were coded into the Equitable domain despite care of vulnerable populations being identified as a core competency of hospital medicine.40
Patient Centered
Studies coded to the Patient Centered domain assessed hospitalist performance through ratings of patient satisfaction,8,9,41-44 rating of communication between hospitalists and patients,19-21,29,45-51 identification of patient preferences,38,52 outcomes of patient-centered care activities,27,28 and peer ratings.53,54 Authors applied several theoretical constructs to these assessments including shared decision-making,50 etiquette-based medicine,47,48 empathetic responsiveness,45 agreement about the goals of care between the patient and healthcare team members,52 and lapses in professionalism.53 Studies often crossed STEEEP domains, such as those assessing quality of discharge information provided to patients, which were coded as both Safe and Patient Centered.19-21 In addition to coded or observed performance in the clinical setting, studies in this domain also used patient ratings as a method of assessment.8,9,28,41-44,49,50 Only a few of these approaches aligned with existing performance measures of health systems and were more automated.8,9
DISCUSSION
This scoping review of performance data for individual hospitalists coded to the STEEEP framework identified robust areas in the published literature, as well as opportunities to develop new approaches or refine existing measures. Transitions of care, both intrahospital and at discharge, and adherence to evidence-based guidelines are areas for which current research has created a foundation for care that is Safe, Timely, Effective, and Efficient. The Patient Centered domain also has several measures described, though the conceptual underpinnings are heterogeneous, and consensus appears necessary to compare performance across groups. No studies were coded to the Equitable domain. Across domains, approaches to measurement varied in resource intensity from simple ones, like integrating existing data collected by hospitals, to more complex ones, like shadowing physicians or coding interactions.
Methods of assessment coded into the Safe domain focused on communication and, less so, patient outcomes around transitions of care. Transitions of care that were evaluated included transfer of patients into a new facility, sign-out to new physicians for both cross-cover responsibilities and for newly assuming the role of primary attending, and discharge from the hospital. Most measures rated the quality of communication, although several23-27 examined patient outcomes. Approaches that survey individuals downstream from a transition of care15,17,24-26 may be the simplest and most feasible approach to implement in the future but, as described to date, do not include all transitions of care and may miss patient outcomes. Important core competencies for hospital medicine under the Safe domain that were not identified in this review include areas such as diagnostic error, hospital-acquired infections, error reporting, and medication safety.11 These are potential areas for future measure development.
The assessments in many studies were coded across more than one domain; for example, measures of the application of evidence-based guidelines were coded into domains of Effective, Timely, Efficient, and others. Applying the six domains of the STEEEP framework revealed the multidimensional outcomes of hospitalist work and could guide more meaningful quality assessments of individual hospitalist performance. For example, assessing adherence to evidence-based guidelines, as well as consideration of the Core Competencies of Hospital Medicine and recommendations of the Choosing Wisely® campaign, are promising areas for measurement and may align with existing hospital metrics. Notably, several reviewed studies measured group-level adherence to guidelines but were excluded because they did not examine variation at the individual level. Future measures based on evidence-based guidelines could center on the Effective domain while also integrating assessment of domains such as Efficient, Timely, and Patient Centered and, in so doing, provide a richer assessment of the diverse aspects of quality.
Several other approaches in the domains of Timely, Effective, and Efficient were described only in a few studies yet deserve consideration for further development. Two time-motion studies30,31 were coded into the domains of Timely and Efficient and would be cumbersome in regular practice but, with advances in wearable technology and electronic health records, could become more feasible in the future. Another approach used Medicare payment data to detect provider-level variation.39 Potentially, “big data” could be analyzed in other ways to compare the performance of individual hospitalists.
The lack of studies coded into the Equitable domain may seem surprising, but the Institute for Healthcare Improvement identifies Equitable as the “forgotten aim” of the STEEEP framework. This organization has developed a guide for health care organizations to promote equitable care.55 While this guide focuses mostly on organizational-level actions, some are focused on individual providers, such as training in implicit bias. Future research should seek to identify disparities in care by individual providers and develop interventions to address any discovered gaps.
The “Patient Centered” domain was the most frequently coded and had the most heterogeneous underpinnings for assessment. Studies varied widely in terminology and conceptual foundations. The field would benefit from future work to identify how “Patient Centered” care might be more clearly conceptualized, guided by comparative studies among different assessment approaches to define those most valid and feasible.
The overarching goal for measuring individual hospitalist quality should be to improve the delivery of patient care in a supportive and formative way. To further this goal, adding or expanding on metrics identified in this article may provide a more complete description of performance. As a future direction, groups should consider partnering with one another to define measurement approaches, collaborate with existing data sources, and even share deidentified individual data to establish performance benchmarks at the individual and group levels.
While this study used broad search terms to support completeness, the search process could have missed important studies. Grey literature, non–English language studies, and industry reports were not included in this review. Groups may also be using other assessments of individual hospitalist performance that are not published in the peer-reviewed literature. Coding of study assessments was achieved through consensus reconciliation; other coders might have classified studies differently.
CONCLUSION
This scoping review describes the peer-reviewed literature of individual hospitalist performance and is the first to link it to the STEEEP quality framework. Assessments of transitions of care, evidence-based care, and cost-effective care are exemplars in the published literature. Patient-centered care is well studied but assessed in a heterogeneous fashion. Assessments of equity in care are notably absent. The STEEEP framework provides a model to structure assessment of individual performance. Future research should build on this framework to define meaningful assessment approaches that are actionable and improve the welfare of our patients and our system.
Disclosures
The authors have nothing to disclose.
1. Quality of Care: A Process for Making Strategic Choices in Health Systems. World Health Organization; 2006.
2. Institute of Medicine (US) Committee on Quality of Health Care in America. Crossing the Quality Chasm: A New Health System for the 21st Century. National Academies Press; 2001. Accessed December 20, 2019. http://www.ncbi.nlm.nih.gov/books/NBK222274/
3. Wadhera RK, Joynt Maddox KE, Wasfy JH, Haneuse S, Shen C, Yeh RW. Association of the hospital readmissions reduction program with mortality among Medicare beneficiaries hospitalized for heart failure, acute myocardial infarction, and pneumonia. JAMA. 2018;320(24):2542-2552. https://doi.org/10.1001/jama.2018.19232
4. Kondo KK, Damberg CL, Mendelson A, et al. Implementation processes and pay for performance in healthcare: a systematic review. J Gen Intern Med. 2016;31(Suppl 1):61-69. https://doi.org/10.1007/s11606-015-3567-0
5. Fung CH, Lim Y-W, Mattke S, Damberg C, Shekelle PG. Systematic review: the evidence that publishing patient care performance data improves quality of care. Ann Intern Med. 2008;148(2):111-123. https://doi.org/10.7326/0003-4819-148-2-200801150-00006
6. Jha AK, Orav EJ, Epstein AM. Public reporting of discharge planning and rates of readmissions. N Engl J Med. 2009;361(27):2637-2645. https://doi.org/10.1056/NEJMsa0904859
7. Society of Hospital Medicine. State of Hospital Medicine Report; 2018. Accessed December 20, 2019. https://www.hospitalmedicine.org/practice-management/shms-state-of-hospital-medicine/
8. Hwa M, Sharpe BA, Wachter RM. Development and implementation of a balanced scorecard in an academic hospitalist group. J Hosp Med. 2013;8(3):148-153. https://doi.org/10.1002/jhm.2006
9. Fox LA, Walsh KE, Schainker EG. The creation of a pediatric hospital medicine dashboard: performance assessment for improvement. Hosp Pediatr. 2016;6(7):412-419. https://doi.org/10.1542/hpeds.2015-0222
10. Hain PD, Daru J, Robbins E, et al. A proposed dashboard for pediatric hospital medicine groups. Hosp Pediatr. 2012;2(2):59-68. https://doi.org/10.1542/hpeds.2012-0004
11. Nichani S, Crocker J, Fitterman N, Lukela M. Updating the core competencies in hospital medicine--2017 revision: introduction and methodology. J Hosp Med. 2017;12(4):283-287. https://doi.org/10.12788/jhm.2715
12. Arksey H, O’Malley L. Scoping studies: towards a methodological framework. Int J Soc Res Methodol. 2005;8:19-32. https://doi.org/10.1080/1364557032000119616
13. Tricco AC, Lillie E, Zarin W, et al. PRISMA extension for scoping reviews (PRISMA-ScR): checklist and explanation. Ann Intern Med. 2018;169(7):467-473. https://doi.org/10.7326/m18-0850
14. Borofsky JS, Bartsch JC, Howard AB, Repp AB. Quality of interhospital transfer communication practices and association with adverse events on an internal medicine hospitalist service. J Healthc Qual. 2017;39(3):177-185. https://doi.org/10.1097/01.JHQ.0000462682.32512.ad
15. Fogerty RL, Schoenfeld A, Salim Al-Damluji M, Horwitz LI. Effectiveness of written hospitalist sign-outs in answering overnight inquiries. J Hosp Med. 2013;8(11):609-614. https://doi.org10.1002/jhm.2090
16. Miller DM, Schapira MM, Visotcky AM, et al. Changes in written sign-out composition across hospitalization. J Hosp Med. 2015;10(8):534-536. https://doi.org/10.1002/jhm.2390
17. Hinami K, Farnan JM, Meltzer DO, Arora VM. Understanding communication during hospitalist service changes: a mixed methods study. J Hosp Med. 2009;4(9):535-540. https://doi.org/10.1002/jhm.523
18. Horwitz LI, Jenq GY, Brewster UC, et al. Comprehensive quality of discharge summaries at an academic medical center. J Hosp Med. 2013;8(8):436-443. https://doi.org10.1002/jhm.2021
19. Sarzynski E, Hashmi H, Subramanian J, et al. Opportunities to improve clinical summaries for patients at hospital discharge. BMJ Qual Saf. 2017;26(5):372-380. https://doi.org/10.1136/bmjqs-2015-005201
20. Unaka NI, Statile A, Haney J, Beck AF, Brady PW, Jerardi KE. Assessment of readability, understandability, and completeness of pediatric hospital medicine discharge instructions. J Hosp Med. 2017;12(2):98-101. https://doi.org/10.12788/jhm.2688
21. Unaka N, Statile A, Jerardi K, et al. Improving the readability of pediatric hospital medicine discharge instructions. J Hosp Med. 2017;12(7):551-557. https://doi.org/10.12788/jhm.2770
22. Zackoff MW, Graham C, Warrick D, et al. Increasing PCP and hospital medicine physician verbal communication during hospital admissions. Hosp Pediatr. 2018;8(4):220-226. https://doi.org/10.1542/hpeds.2017-0119
23. Salata BM, Sterling MR, Beecy AN, et al. Discharge processes and 30-day readmission rates of patients hospitalized for heart failure on general medicine and cardiology services. Am J Cardiol. 2018;121(9):1076-1080. https://doi.org/10.1016/j.amjcard.2018.01.027
24. Arora VM, Prochaska ML, Farnan JM, et al. Problems after discharge and understanding of communication with their primary care physicians among hospitalized seniors: a mixed methods study. J Hosp Med. 2010;5(7):385-391. https://doi.org/10.1002/jhm.668
25. Bell CM, Schnipper JL, Auerbach AD, et al. Association of communication between hospital-based physicians and primary care providers with patient outcomes. J Gen Intern Med. 2009;24(3):381-386. https://doi.org/10.1007/s11606-008-0882-8
26. Clark B, Baron K, Tynan-McKiernan K, Britton M, Minges K, Chaudhry S. Perspectives of clinicians at skilled nursing facilities on 30-day hospital readmissions: a qualitative study. J Hosp Med. 2017;12(8):632-638. https://doi.org/10.12788/jhm.2785
27. Harris CM, Sridharan A, Landis R, Howell E, Wright S. What happens to the medication regimens of older adults during and after an acute hospitalization? J Patient Saf. 2013;9(3):150-153. https://doi.org/10.1097/PTS.0b013e318286f87d
28. Harrison JD, Greysen RS, Jacolbia R, Nguyen A, Auerbach AD. Not ready, not set...discharge: patient-reported barriers to discharge readiness at an academic medical center. J Hosp Med. 2016;11(9):610-614. https://doi.org/10.1002/jhm.2591
29. Anderson WG, Kools S, Lyndon A. Dancing around death: hospitalist-patient communication about serious illness. Qual Health Res. 2013;23(1):3-13. https://doi.org/10.1177/1049732312461728
30. Tipping MD, Forth VE, Magill DB, Englert K, Williams MV. Systematic review of time studies evaluating physicians in the hospital setting. J Hosp Med. 2010;5(6):353-359. https://doi.org/10.1002/jhm.647
31. Tipping MD, Forth VE, O’Leary KJ, et al. Where did the day go?--a time-motion study of hospitalists. J Hosp Med. 2010;5(6):323-328. https://doi.org/10.1002/jhm.790
32. Bergmann S, Tran M, Robison K, et al. Standardising hospitalist practice in sepsis and COPD care. BMJ Qual Saf. 2019;28(10):800-808. https://doi.org/10.1136/bmjqs-2018-008829
33. Kisuule F, Wright S, Barreto J, Zenilman J. Improving antibiotic utilization among hospitalists: a pilot academic detailing project with a public health approach. J Hosp Med. 2008;3(1):64-70. https://doi.org/10.1002/jhm.278
34. Reyes M, Paulus E, Hronek C, et al. Choosing Wisely campaign: report card and achievable benchmarks of care for children’s hospitals. Hosp Pediatr. 2017;7(11):633-641. https://doi.org/10.1542/hpeds.2017-0029
35. Landrigan CP, Conway PH, Stucky ER, et al. Variation in pediatric hospitalists’ use of proven and unproven therapies: a study from the Pediatric Research in Inpatient Settings (PRIS) network. J Hosp Med. 2008;3(4):292-298. https://doi.org/10.1002/jhm.347
36. Michtalik HJ, Carolan HT, Haut ER, et al. Use of provider-level dashboards and pay-for-performance in venous thromboprophylaxis. J Hosp Med. 2015;10(3):172-178. https://doi.org/10.1002/jhm.2303
37. Johnson DP, Lind C, Parker SE, et al. Toward high-value care: a quality improvement initiative to reduce unnecessary repeat complete blood counts and basic metabolic panels on a pediatric hospitalist service. Hosp Pediatr. 2016;6(1):1-8. https://doi.org/10.1542/hpeds.2015-0099
38. Auerbach AD, Katz R, Pantilat SZ, et al. Factors associated with discussion of care plans and code status at the time of hospital admission: results from the Multicenter Hospitalist Study. J Hosp Med. 2008;3(6):437-445. https://doi.org/10.1002/jhm.369
39. Tsugawa Y, Jha AK, Newhouse JP, Zaslavsky AM, Jena AB. Variation in physician spending and association with patient outcomes. JAMA Intern Med. 2017;177(5):675-682. https://doi.org/10.1001/jamainternmed.2017.0059
40. Nichani S, Fitterman N, Lukela M, Crocker J. Equitable allocation of resources. 2017 hospital medicine revised core competencies. J Hosp Med. 2017;12(4):S62. https://doi.org/10.12788/jhm.3016
41. Blanden AR, Rohr RE. Cognitive interview techniques reveal specific behaviors and issues that could affect patient satisfaction relative to hospitalists. J Hosp Med. 2009;4(9):E1-E6. https://doi.org/10.1002/jhm.524
42. Torok H, Ghazarian SR, Kotwal S, Landis R, Wright S, Howell E. Development and validation of the tool to assess inpatient satisfaction with care from hospitalists. J Hosp Med. 2014;9(9):553-558. https://doi.org/10.1002/jhm.2220
43. Torok H, Kotwal S, Landis R, Ozumba U, Howell E, Wright S. Providing feedback on clinical performance to hospitalists: Experience using a new metric tool to assess inpatient satisfaction with care from hospitalists. J Contin Educ Health Prof. 2016;36(1):61-68. https://doi.org/10.1097/CEH.0000000000000060
44. Indovina K, Keniston A, Reid M, et al. Real-time patient experience surveys of hospitalized medical patients. J Hosp Med. 2016;11(4):251-256. https://doi.org/10.1002/jhm.2533
45. Weiss R, Vittinghoff E, Fang MC, et al. Associations of physician empathy with patient anxiety and ratings of communication in hospital admission encounters. J Hosp Med. 2017;12(10):805-810. https://doi.org/10.12788/jhm.2828
46. Apker J, Baker M, Shank S, Hatten K, VanSweden S. Optimizing hospitalist-patient communication: an observation study of medical encounter quality. Jt Comm J Qual Patient Saf. 2018;44(4):196-203. https://doi.org/10.1016/j.jcjq.2017.08.011
47. Kotwal S, Torok H, Khaliq W, Landis R, Howell E, Wright S. Comportment and communication patterns among hospitalist physicians: insight gleaned through observation. South Med J. 2015;108(8):496-501. https://doi.org/10.14423/SMJ.0000000000000328
48. Tackett S, Tad-y D, Rios R, Kisuule F, Wright S. Appraising the practice of etiquette-based medicine in the inpatient setting. J Gen Intern Med. 2013;28(7):908-913. https://doi.org/10.1007/s11606-012-2328-6
49. Ferranti DE, Makoul G, Forth VE, Rauworth J, Lee J, Williams MV. Assessing patient perceptions of hospitalist communication skills using the Communication Assessment Tool (CAT). J Hosp Med. 2010;5(9):522-527. https://doi.org/10.1002/jhm.787
50. Blankenburg R, Hilton JF, Yuan P, et al. Shared decision-making during inpatient rounds: opportunities for improvement in patient engagement and communication. J Hosp Med. 2018;13(7):453-461. https://doi.org/10.12788/jhm.2909
51. Chang D, Mann M, Sommer T, Fallar R, Weinberg A, Friedman E. Using standardized patients to assess hospitalist communication skills. J Hosp Med. 2017;12(7):562-566. https://doi.org/10.12788/jhm.2772
52. Figueroa JF, Schnipper JL, McNally K, Stade D, Lipsitz SR, Dalal AK. How often are hospitalized patients and providers on the same page with regard to the patient’s primary recovery goal for hospitalization? J Hosp Med. 2016;11(9):615-619. https://doi.org/10.1002/jhm.2569
53. Reddy ST, Iwaz JA, Didwania AK, et al. Participation in unprofessional behaviors among hospitalists: a multicenter study. J Hosp Med. 2012;7(7):543-550. https://doi.org/10.1002/jhm.1946
54. Bhogal HK, Howe E, Torok H, Knight AM, Howell E, Wright S. Peer assessment of professional performance by hospitalist physicians. South Med J. 2012;105(5):254-258. https://doi.org/10.1097/SMJ.0b013e318252d602
55. Wyatt R, Laderman M, Botwinick L, Mate K, Whittington J. Achieving health equity: a guide for health care organizations. IHI White Paper. Institute for Healthcare Improvement; 2016. https://www.ihi.org
Healthcare quality is defined as the extent to which healthcare services result in desired outcomes.1 Quality of care depends on how the healthcare system’s various components, including healthcare practitioners, interact to meet each patient’s needs.2 These components can be shaped to achieve desired outcomes through rules, incentives, and other approaches, but influencing the behaviors of each component, such as the performance of hospitalists, requires defining goals for performance and implementing measurement approaches to assess progress toward these goals.
One set of principles to define goals for quality and guide assessment of desired behaviors is the multidimensional STEEEP framework. This framework, created by the Institute of Medicine, identifies six domains of quality: Safe, Timely, Effective, Efficient, Equitable, and Patient Centered.2 Briefly, “Safe” means avoiding injuries to patients, “Timely” means reducing waits and delays in care, “Effective” means providing care based on evidence, “Efficient” means avoiding waste, “Equitable” means ensuring quality does not vary based on personal characteristics such as race and gender, and “Patient Centered” means providing care that is responsive to patients’ values and preferences. The STEEEP domains are not coequal; rather, they ensure that quality is considered broadly, while avoiding errors such as measuring only an intervention’s impact on effectiveness but not assessing its impact on multiple domains of quality, such as how patient centered, efficient (cost effective), or equitable the resulting care is.
Based on our review of the literature, a multidimensional framework like STEEEP has not been used in defining and assessing the quality of individual hospitalists’ performance. Some quality metrics at the hospital level impact several dimensions simultaneously, such as door to balloon time for acute myocardial infarction, which measures effectiveness and timeliness of care. Programs like pay-for-performance, Hospital Consumer Assessment of Healthcare Providers and Systems (HCAHPS), and the Merit-Based Incentive Payment System (MIPS) have tied reimbursement to assessments aligned with several STEEEP domains at both individual and institutional levels but lack a holistic approach to quality.3-6 The every-other-year State of Hospital Medicine Report, the most widely used description of individual hospitalist performance, reports group-level performance including relative value units and whether groups are accountable for measures of quality such as performance on core measures, timely documentation, and “citizenship” (eg, committee participation or academic work).7 While these are useful benchmarks, the report focuses on performance at the group level. Concurrently, several academic groups have described more complete dashboards or scorecards to assess individual hospitalist performance, primarily designed to facilitate comparison across hospitalist groups or to incentivize overall group performance.8-10 However, these efforts are not guided by an overarching framework and are structured after traditional academic models with components related to teaching and scholarship, which may not translate to nonacademic environments. Finally, the Core Competencies for Hospital Medicine outlines some goals for hospitalist performance but does not speak to specific measurement approaches.11
Overall, assessing individual hospitalist performance is hindered by lack of consensus on important concepts to measure, a limited number of valid measures, and challenges in data collection such as resource limitations and feasibility. Developing and refining measures grounded in the STEEEP framework may provide a more comprehensive assessment of hospitalist quality and identify approaches to improve overall health outcomes. Comparative data could help individual hospitalists improve performance; leaders of hospitalist groups could use this data to guide faculty development and advancement as they ensure quality care at the individual, group, and system levels.
To better inform quality measurement of individual hospitalists, we sought to identify existing publications on individual hospitalist quality. Our goal was to define the published literature about quality measurement at the individual hospitalist level, relate these publications to domains of quality defined by the STEEEP framework, and identify directions for assessment or further research that could affect the overall quality of care.
METHODS
We conducted a scoping review following methods outlined by Arksey and O’Malley12 and Tricco.13 The goal of a scoping review is to map the extent of research within a specific field. This methodology is well suited to characterizing the existing research related to the quality of hospitalist care at the individual level. A protocol for the scoping review was not registered.
Evidence Search
A systematic search for published, English-language literature on hospitalist care was conducted in Medline (Ovid; 1946 - June 4, 2019) on June 5, 2019. The search used a combination of keywords and controlled vocabulary for the concept of hospitalists or hospital medicine. The search strategy used in this review is described in the Appendix. In addition, a hand search of reference lists of articles was used to discover publications not identified in the database searches.
Study Selection
All references were uploaded to Covidence systematic review software (www.covidence.org; Covidence), and duplicates were removed. Four reviewers (A.D., B.C., L.H., R.Q.) conducted title and abstract, as well as full-text, review to identify studies that measured differences in the performance of hospitalists at the individual level. Any disagreements among reviewers were resolved by consensus. Articles included both adult and pediatric populations. Articles that focused on group-level outcomes could be included if nonpooled data at the individual level was also reported. Studies were excluded if they did not focus on individual quality of care indicators or were not published in English.
Data Charting and Synthesis
We extracted the following information using a standardized data collection form: author, title, year of publication, study design, intervention, and outcome measures. Original manuscripts were accessed as needed to supplement analysis. Critical appraisal of individual studies was not conducted in this review because the goal of this review was to analyze which quality indicators have been studied and how they were measured. Articles were then coded for their alignment to the STEEEP framework by two reviewers (AD and BC). After initial coding was conducted, the reviewers met to consolidate codes and resolve any disagreement by consensus. The results of the analysis were summarized in both text and tabular format with studies grouped by focus of assessment with each one’s methods of assessment listed.
RESULTS
Results of the search strategy are shown in the Figure. The search retrieved a total of 2,363 references of which 113 were duplicates, leaving 2,250 to be screened. After title and abstract and full-text screening, 42 studies were included in the review. The final 42 studies were coded for alignment with the STEEEP framework. The Table displays the focus of assessment and methods of assessment within each STEEEP domain.
Eighteen studies were coded into a single domain while the rest were coded into at least two domains. The domain Patient Centered was coded as having the most studies (n = 23), followed by the domain of Safe (n = 15). Timely, Effective, and Efficient domains had 11, 9, and 12 studies, respectively. No studies were coded into the domain of Equitable.
Safe
Nearly all studies coded into the Safe domain focused on transitions of care. These included transfers into a hospital from other hospitals,14 transitions of care to cross-covering providers15,16 and new primary providers,17 and transition out from the acute care setting.18-28 Measures of hospital discharge included measures of both processes18-22 and outcomes.23-27 Methods of assessment varied from use of trained observers or scorers to surveys of individuals and colleagues about performance. Though a few leveraged informatics,22,27 all approaches relied on human interaction, and none were automated.
Timely
All studies coded into the Timely domain were coded into at least one other domain. For example, Anderson et al looked at how hospitalists communicated about potential life-limiting illness at the time of hospital admission and the subsequent effects on plans of care29; this was coded as both Timely and Patient Centered. Likewise, another group of studies centered on application of evidence-based guidelines, such as giving antibiotics within a certain time interval for sepsis and were coded as both Timely and Effective. Another set of authors described dashboards or scorecards that captured a number of group-level metrics of processes of care that span STEEEP domains and may be applicable to individuals, including Fox et al for pediatrics8 and Hwa et al for an adult academic hospitalist group.9 Methods of assessment varied widely across studies and included observations in the clinical environment,28,30,31 performance in simulations,32 and surveys about performance.22-26 A handful of approaches were more automated and made use of informatics8,9,22 or data collected for other health system purposes.8,9
Effective
Effectiveness was most often assessed through adherence to consensus and evidence-based guidelines. Examples included processes of care related to sepsis, venous thromboembolism prophylaxis, COPD, heart failure, pediatric asthma, and antibiotic appropriateness.8,9,23,32-36 Through the review, multiple other studies that included group-level measures of effectiveness for a variety of health conditions were excluded because data on individual-level variation were not reported. Methods of assessment included expert review of cases or discharge summaries, compliance with core measures, performance in simulation, and self-assessment on practice behaviors. Other than those efforts aligned with institutional data collection, most approaches were resource intensive.
Efficient
As with those in the Timely domain, most studies coded into the Efficient domain were coded into at least one other domain. One exception measured unnecessary daily lab work and both showed provider-level variation and demonstrated improvement in quality based on an intervention.37 Another paper coded into the Effective domain evaluated adherence to components of the Choosing Wisely® recommendations.34 In addition to these two studies focusing on cost efficacy, other studies coded to this domain assessed concepts such as ensuring more efficient care from other providers by optimizing transitions of care15-17 and clarifying patients’ goals for care.38 Although integrating insurer information into care plans is emphasized in the Core Competencies of Hospital Medicine,11 this concept was not represented in any of the identified articles. Methods of assessment varied and mostly relied on observation of behaviors or survey of providers. Several approaches were more automated or used Medicare claims data to assess the efficiency of individual providers relative to peers.34,37,39
Equitable
Among the studies reviewed, none were coded into the Equitable domain despite care of vulnerable populations being identified as a core competency of hospital medicine.40
Patient Centered
Studies coded to the Patient Centered domain assessed hospitalist performance through ratings of patient satisfaction,8,9,41-44 rating of communication between hospitalists and patients,19-21,29,45-51 identification of patient preferences,38,52 outcomes of patient-centered care activities,27,28 and peer ratings.53,54 Authors applied several theoretical constructs to these assessments including shared decision-making,50 etiquette-based medicine,47,48 empathetic responsiveness,45 agreement about the goals of care between the patient and healthcare team members,52 and lapses in professionalism.53 Studies often crossed STEEEP domains, such as those assessing quality of discharge information provided to patients, which were coded as both Safe and Patient Centered.19-21 In addition to coded or observed performance in the clinical setting, studies in this domain also used patient ratings as a method of assessment.8,9,28,41-44,49,50 Only a few of these approaches aligned with existing performance measures of health systems and were more automated.8,9
DISCUSSION
This scoping review of performance data for individual hospitalists coded to the STEEEP framework identified robust areas in the published literature, as well as opportunities to develop new approaches or refine existing measures. Transitions of care, both intrahospital and at discharge, and adherence to evidence-based guidelines are areas for which current research has created a foundation for care that is Safe, Timely, Effective, and Efficient. The Patient Centered domain also has several measures described, though the conceptual underpinnings are heterogeneous, and consensus appears necessary to compare performance across groups. No studies were coded to the Equitable domain. Across domains, approaches to measurement varied in resource intensity from simple ones, like integrating existing data collected by hospitals, to more complex ones, like shadowing physicians or coding interactions.
Methods of assessment coded into the Safe domain focused on communication and, less so, patient outcomes around transitions of care. Transitions of care that were evaluated included transfer of patients into a new facility, sign-out to new physicians for both cross-cover responsibilities and for newly assuming the role of primary attending, and discharge from the hospital. Most measures rated the quality of communication, although several23-27 examined patient outcomes. Approaches that survey individuals downstream from a transition of care15,17,24-26 may be the simplest and most feasible approach to implement in the future but, as described to date, do not include all transitions of care and may miss patient outcomes. Important core competencies for hospital medicine under the Safe domain that were not identified in this review include areas such as diagnostic error, hospital-acquired infections, error reporting, and medication safety.11 These are potential areas for future measure development.
The assessments in many studies were coded across more than one domain; for example, measures of the application of evidence-based guidelines were coded into domains of Effective, Timely, Efficient, and others. Applying the six domains of the STEEEP framework revealed the multidimensional outcomes of hospitalist work and could guide more meaningful quality assessments of individual hospitalist performance. For example, assessing adherence to evidence-based guidelines, as well as consideration of the Core Competencies of Hospital Medicine and recommendations of the Choosing Wisely® campaign, are promising areas for measurement and may align with existing hospital metrics. Notably, several reviewed studies measured group-level adherence to guidelines but were excluded because they did not examine variation at the individual level. Future measures based on evidence-based guidelines could center on the Effective domain while also integrating assessment of domains such as Efficient, Timely, and Patient Centered and, in so doing, provide a richer assessment of the diverse aspects of quality.
Several other approaches in the domains of Timely, Effective, and Efficient were described only in a few studies yet deserve consideration for further development. Two time-motion studies30,31 were coded into the domains of Timely and Efficient and would be cumbersome in regular practice but, with advances in wearable technology and electronic health records, could become more feasible in the future. Another approach used Medicare payment data to detect provider-level variation.39 Potentially, “big data” could be analyzed in other ways to compare the performance of individual hospitalists.
The lack of studies coded into the Equitable domain may seem surprising, but the Institute for Healthcare Improvement identifies Equitable as the “forgotten aim” of the STEEEP framework. This organization has developed a guide for health care organizations to promote equitable care.55 While this guide focuses mostly on organizational-level actions, some are focused on individual providers, such as training in implicit bias. Future research should seek to identify disparities in care by individual providers and develop interventions to address any discovered gaps.
The “Patient Centered” domain was the most frequently coded and had the most heterogeneous underpinnings for assessment. Studies varied widely in terminology and conceptual foundations. The field would benefit from future work to identify how “Patient Centered” care might be more clearly conceptualized, guided by comparative studies among different assessment approaches to define those most valid and feasible.
The overarching goal for measuring individual hospitalist quality should be to improve the delivery of patient care in a supportive and formative way. To further this goal, adding or expanding on metrics identified in this article may provide a more complete description of performance. As a future direction, groups should consider partnering with one another to define measurement approaches, collaborate with existing data sources, and even share deidentified individual data to establish performance benchmarks at the individual and group levels.
While this study used broad search terms to support completeness, the search process could have missed important studies. Grey literature, non–English language studies, and industry reports were not included in this review. Groups may also be using other assessments of individual hospitalist performance that are not published in the peer-reviewed literature. Coding of study assessments was achieved through consensus reconciliation; other coders might have classified studies differently.
CONCLUSION
This scoping review describes the peer-reviewed literature of individual hospitalist performance and is the first to link it to the STEEEP quality framework. Assessments of transitions of care, evidence-based care, and cost-effective care are exemplars in the published literature. Patient-centered care is well studied but assessed in a heterogeneous fashion. Assessments of equity in care are notably absent. The STEEEP framework provides a model to structure assessment of individual performance. Future research should build on this framework to define meaningful assessment approaches that are actionable and improve the welfare of our patients and our system.
Disclosures
The authors have nothing to disclose.
1. Quality of Care: A Process for Making Strategic Choices in Health Systems. World Health Organization; 2006.
2. Institute of Medicine (US) Committee on Quality of Health Care in America. Crossing the Quality Chasm: A New Health System for the 21st Century. National Academies Press; 2001. Accessed December 20, 2019. http://www.ncbi.nlm.nih.gov/books/NBK222274/
3. Wadhera RK, Joynt Maddox KE, Wasfy JH, Haneuse S, Shen C, Yeh RW. Association of the hospital readmissions reduction program with mortality among Medicare beneficiaries hospitalized for heart failure, acute myocardial infarction, and pneumonia. JAMA. 2018;320(24):2542-2552. https://doi.org/10.1001/jama.2018.19232
4. Kondo KK, Damberg CL, Mendelson A, et al. Implementation processes and pay for performance in healthcare: a systematic review. J Gen Intern Med. 2016;31(Suppl 1):61-69. https://doi.org/10.1007/s11606-015-3567-0
5. Fung CH, Lim Y-W, Mattke S, Damberg C, Shekelle PG. Systematic review: the evidence that publishing patient care performance data improves quality of care. Ann Intern Med. 2008;148(2):111-123. https://doi.org/10.7326/0003-4819-148-2-200801150-00006
6. Jha AK, Orav EJ, Epstein AM. Public reporting of discharge planning and rates of readmissions. N Engl J Med. 2009;361(27):2637-2645. https://doi.org/10.1056/NEJMsa0904859
7. Society of Hospital Medicine. State of Hospital Medicine Report; 2018. Accessed December 20, 2019. https://www.hospitalmedicine.org/practice-management/shms-state-of-hospital-medicine/
8. Hwa M, Sharpe BA, Wachter RM. Development and implementation of a balanced scorecard in an academic hospitalist group. J Hosp Med. 2013;8(3):148-153. https://doi.org/10.1002/jhm.2006
9. Fox LA, Walsh KE, Schainker EG. The creation of a pediatric hospital medicine dashboard: performance assessment for improvement. Hosp Pediatr. 2016;6(7):412-419. https://doi.org/10.1542/hpeds.2015-0222
10. Hain PD, Daru J, Robbins E, et al. A proposed dashboard for pediatric hospital medicine groups. Hosp Pediatr. 2012;2(2):59-68. https://doi.org/10.1542/hpeds.2012-0004
11. Nichani S, Crocker J, Fitterman N, Lukela M. Updating the core competencies in hospital medicine--2017 revision: introduction and methodology. J Hosp Med. 2017;12(4):283-287. https://doi.org/10.12788/jhm.2715
12. Arksey H, O’Malley L. Scoping studies: towards a methodological framework. Int J Soc Res Methodol. 2005;8:19-32. https://doi.org/10.1080/1364557032000119616
13. Tricco AC, Lillie E, Zarin W, et al. PRISMA extension for scoping reviews (PRISMA-ScR): checklist and explanation. Ann Intern Med. 2018;169(7):467-473. https://doi.org/10.7326/m18-0850
14. Borofsky JS, Bartsch JC, Howard AB, Repp AB. Quality of interhospital transfer communication practices and association with adverse events on an internal medicine hospitalist service. J Healthc Qual. 2017;39(3):177-185. https://doi.org/10.1097/01.JHQ.0000462682.32512.ad
15. Fogerty RL, Schoenfeld A, Salim Al-Damluji M, Horwitz LI. Effectiveness of written hospitalist sign-outs in answering overnight inquiries. J Hosp Med. 2013;8(11):609-614. https://doi.org10.1002/jhm.2090
16. Miller DM, Schapira MM, Visotcky AM, et al. Changes in written sign-out composition across hospitalization. J Hosp Med. 2015;10(8):534-536. https://doi.org/10.1002/jhm.2390
17. Hinami K, Farnan JM, Meltzer DO, Arora VM. Understanding communication during hospitalist service changes: a mixed methods study. J Hosp Med. 2009;4(9):535-540. https://doi.org/10.1002/jhm.523
18. Horwitz LI, Jenq GY, Brewster UC, et al. Comprehensive quality of discharge summaries at an academic medical center. J Hosp Med. 2013;8(8):436-443. https://doi.org10.1002/jhm.2021
19. Sarzynski E, Hashmi H, Subramanian J, et al. Opportunities to improve clinical summaries for patients at hospital discharge. BMJ Qual Saf. 2017;26(5):372-380. https://doi.org/10.1136/bmjqs-2015-005201
20. Unaka NI, Statile A, Haney J, Beck AF, Brady PW, Jerardi KE. Assessment of readability, understandability, and completeness of pediatric hospital medicine discharge instructions. J Hosp Med. 2017;12(2):98-101. https://doi.org/10.12788/jhm.2688
21. Unaka N, Statile A, Jerardi K, et al. Improving the readability of pediatric hospital medicine discharge instructions. J Hosp Med. 2017;12(7):551-557. https://doi.org/10.12788/jhm.2770
22. Zackoff MW, Graham C, Warrick D, et al. Increasing PCP and hospital medicine physician verbal communication during hospital admissions. Hosp Pediatr. 2018;8(4):220-226. https://doi.org/10.1542/hpeds.2017-0119
23. Salata BM, Sterling MR, Beecy AN, et al. Discharge processes and 30-day readmission rates of patients hospitalized for heart failure on general medicine and cardiology services. Am J Cardiol. 2018;121(9):1076-1080. https://doi.org/10.1016/j.amjcard.2018.01.027
24. Arora VM, Prochaska ML, Farnan JM, et al. Problems after discharge and understanding of communication with their primary care physicians among hospitalized seniors: a mixed methods study. J Hosp Med. 2010;5(7):385-391. https://doi.org/10.1002/jhm.668
25. Bell CM, Schnipper JL, Auerbach AD, et al. Association of communication between hospital-based physicians and primary care providers with patient outcomes. J Gen Intern Med. 2009;24(3):381-386. https://doi.org/10.1007/s11606-008-0882-8
26. Clark B, Baron K, Tynan-McKiernan K, Britton M, Minges K, Chaudhry S. Perspectives of clinicians at skilled nursing facilities on 30-day hospital readmissions: a qualitative study. J Hosp Med. 2017;12(8):632-638. https://doi.org/10.12788/jhm.2785
27. Harris CM, Sridharan A, Landis R, Howell E, Wright S. What happens to the medication regimens of older adults during and after an acute hospitalization? J Patient Saf. 2013;9(3):150-153. https://doi.org/10.1097/PTS.0b013e318286f87d
28. Harrison JD, Greysen RS, Jacolbia R, Nguyen A, Auerbach AD. Not ready, not set...discharge: patient-reported barriers to discharge readiness at an academic medical center. J Hosp Med. 2016;11(9):610-614. https://doi.org/10.1002/jhm.2591
29. Anderson WG, Kools S, Lyndon A. Dancing around death: hospitalist-patient communication about serious illness. Qual Health Res. 2013;23(1):3-13. https://doi.org/10.1177/1049732312461728
30. Tipping MD, Forth VE, Magill DB, Englert K, Williams MV. Systematic review of time studies evaluating physicians in the hospital setting. J Hosp Med. 2010;5(6):353-359. https://doi.org/10.1002/jhm.647
31. Tipping MD, Forth VE, O’Leary KJ, et al. Where did the day go?--a time-motion study of hospitalists. J Hosp Med. 2010;5(6):323-328. https://doi.org/10.1002/jhm.790
32. Bergmann S, Tran M, Robison K, et al. Standardising hospitalist practice in sepsis and COPD care. BMJ Qual Saf. 2019;28(10):800-808. https://doi.org/10.1136/bmjqs-2018-008829
33. Kisuule F, Wright S, Barreto J, Zenilman J. Improving antibiotic utilization among hospitalists: a pilot academic detailing project with a public health approach. J Hosp Med. 2008;3(1):64-70. https://doi.org/10.1002/jhm.278
34. Reyes M, Paulus E, Hronek C, et al. Choosing Wisely campaign: report card and achievable benchmarks of care for children’s hospitals. Hosp Pediatr. 2017;7(11):633-641. https://doi.org/10.1542/hpeds.2017-0029
35. Landrigan CP, Conway PH, Stucky ER, et al. Variation in pediatric hospitalists’ use of proven and unproven therapies: a study from the Pediatric Research in Inpatient Settings (PRIS) network. J Hosp Med. 2008;3(4):292-298. https://doi.org/10.1002/jhm.347
36. Michtalik HJ, Carolan HT, Haut ER, et al. Use of provider-level dashboards and pay-for-performance in venous thromboprophylaxis. J Hosp Med. 2015;10(3):172-178. https://doi.org/10.1002/jhm.2303
37. Johnson DP, Lind C, Parker SE, et al. Toward high-value care: a quality improvement initiative to reduce unnecessary repeat complete blood counts and basic metabolic panels on a pediatric hospitalist service. Hosp Pediatr. 2016;6(1):1-8. https://doi.org/10.1542/hpeds.2015-0099
38. Auerbach AD, Katz R, Pantilat SZ, et al. Factors associated with discussion of care plans and code status at the time of hospital admission: results from the Multicenter Hospitalist Study. J Hosp Med. 2008;3(6):437-445. https://doi.org/10.1002/jhm.369
39. Tsugawa Y, Jha AK, Newhouse JP, Zaslavsky AM, Jena AB. Variation in physician spending and association with patient outcomes. JAMA Intern Med. 2017;177(5):675-682. https://doi.org/10.1001/jamainternmed.2017.0059
40. Nichani S, Fitterman N, Lukela M, Crocker J. Equitable allocation of resources. 2017 hospital medicine revised core competencies. J Hosp Med. 2017;12(4):S62. https://doi.org/10.12788/jhm.3016
41. Blanden AR, Rohr RE. Cognitive interview techniques reveal specific behaviors and issues that could affect patient satisfaction relative to hospitalists. J Hosp Med. 2009;4(9):E1-E6. https://doi.org/10.1002/jhm.524
42. Torok H, Ghazarian SR, Kotwal S, Landis R, Wright S, Howell E. Development and validation of the tool to assess inpatient satisfaction with care from hospitalists. J Hosp Med. 2014;9(9):553-558. https://doi.org/10.1002/jhm.2220
43. Torok H, Kotwal S, Landis R, Ozumba U, Howell E, Wright S. Providing feedback on clinical performance to hospitalists: Experience using a new metric tool to assess inpatient satisfaction with care from hospitalists. J Contin Educ Health Prof. 2016;36(1):61-68. https://doi.org/10.1097/CEH.0000000000000060
44. Indovina K, Keniston A, Reid M, et al. Real-time patient experience surveys of hospitalized medical patients. J Hosp Med. 2016;11(4):251-256. https://doi.org/10.1002/jhm.2533
45. Weiss R, Vittinghoff E, Fang MC, et al. Associations of physician empathy with patient anxiety and ratings of communication in hospital admission encounters. J Hosp Med. 2017;12(10):805-810. https://doi.org/10.12788/jhm.2828
46. Apker J, Baker M, Shank S, Hatten K, VanSweden S. Optimizing hospitalist-patient communication: an observation study of medical encounter quality. Jt Comm J Qual Patient Saf. 2018;44(4):196-203. https://doi.org/10.1016/j.jcjq.2017.08.011
47. Kotwal S, Torok H, Khaliq W, Landis R, Howell E, Wright S. Comportment and communication patterns among hospitalist physicians: insight gleaned through observation. South Med J. 2015;108(8):496-501. https://doi.org/10.14423/SMJ.0000000000000328
48. Tackett S, Tad-y D, Rios R, Kisuule F, Wright S. Appraising the practice of etiquette-based medicine in the inpatient setting. J Gen Intern Med. 2013;28(7):908-913. https://doi.org/10.1007/s11606-012-2328-6
49. Ferranti DE, Makoul G, Forth VE, Rauworth J, Lee J, Williams MV. Assessing patient perceptions of hospitalist communication skills using the Communication Assessment Tool (CAT). J Hosp Med. 2010;5(9):522-527. https://doi.org/10.1002/jhm.787
50. Blankenburg R, Hilton JF, Yuan P, et al. Shared decision-making during inpatient rounds: opportunities for improvement in patient engagement and communication. J Hosp Med. 2018;13(7):453-461. https://doi.org/10.12788/jhm.2909
51. Chang D, Mann M, Sommer T, Fallar R, Weinberg A, Friedman E. Using standardized patients to assess hospitalist communication skills. J Hosp Med. 2017;12(7):562-566. https://doi.org/10.12788/jhm.2772
52. Figueroa JF, Schnipper JL, McNally K, Stade D, Lipsitz SR, Dalal AK. How often are hospitalized patients and providers on the same page with regard to the patient’s primary recovery goal for hospitalization? J Hosp Med. 2016;11(9):615-619. https://doi.org/10.1002/jhm.2569
53. Reddy ST, Iwaz JA, Didwania AK, et al. Participation in unprofessional behaviors among hospitalists: a multicenter study. J Hosp Med. 2012;7(7):543-550. https://doi.org/10.1002/jhm.1946
54. Bhogal HK, Howe E, Torok H, Knight AM, Howell E, Wright S. Peer assessment of professional performance by hospitalist physicians. South Med J. 2012;105(5):254-258. https://doi.org/10.1097/SMJ.0b013e318252d602
55. Wyatt R, Laderman M, Botwinick L, Mate K, Whittington J. Achieving health equity: a guide for health care organizations. IHI White Paper. Institute for Healthcare Improvement; 2016. https://www.ihi.org
© 2020 Society of Hospital Medicine
HCAHPS Surveys and Patient Satisfaction
The Hospital Consumer Assessment of Healthcare Providers and Systems (HCAHPS) is the first national, standardized, publicly reported survey of patients' perception of hospital care. HCAHPS mandates a standard method of collecting and reporting perception of health care by patients to enable valid comparisons across all hospitals.[1, 2, 3] Voluntary collection of HCAHPS data for public reporting began in July 2006, mandatory collection of data for hospitals that participate in Inpatient Prospective Payment Program of Medicare began in July 2007, and public reporting of mandated HCAHPS scores began in 2008.[2]
Using data from the first 2‐year period, an earlier study had reported an increase in HCAHPS patient satisfaction scores in all domains except in the domain of satisfaction with physician communication.[4] Since then, data from additional years have become available, allowing assessment of satisfaction of hospitalized patients with physician communication over a longer period. Therefore, our objective was to examine changes in patient satisfaction with physician communication from 2007 to 2013, the last reported date, and to explore hospital and local population characteristics that may be associated with patient satisfaction.
METHODS
Publicly available data from 3 sources were used for this study. Patient satisfaction scores with physician communication and hospital characteristics were obtained from the HCAHPS data files available at the Hospital Compare database maintained by the Centers for Medicare and Medicaid Services (CMS).[5] HCAHPS files contain data for the preceding 12 months and are updated quarterly. We used files that reported data from the first to the fourth quarter of the year for 2007 to 2013. The HCAHPS survey contains 32 questions, of which 3 questions are about physician communication.[6] We used the percentage of survey participants who responded that physicians always communicated well as a measure of patient satisfaction with physician communication (the other 2 questions were not included). Hospitals that reported data on patient satisfaction during 2007 were divided into quartiles based on their satisfaction scores, and this quartile allocation was maintained during each subsequent year. Survey response rate, in percentage, was obtained from HCAHPS data files for each year. Hospital characteristics, such as ownership of the hospital, teaching hospital status, and designation of critical access hospital were obtained from the Hospital Compare website. Hospital ownership was defined as government (owned by federal, state, Veterans Affairs, or tribal authorities), for profit (owned by physicians or another proprietary), or nonprofit (owned by a nonprofit organization such as a church). A hospital was considered a teaching hospital if it obtained graduate medical education funding from CMS.
We obtained local population data from 2010 decennial census files and from the American Community Survey 5‐year data profile from 2009 to 2013; both datasets are maintained by the Unites States Census Bureau.[7] Census is mandated by Article I, Section 2 of the United States Constitution and takes place every 10 years. The American Community Survey is also a mandatory, ongoing statistical survey that samples a small percentage of the population every year giving communities the information they need to plan investments and services. We chose to use 5‐year estimates as these are more precise and are reliable in analyzing small populations. For each zip code, we extracted data on total population, percentage of African Americans in the population, median income, poverty level, and insurance status from the Census Bureau data files.
Local population characteristics at zip code level were mapped to hospitals using hospital service area (HSA) crosswalk files from the Dartmouth Atlas of Health Care.[7, 8] The Dartmouth Atlas defined 3436 HSAs by assigning zip codes to the hospital area where the greatest proportion of its Medicare residents were hospitalized. The number of acute care hospital beds and the number of physicians within the HSA were also obtained from the Dartmouth Atlas. Merging data from these 3 sources generated a dataset that contained information about patient satisfaction scores from a particular hospital, hospital characteristics, and population characteristics of the healthcare market.
Data were summarized as mean and standard deviation (SD). To model the dependence of observations from the same hospital and the correlation between hospitals within the same state due to similar regulations, and to assess the relative contribution of satisfaction scores over time within hospital, hospitals within states, and across states, 3‐level hierarchical regression models were examined.[9, 10] At the within‐hospital level, survey response rate was used as a time‐varying variable in addition to the year of observation. However, only year of observation was used to explore differences in patient satisfaction trajectories between hospitals. At the hospitals‐within‐states level, hospital characteristics and local population characteristics within the HSA were included. At the states level, only random effects were obtained, and no additional variables were included in the models.
Four models were built to assess the relationship between satisfaction scores and predictors. The basic model used only random effects without any predictors to determine the relative contribution of each level (within hospitals, hospitals within states, and across states) to variation in patient satisfaction scores and thus was consistent with the variance component analysis. The first model included the year of observation as a predictor at the within‐hospital level to examine trends in patient satisfaction scores during the observation period. For the second model, we added baseline satisfaction quartiles to the second model, whereas remaining predictors (HSA population, African American percentage in HSA, survey response rate, HSA median income, ownership of hospital, percentage with private any insurance in HSA, acute care hospital beds in HSA, teaching hospital status, and percentage of people living in poverty within HSA) were added in the third model. Quartiles for baseline satisfaction were generated using satisfaction scores from 2007. As a larger number of hospitals reported results for 2008 than for 2007 (2273 vs 3746), we conducted a sensitivity analysis using satisfaction quartiles in 2008 as baseline and examined subsequent trends over time for the 4 models noted above. All multilevel models were specified using the nlme package in R to account for clustering of observations within hospitals and hospitals within states, using hospital and state level random effects.[11]
RESULTS
Of the 4353 hospitals with data for the 7‐year period, the majority were in the Southern region (South = 1669, Midwest = 1239, Northeast = 607, West = 838). Texas had the largest number of hospital (N = 358) followed by California (N = 340). The largest number of hospitals were nonprofit (N = 2637, 60.6%). Mean (SD) patient satisfaction with physician communication was 78.9% (5.7%) in 2007 that increased to 81.7% (5.4%) in 2013. Throughout the observation period, the highest patient satisfaction was in the South (80.6% [6.6%] in 2007 and 83.2% [5.4%] in 2013). Of the 2273 hospitals that reported data in 2007, the mean satisfaction score of the lowest quartile was 72% (3.2%), and the highest quartile was 86.9% (3.2%) (Table 1). As a group, hospitals in the highest quartile in 2007 still had higher satisfaction scores in 2013 than the hospitals in the lowest quartile (85% [4.2%] vs 77% [3.6%], respectively). Only 4 of the 584 hospitals in the lowest quartile in 2007 climbed up to the highest quartile in 2013, whereas 22 hospitals that were in the upper quartile in 2007 dropped to the lowest quartile in 2013.
| Characteristic | Quartiles Based on 2007 Satisfaction Scores | |||
|---|---|---|---|---|
| Highest Quartile | 2nd Quartile | 3rd Quartile | Lowest Quartile | |
| ||||
| Total no. of hospitals, N (%) | 461 (20.3) | 545 (24.0) | 683 (30.0) | 584 (25.7) |
| Hospital ownership, N (%) | ||||
| For profit | 50 (14.4) | 60 (17.3) | 96 (27.7) | 140 (40.5) |
| Nonprofit | 269 (17.4) | 380 (24.6) | 515 (33.4) | 378 (24.5) |
| Government | 142 (36.9) | 105 (27.3) | 72 (18.7) | 66 (17.1) |
| HSA population, in 1,000, median (IQR) | 33.2 (70.5) | 88.5 (186) | 161.8 (374) | 222.2 (534) |
| Racial distribution of HSA population, median (IQR) | ||||
| White, % | 82.6 (26.2) | 82.5 (28.5) | 74.2 (32.9) | 66.8 (35.3) |
| Black, % | 4.3 (21.7) | 3.7 (16.3) | 5.9 (14.8) | 7.4 (12.1) |
| Other, % | 6.4 (7.1) | 8.8 (10.8) | 12.9 (19.8) | 20.0 (33.1) |
| HSA mean median income in $1,000, mean (SD) | 44.6 (11.7) | 52.4 (17.8) | 58.4 (17.1) | 57.5 (15.7) |
| Satisfaction scores (at baseline), mean (SD) | 86.9 (3.1) | 81.4 (1.1) | 77.5 (1.1) | 72.0 (3.2) |
| Satisfaction scores (in 2013), mean (SD) | 85.0 (4.3) | 82.0 (3.4) | 79.7 (3.0) | 77.0 (3.5) |
| Survey response rate (at baseline), mean (SD) | 43.2 (19.8) | 34.5 (9.4) | 32.6 (8.0) | 30.3 (7.8) |
| Survey response rate (20072013), mean (SD) | 32.8 (7.8) | 32.6 (7.5) | 30.8 (6.5) | 29.3 (6.5) |
| Percentage with any insurance in HSA, mean (SD) | 84.0 (5.4) | 84.8 (6.6) | 85.5 (6.3) | 83.9 (6.6) |
| Teaching hospital, N (%) | 42 (9.1) | 155 (28.4) | 277 (40.5) | 274 (46.9%) |
| Acute care hospital beds in HSA (per 1,000), mean (SD) | 3.2 (1.2) | 2.6 (0.8) | 2.5 (0.8) | 2.4 (0.7) |
| Number of physicians in HSA (per 100,000), mean (SD) | 190 (36) | 197 (43) | 204 (47) | 199 (45) |
| Percentage with poverty in HSA, mean (SD)[7] | 16.9 (6.6) | 15.5 (6.5) | 14.4 (5.7) | 15.5 (6.0) |
Using variance component analysis, we found that 23% of the variation in patient satisfaction scores with physician communication was due to differences between states, 52% was due to differences between hospitals within states, and 24% was due to changes over time within a hospital. When examining time trends of satisfaction during the 7‐year period without adjusting for other predictors, we found a statistically significant increasing trend in patient satisfaction with physician communication (0.33% per year; P < 0.001). We also found a significant negative correlation (0.62, P < 0.001) between the random effects for baseline satisfaction (intercept) and change over time (slope), suggesting that initial patient satisfaction with physicians at a hospital was negatively correlated with subsequent change in satisfaction scores during the observation period.
When examining the effect of satisfaction ranking in 2007, hospitals within the lowest quartile of patient satisfaction in 2007 had significantly larger increase in satisfaction scores during the subsequent period as compared to the hospitals in each of the other 3 quartiles (all P < 0.001, Table 2). The difference in the magnitude of the rate of increase in satisfaction scores was greatest between the lowest quartile and the highest quartile (1.10% per year; P < 0.001). In fact, the highest quartile had a statistically significant absolute decrease in patient satisfaction during the observation period (0.23% per year; P < 0.001, Figure 1).
| Variable | Model 1: ; P Value | Model 2: ; P Value | Model 3: ; P Value |
|---|---|---|---|
| |||
| Time (in years) | 0.33; <0.001 | 0.87; <0.001 | 0.89; <0.001 |
| Satisfaction quartiles at baseline | |||
| Highest quartile | 12.1; <0.001 | 10.4; <0.001 | |
| 2nd quartile | 7.9; <0.001 | 7.1; <0.001 | |
| 3rd quartile | 4.5; <0.001 | 4.1; <0.001 | |
| Lowest quartile (REF) | REF | REF | |
| Interaction with time | |||
| Highest quartile | 1.10; <0.001 | 0.94; <0.001 | |
| 2nd quartile | 0.73; <0.001 | 0.71; <0.001 | |
| 3rd quartile | 0.48; <0.001 | 0.47;<0.001 | |
| Survey response rate (%) | 0.12; <0.001 | ||
| Total population, in 10,000 | 0.002; 0.02 | ||
| African American (%) | 0.004; 0.13 | ||
| HSA median Income in $10,000 | 0.02; 0.58 | ||
| Ownership | |||
| Government (REF) | REF | ||
| Nonprofit | 0.01; 0.88 | ||
| For profit | 0.21; 0.11 | ||
| Percentage with insurance in HSA | 0.007; 0.27 | ||
| Acute care beds in HSA (per 1,000) | 0.60; <0.001 | ||
| Physicians in HSA (per 100,000) | 0.003; 0.007 | ||
| Teaching hospital | 0.34; 0.001 | ||
| Percentage in poverty in HSA | 0.01; 0.27 | ||
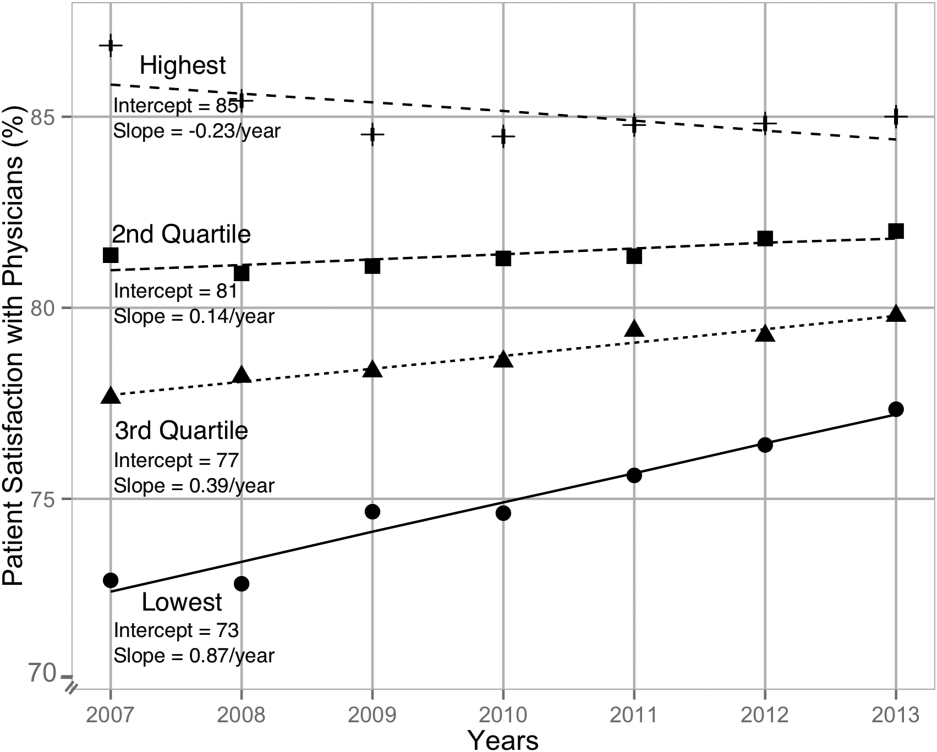
After adjusting for hospital characteristics and population characteristics of the HSA, the 2007 satisfaction quartiles remained significantly associated with subsequent change in satisfaction scores during the 7‐year observation period (Table 2). In addition, survey response rate, number of physicians, and the number of acute‐care hospital beds within the HSA were positively associated with patient satisfaction, whereas higher HSA population density and being a teaching hospital were negatively associated with patient satisfaction. Using 2008 satisfaction scores as baseline, the results did not change except that the number of physicians in the HSA and being a teaching hospital were no longer associated with satisfaction scores with physicians.
DISCUSSION
Using hierarchical modelling, we have shown that national patient satisfaction scores with physicians have consistently improved since 2007, the year when reporting of satisfaction scores began. We further show that the improvement in satisfaction scores has not been consistent through all hospitals. The largest increase in satisfaction scores was in hospitals that were in the lowest quartile of satisfaction scores in 2007. In contrast, satisfaction scores decreased in hospitals that were in the uppermost quartile of satisfaction scores. The difference between the lowest and uppermost quartile was so large in 2007 that despite the difference in the direction of change in satisfaction scores, hospitals in the uppermost quartile continued to have higher satisfaction scores in 2013 than hospitals in the lowest quartile.
Consistent with our findings for patient satisfaction, other studies have found that public reporting is associated with improvement in healthcare quality measures across nursing homes, physician groups, and hospitals.[12, 13, 14] However, it is unclear how public reporting can change patient satisfaction. The main purpose of public reporting of quality of healthcare measures, such as patient satisfaction with the healthcare they receive, is to generate value by increasing transparency and accountability, thereby increasing the quality of healthcare delivery. Healthcare consumers may also utilize the reported measures to choose providers that deliver high‐quality healthcare. Contrary to expectations, there is very little evidence that consumers choose healthcare facilities based on public reporting, and it is likely that other mechanisms may explain the observed association.[15, 16]
Physicians have historically had low adoption of strategies to improve patient satisfaction and often cite suboptimal data and lack of evidence for data‐driven strategies.[17, 18] Hospitals and healthcare organizations have deployed a broad range of strategies to engage physicians. These include emphasizing relationship between patient satisfaction and patient compliance, complaints and malpractice lawsuits, appealing to physicians' sense of competitiveness by publishing individual provider satisfaction scores, educating physicians on HCAHPS and providing them with regularly updated data, and development of specific techniques for improving patient‐physician interaction.[19, 20, 21, 22, 23, 24] Administrators may also enhance physician engagement by improving physician satisfaction, decreasing their turnover, support development of physicians in administrative leadership roles, and improving financial transparency.[25] Thus, involvement of hospital leadership has been instrumental in encouraging physicians to focus on quality measures including patient satisfaction. Some evidence suggests that public reporting exerts strong influence on hospital leaders for adequate resource allocation, local planning, and improvement efforts.[26, 27, 28]
Perhaps the most intriguing finding in our study is that hospitals in the uppermost quartile of satisfaction scores in 2007 had a statistically significant steady decline in scores during the following period as compared to hospitals in the lowest quartile that had a steady increase. A possible explanation for this finding can be that high‐performing hospitals become complacent and do not invest in developing the effort‐intensive resources required to maintain and improve performance in the physician‐related patient satisfaction domain. These resources may be diverted to competing needs that include addressing improvement efforts for a large number of other publicly reported healthcare quality measures. Thus, an unintended consequence of quality improvement may be that improvement in 1 domain may be at the expense of quality of care in another domain.[29, 30, 31] On the other hand, it is likely that hospitals in the lower quartile see a larger improvement in their scores for the same degree of investment as hospitals in the higher quartiles. It is also likely that hospitals, particularly those in the lowest quartile, develop their individual benchmarks and expend effort that is in line with their perceived need for improvement to achieve their strategic and marketing goals.
Our study has significant implications for the healthcare system, clinical practice, and future research. Whereas public reporting of quality measures is associated with an overall improvement in the reported quality measure, hospitals with high scores may move resources away from that metric or become complacent. Health policy makers need to design policies that encourage all hospitals and providers to perform better or continue to perform well. We further show that differences between hospitals and between local healthcare markets are the biggest factor determining the variation in patient satisfaction with physician communication, and an adjustment in reported score for these factors may be needed. Although local healthcare market factors may not be modifiable, an exchange of knowledge between hospitals with low and high patient satisfaction scores may improve overall satisfaction scores. Similarly, hospitals that are successful in increasing patient satisfaction scores should identify and share useful interventions.
The main strength of our study is that we used data on patient satisfaction with physician communication that were reported annually by most hospitals within the United States. These longitudinal data allowed us to examine not only the effect of public reporting on patient satisfaction with physician communication but also its trend over time. As we had 7 years of data, we were able to eliminate the possibility of regression to mean; an extreme result on first measurement is followed by a second measurement that tends to be closer to the average. Further, we adjusted satisfaction scores based on hospital and local healthcare market characteristics allowing us to compare satisfaction scores across hospitals. However, because units of observation were hospitals and not patients, we could not examine the effect of patient characteristics on satisfaction scores. In addition, HCAHPS surveys have low response rates and may have response and selection bias. Furthermore, we were unable to examine the strategies implemented by hospitals to improve satisfaction scores or the effect of such strategies on satisfaction scores. Data on hospital strategies to increase satisfaction scores are not available for most hospitals and could not have been included in the study.
In summary, we have found that public reporting was followed by an improvement in patient satisfaction scores with physician communication between 2007 and 2013. The rate of improvement was significantly greater in hospitals that had satisfaction scores in the lowest quartiles, whereas hospitals in the highest quartile had a small but statistically significant decline in patient satisfaction scores.
- Centers for Medicare Medicaid Services. Medicare program; hospital outpatient prospective payment system and CY 2007 payment rates; CY 2007 update to the ambulatory surgical center covered procedures list; Medicare administrative contractors; and reporting hospital quality data for FY 2008 inpatient prospective payment system annual payment update program‐‐HCAHPS survey, SCIP, and mortality. Final rule with comment period and final rule. Fed Regist. 2006;71(226):67959–68401.
- , , , , . Development, implementation, and public reporting of the HCAHPS survey. Med Care Res Rev. 2010;67(1):27–37.
- , , , . Comparison of Hospital Consumer Assessment of Healthcare Providers and Systems patient satisfaction scores for specialty hospitals and general medical hospitals: confounding effect of survey response rate. J Hosp Med. 2014;9(9):590–593.
- , , , et al. Hospital survey shows improvements in patient experience. Health Aff (Millwood). 2010;29(11):2061–2067.
- Centers for Medicare 2010:496829.
- , , , , , . The normal liver harbors the vitamin D nuclear receptor in nonparenchymal and biliary epithelial cells. Hepatology. 2003;37(5):1034–1042.
- , . Applied Longitudinal Data Analysis: Modeling Change and Event Occurrence. Oxford, United Kingdom: Oxford University Press; 2003.
- , . Data Analysis Using Regression and Multilevel/Hierarchical Models. Cambridge, United Kingdom: Cambridge University Press; 2007.
- nlme: Linear and Nonlinear Mixed Effects Models [computer program]. Version R package version 2015;3:1–121.
- , , , . Public reporting helped drive quality improvement in outpatient diabetes care among Wisconsin physician groups. Health Aff (Millwood). 2012;31(3):570–577.
- , , , , , . Governing healthcare through performance measurement in Massachusetts and the Netherlands. Health Policy. 2014;116(1):18–26.
- , , . Public reporting drove quality gains at nursing homes. Health Aff (Millwood). 2010;29(9):1706–1713.
- , , . Users of public reports of hospital quality: who, what, why, and how?: An aggregate analysis of 16 online public reporting Web sites and users' and experts' suggestions for improvement. Agency for Healthcare Research and Quality. Available at: http://archive.ahrq.gov/professionals/quality‐patient‐safety/quality‐resources/value/pubreportusers/index.html. Updated December 2011. Accessed April 2, 2015.
- Kaiser Family Foundation. 2008 update on consumers' views of patient safety and quality information. Available at: http://kff.org/health‐reform/poll‐finding/2008‐update‐on‐consumers‐views‐of‐patient‐2/. Published September 30, 2008. Accessed April 2, 2015.
- , . A report card on continuous quality improvement. Milbank Q. 1998;76(4):625–648, 511.
- , , . Assessing the impact of continuous quality improvement on clinical practice: what it will take to accelerate progress. Milbank Q. 1998;76(4):593–624, 510.
- , . Health care competition, strategic mission, and patient satisfaction: research model and propositions. J Health Organ Manag. 2008;22(6):627–641.
- , , . The effects of physician empathy on patient satisfaction and compliance. Eval Health Prof. 2004;27(3):237–251.
- , , , , . Association between vitamin D and hepatitis C virus infection: a meta‐analysis. World J Gastroenterol. 2013;19(35):5917–5924.
- , , , . The relation of patient satisfaction with complaints against physicians and malpractice lawsuits. Am J Med. 2005;118(10):1126–1133.
- , , , , , . Relation of patients' experiences with individual physicians to malpractice risk. Int J Qual Health Care. 2008;20(1):5–12.
- , , , . Association of patient satisfaction with complaints and risk management among emergency physicians. J Emerg Med. 2011;41(4):405–411.
- , , , , . Secrets of physician satisfaction. Study identifies pressure points and reveals life practices of highly satisfied doctors. Physician Exec. 2006;32(6):30–39.
- , , , et al. Attitudes of hospital leaders toward publicly reported measures of health care quality. JAMA Intern Med. 2014;174(12):1904–1911.
- , , , , , . Closing the quality gap: revisiting the state of the science (vol. 5: public reporting as a quality improvement strategy). Evid Rep Technol Assess (Full Rep). 2012(208.5):1–645.
- , , , , . Systematic review: the evidence that publishing patient care performance data improves quality of care. Ann Intern Med. 2008;148(2):111–123.
- , . The unintended consequences of quality improvement. Curr Opin Pediatr. 2009;21(6):777–782.
- , , , et al. Unintended consequences of implementing a national performance measurement system into local practice. J Gen Intern Med. 2012;27(4):405–412.
- , . Quality assessment by external bodies: intended and unintended impact on healthcare delivery. Curr Opin Anaesthesiol. 2009;22(2):237–241.
The Hospital Consumer Assessment of Healthcare Providers and Systems (HCAHPS) is the first national, standardized, publicly reported survey of patients' perception of hospital care. HCAHPS mandates a standard method of collecting and reporting perception of health care by patients to enable valid comparisons across all hospitals.[1, 2, 3] Voluntary collection of HCAHPS data for public reporting began in July 2006, mandatory collection of data for hospitals that participate in Inpatient Prospective Payment Program of Medicare began in July 2007, and public reporting of mandated HCAHPS scores began in 2008.[2]
Using data from the first 2‐year period, an earlier study had reported an increase in HCAHPS patient satisfaction scores in all domains except in the domain of satisfaction with physician communication.[4] Since then, data from additional years have become available, allowing assessment of satisfaction of hospitalized patients with physician communication over a longer period. Therefore, our objective was to examine changes in patient satisfaction with physician communication from 2007 to 2013, the last reported date, and to explore hospital and local population characteristics that may be associated with patient satisfaction.
METHODS
Publicly available data from 3 sources were used for this study. Patient satisfaction scores with physician communication and hospital characteristics were obtained from the HCAHPS data files available at the Hospital Compare database maintained by the Centers for Medicare and Medicaid Services (CMS).[5] HCAHPS files contain data for the preceding 12 months and are updated quarterly. We used files that reported data from the first to the fourth quarter of the year for 2007 to 2013. The HCAHPS survey contains 32 questions, of which 3 questions are about physician communication.[6] We used the percentage of survey participants who responded that physicians always communicated well as a measure of patient satisfaction with physician communication (the other 2 questions were not included). Hospitals that reported data on patient satisfaction during 2007 were divided into quartiles based on their satisfaction scores, and this quartile allocation was maintained during each subsequent year. Survey response rate, in percentage, was obtained from HCAHPS data files for each year. Hospital characteristics, such as ownership of the hospital, teaching hospital status, and designation of critical access hospital were obtained from the Hospital Compare website. Hospital ownership was defined as government (owned by federal, state, Veterans Affairs, or tribal authorities), for profit (owned by physicians or another proprietary), or nonprofit (owned by a nonprofit organization such as a church). A hospital was considered a teaching hospital if it obtained graduate medical education funding from CMS.
We obtained local population data from 2010 decennial census files and from the American Community Survey 5‐year data profile from 2009 to 2013; both datasets are maintained by the Unites States Census Bureau.[7] Census is mandated by Article I, Section 2 of the United States Constitution and takes place every 10 years. The American Community Survey is also a mandatory, ongoing statistical survey that samples a small percentage of the population every year giving communities the information they need to plan investments and services. We chose to use 5‐year estimates as these are more precise and are reliable in analyzing small populations. For each zip code, we extracted data on total population, percentage of African Americans in the population, median income, poverty level, and insurance status from the Census Bureau data files.
Local population characteristics at zip code level were mapped to hospitals using hospital service area (HSA) crosswalk files from the Dartmouth Atlas of Health Care.[7, 8] The Dartmouth Atlas defined 3436 HSAs by assigning zip codes to the hospital area where the greatest proportion of its Medicare residents were hospitalized. The number of acute care hospital beds and the number of physicians within the HSA were also obtained from the Dartmouth Atlas. Merging data from these 3 sources generated a dataset that contained information about patient satisfaction scores from a particular hospital, hospital characteristics, and population characteristics of the healthcare market.
Data were summarized as mean and standard deviation (SD). To model the dependence of observations from the same hospital and the correlation between hospitals within the same state due to similar regulations, and to assess the relative contribution of satisfaction scores over time within hospital, hospitals within states, and across states, 3‐level hierarchical regression models were examined.[9, 10] At the within‐hospital level, survey response rate was used as a time‐varying variable in addition to the year of observation. However, only year of observation was used to explore differences in patient satisfaction trajectories between hospitals. At the hospitals‐within‐states level, hospital characteristics and local population characteristics within the HSA were included. At the states level, only random effects were obtained, and no additional variables were included in the models.
Four models were built to assess the relationship between satisfaction scores and predictors. The basic model used only random effects without any predictors to determine the relative contribution of each level (within hospitals, hospitals within states, and across states) to variation in patient satisfaction scores and thus was consistent with the variance component analysis. The first model included the year of observation as a predictor at the within‐hospital level to examine trends in patient satisfaction scores during the observation period. For the second model, we added baseline satisfaction quartiles to the second model, whereas remaining predictors (HSA population, African American percentage in HSA, survey response rate, HSA median income, ownership of hospital, percentage with private any insurance in HSA, acute care hospital beds in HSA, teaching hospital status, and percentage of people living in poverty within HSA) were added in the third model. Quartiles for baseline satisfaction were generated using satisfaction scores from 2007. As a larger number of hospitals reported results for 2008 than for 2007 (2273 vs 3746), we conducted a sensitivity analysis using satisfaction quartiles in 2008 as baseline and examined subsequent trends over time for the 4 models noted above. All multilevel models were specified using the nlme package in R to account for clustering of observations within hospitals and hospitals within states, using hospital and state level random effects.[11]
RESULTS
Of the 4353 hospitals with data for the 7‐year period, the majority were in the Southern region (South = 1669, Midwest = 1239, Northeast = 607, West = 838). Texas had the largest number of hospital (N = 358) followed by California (N = 340). The largest number of hospitals were nonprofit (N = 2637, 60.6%). Mean (SD) patient satisfaction with physician communication was 78.9% (5.7%) in 2007 that increased to 81.7% (5.4%) in 2013. Throughout the observation period, the highest patient satisfaction was in the South (80.6% [6.6%] in 2007 and 83.2% [5.4%] in 2013). Of the 2273 hospitals that reported data in 2007, the mean satisfaction score of the lowest quartile was 72% (3.2%), and the highest quartile was 86.9% (3.2%) (Table 1). As a group, hospitals in the highest quartile in 2007 still had higher satisfaction scores in 2013 than the hospitals in the lowest quartile (85% [4.2%] vs 77% [3.6%], respectively). Only 4 of the 584 hospitals in the lowest quartile in 2007 climbed up to the highest quartile in 2013, whereas 22 hospitals that were in the upper quartile in 2007 dropped to the lowest quartile in 2013.
| Characteristic | Quartiles Based on 2007 Satisfaction Scores | |||
|---|---|---|---|---|
| Highest Quartile | 2nd Quartile | 3rd Quartile | Lowest Quartile | |
| ||||
| Total no. of hospitals, N (%) | 461 (20.3) | 545 (24.0) | 683 (30.0) | 584 (25.7) |
| Hospital ownership, N (%) | ||||
| For profit | 50 (14.4) | 60 (17.3) | 96 (27.7) | 140 (40.5) |
| Nonprofit | 269 (17.4) | 380 (24.6) | 515 (33.4) | 378 (24.5) |
| Government | 142 (36.9) | 105 (27.3) | 72 (18.7) | 66 (17.1) |
| HSA population, in 1,000, median (IQR) | 33.2 (70.5) | 88.5 (186) | 161.8 (374) | 222.2 (534) |
| Racial distribution of HSA population, median (IQR) | ||||
| White, % | 82.6 (26.2) | 82.5 (28.5) | 74.2 (32.9) | 66.8 (35.3) |
| Black, % | 4.3 (21.7) | 3.7 (16.3) | 5.9 (14.8) | 7.4 (12.1) |
| Other, % | 6.4 (7.1) | 8.8 (10.8) | 12.9 (19.8) | 20.0 (33.1) |
| HSA mean median income in $1,000, mean (SD) | 44.6 (11.7) | 52.4 (17.8) | 58.4 (17.1) | 57.5 (15.7) |
| Satisfaction scores (at baseline), mean (SD) | 86.9 (3.1) | 81.4 (1.1) | 77.5 (1.1) | 72.0 (3.2) |
| Satisfaction scores (in 2013), mean (SD) | 85.0 (4.3) | 82.0 (3.4) | 79.7 (3.0) | 77.0 (3.5) |
| Survey response rate (at baseline), mean (SD) | 43.2 (19.8) | 34.5 (9.4) | 32.6 (8.0) | 30.3 (7.8) |
| Survey response rate (20072013), mean (SD) | 32.8 (7.8) | 32.6 (7.5) | 30.8 (6.5) | 29.3 (6.5) |
| Percentage with any insurance in HSA, mean (SD) | 84.0 (5.4) | 84.8 (6.6) | 85.5 (6.3) | 83.9 (6.6) |
| Teaching hospital, N (%) | 42 (9.1) | 155 (28.4) | 277 (40.5) | 274 (46.9%) |
| Acute care hospital beds in HSA (per 1,000), mean (SD) | 3.2 (1.2) | 2.6 (0.8) | 2.5 (0.8) | 2.4 (0.7) |
| Number of physicians in HSA (per 100,000), mean (SD) | 190 (36) | 197 (43) | 204 (47) | 199 (45) |
| Percentage with poverty in HSA, mean (SD)[7] | 16.9 (6.6) | 15.5 (6.5) | 14.4 (5.7) | 15.5 (6.0) |
Using variance component analysis, we found that 23% of the variation in patient satisfaction scores with physician communication was due to differences between states, 52% was due to differences between hospitals within states, and 24% was due to changes over time within a hospital. When examining time trends of satisfaction during the 7‐year period without adjusting for other predictors, we found a statistically significant increasing trend in patient satisfaction with physician communication (0.33% per year; P < 0.001). We also found a significant negative correlation (0.62, P < 0.001) between the random effects for baseline satisfaction (intercept) and change over time (slope), suggesting that initial patient satisfaction with physicians at a hospital was negatively correlated with subsequent change in satisfaction scores during the observation period.
When examining the effect of satisfaction ranking in 2007, hospitals within the lowest quartile of patient satisfaction in 2007 had significantly larger increase in satisfaction scores during the subsequent period as compared to the hospitals in each of the other 3 quartiles (all P < 0.001, Table 2). The difference in the magnitude of the rate of increase in satisfaction scores was greatest between the lowest quartile and the highest quartile (1.10% per year; P < 0.001). In fact, the highest quartile had a statistically significant absolute decrease in patient satisfaction during the observation period (0.23% per year; P < 0.001, Figure 1).
| Variable | Model 1: ; P Value | Model 2: ; P Value | Model 3: ; P Value |
|---|---|---|---|
| |||
| Time (in years) | 0.33; <0.001 | 0.87; <0.001 | 0.89; <0.001 |
| Satisfaction quartiles at baseline | |||
| Highest quartile | 12.1; <0.001 | 10.4; <0.001 | |
| 2nd quartile | 7.9; <0.001 | 7.1; <0.001 | |
| 3rd quartile | 4.5; <0.001 | 4.1; <0.001 | |
| Lowest quartile (REF) | REF | REF | |
| Interaction with time | |||
| Highest quartile | 1.10; <0.001 | 0.94; <0.001 | |
| 2nd quartile | 0.73; <0.001 | 0.71; <0.001 | |
| 3rd quartile | 0.48; <0.001 | 0.47;<0.001 | |
| Survey response rate (%) | 0.12; <0.001 | ||
| Total population, in 10,000 | 0.002; 0.02 | ||
| African American (%) | 0.004; 0.13 | ||
| HSA median Income in $10,000 | 0.02; 0.58 | ||
| Ownership | |||
| Government (REF) | REF | ||
| Nonprofit | 0.01; 0.88 | ||
| For profit | 0.21; 0.11 | ||
| Percentage with insurance in HSA | 0.007; 0.27 | ||
| Acute care beds in HSA (per 1,000) | 0.60; <0.001 | ||
| Physicians in HSA (per 100,000) | 0.003; 0.007 | ||
| Teaching hospital | 0.34; 0.001 | ||
| Percentage in poverty in HSA | 0.01; 0.27 | ||
After adjusting for hospital characteristics and population characteristics of the HSA, the 2007 satisfaction quartiles remained significantly associated with subsequent change in satisfaction scores during the 7‐year observation period (Table 2). In addition, survey response rate, number of physicians, and the number of acute‐care hospital beds within the HSA were positively associated with patient satisfaction, whereas higher HSA population density and being a teaching hospital were negatively associated with patient satisfaction. Using 2008 satisfaction scores as baseline, the results did not change except that the number of physicians in the HSA and being a teaching hospital were no longer associated with satisfaction scores with physicians.
DISCUSSION
Using hierarchical modelling, we have shown that national patient satisfaction scores with physicians have consistently improved since 2007, the year when reporting of satisfaction scores began. We further show that the improvement in satisfaction scores has not been consistent through all hospitals. The largest increase in satisfaction scores was in hospitals that were in the lowest quartile of satisfaction scores in 2007. In contrast, satisfaction scores decreased in hospitals that were in the uppermost quartile of satisfaction scores. The difference between the lowest and uppermost quartile was so large in 2007 that despite the difference in the direction of change in satisfaction scores, hospitals in the uppermost quartile continued to have higher satisfaction scores in 2013 than hospitals in the lowest quartile.
Consistent with our findings for patient satisfaction, other studies have found that public reporting is associated with improvement in healthcare quality measures across nursing homes, physician groups, and hospitals.[12, 13, 14] However, it is unclear how public reporting can change patient satisfaction. The main purpose of public reporting of quality of healthcare measures, such as patient satisfaction with the healthcare they receive, is to generate value by increasing transparency and accountability, thereby increasing the quality of healthcare delivery. Healthcare consumers may also utilize the reported measures to choose providers that deliver high‐quality healthcare. Contrary to expectations, there is very little evidence that consumers choose healthcare facilities based on public reporting, and it is likely that other mechanisms may explain the observed association.[15, 16]
Physicians have historically had low adoption of strategies to improve patient satisfaction and often cite suboptimal data and lack of evidence for data‐driven strategies.[17, 18] Hospitals and healthcare organizations have deployed a broad range of strategies to engage physicians. These include emphasizing relationship between patient satisfaction and patient compliance, complaints and malpractice lawsuits, appealing to physicians' sense of competitiveness by publishing individual provider satisfaction scores, educating physicians on HCAHPS and providing them with regularly updated data, and development of specific techniques for improving patient‐physician interaction.[19, 20, 21, 22, 23, 24] Administrators may also enhance physician engagement by improving physician satisfaction, decreasing their turnover, support development of physicians in administrative leadership roles, and improving financial transparency.[25] Thus, involvement of hospital leadership has been instrumental in encouraging physicians to focus on quality measures including patient satisfaction. Some evidence suggests that public reporting exerts strong influence on hospital leaders for adequate resource allocation, local planning, and improvement efforts.[26, 27, 28]
Perhaps the most intriguing finding in our study is that hospitals in the uppermost quartile of satisfaction scores in 2007 had a statistically significant steady decline in scores during the following period as compared to hospitals in the lowest quartile that had a steady increase. A possible explanation for this finding can be that high‐performing hospitals become complacent and do not invest in developing the effort‐intensive resources required to maintain and improve performance in the physician‐related patient satisfaction domain. These resources may be diverted to competing needs that include addressing improvement efforts for a large number of other publicly reported healthcare quality measures. Thus, an unintended consequence of quality improvement may be that improvement in 1 domain may be at the expense of quality of care in another domain.[29, 30, 31] On the other hand, it is likely that hospitals in the lower quartile see a larger improvement in their scores for the same degree of investment as hospitals in the higher quartiles. It is also likely that hospitals, particularly those in the lowest quartile, develop their individual benchmarks and expend effort that is in line with their perceived need for improvement to achieve their strategic and marketing goals.
Our study has significant implications for the healthcare system, clinical practice, and future research. Whereas public reporting of quality measures is associated with an overall improvement in the reported quality measure, hospitals with high scores may move resources away from that metric or become complacent. Health policy makers need to design policies that encourage all hospitals and providers to perform better or continue to perform well. We further show that differences between hospitals and between local healthcare markets are the biggest factor determining the variation in patient satisfaction with physician communication, and an adjustment in reported score for these factors may be needed. Although local healthcare market factors may not be modifiable, an exchange of knowledge between hospitals with low and high patient satisfaction scores may improve overall satisfaction scores. Similarly, hospitals that are successful in increasing patient satisfaction scores should identify and share useful interventions.
The main strength of our study is that we used data on patient satisfaction with physician communication that were reported annually by most hospitals within the United States. These longitudinal data allowed us to examine not only the effect of public reporting on patient satisfaction with physician communication but also its trend over time. As we had 7 years of data, we were able to eliminate the possibility of regression to mean; an extreme result on first measurement is followed by a second measurement that tends to be closer to the average. Further, we adjusted satisfaction scores based on hospital and local healthcare market characteristics allowing us to compare satisfaction scores across hospitals. However, because units of observation were hospitals and not patients, we could not examine the effect of patient characteristics on satisfaction scores. In addition, HCAHPS surveys have low response rates and may have response and selection bias. Furthermore, we were unable to examine the strategies implemented by hospitals to improve satisfaction scores or the effect of such strategies on satisfaction scores. Data on hospital strategies to increase satisfaction scores are not available for most hospitals and could not have been included in the study.
In summary, we have found that public reporting was followed by an improvement in patient satisfaction scores with physician communication between 2007 and 2013. The rate of improvement was significantly greater in hospitals that had satisfaction scores in the lowest quartiles, whereas hospitals in the highest quartile had a small but statistically significant decline in patient satisfaction scores.
- Centers for Medicare Medicaid Services. Medicare program; hospital outpatient prospective payment system and CY 2007 payment rates; CY 2007 update to the ambulatory surgical center covered procedures list; Medicare administrative contractors; and reporting hospital quality data for FY 2008 inpatient prospective payment system annual payment update program‐‐HCAHPS survey, SCIP, and mortality. Final rule with comment period and final rule. Fed Regist. 2006;71(226):67959–68401.
- , , , , . Development, implementation, and public reporting of the HCAHPS survey. Med Care Res Rev. 2010;67(1):27–37.
- , , , . Comparison of Hospital Consumer Assessment of Healthcare Providers and Systems patient satisfaction scores for specialty hospitals and general medical hospitals: confounding effect of survey response rate. J Hosp Med. 2014;9(9):590–593.
- , , , et al. Hospital survey shows improvements in patient experience. Health Aff (Millwood). 2010;29(11):2061–2067.
- Centers for Medicare 2010:496829.
- , , , , , . The normal liver harbors the vitamin D nuclear receptor in nonparenchymal and biliary epithelial cells. Hepatology. 2003;37(5):1034–1042.
- , . Applied Longitudinal Data Analysis: Modeling Change and Event Occurrence. Oxford, United Kingdom: Oxford University Press; 2003.
- , . Data Analysis Using Regression and Multilevel/Hierarchical Models. Cambridge, United Kingdom: Cambridge University Press; 2007.
- nlme: Linear and Nonlinear Mixed Effects Models [computer program]. Version R package version 2015;3:1–121.
- , , , . Public reporting helped drive quality improvement in outpatient diabetes care among Wisconsin physician groups. Health Aff (Millwood). 2012;31(3):570–577.
- , , , , , . Governing healthcare through performance measurement in Massachusetts and the Netherlands. Health Policy. 2014;116(1):18–26.
- , , . Public reporting drove quality gains at nursing homes. Health Aff (Millwood). 2010;29(9):1706–1713.
- , , . Users of public reports of hospital quality: who, what, why, and how?: An aggregate analysis of 16 online public reporting Web sites and users' and experts' suggestions for improvement. Agency for Healthcare Research and Quality. Available at: http://archive.ahrq.gov/professionals/quality‐patient‐safety/quality‐resources/value/pubreportusers/index.html. Updated December 2011. Accessed April 2, 2015.
- Kaiser Family Foundation. 2008 update on consumers' views of patient safety and quality information. Available at: http://kff.org/health‐reform/poll‐finding/2008‐update‐on‐consumers‐views‐of‐patient‐2/. Published September 30, 2008. Accessed April 2, 2015.
- , . A report card on continuous quality improvement. Milbank Q. 1998;76(4):625–648, 511.
- , , . Assessing the impact of continuous quality improvement on clinical practice: what it will take to accelerate progress. Milbank Q. 1998;76(4):593–624, 510.
- , . Health care competition, strategic mission, and patient satisfaction: research model and propositions. J Health Organ Manag. 2008;22(6):627–641.
- , , . The effects of physician empathy on patient satisfaction and compliance. Eval Health Prof. 2004;27(3):237–251.
- , , , , . Association between vitamin D and hepatitis C virus infection: a meta‐analysis. World J Gastroenterol. 2013;19(35):5917–5924.
- , , , . The relation of patient satisfaction with complaints against physicians and malpractice lawsuits. Am J Med. 2005;118(10):1126–1133.
- , , , , , . Relation of patients' experiences with individual physicians to malpractice risk. Int J Qual Health Care. 2008;20(1):5–12.
- , , , . Association of patient satisfaction with complaints and risk management among emergency physicians. J Emerg Med. 2011;41(4):405–411.
- , , , , . Secrets of physician satisfaction. Study identifies pressure points and reveals life practices of highly satisfied doctors. Physician Exec. 2006;32(6):30–39.
- , , , et al. Attitudes of hospital leaders toward publicly reported measures of health care quality. JAMA Intern Med. 2014;174(12):1904–1911.
- , , , , , . Closing the quality gap: revisiting the state of the science (vol. 5: public reporting as a quality improvement strategy). Evid Rep Technol Assess (Full Rep). 2012(208.5):1–645.
- , , , , . Systematic review: the evidence that publishing patient care performance data improves quality of care. Ann Intern Med. 2008;148(2):111–123.
- , . The unintended consequences of quality improvement. Curr Opin Pediatr. 2009;21(6):777–782.
- , , , et al. Unintended consequences of implementing a national performance measurement system into local practice. J Gen Intern Med. 2012;27(4):405–412.
- , . Quality assessment by external bodies: intended and unintended impact on healthcare delivery. Curr Opin Anaesthesiol. 2009;22(2):237–241.
© 2015 Society of Hospital Medicine
