User login
Is There a Relationship Between Facility Peer Review Findings and Quality in the Veterans Health Administration?
Hospital leaders report the most common aim of peer review (PR) is to improve quality and patient safety, thus it is a potentially powerful quality improvement (QI) driver.1 “When conducted systematically and credibly, peer review for quality management can result in both short-term and long-term improvements in patient care by revealing areas for improvement in the provision of care,” Veterans Health Administration (VHA) Directive 1190 states. “This ultimately contributes to organizational improvements.” At the same time, there are anecdotal concerns that PR may be used punitively and driven by case outcomes rather than by accepted best practices supporting QI.
Studies of the PR process suggest these concerns are valid. A key tenet of QI is standardization. PR is problematic in that regard; studies show poor interrater reliability for judgments on care, as well as hindsight bias—the fact that raters are strongly influenced by the outcome of care, not the process of care.2-5 There are concerns that case selection or review process when not standardized may be wielded as punitive too.6 In this study, we sought to identify the relationship between PR findings and subsequent institution quality metrics. If PR does lead to an improvement in quality, or if quality concerns are managed within the PR committee, it should be possible to identify a measurable relationship between the PR process and a facility’s subsequent quality measures.
A handful of studies describe the association between PR and quality of care. Itri and colleagues noted that random, not standardized PR in radiology does not achieve reductions in diagnostic error rate.7 However, adoption of just culture principles in PR resulted in a significant improvement in facility leaders’ self-reports of quality measures at surveyed institutions.8 The same author reported that increases in PR standardization and integration with performance improvement activities could explain up to 18% of objective quality measure variation.9
We sought to determine whether a specific aspect of the PR process, the PR committee judgment of quality of care by clinicians, was related to medical center quality in a cross-sectional study of 136 Veterans Health Administration (VHA) medical centers. The VHA is a good source of study because there are standardized PR processes and training for committee members and reviewers. Our hypothesis was that medical centers with a higher number of Level 2 (“most experienced and competent clinicians might have managed the case differently”) and Level 3 (“most experienced and competent providers would have managed the case differently”) PR findings would also have lower quality metric scores for processes and outcomes of care.
Methods
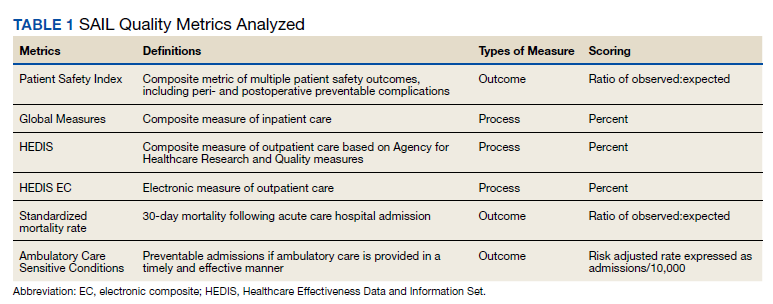
We used PR data from fiscal year 2018 and 2019. VHA PR data are available quarterly and are self-reported by each facility to the VHA Office of Clinical Risk Management. These data are broken down by facility. The following data, when available in both fiscal years 2018 and 2019, were used for this analysis: percent and number of PR that are ranked as level 1, 2, or 3; medical center group (MCG) acuity measure assigned by the VHA (1 is highest, 3 is lowest); and number of PR per 100,000 unique veteran encounters in 2019. Measures of facility quality are drawn from Strategic Analytics for Improvement and Learning (SAIL) data from 2019, which are available quarterly by facility and are rolling for 12 months. SAIL measures processes and outcomes of care. Table 1 indicates which measures are focused on outcomes vs quality processes.
SAS Version 9.2 was used to perform statistical analyses. We used Spearman correlation to estimate the PR and quality relationship.
Results
There were 136 facilities with 2 years of PR data available. The majority of these facilities (89) were highest complexity MCG 1 facilities; 19 were MCG 2, and 28 were MCG 3. Of 13,515 PRs, most of the 9555 PR findings were level 1 (70.7%). The between-facility range of level 2 and 3 findings was large, varying from 3.5% to nearly 70% in 2019 (Table 2). Findings were similar in 2018; facilities level 2 and 3 ratings ranged from 3.6% to 73.5% of all PR findings.
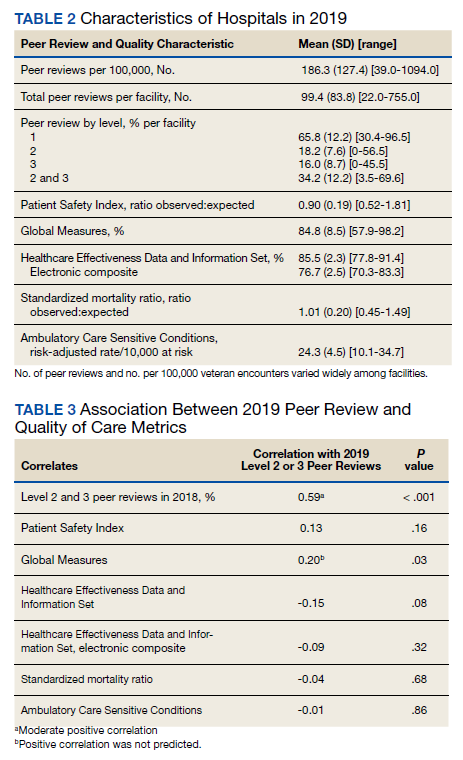
There was no correlation between most quality measures and facility PR findings (Table 3). The only exception was for Global Measures (GM90), an inpatient process of care measure. Unexpectedly, the correlation was positive—facilities with a higher percentage of level 2 and 3 PR findings had better inpatient processes of care SAIL score. The strongest correlation was between 2018 and 2019 PR findings.
Discussion
We hypothesized that a high percentage of level 2 and 3 PR findings would be negatively associated with objective facility measures of care processes in SAIL but we did not see this association. The only quality measure associated with PR findings was GM90, a score of inpatient care processes. However, the association was positive, with better performance associated with more level 2 and 3 PR findings.
The best predictor of the proportion of a facility’s PR findings is the previous year’s PR findings. With an R = 0.59, the previous year findings explain about 35% of the variability in level assignment. Our analysis may describe a new bias in PR, in which committees consistently assign either low or high proportions of level 2 and 3 findings. This correlation could be due to individual PR committee culture or composition, but it does not relate to objective quality measures.
Strengths
For this study we use objective measures of PR processes, the assignment of levels of care.
Limitations
Facilities self-report PR outcomes, so there could be errors in reporting. In addition, this study was cross sectional and not longitudinal and it is possible that change in quality measures over time are correlated with PR findings. Future studies using the VHA PR and SAIL data could evaluate whether changes over time, and perhaps in response to level 2 and 3 findings, would be a more sensitive indicator of the impact of the PR process on quality metrics. Future studies could incorporate the relationship between findings from the All Employee Survey, which is conducted annually, such as psychologic safety, as well as the distance the facility has gone on the high reliability organization journey, with PR findings and SAIL metrics. Finally, PR is focused on the practice of an individual clinician, while SAIL quality metrics reflect facility performance. Interventions possibly stay at the clinician level and do not drive subsequent QI processes.
What does this mean for PR? Since the early 1990s, there have been exhortations from experts to improve PR, by adopting a QI model, or for a deeper integration of PR and QI.1,2,10 Just culture tools, which include QI, are promoted as a means to improve PR.8,11,12 Other studies show PR remains problematic in terms of standardization, incorporation of best practices, redesigning systems of care, or demonstrable improvements to facility safety and care quality.1,4,6,8 Several publications have described interventions to improve PR. Deyo-Svedson discussed a program with standardized training and triggers, much like VHA.13 Itri and colleagues standardized PR in radiology to target areas of known diagnostic error, as well as use the issues assessed in PR to perform QI and education. One example of a successful QI effort involved changing the radiology reporting template to make sure areas that are prone to diagnostic error are addressed.7
Conclusions
Since 35% of PR level variance is correlated with prior year’s results, PR committees should look at increased standardization in reviews and findings. We endorse a strong focus on standardization, application of just culture tools to case reviews, and tighter linkage between process and outcome metrics measured by SAIL and PR case finding. Studies should be performed to pilot interventions to improve the linkage between PR and quality, so that greater and faster gains can be made in quality processes and, leading from this, outcomes. Additionally, future research should investigate why some facilities consistently choose higher or lower PR ratings.
Acknowledgments
We acknowledge Dr. George “Web” Ross for his helpful edits.
1. Edwards MT. In pursuit of quality and safety: an 8-year study of clinical peer review best practices in US hospitals. Int J Qual Health Care. 2018;30(8):602-607. doi:10.1093/intqhc/mzy069
2. Dans PE. Clinical peer Review: burnishing a tarnished icon. Ann Intern Med. 1993;118(7):566-568. doi:10.7326/0003-4819-118-7-199304010-00014
3. Goldman RL. The reliability of peer assessments of quality of care. JAMA. 1992;267(7):958-960. doi:10.1001/jama.1992.03480070074034
4. Swaroop R. Disrupting physician clinical practice peer review. Perm J. 2019;23:18-207. doi:10.7812/TPP/18-207
5. Caplan RA, Posner KL, Cheney FW. Effect of outcome on physician judgments of appropriateness of care. JAMA. 1991;265(15):1957–1960. doi:10.1001/jama.1991.03460150061024
6. Vyas D, Hozain AE. Clinical peer review in the United States: history, legal development and subsequent abuse. World J Gastroenterol. 2014;20(21):6357-6363. doi:10.3748/wjg.v20.i21.6357
7. Itri JN, Donithan A, Patel SH. Random versus nonrandom peer review: a case for more meaningful peer review. J Am Coll Radiol. 2018;15(7):1045-1052. doi:10.1016/j.jacr.2018.03.054
8. Edwards MT. An assessment of the impact of just culture on quality and safety in US hospitals. Am J Med Qual. 2018; 33(5):502-508. doi:10.1177/1062860618768057
9. Edwards MT. The objective impact of clinical peer review on hospital quality and safety. Am J Med Qual. 2011;26(2);110-119. doi:10.1177/1062860610380732
10. Berwick DM. Peer review and quality management: are they compatible?. QRB Qual Rev Bull. 1990;16(7):246-251. doi:10.1016/s0097-5990(16)30377-3
11. Volkar JK, Phrampus P, English D, et al. Institution of just culture physician peer review in an academic medical center. J Patient Saf. 2021;17(7):e689-e693. doi:10.1097/PTS.0000000000000449
12. Burns J, Miller T, Weiss JM, Erdfarb A, Silber D, Goldberg-Stein S. Just culture: practical implementation for radiologist peer review. J Am Coll Radiol. 2019;16(3):384-388. doi:10.1016/j.jacr.2018.10.021
13. Deyo-Svendsen ME, Phillips MR, Albright JK, et al. A systematic approach to clinical peer review in a critical access hospital. Qual Manag Health Care. 2016;25(4):213-218. doi:10.1097/QMH.0000000000000113
Hospital leaders report the most common aim of peer review (PR) is to improve quality and patient safety, thus it is a potentially powerful quality improvement (QI) driver.1 “When conducted systematically and credibly, peer review for quality management can result in both short-term and long-term improvements in patient care by revealing areas for improvement in the provision of care,” Veterans Health Administration (VHA) Directive 1190 states. “This ultimately contributes to organizational improvements.” At the same time, there are anecdotal concerns that PR may be used punitively and driven by case outcomes rather than by accepted best practices supporting QI.
Studies of the PR process suggest these concerns are valid. A key tenet of QI is standardization. PR is problematic in that regard; studies show poor interrater reliability for judgments on care, as well as hindsight bias—the fact that raters are strongly influenced by the outcome of care, not the process of care.2-5 There are concerns that case selection or review process when not standardized may be wielded as punitive too.6 In this study, we sought to identify the relationship between PR findings and subsequent institution quality metrics. If PR does lead to an improvement in quality, or if quality concerns are managed within the PR committee, it should be possible to identify a measurable relationship between the PR process and a facility’s subsequent quality measures.
A handful of studies describe the association between PR and quality of care. Itri and colleagues noted that random, not standardized PR in radiology does not achieve reductions in diagnostic error rate.7 However, adoption of just culture principles in PR resulted in a significant improvement in facility leaders’ self-reports of quality measures at surveyed institutions.8 The same author reported that increases in PR standardization and integration with performance improvement activities could explain up to 18% of objective quality measure variation.9
We sought to determine whether a specific aspect of the PR process, the PR committee judgment of quality of care by clinicians, was related to medical center quality in a cross-sectional study of 136 Veterans Health Administration (VHA) medical centers. The VHA is a good source of study because there are standardized PR processes and training for committee members and reviewers. Our hypothesis was that medical centers with a higher number of Level 2 (“most experienced and competent clinicians might have managed the case differently”) and Level 3 (“most experienced and competent providers would have managed the case differently”) PR findings would also have lower quality metric scores for processes and outcomes of care.
Methods
We used PR data from fiscal year 2018 and 2019. VHA PR data are available quarterly and are self-reported by each facility to the VHA Office of Clinical Risk Management. These data are broken down by facility. The following data, when available in both fiscal years 2018 and 2019, were used for this analysis: percent and number of PR that are ranked as level 1, 2, or 3; medical center group (MCG) acuity measure assigned by the VHA (1 is highest, 3 is lowest); and number of PR per 100,000 unique veteran encounters in 2019. Measures of facility quality are drawn from Strategic Analytics for Improvement and Learning (SAIL) data from 2019, which are available quarterly by facility and are rolling for 12 months. SAIL measures processes and outcomes of care. Table 1 indicates which measures are focused on outcomes vs quality processes.
SAS Version 9.2 was used to perform statistical analyses. We used Spearman correlation to estimate the PR and quality relationship.
Results
There were 136 facilities with 2 years of PR data available. The majority of these facilities (89) were highest complexity MCG 1 facilities; 19 were MCG 2, and 28 were MCG 3. Of 13,515 PRs, most of the 9555 PR findings were level 1 (70.7%). The between-facility range of level 2 and 3 findings was large, varying from 3.5% to nearly 70% in 2019 (Table 2). Findings were similar in 2018; facilities level 2 and 3 ratings ranged from 3.6% to 73.5% of all PR findings.
There was no correlation between most quality measures and facility PR findings (Table 3). The only exception was for Global Measures (GM90), an inpatient process of care measure. Unexpectedly, the correlation was positive—facilities with a higher percentage of level 2 and 3 PR findings had better inpatient processes of care SAIL score. The strongest correlation was between 2018 and 2019 PR findings.
Discussion
We hypothesized that a high percentage of level 2 and 3 PR findings would be negatively associated with objective facility measures of care processes in SAIL but we did not see this association. The only quality measure associated with PR findings was GM90, a score of inpatient care processes. However, the association was positive, with better performance associated with more level 2 and 3 PR findings.
The best predictor of the proportion of a facility’s PR findings is the previous year’s PR findings. With an R = 0.59, the previous year findings explain about 35% of the variability in level assignment. Our analysis may describe a new bias in PR, in which committees consistently assign either low or high proportions of level 2 and 3 findings. This correlation could be due to individual PR committee culture or composition, but it does not relate to objective quality measures.
Strengths
For this study we use objective measures of PR processes, the assignment of levels of care.
Limitations
Facilities self-report PR outcomes, so there could be errors in reporting. In addition, this study was cross sectional and not longitudinal and it is possible that change in quality measures over time are correlated with PR findings. Future studies using the VHA PR and SAIL data could evaluate whether changes over time, and perhaps in response to level 2 and 3 findings, would be a more sensitive indicator of the impact of the PR process on quality metrics. Future studies could incorporate the relationship between findings from the All Employee Survey, which is conducted annually, such as psychologic safety, as well as the distance the facility has gone on the high reliability organization journey, with PR findings and SAIL metrics. Finally, PR is focused on the practice of an individual clinician, while SAIL quality metrics reflect facility performance. Interventions possibly stay at the clinician level and do not drive subsequent QI processes.
What does this mean for PR? Since the early 1990s, there have been exhortations from experts to improve PR, by adopting a QI model, or for a deeper integration of PR and QI.1,2,10 Just culture tools, which include QI, are promoted as a means to improve PR.8,11,12 Other studies show PR remains problematic in terms of standardization, incorporation of best practices, redesigning systems of care, or demonstrable improvements to facility safety and care quality.1,4,6,8 Several publications have described interventions to improve PR. Deyo-Svedson discussed a program with standardized training and triggers, much like VHA.13 Itri and colleagues standardized PR in radiology to target areas of known diagnostic error, as well as use the issues assessed in PR to perform QI and education. One example of a successful QI effort involved changing the radiology reporting template to make sure areas that are prone to diagnostic error are addressed.7
Conclusions
Since 35% of PR level variance is correlated with prior year’s results, PR committees should look at increased standardization in reviews and findings. We endorse a strong focus on standardization, application of just culture tools to case reviews, and tighter linkage between process and outcome metrics measured by SAIL and PR case finding. Studies should be performed to pilot interventions to improve the linkage between PR and quality, so that greater and faster gains can be made in quality processes and, leading from this, outcomes. Additionally, future research should investigate why some facilities consistently choose higher or lower PR ratings.
Acknowledgments
We acknowledge Dr. George “Web” Ross for his helpful edits.
1. Edwards MT. In pursuit of quality and safety: an 8-year study of clinical peer review best practices in US hospitals. Int J Qual Health Care. 2018;30(8):602-607. doi:10.1093/intqhc/mzy069
2. Dans PE. Clinical peer Review: burnishing a tarnished icon. Ann Intern Med. 1993;118(7):566-568. doi:10.7326/0003-4819-118-7-199304010-00014
3. Goldman RL. The reliability of peer assessments of quality of care. JAMA. 1992;267(7):958-960. doi:10.1001/jama.1992.03480070074034
4. Swaroop R. Disrupting physician clinical practice peer review. Perm J. 2019;23:18-207. doi:10.7812/TPP/18-207
5. Caplan RA, Posner KL, Cheney FW. Effect of outcome on physician judgments of appropriateness of care. JAMA. 1991;265(15):1957–1960. doi:10.1001/jama.1991.03460150061024
6. Vyas D, Hozain AE. Clinical peer review in the United States: history, legal development and subsequent abuse. World J Gastroenterol. 2014;20(21):6357-6363. doi:10.3748/wjg.v20.i21.6357
7. Itri JN, Donithan A, Patel SH. Random versus nonrandom peer review: a case for more meaningful peer review. J Am Coll Radiol. 2018;15(7):1045-1052. doi:10.1016/j.jacr.2018.03.054
8. Edwards MT. An assessment of the impact of just culture on quality and safety in US hospitals. Am J Med Qual. 2018; 33(5):502-508. doi:10.1177/1062860618768057
9. Edwards MT. The objective impact of clinical peer review on hospital quality and safety. Am J Med Qual. 2011;26(2);110-119. doi:10.1177/1062860610380732
10. Berwick DM. Peer review and quality management: are they compatible?. QRB Qual Rev Bull. 1990;16(7):246-251. doi:10.1016/s0097-5990(16)30377-3
11. Volkar JK, Phrampus P, English D, et al. Institution of just culture physician peer review in an academic medical center. J Patient Saf. 2021;17(7):e689-e693. doi:10.1097/PTS.0000000000000449
12. Burns J, Miller T, Weiss JM, Erdfarb A, Silber D, Goldberg-Stein S. Just culture: practical implementation for radiologist peer review. J Am Coll Radiol. 2019;16(3):384-388. doi:10.1016/j.jacr.2018.10.021
13. Deyo-Svendsen ME, Phillips MR, Albright JK, et al. A systematic approach to clinical peer review in a critical access hospital. Qual Manag Health Care. 2016;25(4):213-218. doi:10.1097/QMH.0000000000000113
Shared Medical Appointments for Glycemic Management in Rural Veterans
In 2005, the VA mandated shared medical appointments (SMAs) to improve clinic efficiency and quality of care. Both local and national Advanced Clinic Access meetings endorsed this method for decreasing wait times, improving patient outcome measures, and minimizing cost. Additionally, SMAs offer an opportunity to use nonphysician providers to their fullest potential. The VA has recognized the important role nonphysicians play in improving care for patients, especially patients with chronic illnesses, such as diabetes mellitus (DM).1
Based on the chronic care model, SMAs are patient medical appointments in which a multidisciplinary/multiexpertise team of providers sees a group of 8 to 20 patients in a 1.5- to 2-hour visit. Chronic illnesses, such as DM, are right for this approach.1
Diabetes mellitus is the leading cause of kidney failure, nontraumatic lower-limb amputations, and new cases of blindness among adults. It also is a major cause of heart disease and stroke, and the seventh leading cause of death in the U.S. The total cost of diagnosed DM in the U.S. in 2012 was $245 billion compared with $174 billion in 2007.2 Direct medical costs accounted for $176 billion, and $69 billion accounted for indirect costs, such as disability, work loss, and premature mortality.2 After adjusting for population age and sex differences, the average medical expenses among people diagnosed with DM were 2.3 times higher than medical expenses for those without DM. This figure does not include the cost of undiagnosed diabetes, prediabetes, or gestational diabetes.2
The purpose of this quality improvement study is to describe the results of SMA for management of DM conducted largely among rural veterans. The effectiveness of DM SMAs has been documented in several previous studies.3-10 However, this study focuses on using SMAs to manage veterans with DM in a rural environment.
Methods
The authors used the Primary Care Almanac (PCA) of the VHA Support Service Center to identify potential study participants at Lake City VAMC in Florida. The PCA is a database of VA primary care patients. The authors identified patients with hemoglobin A1c (HbA1c) level > 9% through the DM Cohort Reports Menu. Veterans with behavioral issues and those with high no-show rates were excluded.
The clinic staff called the eligible participants, educated them about SMA, and asked whether they would be interested in attending a DM SMA. If interested, they were scheduled for the next SMA. If uninterested, they were offered DM home telehealth follow-up, an appointment with the DM pharmacist, an appointment with the dietitian, enrollment into a DM education class, or routine follow-up with their primary care provider (PCP). Using this method, 18 patients were scheduled for the DM SMA between November 2010 and April 2013.
SMA Procedures
A physician or advanced registered nurse practitioner (ARNP) led each appointment, and in most cases other staff attended, including a clinical pharmacist, physical therapist (PT), kinesiotherapist (KT), dietician, social worker, registered nurse (RN), patient educator, and mental health provider. A pharmacist and RN attended all SMA appointments. The basic format consisted of a 90-minute appointment and included an abbreviated, clothed physical exam, which included vital signs; auscultation of heart, lungs, and abdomen; and foot exam. If a veteran had not received an eye exam within the year, an eye clinic consult was ordered. There were 10- to 30-minute blocks of time for the support staff who attended. The physician or ARNP usually led the appointment, and in addition to speaking to the group and discussing a daily topic, also spoke one-on-one with each veteran while support staff spoke to other group members.
During the appointment, the pharmacist answered questions and reviewed and adjusted medications as needed. The RN educator acted as a transcriptionist and answered questions. The PT/KT led interactive exercises. The dietitian answered questions, gave out educational materials, and did cooking demonstrations. The psychologist discussed behavioral health goals and asked each veteran to set a health goal to evaluate at the next meeting. The nursing staff in the primary care clinic checked in the patients. One nurse checked-in 1 to 2 patients and gave the patient a medication list.
Appointments were held every 2 to 3 months. All veterans attending were invited to come to the next appointment, and new patients were enrolled throughout the study. The new veterans were invited based on HbA1c readings pulled from the PCA database.
Hemoglobin A1c, blood pressure (BP), weight, and lipid level data were collected. Participation ended when HbA1c improved to < 8%, a patient was no longer interested, or after the patient did not show up for an appointment and did not call to cancel.
Results
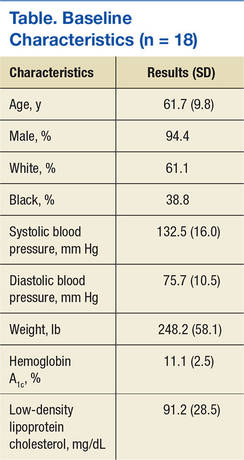
Eighteen patients met the inclusion criteria (Table). Participants mean age was 62 years with most aged 50 to 70 years. Most participants were male (94%) and white (61%). Thirty-nine percent of the participants were African American. Twelve group appointments were held from November 2010 through April 2013. The mean enrollment per session was 5.8 patients (range 3-9). The median number of sessions each patient participated in was 3 (range 1 to 10).
SMA Outcomes
Among the 18 participants, the absolute change in HbA1c was -2.2% ± 2.0, representing a relative decrease in HbA1c of 18.2%. The study criterion for success was either a relative decrease of HbA1c by 13.5% or an absolute decrease in HbA1c of 1.5%. Of 18 patients participating in SMA, 14 (78%) patients achieved this goal. Of the 4 patients that were not successful, 2 patients had a relative HbA1c increase of 13% and 14%, respectively, 1 patient had no change at all, and 1 patient had a 9% relative decrease (Figure). Fourteen patients had improvement in their HbA1c after the first appointment, 2 patients had improvement after the second appointment, 1 patient had improvement after the fourth appointment, and 1 patient had no improvement.
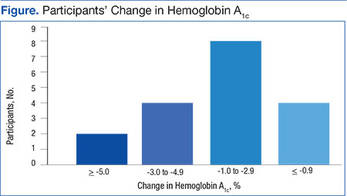
In this population of rural veterans with poorly controlled diabetes, participation in SMAs was associated with marked improvement in measures of glucose control. Fourteen of the 18 (78%) veterans who participated in the DM SMA exhibited clinically significant decreases in HbA1c and achieved the defined goal.
Discussion
The effectiveness of DM SMAs has been documented in several previous studies. Sadur and colleagues found that a 6-month cluster visit group model of care for adults with DM improved glycemic control by 1.3% in the intervention subjects vs 0.2% in the control subjects in a randomized, controlled trial (RCT) with 185 participants.3 The intervention group received multidisciplinary outpatient diabetes management delivered by a diabetes nurse educator, a psychologist, a nutritionist, and a pharmacist in cluster visit settings of 10 to 18 patients per month for 6 months.
Metabolic Control
In another RCT trial of 112 patients, Trento and colleagues found that physician-led group consultations may improve metabolic control in the medium term by inducing more appropriate health behaviors.4 The consultations are feasible in everyday clinical practice without increasing working hours. After 2 years, HbA1c levels remained stable in patients seen in groups but had worsened in control subjects.
In a quasi-experiment with concurrent but nonrandomized controls, Kirsh and colleagues concluded that SMAs for DM constitute a practical system redesign that may help improve quality of care.5 Participants included 44 veterans from a VA primary care clinic who attended at least 1 physician-led SMA from April 2005 to September 2005 and from May 2006 to August 2006. Results showed levels of HbA1c, low-density lipoprotein cholesterol (LDL-C), and systolic BP (SBP) fell significantly postintervention with a mean decrease of HbA1c 1.4%, LDL-C 14.8 mg/dL, and SBP 16.0 mm Hg. The reductions in HbA1c and SBP were greater in the intervention group relative to the control group. The LDL-C reduction also was greater in the intervention group; however, the difference was not statistically significant.
Similarly, Sanchez concluded that patients who participated in a physician and nurse practitioner-led SMA using the diabetes self-management education (DSME) process had improvements in their HbA1c, self-management skills, and satisfaction.6 The study was considered a quality improvement project. Data were collected on 70 patients who were 96% Mexican American and received DSME via SMA during a 3-month span. The average HbA1c on visit 1 was 7.95%, 7.48% on visit 2, and 7.51% on visit 3. There were 34 patients with a decrease in HbA1c on visit 2 and 12 patients with a decrease in HbA1c on visit 3. Also, in a study on the effectiveness of SMAs in DM care, Guirguis and colleagues found that veterans showed an average decline in HbA1c whether they attended 1, 2, 3, or 4 SMAs.7 However, the decline was only statistically significant (P = .02) for those who had a baseline HbA1c > 9% prior to the study.
In contrast, other studies found no significant difference in improvement of DM patients in a SMA vs DM patients not in a SMA. Wagner and colleagues found periodic primary care sessions organized to meet the complex needs of diabetic patients improved the process of diabetes care and were associated with better outcomes.11 Primary care practices with a total of 700 patients were randomized within clinics to either a chronic care clinic (intervention) group or a usual care (control) group. Each chronic care clinic consisted of an assessment; individual visits with the primary care physician, nurse, and clinical pharmacist; and a group educational/peer support session. Although they found that the primary care group sessions improved the process of DM care and were associated with better outcomes, the mean HbA1c levels and cholesterol levels were comparable between the 2 groups.
In a 12-month RCT of 186 diabetic patients, Clancy and colleagues concluded physician and RN co-led group visits can improve the quality of care for diabetic patients, but modifications to the content and style of group visits may be necessary to achieve improved clinical outcomes.12 Results showed at both measurement points, HbA1c, BP, and lipid levels did not differ significantly for patients attending group visits vs those in usual care. Similarly, Edelman and colleaguesfound that provider-run group medical appointments are a potent strategy for improving BP but not HbA1c levels in DM patients in a RCT that compared a group medical appointment intervention with usual care among 239 primary care diabetic patients at the Durham VAMC in North Carolina and Hunter Holmes McGuire VAMC in Richmond, Virginia.10 Of note, the HbA1c levels in the group medical clinics did improve from 9.2% at baseline to a final of 8.3%, whereas the HbA1c level in the usual care group only improved from 9.2 to 8.6%.
Pharmacist-Led SMAs
In comparison to physician or nurse practitioner-led SMA, there also have been studies regarding pharmacist-led group medical appointments that have shown to be beneficial. Taveira and colleagues found that pharmacist-led group medical visits were feasible and efficacious for improving cardiac risk factors in patients with DM.8 This RCT with 118 VA patient participants showed a greater proportion of the intervention group vs the usual care alone group achieved a HbA1c of < 7%, and a SBP < 130 mm Hg.
In a separate study, Taveira and colleagues found that pharmacist-led group SMA visits are effective for glycemic control in patients with DM and depression without a change in depression symptoms.9 This RCT compared standard care and VA Multidisciplinary Education in Diabetes and Intervention for Cardiac Risk Reduction in Depression vs standard care alone in 88 depressed patients with DM with HbA1c > 6.5%. Also, Cohen and colleagues concluded that pharmacist-led group intervention program was an effective and sustainable collaborative care approach to managing DM and reducing associated cardiovascular risks.10 This study was a RCT that compared standard primary care alone to a 6-month pharmacist-led SMA program added to standard primary care. A total of 99 VA patients were included in the final analysis.
Other studies have looked at patient experiences involving SMAs. In a separate study, Cohen and colleagues explored the experiences of veterans who participated in SMAs.14 Veterans reported improvement in their overall health and well-being, improved self-management skills, and satisfaction with the SMA format.
Benefits to Veteran Patients
The SMA revealed the need for improved glycemic control in the participating patients. All the rural veteran patients included in the SMA had uncontrolled DM, which placed them at risk for many other health problems, such as renal failure, lower-limb amputations, blindness, cardiac disease, and stroke. In addition patients were given individual attention from several health care disciplines. Patients received one-on-one care from the physician or ARNP, nurse, pharmacist, dietitian, and psychologist in the same appointment. This arrangement benefited the patients in regard to their health, well-being, time, and money.
Limitations
Limitations of this study included its small sample size (18 patients), age of the patients, and the gender of patients. Patients average age was about 62 years, and most were aged in their 50s to 70s. Only 1 patient was in her 30s. Patients were predominantly male (17 men, 1 woman).
A second limitation was managing other PCP’s patients. It would be beneficial to see the outcomes of this same study if it were led by the patient’s PCP to find out whether the outcomes would be different regarding participation, no-show rates, and decrease in HbA1c.
A third limitation was the absence of information on time and resource use. Clinical staff members took time to prepare and participate in the SMA, and follow-up afterward. However, comparing the SMA with a regular PCP appointment in which an uncontrolled diabetic patient may be referred to diabetic education classes led by nurse educators and/or dietitians, to an individual nutritionist, to an individual clinical pharmacist, and to a behavioral therapist, the SMA may be a time and resource saver.
Conclusion
The study shows the practicality of implementing an effective SMA using a group interdisciplinary team approach to care for rural veterans with DM. The DM SMA may assist in improving quality of care and improve diabetic patients’ blood glucose. The SMA also may benefit patients who are nonadherent by educating them more thoroughly and letting them express themselves or share life experiences with fellow veterans who have the same diagnoses. Future studies are needed to determine the efficacy of DM SMAs especially with patients’ own PCPs.
1. Kirsh S, Watts S, Schaub K, et al. VA shared medical appointments for patients with diabetes: maximizing patient & provider expertise to strengthen care management. U.S. Department of Veterans Affairs website. http://www.queri.research.va.gov/tools/diabetes/shared-med-appt.pdf. Published December 2008. Accessed May 10, 2016.
2. American Diabetes Association. Statistics about diabetes. American Diabetes Association website. http://www.diabetes.org/diabetes-basics/diabetes-statistics. Updated April 1, 2016. Accessed May 14, 2016.
3. Sadur CN, Moline N, Costa M, et al. Diabetes management in a health maintenance organization. Efficacy of care management using cluster visits. Diabetes Care. 1999;22(12):2011-2017.
4. Trento M, Passera P, Tomalino M, et al. Group visits improve metabolic control in type 2 diabetes: a 2-year follow-up. Diabetes Care. 2001;24(6):995-1000.
5. Kirsh S, Watts S, Pascuzzi K, et al. Shared medical appointments based on the chronic care model: a quality improvement project to address the challenges of patients with diabetes with high cardiovascular risk. Qual Saf Health Care. 2007;16(5):349-353.
6. Sanchez I. Implementation of a diabetes self-management education program in primary care for adults using shared medical appointments. Diabetes Educ. 2011;37(3):381-391.
7. Guirguis AB, Lugovich J, Jay J, et al. Improving diabetes control using shared medical appointments. Am J Med. 2013;126(12):1043-1044.
8. Taveira TH, Friedmann PD, Cohen LB, et al. Pharmacist-led group medical appointment model in type 2 diabetes. Diabetes Educ. 2010;36(1):109-117.
9. Taveira TH, Dooley AG, Cohen LB, Khatana SA, Wu WC. Pharmacist-led group medical appointments for the management of type 2 diabetes with comorbid depression in older adults. Ann Pharmacother. 2011;45(11):1346-1355.
10. Cohen LB, Taveira TH, Khatana SA, Dooley AG, Pirraglia PA, Wu WC. Pharmacist-led shared medical appointments for multiple cardiovascular risk reduction in patients with type 2 diabetes. Diabetes Educ. 2011;37(6):801-812.
11. Wagner EH, Grothaus LC, Sandhu N, et al. Chronic care clinics for diabetes in primary care: a system-wide randomized trial. Diabetes Care. 2001;24(4):695-700.
12. Clancy DE, Huang P, Okonofua E, Yeager D, Magruder KM. Group visits: promoting adherence to diabetes guidelines. J Gen Intern Med. 2007;22(5):620-624.
13. Edelman D, Fredrickson SK, Melnyk SD, et al. Medical clinics versus usual care for patients with both diabetes and hypertension: a randomized trial. Ann Intern Med. 2010;152(11):689-696.
14. Cohen S, Hartley S, Mavi J, Vest B, Wilson M. Veteran experiences related to participation in shared medical appointments. Mil Med. 2012;177(11):1287-1292.
In 2005, the VA mandated shared medical appointments (SMAs) to improve clinic efficiency and quality of care. Both local and national Advanced Clinic Access meetings endorsed this method for decreasing wait times, improving patient outcome measures, and minimizing cost. Additionally, SMAs offer an opportunity to use nonphysician providers to their fullest potential. The VA has recognized the important role nonphysicians play in improving care for patients, especially patients with chronic illnesses, such as diabetes mellitus (DM).1
Based on the chronic care model, SMAs are patient medical appointments in which a multidisciplinary/multiexpertise team of providers sees a group of 8 to 20 patients in a 1.5- to 2-hour visit. Chronic illnesses, such as DM, are right for this approach.1
Diabetes mellitus is the leading cause of kidney failure, nontraumatic lower-limb amputations, and new cases of blindness among adults. It also is a major cause of heart disease and stroke, and the seventh leading cause of death in the U.S. The total cost of diagnosed DM in the U.S. in 2012 was $245 billion compared with $174 billion in 2007.2 Direct medical costs accounted for $176 billion, and $69 billion accounted for indirect costs, such as disability, work loss, and premature mortality.2 After adjusting for population age and sex differences, the average medical expenses among people diagnosed with DM were 2.3 times higher than medical expenses for those without DM. This figure does not include the cost of undiagnosed diabetes, prediabetes, or gestational diabetes.2
The purpose of this quality improvement study is to describe the results of SMA for management of DM conducted largely among rural veterans. The effectiveness of DM SMAs has been documented in several previous studies.3-10 However, this study focuses on using SMAs to manage veterans with DM in a rural environment.
Methods
The authors used the Primary Care Almanac (PCA) of the VHA Support Service Center to identify potential study participants at Lake City VAMC in Florida. The PCA is a database of VA primary care patients. The authors identified patients with hemoglobin A1c (HbA1c) level > 9% through the DM Cohort Reports Menu. Veterans with behavioral issues and those with high no-show rates were excluded.
The clinic staff called the eligible participants, educated them about SMA, and asked whether they would be interested in attending a DM SMA. If interested, they were scheduled for the next SMA. If uninterested, they were offered DM home telehealth follow-up, an appointment with the DM pharmacist, an appointment with the dietitian, enrollment into a DM education class, or routine follow-up with their primary care provider (PCP). Using this method, 18 patients were scheduled for the DM SMA between November 2010 and April 2013.
SMA Procedures
A physician or advanced registered nurse practitioner (ARNP) led each appointment, and in most cases other staff attended, including a clinical pharmacist, physical therapist (PT), kinesiotherapist (KT), dietician, social worker, registered nurse (RN), patient educator, and mental health provider. A pharmacist and RN attended all SMA appointments. The basic format consisted of a 90-minute appointment and included an abbreviated, clothed physical exam, which included vital signs; auscultation of heart, lungs, and abdomen; and foot exam. If a veteran had not received an eye exam within the year, an eye clinic consult was ordered. There were 10- to 30-minute blocks of time for the support staff who attended. The physician or ARNP usually led the appointment, and in addition to speaking to the group and discussing a daily topic, also spoke one-on-one with each veteran while support staff spoke to other group members.
During the appointment, the pharmacist answered questions and reviewed and adjusted medications as needed. The RN educator acted as a transcriptionist and answered questions. The PT/KT led interactive exercises. The dietitian answered questions, gave out educational materials, and did cooking demonstrations. The psychologist discussed behavioral health goals and asked each veteran to set a health goal to evaluate at the next meeting. The nursing staff in the primary care clinic checked in the patients. One nurse checked-in 1 to 2 patients and gave the patient a medication list.
Appointments were held every 2 to 3 months. All veterans attending were invited to come to the next appointment, and new patients were enrolled throughout the study. The new veterans were invited based on HbA1c readings pulled from the PCA database.
Hemoglobin A1c, blood pressure (BP), weight, and lipid level data were collected. Participation ended when HbA1c improved to < 8%, a patient was no longer interested, or after the patient did not show up for an appointment and did not call to cancel.
Results
Eighteen patients met the inclusion criteria (Table). Participants mean age was 62 years with most aged 50 to 70 years. Most participants were male (94%) and white (61%). Thirty-nine percent of the participants were African American. Twelve group appointments were held from November 2010 through April 2013. The mean enrollment per session was 5.8 patients (range 3-9). The median number of sessions each patient participated in was 3 (range 1 to 10).
SMA Outcomes
Among the 18 participants, the absolute change in HbA1c was -2.2% ± 2.0, representing a relative decrease in HbA1c of 18.2%. The study criterion for success was either a relative decrease of HbA1c by 13.5% or an absolute decrease in HbA1c of 1.5%. Of 18 patients participating in SMA, 14 (78%) patients achieved this goal. Of the 4 patients that were not successful, 2 patients had a relative HbA1c increase of 13% and 14%, respectively, 1 patient had no change at all, and 1 patient had a 9% relative decrease (Figure). Fourteen patients had improvement in their HbA1c after the first appointment, 2 patients had improvement after the second appointment, 1 patient had improvement after the fourth appointment, and 1 patient had no improvement.
In this population of rural veterans with poorly controlled diabetes, participation in SMAs was associated with marked improvement in measures of glucose control. Fourteen of the 18 (78%) veterans who participated in the DM SMA exhibited clinically significant decreases in HbA1c and achieved the defined goal.
Discussion
The effectiveness of DM SMAs has been documented in several previous studies. Sadur and colleagues found that a 6-month cluster visit group model of care for adults with DM improved glycemic control by 1.3% in the intervention subjects vs 0.2% in the control subjects in a randomized, controlled trial (RCT) with 185 participants.3 The intervention group received multidisciplinary outpatient diabetes management delivered by a diabetes nurse educator, a psychologist, a nutritionist, and a pharmacist in cluster visit settings of 10 to 18 patients per month for 6 months.
Metabolic Control
In another RCT trial of 112 patients, Trento and colleagues found that physician-led group consultations may improve metabolic control in the medium term by inducing more appropriate health behaviors.4 The consultations are feasible in everyday clinical practice without increasing working hours. After 2 years, HbA1c levels remained stable in patients seen in groups but had worsened in control subjects.
In a quasi-experiment with concurrent but nonrandomized controls, Kirsh and colleagues concluded that SMAs for DM constitute a practical system redesign that may help improve quality of care.5 Participants included 44 veterans from a VA primary care clinic who attended at least 1 physician-led SMA from April 2005 to September 2005 and from May 2006 to August 2006. Results showed levels of HbA1c, low-density lipoprotein cholesterol (LDL-C), and systolic BP (SBP) fell significantly postintervention with a mean decrease of HbA1c 1.4%, LDL-C 14.8 mg/dL, and SBP 16.0 mm Hg. The reductions in HbA1c and SBP were greater in the intervention group relative to the control group. The LDL-C reduction also was greater in the intervention group; however, the difference was not statistically significant.
Similarly, Sanchez concluded that patients who participated in a physician and nurse practitioner-led SMA using the diabetes self-management education (DSME) process had improvements in their HbA1c, self-management skills, and satisfaction.6 The study was considered a quality improvement project. Data were collected on 70 patients who were 96% Mexican American and received DSME via SMA during a 3-month span. The average HbA1c on visit 1 was 7.95%, 7.48% on visit 2, and 7.51% on visit 3. There were 34 patients with a decrease in HbA1c on visit 2 and 12 patients with a decrease in HbA1c on visit 3. Also, in a study on the effectiveness of SMAs in DM care, Guirguis and colleagues found that veterans showed an average decline in HbA1c whether they attended 1, 2, 3, or 4 SMAs.7 However, the decline was only statistically significant (P = .02) for those who had a baseline HbA1c > 9% prior to the study.
In contrast, other studies found no significant difference in improvement of DM patients in a SMA vs DM patients not in a SMA. Wagner and colleagues found periodic primary care sessions organized to meet the complex needs of diabetic patients improved the process of diabetes care and were associated with better outcomes.11 Primary care practices with a total of 700 patients were randomized within clinics to either a chronic care clinic (intervention) group or a usual care (control) group. Each chronic care clinic consisted of an assessment; individual visits with the primary care physician, nurse, and clinical pharmacist; and a group educational/peer support session. Although they found that the primary care group sessions improved the process of DM care and were associated with better outcomes, the mean HbA1c levels and cholesterol levels were comparable between the 2 groups.
In a 12-month RCT of 186 diabetic patients, Clancy and colleagues concluded physician and RN co-led group visits can improve the quality of care for diabetic patients, but modifications to the content and style of group visits may be necessary to achieve improved clinical outcomes.12 Results showed at both measurement points, HbA1c, BP, and lipid levels did not differ significantly for patients attending group visits vs those in usual care. Similarly, Edelman and colleaguesfound that provider-run group medical appointments are a potent strategy for improving BP but not HbA1c levels in DM patients in a RCT that compared a group medical appointment intervention with usual care among 239 primary care diabetic patients at the Durham VAMC in North Carolina and Hunter Holmes McGuire VAMC in Richmond, Virginia.10 Of note, the HbA1c levels in the group medical clinics did improve from 9.2% at baseline to a final of 8.3%, whereas the HbA1c level in the usual care group only improved from 9.2 to 8.6%.
Pharmacist-Led SMAs
In comparison to physician or nurse practitioner-led SMA, there also have been studies regarding pharmacist-led group medical appointments that have shown to be beneficial. Taveira and colleagues found that pharmacist-led group medical visits were feasible and efficacious for improving cardiac risk factors in patients with DM.8 This RCT with 118 VA patient participants showed a greater proportion of the intervention group vs the usual care alone group achieved a HbA1c of < 7%, and a SBP < 130 mm Hg.
In a separate study, Taveira and colleagues found that pharmacist-led group SMA visits are effective for glycemic control in patients with DM and depression without a change in depression symptoms.9 This RCT compared standard care and VA Multidisciplinary Education in Diabetes and Intervention for Cardiac Risk Reduction in Depression vs standard care alone in 88 depressed patients with DM with HbA1c > 6.5%. Also, Cohen and colleagues concluded that pharmacist-led group intervention program was an effective and sustainable collaborative care approach to managing DM and reducing associated cardiovascular risks.10 This study was a RCT that compared standard primary care alone to a 6-month pharmacist-led SMA program added to standard primary care. A total of 99 VA patients were included in the final analysis.
Other studies have looked at patient experiences involving SMAs. In a separate study, Cohen and colleagues explored the experiences of veterans who participated in SMAs.14 Veterans reported improvement in their overall health and well-being, improved self-management skills, and satisfaction with the SMA format.
Benefits to Veteran Patients
The SMA revealed the need for improved glycemic control in the participating patients. All the rural veteran patients included in the SMA had uncontrolled DM, which placed them at risk for many other health problems, such as renal failure, lower-limb amputations, blindness, cardiac disease, and stroke. In addition patients were given individual attention from several health care disciplines. Patients received one-on-one care from the physician or ARNP, nurse, pharmacist, dietitian, and psychologist in the same appointment. This arrangement benefited the patients in regard to their health, well-being, time, and money.
Limitations
Limitations of this study included its small sample size (18 patients), age of the patients, and the gender of patients. Patients average age was about 62 years, and most were aged in their 50s to 70s. Only 1 patient was in her 30s. Patients were predominantly male (17 men, 1 woman).
A second limitation was managing other PCP’s patients. It would be beneficial to see the outcomes of this same study if it were led by the patient’s PCP to find out whether the outcomes would be different regarding participation, no-show rates, and decrease in HbA1c.
A third limitation was the absence of information on time and resource use. Clinical staff members took time to prepare and participate in the SMA, and follow-up afterward. However, comparing the SMA with a regular PCP appointment in which an uncontrolled diabetic patient may be referred to diabetic education classes led by nurse educators and/or dietitians, to an individual nutritionist, to an individual clinical pharmacist, and to a behavioral therapist, the SMA may be a time and resource saver.
Conclusion
The study shows the practicality of implementing an effective SMA using a group interdisciplinary team approach to care for rural veterans with DM. The DM SMA may assist in improving quality of care and improve diabetic patients’ blood glucose. The SMA also may benefit patients who are nonadherent by educating them more thoroughly and letting them express themselves or share life experiences with fellow veterans who have the same diagnoses. Future studies are needed to determine the efficacy of DM SMAs especially with patients’ own PCPs.
1. Kirsh S, Watts S, Schaub K, et al. VA shared medical appointments for patients with diabetes: maximizing patient & provider expertise to strengthen care management. U.S. Department of Veterans Affairs website. http://www.queri.research.va.gov/tools/diabetes/shared-med-appt.pdf. Published December 2008. Accessed May 10, 2016.
2. American Diabetes Association. Statistics about diabetes. American Diabetes Association website. http://www.diabetes.org/diabetes-basics/diabetes-statistics. Updated April 1, 2016. Accessed May 14, 2016.
3. Sadur CN, Moline N, Costa M, et al. Diabetes management in a health maintenance organization. Efficacy of care management using cluster visits. Diabetes Care. 1999;22(12):2011-2017.
4. Trento M, Passera P, Tomalino M, et al. Group visits improve metabolic control in type 2 diabetes: a 2-year follow-up. Diabetes Care. 2001;24(6):995-1000.
5. Kirsh S, Watts S, Pascuzzi K, et al. Shared medical appointments based on the chronic care model: a quality improvement project to address the challenges of patients with diabetes with high cardiovascular risk. Qual Saf Health Care. 2007;16(5):349-353.
6. Sanchez I. Implementation of a diabetes self-management education program in primary care for adults using shared medical appointments. Diabetes Educ. 2011;37(3):381-391.
7. Guirguis AB, Lugovich J, Jay J, et al. Improving diabetes control using shared medical appointments. Am J Med. 2013;126(12):1043-1044.
8. Taveira TH, Friedmann PD, Cohen LB, et al. Pharmacist-led group medical appointment model in type 2 diabetes. Diabetes Educ. 2010;36(1):109-117.
9. Taveira TH, Dooley AG, Cohen LB, Khatana SA, Wu WC. Pharmacist-led group medical appointments for the management of type 2 diabetes with comorbid depression in older adults. Ann Pharmacother. 2011;45(11):1346-1355.
10. Cohen LB, Taveira TH, Khatana SA, Dooley AG, Pirraglia PA, Wu WC. Pharmacist-led shared medical appointments for multiple cardiovascular risk reduction in patients with type 2 diabetes. Diabetes Educ. 2011;37(6):801-812.
11. Wagner EH, Grothaus LC, Sandhu N, et al. Chronic care clinics for diabetes in primary care: a system-wide randomized trial. Diabetes Care. 2001;24(4):695-700.
12. Clancy DE, Huang P, Okonofua E, Yeager D, Magruder KM. Group visits: promoting adherence to diabetes guidelines. J Gen Intern Med. 2007;22(5):620-624.
13. Edelman D, Fredrickson SK, Melnyk SD, et al. Medical clinics versus usual care for patients with both diabetes and hypertension: a randomized trial. Ann Intern Med. 2010;152(11):689-696.
14. Cohen S, Hartley S, Mavi J, Vest B, Wilson M. Veteran experiences related to participation in shared medical appointments. Mil Med. 2012;177(11):1287-1292.
VTE Risk in Patients with PICCs
The use of peripherally inserted central catheters (PICCs) to facilitate the administration of intravenous medications and fluids has become commonplace in hospitalized patients. Clinicians often prefer PICCs over other central venous catheters due to their ease of insertion and the perception that PICCs may have lower risks than other central venous catheters. However, recent studies1, 2 have begun to suggest that the benefit derived from these devices can be offset by the development of complications such as upper extremity deep vein thrombosis (UEDVT). Since venous thromboembolism (VTE) in hospitalized patients is associated with increased morbidity, mortality, length of stay, and costs, we sought to determine the rate of VTE in a population of patients who received a PICC solely during their hospital stay.
Methods
Data Collection
This study was a retrospective, electronic chart review of patients who received a PICC while hospitalized between August 1, 2005 and November 1, 2005 at the Methodist University Hospital (MUH), a 652‐bed, urban, university‐affiliated, community hospital in Memphis, TN. Patients were identified through the use of a PICC database that is maintained by the nurses who routinely place the PICCs. The data collected included the date of insertion, the diameter of the catheter, the vein accessed, the position of the catheter tip, and the reason for PICC insertion. These factors as well as demographics were examined to determine whether they were associated with thrombosis. These data were linked with data from the ultrasound laboratory and nuclear medicine/radiology laboratory and with hospital discharge data. Data were recorded by trained research assistants and verified for accuracy by the study investigators. The institutional review board approved the study protocol prior to data collection.
Patients and Outcomes
All adult consecutive patients who had a PICC inserted during the study period and who did not have a UEDVT or pulmonary embolism (PE) at the time of PICC insertion were included in the study.
PICCs were placed using a modified Seldinger technique at the bedside with portable ultrasound guidance. The vessel of choice for insertion was the basilic vein. Confirmation of catheter tip placement in the lower third of the superior vena cava (SVC) was done with chest x‐ray prior to use of the PICC. The PICC manufacturer was Boston Scientific (Vaxcel with PASV; Natick, MA) and normal saline was used for routine flushing of the PICC.
Study Outcomes
Symptomatic UEDVT
A UEDVT was defined as a symptomatic event in the ipsilateral extremity leading to the performance of duplex ultrasonography, which confirmed the diagnosis of UEDVT. Systematic screening for UEDVT was not performed on any patients during the study period. Sonographic diagnosis of UEDVT was based on noncompressibility of a venous segment of the upper arm or the internal jugular vein; absent or reduced flow on Doppler imaging with failure to augment on compression of the arm; or the presence of echogenic material compatible with thrombus in the arm or central venous vasculature on real‐time imaging. Superficial thrombosis was not counted as a UEDVT event.
Symptomatic PE
PE was defined as a symptomatic event prompting the performance of ventilation‐perfusion lung scan or spiral computed tomography (CT). Systematic screening for PE was not done on any patients during the study period. Radiologic diagnosis of PE was not standardized, but intraluminal filling defect of a lobar artery or more proximal pulmonary arterial vasculature on spiral CT, or an abnormal ventilation‐perfusion (V2) scan with a high clinical suspicion for PE must have been noted on the radiology report along with the physician's clinical diagnosis of PE.
Statistical Analyses
The incidence of VTE was reported as the proportion of patients who had a documented event during hospitalization, and also as the number of events per 1000 PICC‐days. Baseline characteristics were assessed as potential risk factors. Differences in proportions were tested with the chi square or Fisher exact test, and differences in means of the continuous variables were tested using the t‐test. Univariate analysis of symptomatic VTE by each potential risk factor was performed using logistic regression. Logistic regression models were used to simultaneously assess the relationship between the baseline factors and the probability of developing a thrombotic event. Using a backward elimination modeling strategy, only factors that maintained a P value of <0.05 were retained in the final model. Odds ratios (ORs) and corresponding 95% confidence intervals (CIs) were calculated. SAS version 8.2 (SAS Institute, Inc., Cary, NC) was used for data analysis.
Results
Patient Demographics and Baseline Characteristics
From August 1, 2005 to November 1, 2005, 954 PICCs were inserted in 777 patients. The demographics and baseline characteristics of the 777 patients are outlined in Table 1. History of cancer was present in 20.21% of the patients. History of VTE was present in 7.02% of the patients. The most common reason for PICC insertion was poor access in 90.6% of the PICCs. The most common medication infused through the PICC was antibiotics in 69.2% and intravenous hydration in 50.1%. The basilic vein was accessed in 90%. The tip location, as determined by chest X‐ray at the time of insertion, was the SVC in 85.3%. PICCs were in situ for an average of 9 days and most were 5‐French (Fr) catheters. The average duration of PICC placement was over 9 days, and the average length of stay slightly exceeded 16 days.
| Patient Characteristics | Study Population |
|---|---|
| |
| Age (years), mean (SD); range | 60.8 (17.8); range, 1999 |
| Gender, n (%) | |
| Women | 465 (59.8) |
| Ethnicity, n (%) | |
| White | 223 (28.6) |
| African American | 543 (69.9) |
| Hispanic | 4 (0.5) |
| Weight (kg), mean (SD); range | 81.0 (25.8); range, 30207 |
| History of cancer, n (%) | 157 (20.21) |
| History of venous thromboembolism, n (%) | 55 (7.07) |
| PICC location, n (%) | |
| Right vein | 538 (69.2) |
| Vein accessed, n (%) | |
| Basilic | 695 (90.0) |
| Cephalic | 39 (5.1) |
| Median | 38 (4.9) |
| PICC reason, n (%)* | |
| Poor access | 704 (90.6) |
| Antibiotic iv. | 377 (69.2) |
| Hydration iv. | 389 (50.1) |
| Irritant drug | 19 (2.5) |
| TPN | 47 (6.1) |
| Chemotherapy | 23 (3.0) |
| Pain medication | 22 (2.8) |
| Blood and blood products | 16 (2.1) |
| Other nonblood | 30 (3.9) |
| PICC tip location, n (%) | |
| Central location | 643 (85.3) |
| Noncentral location | 111 (14.7) |
| Catheter lumen, n (%) | |
| 4Fr | 10 (1.3) |
| 5Fr | 758 (97.5) |
| Other | 9 (1.1) |
| Length of stay (days), mean (SD); range | 16.3 (17.2); range, 1224 |
| PICC days; range | 9.6 (9.0); range, 164 |
Outcomes: VTE
During their hospital stay, 38 patients experienced 1 or more VTEs, yielding an incidence of 4.89% (Table 2). A total of 7444 PICC‐days were recorded for 777 patients. This yields a rate of 5.10 VTEs/1000 PICC‐days. There were 27 patients who had a UEDVT over the 7444 PICC days yielding a rate of 3.65 UEDVT/1000 PICC days. The mean length of stay was 26 days in those with VTE versus 15.8 days in those who did not develop VTE (P < 0.001). Average PICC‐days were also longer in those who developed VTE compared to those who did not (13 days vs. 9; P < 0.001).
| Outcome | n | % |
|---|---|---|
| ||
| Total VTE | 38* | 4.89 |
| Upper extremity thromboses | 31 | 3.99 |
| UEDVT | 27 | 3.47 |
| Superficial upper extremity thrombosis | 4 | 0.51 |
| PE | 8 | 1.03 |
VTE prophylaxis (using enoxaparin or heparin) was administered to 26% of patients from the time of PICC insertion until UEDVT occurred. Only 12.5% of those who developed PE were given VTE prophylaxis. All patients who developed a UEDVT or PE were treated with full anticoagulation except those with contraindications and patients with superficial upper extremity thrombosis. Five of the patients with UEDVT and 2 of the patients with PE died during their hospitalization.
Four of the 8 patients with PICC‐associated PE had bilateral lower extremity ultrasounds performed, and 3 of these were negative. The other 4 patients did not have ultrasounds performed.
Risk Factors
History of VTE was the strongest risk factor for VTE in univariate analysis, patients with a history of VTE being 10 times more likely to develop a PICC‐related VTE event (Table 3). PICC tip location was strongly associated with VTE. A noncentral location of the tip at the time of insertion was associated with a 2.34 (95% CI, 1.15‐4.75) higher risk of developing VTE during the hospitalization stay, compared to a central location (SVC or RA). The duration of PICC use was also associated with an increased risk of developing VTE (OR for a 10‐day increase in duration, 1.40 (95% CI, 1.07‐1.84), as it was the length of hospital stay (OR for a 10‐day increase in duration, 1.18 (95% CI, 1.05‐1.33). The duration of hospital stay was correlated with the duration of PICC use; however, its temporal relationship with a VTE was uncertain, as a prolonged hospital stay could be the consequence of a VTE event in some cases. In the multivariate analysis, history of VTE, PICC tip location, and length of stay retained statistical significance (Table 4); while our data are suggestive for an association with VTE events, the duration of PICC use did not maintain statistical significance, in the presence of PICC tip location. History of VTE remained the strongest risk factor for subsequent VTE (OR, 10.83; 95% CI, 4.89‐23.95); the location of the PICC tip was location highly associated with subsequent VTE (OR, 2.61; 95% CI, 1.28‐5.35).
| Characteristic | Univariate Model OR (95% CI) |
|---|---|
| |
| Age | 1.01 (0.991.03) |
| Gender (male versus female) | 1.06 (0.562.01) |
| Race (nonwhite versus white) | 1.07 (0.532.18) |
| History of cancer | 1.72 (0.823.61) |
| History of VTE | 10.36 (4.8122.34) |
| PICC location: right versus left vein | 1.62 (0.763.44) |
| PICC location | |
| Cephalic | Referent |
| Basilic | 2.29 (0.3117.07) |
| Median | 4.91 (0.5345.97) |
| PICC tip location: (noncentral versus central)* | 2.43 (1.154.75) |
| PICC days (10 days unit) | 1.40 (1.071.84) |
| Length of stay (10 days unit) | 1.18 (1.051.33) |
| Characteristic | Multivariate Model OR (95% CI) |
|---|---|
| |
| History of VTE | 10.83 (4.8923.95) |
| PICC tip location (noncentral versus central)* | 2.61 (1.285.35) |
| Length of stay (10 days unit) | 1.21 (1.071.37) |
Discussion
Overall Findings
Our study is the first to examine both UEDVT and PE rates in hospitalized adult patients with PICC lines. We found that 4.89% of our patients experienced a thromboembolic complication during their hospitalization stay, yielding a rate of 5.1 VTE/1,000 PICC‐days and 3.63 UEDVT/1,000 PICC‐days. These figures are similar to or higher than those reported by other retrospective studies using symptom‐driven ultrasound diagnosis of UEDVT, reporting incidence figures ranging from 2 per 100 patients,3 to 2.47 per 100 patients,4 to 3.7 per 100 patients.5
There are several factors to consider when comparing our findings to previously published studies. First, our study population differs by being older and by including hospitalized patients with both acute and chronic medical illnesses, and with a wider spectrum of PICC indications. Second, the duration of PICC use is known to be associated with the development of symptomatic UEDVT.6 Several published studies do not report the duration of PICC use, thus making the comparison of incidence difficult to interpret. Third, the duration of patient follow‐up influences the likelihood that a symptomatic UEDVT is diagnosed; patient follow‐up time is oftentimes unspecified in some studies, thus making comparisons difficult. In contrast, our study reports the incidence of VTE during a clearly specified time window; ie, hospital stay.
Several studies that reported the incidence per 100 PICCs found incidences ranging from 3.9 per 100 PICCs7 and 4.66 per 100 PICCs.8 Similarly, studies of different patient populations and the use of systematic diagnostic and follow‐up methods have found very high rates of thrombosis (15.4% in a randomized clinical trial [RCT] of total parenteral nutrition [TPN],9 38% with systematic venography to diagnose UEDVT,10 and 64.52% in an RCT of intensive care unit [ICU] patients11).
PE
In the largest study to date of 2063 patients who received a PICC for intravenous antibiotic therapy, it was found that 2.5% developed upper extremity thrombosis; of these, 3.8% also had a positive VQ scan for PE.4 However, this study did not systematically review records for PE in those without upper extremity thrombosis. Our study showed that approximately 1% of those who received a PICC developed a PE during their hospitalization. In 3 of our 8 patients who developed a PE, bilateral lower extremity ultrasounds were negative for PE. None of the subjects who developed PE received ultrasounds of the upper extremities in order to look for deep vein thrombosis (DVT), possibly due to a lack of awareness of PICC‐associated VTE.
Risk Factors
Among the risk factors explored, we found that patients with previous history of a venous thromboembolic event are much more likely to develop a PICC‐related VTE. This is not surprising, as previous VTE has been identified a risk factor.1214 We also found that patients whose PICC was not confirmed to be in the SVC or at the junction of the SVC and the RA, were twice as likely to experience VTE. An increased risk associated with noncentral tip location was reported in 2 previous studies using venography to assess vein condition among infectious disease patients,15 and oncology patients.16 This is biologically plausible, since the smaller diameter vessels may be more conducive to thrombus formation than the SVC or RA. Other factors such as blood flow rate, turbulent flow, and endothelial injury may also play a role. As recognized by the National Association of Vascular Access Networks,17 tip positioning is influenced by catheter length, anthropometric measurements, and anatomical pathways. Central tip location, whenever possible, may be 1 of the few controllable risk factors for UEDVT. Decreasing the hospital‐acquired DVT events has been recognized as an important quality improvement, requiring an increased identification and treatment of high‐risk groups. Such hospital‐based approaches have been suggested as effective.18, 19 Both tip location and history of VTE are identifiable risk factors that may be readily incorporated into specific strategies to decrease hospital‐acquired DVT events.
While previously reported as a risk factor, left‐sided catheter location was not significantly associated with VTE in our study. Our data suggest that the duration of PICC use is associated with the risk of developing a VTE event during hospital stay, yet without reaching statistical significance. In the absence of information regarding the underlying comorbidities and/or reasons for hospitalization, interpretation of PICC line duration remains elusive.
Anticoagulant Prophylaxis
Most of the subjects in our cohort did not receive VTE prophylaxis. The efficacy of anticoagulant prophylaxis for preventing catheter‐associated VTE is controversial. In fact, current guidelines do not support VTE prophylaxis as a means to reduce rates of VTE associated with central venous catheters. Furthermore, recent controlled clinical trials of low‐molecular weight heparins at standard prophylactic doses and low doses of warfarin for VTE prevention in patients with central venous catheters undergoing cancer chemotherapy have not demonstrated reductions in VTE rates.2022 In contrast, a recent meta‐analysis suggests that anticoagulant prophylaxis is effective for preventing all catheter‐associated DVT in patients with central venous catheters, but the effectiveness for preventing symptomatic VTE, including PE, remains uncertain.23
Limitations
The small number of VTE and the lack of control for the underlying disease, concomitant therapy, and anticoagulant prophylaxis limited our ability to identify independent risk factors. Further studies are needed to confirm our finding that 1% of patients who receive a PICC will develop PE.
VTE were identified only when symptoms led to diagnostic testing, so our event rates likely underestimate the true rate of PICC‐associated VTE. It is estimated that subclinical thromboses can be found in 30% to 60% of all central catheters.10, 24 The clinical significance of silent thromboses remains to be established.
Strengths
The Society of Interventional Radiology recommends uniform reporting requirements to assist in study design and outcomes reporting on central venous access devices.25 We adhered to many of these guidelines which may facilitate comparison among studies from different institutions.
Our study is one of the largest studies to asses the rate of thrombosis among inpatients. We used broad eligibility criteria, included consecutive, unselected patients, in a large cohort of patients who were all hospitalized for acute medical illnesses. Furthermore, we used data collection that corroborated data across the entire range of hospital records, and as such we were able to determine accurately the incidence of thrombosis. UEDVT and PE were diagnosed objectively and, unlike previous studies, we also collected information on prophylaxis and treatment of VTE. To our knowledge, our study is the first to document an increased risk of symptomatic UEDVT and PE among acutely ill hospitalized patients who receive PICC.
Prior studies may be less applicable to PICC‐associated VTE in hospitalized patients because the populations included a mix of inpatients and outpatients. Our results may be more applicable to hospitalized patients who receive a PICC because more severely ill patients who are hospitalized may be at higher risk of thrombosis than outpatients. Also, previous studies included some patients who received relatively small, 3‐Fr to 4‐Fr single‐lumen PICCs, whereas the current practice is to insert larger, double‐lumen, 5‐Fr catheters. Today's PICCs may be more likely to result in vessel occlusion, venous stasis, and thrombosis.
In conclusion, we have shown that the incidence of VTE in our study population was 4.89% with a rate of 5.10 VTE/1,000 PICC‐days. There were 27 patients who had a UEDVT over the 7444 PICC days yielding a rate of 365 UEVDVT/1000 PICC days. The most significant predictors of VTE were history of previous VTE and the location of the PICC tip at the time of insertion.
- ,,,.High rate of complications associated with peripherally inserted central venous catheters in patients with solid tumours.Intern Med J.2004;34:234–238.
- ,,.Peripherally inserted central venous catheters are not superior to central venous catheters in the acute care of surgical patients on the ward.World J Surg.2006;30:1605–1619.
- ,,,,.Peripherally inserted central venous catheter‐associated thrombosis: retrospective analysis of clinical risk factors in adult patients.South Med J.2006;99:1073–1077.
- ,,, et al.Venous thrombosis associated with peripherally inserted central catheters: a retrospective analysis of the Cleveland Clinic experience.Clin Infect Dis.2002;34:1179–1183.
- ,,.Peripherally inserted central catheters in the intensive care unit.J Intensive Care Med.1996;11:49–54.
- ,,,,,.The incidence of upper extremity deep venous thrombosis associated with peripherally inserted central catheters in an intensive care unit. [Abstract]. Chest 2003: 69th Annual Meeting of the American College of Chest Physicians; October 25–30, 2003, Orlando, FL;2003.
- ,.Venous thrombosis related to peripherally inserted central catheters.J Vasc Interv Radiol.2000;11:837–840.
- ,,,.Peripherally inserted central catheters: outcome as a function of the operator.J Vasc Interv Radiol.2001;12:723–729.
- ,,,,,.Complications and cost associated with parenteral nutrition delivered to hospitalized patients through either subclavian or peripherally‐inserted central catheters.Clin Nutr.2000;19:237–243.
- ,,, et al.Venous thrombosis associated with the placement of peripherally inserted central catheters.J Vasc Interv Radiol.2000;11:1309–1314.
- ,,,,,.Peripherally inserted central catheter (PICC) associated upper extremity deep venous thrombosis (UEDVT) in critical care setting (abstract). CHEST 2005: 71st Annual Meeting of the American College of Chest Physicians. October 29, 2005 to November 3, 2005, Montreal, Quebec, Canada.
- ,,,.A prospective study of the incidence of deep‐vein thrombosis within a defined urban population.J Intern Med.1992;232:155–160.
- ,,, et al.Upper‐extremity deep vein thrombosis. Risk factors, diagnosis, and complications.Arch Intern Med.1997;157:57–62.
- .Risk factors for venous thrombotic disease.Thromb Haemost.1999;82:610–619.
- ,,.Complications of long arm‐catheters: a randomized trial of central vs peripheral tip location.JPEN J Parenter Enteral Nutr.1996;20:20–24.
- ,,.Tunneled catheter thrombosis: factors related to incidence.Oncol Nurs Forum.1990;17:543–549.
- National Association of Vascular Access Networks.Tip location of peripherally inserted central catheters. NVAS position statement.J Vasc Access Devices.1998;3(2):8–10.
- ,.Improving safety with information technology.N Engl J Med.2003;348:2526–2534.
- ,,.Innovative approaches to increase deep vein thrombosis prophylaxis rate resulting in a decrease in hospital‐acquired deep vein thrombosis at a tertiary‐care teaching hospital.J Hosp Med.2008;3:148–155.
- ,,, et al.Enoxaparin for the prevention of venous thromboembolism associated with central vein catheter: a double‐blind, placebo‐controlled, randomized study in cancer patients.J Clin Oncol.2005;23:4057–4062.
- ,,, et al.Dalteparin for prevention of catheter‐related complications in cancer patients with central venous catheters: final results of a double‐blind, placebo‐controlled phase III trial.Ann Oncol.2006;17:289–296.
- ,,, et al.Randomized placebo‐controlled study of low‐dose warfarin for the prevention of central venous catheter‐associated thrombosis in patients with cancer.J Clin Oncol.2005;23:4063–4069.
- ,,,.Prevention of central venous catheter‐associated thrombosis: a meta‐analysis.Am J Med.2007;120:901e1–e13.
- .Deep venous thrombosis of the upper extremity.Am Fam Physician.1997;55:533–539.
- ,,,.Reporting standards for central venous access.J Vasc Interv Radiol.2003;14:S443–S452.
The use of peripherally inserted central catheters (PICCs) to facilitate the administration of intravenous medications and fluids has become commonplace in hospitalized patients. Clinicians often prefer PICCs over other central venous catheters due to their ease of insertion and the perception that PICCs may have lower risks than other central venous catheters. However, recent studies1, 2 have begun to suggest that the benefit derived from these devices can be offset by the development of complications such as upper extremity deep vein thrombosis (UEDVT). Since venous thromboembolism (VTE) in hospitalized patients is associated with increased morbidity, mortality, length of stay, and costs, we sought to determine the rate of VTE in a population of patients who received a PICC solely during their hospital stay.
Methods
Data Collection
This study was a retrospective, electronic chart review of patients who received a PICC while hospitalized between August 1, 2005 and November 1, 2005 at the Methodist University Hospital (MUH), a 652‐bed, urban, university‐affiliated, community hospital in Memphis, TN. Patients were identified through the use of a PICC database that is maintained by the nurses who routinely place the PICCs. The data collected included the date of insertion, the diameter of the catheter, the vein accessed, the position of the catheter tip, and the reason for PICC insertion. These factors as well as demographics were examined to determine whether they were associated with thrombosis. These data were linked with data from the ultrasound laboratory and nuclear medicine/radiology laboratory and with hospital discharge data. Data were recorded by trained research assistants and verified for accuracy by the study investigators. The institutional review board approved the study protocol prior to data collection.
Patients and Outcomes
All adult consecutive patients who had a PICC inserted during the study period and who did not have a UEDVT or pulmonary embolism (PE) at the time of PICC insertion were included in the study.
PICCs were placed using a modified Seldinger technique at the bedside with portable ultrasound guidance. The vessel of choice for insertion was the basilic vein. Confirmation of catheter tip placement in the lower third of the superior vena cava (SVC) was done with chest x‐ray prior to use of the PICC. The PICC manufacturer was Boston Scientific (Vaxcel with PASV; Natick, MA) and normal saline was used for routine flushing of the PICC.
Study Outcomes
Symptomatic UEDVT
A UEDVT was defined as a symptomatic event in the ipsilateral extremity leading to the performance of duplex ultrasonography, which confirmed the diagnosis of UEDVT. Systematic screening for UEDVT was not performed on any patients during the study period. Sonographic diagnosis of UEDVT was based on noncompressibility of a venous segment of the upper arm or the internal jugular vein; absent or reduced flow on Doppler imaging with failure to augment on compression of the arm; or the presence of echogenic material compatible with thrombus in the arm or central venous vasculature on real‐time imaging. Superficial thrombosis was not counted as a UEDVT event.
Symptomatic PE
PE was defined as a symptomatic event prompting the performance of ventilation‐perfusion lung scan or spiral computed tomography (CT). Systematic screening for PE was not done on any patients during the study period. Radiologic diagnosis of PE was not standardized, but intraluminal filling defect of a lobar artery or more proximal pulmonary arterial vasculature on spiral CT, or an abnormal ventilation‐perfusion (V2) scan with a high clinical suspicion for PE must have been noted on the radiology report along with the physician's clinical diagnosis of PE.
Statistical Analyses
The incidence of VTE was reported as the proportion of patients who had a documented event during hospitalization, and also as the number of events per 1000 PICC‐days. Baseline characteristics were assessed as potential risk factors. Differences in proportions were tested with the chi square or Fisher exact test, and differences in means of the continuous variables were tested using the t‐test. Univariate analysis of symptomatic VTE by each potential risk factor was performed using logistic regression. Logistic regression models were used to simultaneously assess the relationship between the baseline factors and the probability of developing a thrombotic event. Using a backward elimination modeling strategy, only factors that maintained a P value of <0.05 were retained in the final model. Odds ratios (ORs) and corresponding 95% confidence intervals (CIs) were calculated. SAS version 8.2 (SAS Institute, Inc., Cary, NC) was used for data analysis.
Results
Patient Demographics and Baseline Characteristics
From August 1, 2005 to November 1, 2005, 954 PICCs were inserted in 777 patients. The demographics and baseline characteristics of the 777 patients are outlined in Table 1. History of cancer was present in 20.21% of the patients. History of VTE was present in 7.02% of the patients. The most common reason for PICC insertion was poor access in 90.6% of the PICCs. The most common medication infused through the PICC was antibiotics in 69.2% and intravenous hydration in 50.1%. The basilic vein was accessed in 90%. The tip location, as determined by chest X‐ray at the time of insertion, was the SVC in 85.3%. PICCs were in situ for an average of 9 days and most were 5‐French (Fr) catheters. The average duration of PICC placement was over 9 days, and the average length of stay slightly exceeded 16 days.
| Patient Characteristics | Study Population |
|---|---|
| |
| Age (years), mean (SD); range | 60.8 (17.8); range, 1999 |
| Gender, n (%) | |
| Women | 465 (59.8) |
| Ethnicity, n (%) | |
| White | 223 (28.6) |
| African American | 543 (69.9) |
| Hispanic | 4 (0.5) |
| Weight (kg), mean (SD); range | 81.0 (25.8); range, 30207 |
| History of cancer, n (%) | 157 (20.21) |
| History of venous thromboembolism, n (%) | 55 (7.07) |
| PICC location, n (%) | |
| Right vein | 538 (69.2) |
| Vein accessed, n (%) | |
| Basilic | 695 (90.0) |
| Cephalic | 39 (5.1) |
| Median | 38 (4.9) |
| PICC reason, n (%)* | |
| Poor access | 704 (90.6) |
| Antibiotic iv. | 377 (69.2) |
| Hydration iv. | 389 (50.1) |
| Irritant drug | 19 (2.5) |
| TPN | 47 (6.1) |
| Chemotherapy | 23 (3.0) |
| Pain medication | 22 (2.8) |
| Blood and blood products | 16 (2.1) |
| Other nonblood | 30 (3.9) |
| PICC tip location, n (%) | |
| Central location | 643 (85.3) |
| Noncentral location | 111 (14.7) |
| Catheter lumen, n (%) | |
| 4Fr | 10 (1.3) |
| 5Fr | 758 (97.5) |
| Other | 9 (1.1) |
| Length of stay (days), mean (SD); range | 16.3 (17.2); range, 1224 |
| PICC days; range | 9.6 (9.0); range, 164 |
Outcomes: VTE
During their hospital stay, 38 patients experienced 1 or more VTEs, yielding an incidence of 4.89% (Table 2). A total of 7444 PICC‐days were recorded for 777 patients. This yields a rate of 5.10 VTEs/1000 PICC‐days. There were 27 patients who had a UEDVT over the 7444 PICC days yielding a rate of 3.65 UEDVT/1000 PICC days. The mean length of stay was 26 days in those with VTE versus 15.8 days in those who did not develop VTE (P < 0.001). Average PICC‐days were also longer in those who developed VTE compared to those who did not (13 days vs. 9; P < 0.001).
| Outcome | n | % |
|---|---|---|
| ||
| Total VTE | 38* | 4.89 |
| Upper extremity thromboses | 31 | 3.99 |
| UEDVT | 27 | 3.47 |
| Superficial upper extremity thrombosis | 4 | 0.51 |
| PE | 8 | 1.03 |
VTE prophylaxis (using enoxaparin or heparin) was administered to 26% of patients from the time of PICC insertion until UEDVT occurred. Only 12.5% of those who developed PE were given VTE prophylaxis. All patients who developed a UEDVT or PE were treated with full anticoagulation except those with contraindications and patients with superficial upper extremity thrombosis. Five of the patients with UEDVT and 2 of the patients with PE died during their hospitalization.
Four of the 8 patients with PICC‐associated PE had bilateral lower extremity ultrasounds performed, and 3 of these were negative. The other 4 patients did not have ultrasounds performed.
Risk Factors
History of VTE was the strongest risk factor for VTE in univariate analysis, patients with a history of VTE being 10 times more likely to develop a PICC‐related VTE event (Table 3). PICC tip location was strongly associated with VTE. A noncentral location of the tip at the time of insertion was associated with a 2.34 (95% CI, 1.15‐4.75) higher risk of developing VTE during the hospitalization stay, compared to a central location (SVC or RA). The duration of PICC use was also associated with an increased risk of developing VTE (OR for a 10‐day increase in duration, 1.40 (95% CI, 1.07‐1.84), as it was the length of hospital stay (OR for a 10‐day increase in duration, 1.18 (95% CI, 1.05‐1.33). The duration of hospital stay was correlated with the duration of PICC use; however, its temporal relationship with a VTE was uncertain, as a prolonged hospital stay could be the consequence of a VTE event in some cases. In the multivariate analysis, history of VTE, PICC tip location, and length of stay retained statistical significance (Table 4); while our data are suggestive for an association with VTE events, the duration of PICC use did not maintain statistical significance, in the presence of PICC tip location. History of VTE remained the strongest risk factor for subsequent VTE (OR, 10.83; 95% CI, 4.89‐23.95); the location of the PICC tip was location highly associated with subsequent VTE (OR, 2.61; 95% CI, 1.28‐5.35).
| Characteristic | Univariate Model OR (95% CI) |
|---|---|
| |
| Age | 1.01 (0.991.03) |
| Gender (male versus female) | 1.06 (0.562.01) |
| Race (nonwhite versus white) | 1.07 (0.532.18) |
| History of cancer | 1.72 (0.823.61) |
| History of VTE | 10.36 (4.8122.34) |
| PICC location: right versus left vein | 1.62 (0.763.44) |
| PICC location | |
| Cephalic | Referent |
| Basilic | 2.29 (0.3117.07) |
| Median | 4.91 (0.5345.97) |
| PICC tip location: (noncentral versus central)* | 2.43 (1.154.75) |
| PICC days (10 days unit) | 1.40 (1.071.84) |
| Length of stay (10 days unit) | 1.18 (1.051.33) |
| Characteristic | Multivariate Model OR (95% CI) |
|---|---|
| |
| History of VTE | 10.83 (4.8923.95) |
| PICC tip location (noncentral versus central)* | 2.61 (1.285.35) |
| Length of stay (10 days unit) | 1.21 (1.071.37) |
Discussion
Overall Findings
Our study is the first to examine both UEDVT and PE rates in hospitalized adult patients with PICC lines. We found that 4.89% of our patients experienced a thromboembolic complication during their hospitalization stay, yielding a rate of 5.1 VTE/1,000 PICC‐days and 3.63 UEDVT/1,000 PICC‐days. These figures are similar to or higher than those reported by other retrospective studies using symptom‐driven ultrasound diagnosis of UEDVT, reporting incidence figures ranging from 2 per 100 patients,3 to 2.47 per 100 patients,4 to 3.7 per 100 patients.5
There are several factors to consider when comparing our findings to previously published studies. First, our study population differs by being older and by including hospitalized patients with both acute and chronic medical illnesses, and with a wider spectrum of PICC indications. Second, the duration of PICC use is known to be associated with the development of symptomatic UEDVT.6 Several published studies do not report the duration of PICC use, thus making the comparison of incidence difficult to interpret. Third, the duration of patient follow‐up influences the likelihood that a symptomatic UEDVT is diagnosed; patient follow‐up time is oftentimes unspecified in some studies, thus making comparisons difficult. In contrast, our study reports the incidence of VTE during a clearly specified time window; ie, hospital stay.
Several studies that reported the incidence per 100 PICCs found incidences ranging from 3.9 per 100 PICCs7 and 4.66 per 100 PICCs.8 Similarly, studies of different patient populations and the use of systematic diagnostic and follow‐up methods have found very high rates of thrombosis (15.4% in a randomized clinical trial [RCT] of total parenteral nutrition [TPN],9 38% with systematic venography to diagnose UEDVT,10 and 64.52% in an RCT of intensive care unit [ICU] patients11).
PE
In the largest study to date of 2063 patients who received a PICC for intravenous antibiotic therapy, it was found that 2.5% developed upper extremity thrombosis; of these, 3.8% also had a positive VQ scan for PE.4 However, this study did not systematically review records for PE in those without upper extremity thrombosis. Our study showed that approximately 1% of those who received a PICC developed a PE during their hospitalization. In 3 of our 8 patients who developed a PE, bilateral lower extremity ultrasounds were negative for PE. None of the subjects who developed PE received ultrasounds of the upper extremities in order to look for deep vein thrombosis (DVT), possibly due to a lack of awareness of PICC‐associated VTE.
Risk Factors
Among the risk factors explored, we found that patients with previous history of a venous thromboembolic event are much more likely to develop a PICC‐related VTE. This is not surprising, as previous VTE has been identified a risk factor.1214 We also found that patients whose PICC was not confirmed to be in the SVC or at the junction of the SVC and the RA, were twice as likely to experience VTE. An increased risk associated with noncentral tip location was reported in 2 previous studies using venography to assess vein condition among infectious disease patients,15 and oncology patients.16 This is biologically plausible, since the smaller diameter vessels may be more conducive to thrombus formation than the SVC or RA. Other factors such as blood flow rate, turbulent flow, and endothelial injury may also play a role. As recognized by the National Association of Vascular Access Networks,17 tip positioning is influenced by catheter length, anthropometric measurements, and anatomical pathways. Central tip location, whenever possible, may be 1 of the few controllable risk factors for UEDVT. Decreasing the hospital‐acquired DVT events has been recognized as an important quality improvement, requiring an increased identification and treatment of high‐risk groups. Such hospital‐based approaches have been suggested as effective.18, 19 Both tip location and history of VTE are identifiable risk factors that may be readily incorporated into specific strategies to decrease hospital‐acquired DVT events.
While previously reported as a risk factor, left‐sided catheter location was not significantly associated with VTE in our study. Our data suggest that the duration of PICC use is associated with the risk of developing a VTE event during hospital stay, yet without reaching statistical significance. In the absence of information regarding the underlying comorbidities and/or reasons for hospitalization, interpretation of PICC line duration remains elusive.
Anticoagulant Prophylaxis
Most of the subjects in our cohort did not receive VTE prophylaxis. The efficacy of anticoagulant prophylaxis for preventing catheter‐associated VTE is controversial. In fact, current guidelines do not support VTE prophylaxis as a means to reduce rates of VTE associated with central venous catheters. Furthermore, recent controlled clinical trials of low‐molecular weight heparins at standard prophylactic doses and low doses of warfarin for VTE prevention in patients with central venous catheters undergoing cancer chemotherapy have not demonstrated reductions in VTE rates.2022 In contrast, a recent meta‐analysis suggests that anticoagulant prophylaxis is effective for preventing all catheter‐associated DVT in patients with central venous catheters, but the effectiveness for preventing symptomatic VTE, including PE, remains uncertain.23
Limitations
The small number of VTE and the lack of control for the underlying disease, concomitant therapy, and anticoagulant prophylaxis limited our ability to identify independent risk factors. Further studies are needed to confirm our finding that 1% of patients who receive a PICC will develop PE.
VTE were identified only when symptoms led to diagnostic testing, so our event rates likely underestimate the true rate of PICC‐associated VTE. It is estimated that subclinical thromboses can be found in 30% to 60% of all central catheters.10, 24 The clinical significance of silent thromboses remains to be established.
Strengths
The Society of Interventional Radiology recommends uniform reporting requirements to assist in study design and outcomes reporting on central venous access devices.25 We adhered to many of these guidelines which may facilitate comparison among studies from different institutions.
Our study is one of the largest studies to asses the rate of thrombosis among inpatients. We used broad eligibility criteria, included consecutive, unselected patients, in a large cohort of patients who were all hospitalized for acute medical illnesses. Furthermore, we used data collection that corroborated data across the entire range of hospital records, and as such we were able to determine accurately the incidence of thrombosis. UEDVT and PE were diagnosed objectively and, unlike previous studies, we also collected information on prophylaxis and treatment of VTE. To our knowledge, our study is the first to document an increased risk of symptomatic UEDVT and PE among acutely ill hospitalized patients who receive PICC.
Prior studies may be less applicable to PICC‐associated VTE in hospitalized patients because the populations included a mix of inpatients and outpatients. Our results may be more applicable to hospitalized patients who receive a PICC because more severely ill patients who are hospitalized may be at higher risk of thrombosis than outpatients. Also, previous studies included some patients who received relatively small, 3‐Fr to 4‐Fr single‐lumen PICCs, whereas the current practice is to insert larger, double‐lumen, 5‐Fr catheters. Today's PICCs may be more likely to result in vessel occlusion, venous stasis, and thrombosis.
In conclusion, we have shown that the incidence of VTE in our study population was 4.89% with a rate of 5.10 VTE/1,000 PICC‐days. There were 27 patients who had a UEDVT over the 7444 PICC days yielding a rate of 365 UEVDVT/1000 PICC days. The most significant predictors of VTE were history of previous VTE and the location of the PICC tip at the time of insertion.
- ,,,.High rate of complications associated with peripherally inserted central venous catheters in patients with solid tumours.Intern Med J.2004;34:234–238.
- ,,.Peripherally inserted central venous catheters are not superior to central venous catheters in the acute care of surgical patients on the ward.World J Surg.2006;30:1605–1619.
- ,,,,.Peripherally inserted central venous catheter‐associated thrombosis: retrospective analysis of clinical risk factors in adult patients.South Med J.2006;99:1073–1077.
- ,,, et al.Venous thrombosis associated with peripherally inserted central catheters: a retrospective analysis of the Cleveland Clinic experience.Clin Infect Dis.2002;34:1179–1183.
- ,,.Peripherally inserted central catheters in the intensive care unit.J Intensive Care Med.1996;11:49–54.
- ,,,,,.The incidence of upper extremity deep venous thrombosis associated with peripherally inserted central catheters in an intensive care unit. [Abstract]. Chest 2003: 69th Annual Meeting of the American College of Chest Physicians; October 25–30, 2003, Orlando, FL;2003.
- ,.Venous thrombosis related to peripherally inserted central catheters.J Vasc Interv Radiol.2000;11:837–840.
- ,,,.Peripherally inserted central catheters: outcome as a function of the operator.J Vasc Interv Radiol.2001;12:723–729.
- ,,,,,.Complications and cost associated with parenteral nutrition delivered to hospitalized patients through either subclavian or peripherally‐inserted central catheters.Clin Nutr.2000;19:237–243.
- ,,, et al.Venous thrombosis associated with the placement of peripherally inserted central catheters.J Vasc Interv Radiol.2000;11:1309–1314.
- ,,,,,.Peripherally inserted central catheter (PICC) associated upper extremity deep venous thrombosis (UEDVT) in critical care setting (abstract). CHEST 2005: 71st Annual Meeting of the American College of Chest Physicians. October 29, 2005 to November 3, 2005, Montreal, Quebec, Canada.
- ,,,.A prospective study of the incidence of deep‐vein thrombosis within a defined urban population.J Intern Med.1992;232:155–160.
- ,,, et al.Upper‐extremity deep vein thrombosis. Risk factors, diagnosis, and complications.Arch Intern Med.1997;157:57–62.
- .Risk factors for venous thrombotic disease.Thromb Haemost.1999;82:610–619.
- ,,.Complications of long arm‐catheters: a randomized trial of central vs peripheral tip location.JPEN J Parenter Enteral Nutr.1996;20:20–24.
- ,,.Tunneled catheter thrombosis: factors related to incidence.Oncol Nurs Forum.1990;17:543–549.
- National Association of Vascular Access Networks.Tip location of peripherally inserted central catheters. NVAS position statement.J Vasc Access Devices.1998;3(2):8–10.
- ,.Improving safety with information technology.N Engl J Med.2003;348:2526–2534.
- ,,.Innovative approaches to increase deep vein thrombosis prophylaxis rate resulting in a decrease in hospital‐acquired deep vein thrombosis at a tertiary‐care teaching hospital.J Hosp Med.2008;3:148–155.
- ,,, et al.Enoxaparin for the prevention of venous thromboembolism associated with central vein catheter: a double‐blind, placebo‐controlled, randomized study in cancer patients.J Clin Oncol.2005;23:4057–4062.
- ,,, et al.Dalteparin for prevention of catheter‐related complications in cancer patients with central venous catheters: final results of a double‐blind, placebo‐controlled phase III trial.Ann Oncol.2006;17:289–296.
- ,,, et al.Randomized placebo‐controlled study of low‐dose warfarin for the prevention of central venous catheter‐associated thrombosis in patients with cancer.J Clin Oncol.2005;23:4063–4069.
- ,,,.Prevention of central venous catheter‐associated thrombosis: a meta‐analysis.Am J Med.2007;120:901e1–e13.
- .Deep venous thrombosis of the upper extremity.Am Fam Physician.1997;55:533–539.
- ,,,.Reporting standards for central venous access.J Vasc Interv Radiol.2003;14:S443–S452.
Copyright © 2009 Society of Hospital Medicine