User login
Interhospital Transfer Patients
Interhospital transfers (IHTs) to academic medical centers (AMCs) or their affiliated hospitals may benefit patients who require unique specialty and procedural services. However, IHTs also introduce a potentially risky transition of care for patients suffering from complex or unstable medical problems.[1] Components of this risk include the dangers associated with transportation and the disrupted continuity of care that may lead to delays or errors in care.[2, 3] Furthermore, referring and accepting providers may face barriers to optimal handoffs including a lack of shared communication standards and difficulty accessing external medical records.[3, 4, 5] Although some authors have recommended the creation of formal guidelines for interhospital transfer processes for all patients to mitigate the risks of transfer, the available guidelines governing the IHT triage and communication process are limited to critically ill patients.[6]
A recent study of a diverse patient and hospital dataset demonstrated that interhospital transfer patients have a higher risk of mortality, increased length of stay (LOS), and increased risk of adverse events as compared with non‐transfer patients.[7] However, it is unknown if these findings persist in the population of patients transferred specifically to AMCs or their affiliated hospitals (the combination is hereafter referred to as academic health systems [AHSs]). AMCs provide a disproportionate share of IHT care for complex patients and have a vested interest in improving the outcomes of these transitions.[8] Prior single‐center studies of acute care adult medical patients accepted to AMCs have shown that IHT is associated with a longer LOS, increased in‐hospital mortality, and higher resource use.[9, 10] However, it is difficult to generalize from single‐center studies due to the variation in referral practices, geography, and network characteristics. Additionally, AMC referral systems, patient mix, and utilization of hospitalists have likely changed substantially in the nearly 2 decades since those reports were published.
Hospitalists and general internists often manage the transfer acceptance processes for internal medicine services at receiving hospitals, helping to triage and coordinate care for IHT patients. As a result, it is important for hospitalists to understand the characteristics and outcomes of the IHT population. In addition to informing the decision making around transfer for a given patient, such an understanding is the foundation for helping providers and institutions begin to systematically identify and mitigate peritransfer risks.
We conducted this large multicenter study to describe the characteristics and outcomes of a current, nationally representative IHT patient population discharged by hospitalists and general internists at AHSs. To identify unique features of the IHT population, we compared patients transferred from another hospital to an AHS to those admitted to the AHS directly from the AHS's emergency department (ED). Based on our anecdotal experiences and the prior single‐center study findings in adult medical populations,[9, 10] we hypothesized that the IHT population would be sicker, stay in the hospital and intensive care unit (ICU) longer, and have higher costs and in‐hospital mortality than ED patients. Although there may be fundamental differences between the 2 groups related to disease and patient condition, we hypothesized that outcome differences would persist even after adjusting for patient factors such as demographics, disease‐specific risk of mortality, and ICU utilization.
PATIENTS AND METHODS
We conducted a retrospective cohort study using data from the University HealthSystem Consortium (UHC) Clinical Database and Resource Manager (CDB/RM). UHC is an alliance of 120 academic medical centers and 300 of their affiliated hospitals for the purposes of collaboration on performance improvement. Each year, a subset of participating hospitals submits data on all of their inpatient discharges to the CDB/RM, which totals approximately 5 million records. The CDB/RM includes information from billing forms including demographics, diagnoses, and procedures as captured by International Classification of Diseases, Ninth Revision (ICD‐9) codes, discharge disposition, and line item charge detail for the type of bed (eg, floor, ICU). Most hospitals also provide detailed charge information including pharmacy, imaging, blood products, lab tests, and supplies. Some hospitals do not provide any charge data. The Beth Israel Deaconess Medical Center and University of Washington institutional review boards reviewed and approved the conduct of this study.
We included all inpatients discharged by hospitalists or general internal medicine physicians from UHC hospitals between April 1, 2011 and March 31, 2012. We excluded minors, pregnant patients, and prisoners. One hundred fifty‐eight adult academic medical centers and affiliated hospitals submitted data throughout this time period. Our primary independent variable, IHT status, was defined by patients whose admission source was another acute care institution. ED admissions were defined as patients admitted from the AHS ED whose source of origination was not another hospital or ambulatory surgery site.
Admission Characteristics
Admission characteristics of interest included age, gender, insurance status, the most common diagnoses in each cohort based on Medicare Severity Diagnosis‐Related Group (MS‐DRG), the most common Agency for Healthcare Research and Quality (AHRQ) comorbitidies,[11] the most common procedures, and the admission 3M All‐Patient Refined Diagnosis‐Related Group (APR‐DRG) risk of mortality (ROM) scores. 3M APR‐DRG ROM scores are proprietary categorical measures specific to the base APR‐DRG to which a patient is assigned, which are calculated using data available at the time of admission, including comorbid condition diagnosis codes, age, procedure codes, and principal diagnosis codes. A patient can fall into 1 of 4 categories with this score: minor, moderate, major, or extreme.[12]
Outcomes
Our primary outcome of interest was in‐hospital mortality. Secondary outcomes included LOS, the cost of care, ICU utilization, and discharge destination. The cost of care is a standardized estimate of the direct costs based on an adjustment of the charges submitted by CDB/RM participants. If an IHT is triaged through a receiving hospital's ED, the cost of care reflects those charges as well as the inpatient charges.
Statistical Analysis
We used descriptive statistics to characterize the IHT and ED patient populations. For bivariate comparisons of continuous variables, 2‐sample t tests with unequal variance were used. For categorical variables, 2 analysis was performed. We assessed the impact of IHT status on in‐hospital mortality using logistic regression to estimate unadjusted and adjusted relative risks, 95% confidence intervals (CIs), and P values. We included age, gender, insurance status, race, timing of ICU utilization, and 3M APR‐DRG ROM scores as independent variables. Prior studies have used this type of risk‐adjustment methodology with 3M APR‐DRG ROM scores,[13, 14, 15] including with interhospital transfer patients.[16] For all comparisons, a P value of <0.05 was considered statistically significant. Our sample size was determined by the data available for the 1‐year period.
Subgroup Analyses
We performed a stratified analysis based on the timing of ICU transfer to allow for additional comparisons of mortality within more homogeneous patient groups, and to control for the possibility that delays in ICU transfer could explain the association between IHT and in‐hospital mortality. We determined whether and when a patient spent time in the ICU based on daily accommodation charges. If a patient was charged for an ICU bed on the day of admission, we coded them as a direct ICU admission, and if the first ICU bed charge was on a subsequent day, they were coded as a delayed ICU admission. Approximately 20% of patients did not have the data necessary to determine the timing of ICU utilization, because the hospitals where they received care did not submit detailed charge data to the UHC.
Data analysis was performed by the UHC. Analysis was performed using Stata version 10 (StataCorp, College Station, TX). For all comparisons, a P value of <0.05 was considered significant.
RESULTS
Patient Characteristics
We identified 885,392 patients who met study criteria: 75,524 patients admitted as an IHT and 809,868 patients admitted from the ED. The proportion of each hospital's admissions that were IHTs that met our study criteria varied widely (median 9%, 25th percentile 3%, 75th percentile 14%). The average age and gender of the IHT and ED populations were similar and reflective of a nationally representative adult inpatient sample (Table 1). Racial compositions of the populations were notable for a higher portion of black patients in the ED admission group than the IHT group (25.4% vs 13.2%, P < 0.001). A slightly higher portion of the IHT population was covered by commercial insurance compared with the ED admissions (22.7% vs 19.1%, P < 0.001).
| Demographic/Clinical Variables | ED | IHT | ||||
|---|---|---|---|---|---|---|
| 1st | 2nd | 3rd | 4th | Rank | ||
| ||||||
| No. of patients | 809,868 | 91.5 | 75,524 | 8.5 | ||
| Age, y | 62.2 19.1 | 60.2 18.2 | ||||
| Male | 381,563 | 47.1 | 38,850 | 51.4 | ||
| Female | 428,303 | 52.9 | 36,672 | 48.6 | ||
| Race | ||||||
| White | 492,894 | 60.9 | 54,780 | 72.5 | ||
| Black | 205,309 | 25.4 | 9,968 | 13.2 | ||
| Other | 66,709 | 8.1 | 7,777 | 10.3 | ||
| Hispanic | 44,956 | 5.6 | 2,999 | 4.0 | ||
| Primary payer | ||||||
| Commercial | 154,826 | 19.1 | 17,130 | 22.7 | ||
| Medicaid | 193,585 | 23.9 | 15,924 | 21.1 | ||
| Medicare | 445,227 | 55.0 | 39,301 | 52.0 | ||
| Other | 16,230 | 2.0 | 3,169 | 4.2 | ||
| Most common MS‐DRGs (top 5 for each group) | ||||||
| Esophagitis, gastroenteritis, and miscellaneous digest disorders without MCC | 34,116 | 4.2 | 1st | 1,517 | 2.1 | 2nd |
| Septicemia or severe sepsis without MV 96+ hours with MCC | 25,710 | 3.2 | 2nd | 2,625 | 3.7 | 1st |
| Cellulitis without MCC | 21,686 | 2.7 | 3rd | 871 | 1.2 | 8th |
| Kidney and urinary tract infections without MCC | 19,937 | 2.5 | 4th | 631 | 0.9 | 21st |
| Chest pain | 18,056 | 2.2 | 5th | 495 | 0.7 | 34th |
| Renal failure with CC | 15,478 | 1.9 | 9th | 1,018 | 1.4 | 5th |
| GI hemorrhage with CC | 12,855 | 1.6 | 12th | 1,234 | 1.7 | 3rd |
| Respiratory system diagnosis w ventilator support | 4,773 | 0.6 | 47th | 1,118 | 1.6 | 4th |
| AHRQ comorbidities (top 5 for each group) | ||||||
| Hypertension | 468,026 | 17.8 | 1st | 39,340 | 16.4 | 1st |
| Fluid and electrolyte disorders | 251,339 | 9.5 | 2nd | 19,825 | 8.3 | 2nd |
| Deficiency anemia | 208,722 | 7.9 | 3rd | 19,663 | 8.2 | 3rd |
| Diabetes without CCs | 190,140 | 7.2 | 4th | 17,131 | 7.1 | 4th |
| Chronic pulmonary disease | 178,164 | 6.8 | 5th | 16,319 | 6.8 | 5th |
| Most common procedures (top 5 for each group) | ||||||
| Packed cell transfusion | 72,590 | 7.0 | 1st | 9,756 | 5.0 | 2nd |
| (Central) venous catheter insertion | 68,687 | 6.7 | 2nd | 13,755 | 7.0 | 1st |
| Hemodialysis | 41,557 | 4.0 | 3rd | 5,351 | 2.7 | 4th |
| Heart ultrasound (echocardiogram) | 37,762 | 3.7 | 4th | 5,441 | 2.8 | 3rd |
| Insert endotracheal tube | 25,360 | 2.5 | 5th | 4,705 | 2.4 | 6th |
| Continuous invasive mechanical ventilation | 19,221 | 1.9 | 9th | 5,280 | 2.7 | 5th |
| 3M APR‐DRG admission ROM score | ||||||
| Minor | 271,702 | 33.6 | 18,620 | 26.1 | ||
| Moderate | 286,427 | 35.4 | 21,775 | 30.5 | ||
| Major | 193,652 | 23.9 | 20,531 | 28.7 | ||
| Extreme | 58,081 | 7.2 | 10,527 | 14.7 | ||
Primary discharge diagnoses (MS‐DRGs) varied widely, with no single diagnosis accounting for more than 4.2% of admissions in either group. The most common primary diagnoses among IHTs included severe sepsis (3.7%), esophagitis and gastroenteritis (2.1%), and gastrointestinal bleeding (1.7%). The top 5 most common AHRQ comorbidities were the same between the IHT and ED populations. A higher proportion of IHTs had at least 1 procedure performed during their hospitalization (68.5% vs 49.8%, P < 0.001). Note that ICD‐9 procedure codes include interventions such as blood transfusions and dialysis (Table 1), which may not be considered procedures in common medical parlance.
As compared with those admitted from the ED, IHTs had a higher proportion of patients categorized with major or extreme admission risk of mortality score (major + extreme, ED 31.1% vs IHT 43.5%, P < 0.001).
Overall Outcomes
IHT patients experienced a 60% longer average LOS, and a higher proportion spent time in the ICU than patients admitted through the ED (Table 2). On average, care for IHT patients cost more per day than for ED patients (Table 2). A lower proportion of IHTs were discharged home (68.6% vs 77.4% of ED patients), and a higher proportion died in the hospital (4.1% vs 1.8%) (P < 0.001 for both). Of the ED or IHT patients who died during their admission, there was no significant difference between the proportion who died within 48 hours of admission (26.4% vs 25.6%, P = 0.3693). After adjusting for age, gender, insurance status, race, ICU utilization and 3M APR‐DRG admission ROM scores, IHT was independently associated with the risk of in‐hospital death (odds ratio [OR]: 1.36, 95% CI: 1.291.43) (Table 3). The C statistic for the in‐hospital mortality model was 0.88.
| ED, n = 809,868 | IHT, n = 75,524 | |
|---|---|---|
| ||
| LOS, mean SD | 5.0 6.9 | 8.0 13.4 |
| ICU days, mean SD | 0.6 2.4 | 1.7 5.2 |
| Patients who spent some time in the ICU | 14.3% | 29.8% |
| % LOS in the ICU (ICU days LOS) | 11.0% | 21.6% |
| Average total cost SD | $10,731 $16,593 | $19,818 $34,665 |
| Average cost per day (total cost LOS) | $2,139 | $2,492 |
| Discharged home | 77.4% | 68.6% |
| Died as inpatient | 14,869 (1.8%) | 3,051 (4.0%) |
| Died within 48 hours of admission (% total deaths) | 3,918 (26.4%) | 780 (25.6%) |
| Variable | Unadjusted OR (95% CI) | Adjusted OR (95% CI) |
|---|---|---|
| ||
| Age, y | 1.00 (1.001.00) | 1.03 (1.031.03) |
| Gender | ||
| Female | Ref. | Ref. |
| Male | 1.13 (1.091.70) | 1.05 (1.011.09) |
| Medicare status | ||
| No | Ref. | Ref. |
| Yes | 2.14 (2.062.22) | 1.39 (1.331.47) |
| Race | ||
| Nonblack | Ref. | Ref. |
| Black | 0.57 (0.550.60) | 0.77 (0.730.81) |
| ICU utilization | ||
| No ICU admission | Ref. | Ref. |
| Direct admission to the ICU | 5.56 (5.295.84) | 2.25 (2.132.38) |
| Delayed ICU admission | 5.48 (5.275.69) | 2.46 (2.362.57) |
| 3M APR‐DRG admission ROM score | ||
| Minor | Ref. | Ref. |
| Moderate | 8.71 (7.5510.05) | 6.28 (5.437.25) |
| Major | 43.97 (38.3150.47) | 25.84 (22.4729.71) |
| Extreme | 238.65 (207.69273.80) | 107.17 (93.07123.40) |
| IHT | ||
| No | Ref. | Ref. |
| Yes | 2.36 (2.262.48) | 1.36 (1.29 1.43) |
Subgroup Analyses
Table 4 demonstrates the unadjusted and adjusted results from our analysis stratified by timing of ICU utilization. IHT remained independently associated with in‐hospital mortality regardless of timing of ICU utilization.
| Subgroup | In‐hospital Mortality, n (%) | Unadjusted OR [95% CI] | Adjusted OR [95% CI] |
|---|---|---|---|
| |||
| No ICU admission, n = 552,171 | |||
| ED, n = 519,421 | 4,913 (0.95%) | Ref. | Ref. |
| IHT, n = 32,750 | 590 (1.80%) | 1.92 [1.762.09] | 1.68 [1.531.84] |
| Direct admission to the ICU, n = 44,537 | |||
| ED, n = 35,614 | 1,733 (4.87%) | Ref. | Ref. |
| IHT, n = 8,923 | 628 (7.04%) | 1.48 [1.351.63] | 1.24 [1.121.37] |
| Delayed ICU admission, n = 110,540 | |||
| ED, n = 95,573 | 4,706 (4.92%) | Ref. | Ref. |
| IHT, n = 14,967 | 1,068 (7.14%) | 1.48 [1.391.59] | 1.25 [1.171.35] |
DISCUSSION
Our study of IHT patients ultimately discharged by hospitalists and general internists at US academic referral centers found significantly increased average LOS, costs, and in‐hospital mortality compared with patients admitted from the ED. The increased risk of mortality persisted after adjustment for patient characteristics and variables representing endogenous risk of mortality, and in more homogeneous subgroups after stratification by presence and timing of ICU utilization. These data confirm findings from single‐center studies and suggest that observations about the difference between IHT and ED populations may be generalizable across US academic hospitals.
Our work builds on 2 single‐center studies that examined mixed medical and surgical academic IHT populations from the late 1980s and early 1990s,[9, 10] and 1 studying surgical ICU patients in 2013.[17] These studies demonstrated longer average LOS, higher costs, and higher mortality rates (in both adjusted and unadjusted analyses). Our work confirmed these findings utilizing a more current, multicenter large dataset of IHT patients ultimately discharged by hospitalists and general internists. Our work is unique from a larger, more recent study[7] in that it focuses on patients transferred to academic health systems, and therefore has particular relevance to those settings. In addition, we divided patients into subpopulations based on the timing of ICU utilization, and found that in each of these populations, IHT remained independently associated with in‐hospital mortality.
Our analysis does not explain why the outcomes of IHTs are worse, but plausible contributing factors include that (1) patients chosen for IHT are at higher risk of death in ways uncaptured by established mortality risk scores, (2) referring, transferring, or accepting providers and institutions have provided inadequate care, (3) the transfer process itself involves harm, (4) socioeconomic bias in selection for IHT,[18] or (5) some combination of the above. Regardless of the causes of the worse outcomes observed in these outside‐hospital transfers, as these patients are colloquially known at accepting hospitals, they present challenges to everyone involved. Referring providers may feel a sense of urgency as these patients' needs exceed their management capabilities. The process is often time consuming and burdensome for referring and accepting providers because of poorly developed systems.[19] The transfer often takes patients further from their home and may make it more difficult for family to participate in their care. The transfer may delay care if the accepting institution cannot immediately accept the patient or if the time in transport is prolonged, which could result in decompensation at a critical juncture. For providers inheriting such patients, the stress of caring for these patients is compounded by the difficulty obtaining records about the prior hospitalization.[20] This frustrating experience is often translated into unfounded judgment of the institution that referred the patient and the care provided there.[21] It is important for hospitalists making decisions throughout the transfer process and for hospital leaders who determine staffing levels, measure the quality of care, manage hospital networks, or write hospital policy to appreciate that the transfer process itself may contribute to the challenges and poor outcomes we observe. Furthermore, regardless of the cause for the increased mortality that we observed, our findings imply that IHT patients require careful evaluation, management, and treatment.
Many accepting institutions have transfer centers that facilitate these transitions, utilizing protocols and templates to standardize the process.[22, 23] Future research should focus on the characteristics of these centers to learn which practices are most efficacious. Interventions to mitigate the known challenges of transfer (including patient selection and triage, handoff communication, and information sharing) could be tested by randomized studies at referring and accepting institutions. There may be a role for health information exchange or the development of enhanced pretransfer evaluation processes using telemedicine models; there is evidence that information sharing may reduce redundant imaging.[24] Perhaps targeted review of IHTs admitted to a non‐ICU portion of the hospital and subsequently transferred to the ICU could identify opportunities to improve triaging protocols and thus avert some of the bad outcomes observed in this subpopulation. A related future direction could be to create protected forumsusing the patient safety organization framework[25]to facilitate the discussion of interhospital transfer outcomes among the referring, transporting, and receiving parties. Lastly, future work should investigate the reasons for the different proportions of black patients in the ED versus IHT cohorts. Our finding that black race was associated with lower risk of mortality has been previously reported but may also benefit from more investigation.[26]
There are several limitations of our work. First, despite extensive adjustment for patient characteristics, due to the observational nature of our study it is still possible that IHTs differ from ED admissions in ways that were unaccounted for in our analysis, and which could be associated with increased mortality independent of the transfer process itself. We are unable to characterize features of the transfer process, such as the reason for transfer, differences in transfer processes among hospitals, or the distance and mode of travel, which may influence outcomes.[27] Because we used administrative data, variations in coding could incorrectly estimate the complexity or severity of illness on admission, which is a previously described risk.[28] In addition, although our dataset was very large, it was limited by incomplete charge data, which limited our ability to measure ICU utilization in our full cohort. The hospitals missing ICU charge data are of variable sizes and are distributed around the country, limiting the chance of systematic bias. Finally, in some settings, hospitalists may serve as the discharging physician for patients admitted to other services such as the ICU, introducing heterogeneity and bias to the sample. We attempted to mitigate such bias through our subgroup analysis, which allowed for comparisons within more homogeneous patient groupings.
In conclusion, our large multicenter study of academic health systems confirms the findings of prior single‐center academic studies and a large general population study that interhospital transfer patients have an increased average LOS, costs, and adjusted in‐hospital mortality than patients admitted from the ED. This difference in mortality persisted even after controlling for several other predictors of mortality. Our findings emphasize the need for future studies designed to clarify the reason for the increased risk and identify targets for interventions to improve outcomes for the interhospital transfer population.
Acknowledgements
The authors gratefully acknowledge Zachary Goldberger and Tom Gallagher for their critical reviews of this article.
Disclosures
Dr. Herzig was funded by grant number K23AG042459 from the National Institute on Aging. The funding organization had no involvement in any aspect of the study, including design and conduct of the study; collection, management, analysis, and interpretation of the data; and preparation, review, or approval of the manuscript. The authors report no conflicts of interest.
- . The incomplete infrastructure for interhospital patient transfer. Crit Care Med. 2012;40(8):2470–2478.
- . AHRQ WebM23(1):68–75.
- , . Improving the quality of inter‐hospital transfers. J Qual Assur. 1991;13(4):16–20.
- , . Communication errors in dispatch of air medical transport. Prehosp Emerg Care. 2011;15(1):39–43.
- , , , , . Guidelines for the inter‐ and intrahospital transport of critically ill patients. Crit Care Med. 2004;32(1):256–262.
- , , , . Interhospital facility transfers in the United States: a nationwide outcomes study [published online November 13, 2014]. J Patient Saf. doi: 10.1097/PTS.0000000000000148.
- , , , et al. Patients transferred to academic medical centers and other hospitals: characteristics, resource use, and outcomes. Acad Med. 1997;72(10):921–930.
- , , , , . Comparing the hospitalizations of transfer and non‐transfer patients in an academic medical center. Acad Med. 1996;71(3):262–266.
- , . Impact of interhospital transfers on outcomes in an academic medical center. Implications for profiling hospital quality. Med Care. 1996;34(4):295–309.
- , , , . Comorbidity measures for use with administrative data. Med Care. 1998;36(1):8–27.
- . 3M HIS: APR DRG classification software—overview. Mortality Measurement. Available at: http://archive.ahrq.gov/professionals/quality‐patient‐safety/quality‐resources/tools/mortality/Hughessumm.html. Accessed June 14, 2011.
- , . Risk‐adjusting acute myocardial infarction mortality: are APR‐DRGs the right tool? Health Serv Res. 2000;34(7):1469–1489.
- , , , , . Hospital volume and surgical outcomes after elective hip/knee arthroplasty: a risk‐adjusted analysis of a large regional database. Arthritis Rheum. 2011;63(8):2531–2539.
- , , , . Examination of hospital characteristics and patient quality outcomes using four inpatient quality indicators and 30‐day all‐cause mortality. Am J Med Qual. 2013;28(1):46–55.
- , , , , . Observed and expected outcomes in transfer and nontransfer patients with a hip fracture. J Orthop Trauma. 2011;25(11):666–669.
- , , , et al. Interhospital transfer: an independent risk factor for mortality in the surgical intensive care unit. Am Surg. 2013;79(9):909–913.
- , , , . Insurance status and the transfer of hospitalized patients: an observational study. Ann Intern Med. 2014;160(2):81–90.
- , , . Which patients and where: a qualitative study of patient transfers from community hospitals. Med Care. 2011;49(6):592–598.
- . Overwhelmed and uninspired by lack of coordinated care: a call to action for new physicians. Acad Med. 2013;88(11):1600–1602.
- . The outside hospital. Ann Intern Med. 2013;159(7):500–501.
- , , . Untangling the lines: using a transfer center to assist with interfacility transfers. Nurs Econ. 2003;21(2):94–96.
- , , , et al. Ticket to ride: reducing handoff risk during hospital patient transport. J Nurs Care Qual. 2009;24(2):109–115.
- , , . Outside imaging in emergency department transfer patients: CD import reduces rates of subsequent imaging utilization. Radiology. 2011;260(2):408–413.
- Agency for Healthcare Research and Quality. Patient Safety Organization (PSO) Program. Available at: http://www.pso.ahrq.gov. Accessed July 7, 2011.
- , , , , , . Socioeconomic status, race, and mortality: a prospective cohort study. Am J Public Health. 2014;104(12):e98–e107.
- , , , . Prognostic factors for mortality following interhospital transfers to the medical intensive care unit of a tertiary referral center. Crit Care Med. 2003;31(7):1981–1986.
- , , , . The accuracy of present‐on‐admission reporting in administrative data. Health Serv Res. 2011;46(6 pt 1):1946–1962.
Interhospital transfers (IHTs) to academic medical centers (AMCs) or their affiliated hospitals may benefit patients who require unique specialty and procedural services. However, IHTs also introduce a potentially risky transition of care for patients suffering from complex or unstable medical problems.[1] Components of this risk include the dangers associated with transportation and the disrupted continuity of care that may lead to delays or errors in care.[2, 3] Furthermore, referring and accepting providers may face barriers to optimal handoffs including a lack of shared communication standards and difficulty accessing external medical records.[3, 4, 5] Although some authors have recommended the creation of formal guidelines for interhospital transfer processes for all patients to mitigate the risks of transfer, the available guidelines governing the IHT triage and communication process are limited to critically ill patients.[6]
A recent study of a diverse patient and hospital dataset demonstrated that interhospital transfer patients have a higher risk of mortality, increased length of stay (LOS), and increased risk of adverse events as compared with non‐transfer patients.[7] However, it is unknown if these findings persist in the population of patients transferred specifically to AMCs or their affiliated hospitals (the combination is hereafter referred to as academic health systems [AHSs]). AMCs provide a disproportionate share of IHT care for complex patients and have a vested interest in improving the outcomes of these transitions.[8] Prior single‐center studies of acute care adult medical patients accepted to AMCs have shown that IHT is associated with a longer LOS, increased in‐hospital mortality, and higher resource use.[9, 10] However, it is difficult to generalize from single‐center studies due to the variation in referral practices, geography, and network characteristics. Additionally, AMC referral systems, patient mix, and utilization of hospitalists have likely changed substantially in the nearly 2 decades since those reports were published.
Hospitalists and general internists often manage the transfer acceptance processes for internal medicine services at receiving hospitals, helping to triage and coordinate care for IHT patients. As a result, it is important for hospitalists to understand the characteristics and outcomes of the IHT population. In addition to informing the decision making around transfer for a given patient, such an understanding is the foundation for helping providers and institutions begin to systematically identify and mitigate peritransfer risks.
We conducted this large multicenter study to describe the characteristics and outcomes of a current, nationally representative IHT patient population discharged by hospitalists and general internists at AHSs. To identify unique features of the IHT population, we compared patients transferred from another hospital to an AHS to those admitted to the AHS directly from the AHS's emergency department (ED). Based on our anecdotal experiences and the prior single‐center study findings in adult medical populations,[9, 10] we hypothesized that the IHT population would be sicker, stay in the hospital and intensive care unit (ICU) longer, and have higher costs and in‐hospital mortality than ED patients. Although there may be fundamental differences between the 2 groups related to disease and patient condition, we hypothesized that outcome differences would persist even after adjusting for patient factors such as demographics, disease‐specific risk of mortality, and ICU utilization.
PATIENTS AND METHODS
We conducted a retrospective cohort study using data from the University HealthSystem Consortium (UHC) Clinical Database and Resource Manager (CDB/RM). UHC is an alliance of 120 academic medical centers and 300 of their affiliated hospitals for the purposes of collaboration on performance improvement. Each year, a subset of participating hospitals submits data on all of their inpatient discharges to the CDB/RM, which totals approximately 5 million records. The CDB/RM includes information from billing forms including demographics, diagnoses, and procedures as captured by International Classification of Diseases, Ninth Revision (ICD‐9) codes, discharge disposition, and line item charge detail for the type of bed (eg, floor, ICU). Most hospitals also provide detailed charge information including pharmacy, imaging, blood products, lab tests, and supplies. Some hospitals do not provide any charge data. The Beth Israel Deaconess Medical Center and University of Washington institutional review boards reviewed and approved the conduct of this study.
We included all inpatients discharged by hospitalists or general internal medicine physicians from UHC hospitals between April 1, 2011 and March 31, 2012. We excluded minors, pregnant patients, and prisoners. One hundred fifty‐eight adult academic medical centers and affiliated hospitals submitted data throughout this time period. Our primary independent variable, IHT status, was defined by patients whose admission source was another acute care institution. ED admissions were defined as patients admitted from the AHS ED whose source of origination was not another hospital or ambulatory surgery site.
Admission Characteristics
Admission characteristics of interest included age, gender, insurance status, the most common diagnoses in each cohort based on Medicare Severity Diagnosis‐Related Group (MS‐DRG), the most common Agency for Healthcare Research and Quality (AHRQ) comorbitidies,[11] the most common procedures, and the admission 3M All‐Patient Refined Diagnosis‐Related Group (APR‐DRG) risk of mortality (ROM) scores. 3M APR‐DRG ROM scores are proprietary categorical measures specific to the base APR‐DRG to which a patient is assigned, which are calculated using data available at the time of admission, including comorbid condition diagnosis codes, age, procedure codes, and principal diagnosis codes. A patient can fall into 1 of 4 categories with this score: minor, moderate, major, or extreme.[12]
Outcomes
Our primary outcome of interest was in‐hospital mortality. Secondary outcomes included LOS, the cost of care, ICU utilization, and discharge destination. The cost of care is a standardized estimate of the direct costs based on an adjustment of the charges submitted by CDB/RM participants. If an IHT is triaged through a receiving hospital's ED, the cost of care reflects those charges as well as the inpatient charges.
Statistical Analysis
We used descriptive statistics to characterize the IHT and ED patient populations. For bivariate comparisons of continuous variables, 2‐sample t tests with unequal variance were used. For categorical variables, 2 analysis was performed. We assessed the impact of IHT status on in‐hospital mortality using logistic regression to estimate unadjusted and adjusted relative risks, 95% confidence intervals (CIs), and P values. We included age, gender, insurance status, race, timing of ICU utilization, and 3M APR‐DRG ROM scores as independent variables. Prior studies have used this type of risk‐adjustment methodology with 3M APR‐DRG ROM scores,[13, 14, 15] including with interhospital transfer patients.[16] For all comparisons, a P value of <0.05 was considered statistically significant. Our sample size was determined by the data available for the 1‐year period.
Subgroup Analyses
We performed a stratified analysis based on the timing of ICU transfer to allow for additional comparisons of mortality within more homogeneous patient groups, and to control for the possibility that delays in ICU transfer could explain the association between IHT and in‐hospital mortality. We determined whether and when a patient spent time in the ICU based on daily accommodation charges. If a patient was charged for an ICU bed on the day of admission, we coded them as a direct ICU admission, and if the first ICU bed charge was on a subsequent day, they were coded as a delayed ICU admission. Approximately 20% of patients did not have the data necessary to determine the timing of ICU utilization, because the hospitals where they received care did not submit detailed charge data to the UHC.
Data analysis was performed by the UHC. Analysis was performed using Stata version 10 (StataCorp, College Station, TX). For all comparisons, a P value of <0.05 was considered significant.
RESULTS
Patient Characteristics
We identified 885,392 patients who met study criteria: 75,524 patients admitted as an IHT and 809,868 patients admitted from the ED. The proportion of each hospital's admissions that were IHTs that met our study criteria varied widely (median 9%, 25th percentile 3%, 75th percentile 14%). The average age and gender of the IHT and ED populations were similar and reflective of a nationally representative adult inpatient sample (Table 1). Racial compositions of the populations were notable for a higher portion of black patients in the ED admission group than the IHT group (25.4% vs 13.2%, P < 0.001). A slightly higher portion of the IHT population was covered by commercial insurance compared with the ED admissions (22.7% vs 19.1%, P < 0.001).
| Demographic/Clinical Variables | ED | IHT | ||||
|---|---|---|---|---|---|---|
| 1st | 2nd | 3rd | 4th | Rank | ||
| ||||||
| No. of patients | 809,868 | 91.5 | 75,524 | 8.5 | ||
| Age, y | 62.2 19.1 | 60.2 18.2 | ||||
| Male | 381,563 | 47.1 | 38,850 | 51.4 | ||
| Female | 428,303 | 52.9 | 36,672 | 48.6 | ||
| Race | ||||||
| White | 492,894 | 60.9 | 54,780 | 72.5 | ||
| Black | 205,309 | 25.4 | 9,968 | 13.2 | ||
| Other | 66,709 | 8.1 | 7,777 | 10.3 | ||
| Hispanic | 44,956 | 5.6 | 2,999 | 4.0 | ||
| Primary payer | ||||||
| Commercial | 154,826 | 19.1 | 17,130 | 22.7 | ||
| Medicaid | 193,585 | 23.9 | 15,924 | 21.1 | ||
| Medicare | 445,227 | 55.0 | 39,301 | 52.0 | ||
| Other | 16,230 | 2.0 | 3,169 | 4.2 | ||
| Most common MS‐DRGs (top 5 for each group) | ||||||
| Esophagitis, gastroenteritis, and miscellaneous digest disorders without MCC | 34,116 | 4.2 | 1st | 1,517 | 2.1 | 2nd |
| Septicemia or severe sepsis without MV 96+ hours with MCC | 25,710 | 3.2 | 2nd | 2,625 | 3.7 | 1st |
| Cellulitis without MCC | 21,686 | 2.7 | 3rd | 871 | 1.2 | 8th |
| Kidney and urinary tract infections without MCC | 19,937 | 2.5 | 4th | 631 | 0.9 | 21st |
| Chest pain | 18,056 | 2.2 | 5th | 495 | 0.7 | 34th |
| Renal failure with CC | 15,478 | 1.9 | 9th | 1,018 | 1.4 | 5th |
| GI hemorrhage with CC | 12,855 | 1.6 | 12th | 1,234 | 1.7 | 3rd |
| Respiratory system diagnosis w ventilator support | 4,773 | 0.6 | 47th | 1,118 | 1.6 | 4th |
| AHRQ comorbidities (top 5 for each group) | ||||||
| Hypertension | 468,026 | 17.8 | 1st | 39,340 | 16.4 | 1st |
| Fluid and electrolyte disorders | 251,339 | 9.5 | 2nd | 19,825 | 8.3 | 2nd |
| Deficiency anemia | 208,722 | 7.9 | 3rd | 19,663 | 8.2 | 3rd |
| Diabetes without CCs | 190,140 | 7.2 | 4th | 17,131 | 7.1 | 4th |
| Chronic pulmonary disease | 178,164 | 6.8 | 5th | 16,319 | 6.8 | 5th |
| Most common procedures (top 5 for each group) | ||||||
| Packed cell transfusion | 72,590 | 7.0 | 1st | 9,756 | 5.0 | 2nd |
| (Central) venous catheter insertion | 68,687 | 6.7 | 2nd | 13,755 | 7.0 | 1st |
| Hemodialysis | 41,557 | 4.0 | 3rd | 5,351 | 2.7 | 4th |
| Heart ultrasound (echocardiogram) | 37,762 | 3.7 | 4th | 5,441 | 2.8 | 3rd |
| Insert endotracheal tube | 25,360 | 2.5 | 5th | 4,705 | 2.4 | 6th |
| Continuous invasive mechanical ventilation | 19,221 | 1.9 | 9th | 5,280 | 2.7 | 5th |
| 3M APR‐DRG admission ROM score | ||||||
| Minor | 271,702 | 33.6 | 18,620 | 26.1 | ||
| Moderate | 286,427 | 35.4 | 21,775 | 30.5 | ||
| Major | 193,652 | 23.9 | 20,531 | 28.7 | ||
| Extreme | 58,081 | 7.2 | 10,527 | 14.7 | ||
Primary discharge diagnoses (MS‐DRGs) varied widely, with no single diagnosis accounting for more than 4.2% of admissions in either group. The most common primary diagnoses among IHTs included severe sepsis (3.7%), esophagitis and gastroenteritis (2.1%), and gastrointestinal bleeding (1.7%). The top 5 most common AHRQ comorbidities were the same between the IHT and ED populations. A higher proportion of IHTs had at least 1 procedure performed during their hospitalization (68.5% vs 49.8%, P < 0.001). Note that ICD‐9 procedure codes include interventions such as blood transfusions and dialysis (Table 1), which may not be considered procedures in common medical parlance.
As compared with those admitted from the ED, IHTs had a higher proportion of patients categorized with major or extreme admission risk of mortality score (major + extreme, ED 31.1% vs IHT 43.5%, P < 0.001).
Overall Outcomes
IHT patients experienced a 60% longer average LOS, and a higher proportion spent time in the ICU than patients admitted through the ED (Table 2). On average, care for IHT patients cost more per day than for ED patients (Table 2). A lower proportion of IHTs were discharged home (68.6% vs 77.4% of ED patients), and a higher proportion died in the hospital (4.1% vs 1.8%) (P < 0.001 for both). Of the ED or IHT patients who died during their admission, there was no significant difference between the proportion who died within 48 hours of admission (26.4% vs 25.6%, P = 0.3693). After adjusting for age, gender, insurance status, race, ICU utilization and 3M APR‐DRG admission ROM scores, IHT was independently associated with the risk of in‐hospital death (odds ratio [OR]: 1.36, 95% CI: 1.291.43) (Table 3). The C statistic for the in‐hospital mortality model was 0.88.
| ED, n = 809,868 | IHT, n = 75,524 | |
|---|---|---|
| ||
| LOS, mean SD | 5.0 6.9 | 8.0 13.4 |
| ICU days, mean SD | 0.6 2.4 | 1.7 5.2 |
| Patients who spent some time in the ICU | 14.3% | 29.8% |
| % LOS in the ICU (ICU days LOS) | 11.0% | 21.6% |
| Average total cost SD | $10,731 $16,593 | $19,818 $34,665 |
| Average cost per day (total cost LOS) | $2,139 | $2,492 |
| Discharged home | 77.4% | 68.6% |
| Died as inpatient | 14,869 (1.8%) | 3,051 (4.0%) |
| Died within 48 hours of admission (% total deaths) | 3,918 (26.4%) | 780 (25.6%) |
| Variable | Unadjusted OR (95% CI) | Adjusted OR (95% CI) |
|---|---|---|
| ||
| Age, y | 1.00 (1.001.00) | 1.03 (1.031.03) |
| Gender | ||
| Female | Ref. | Ref. |
| Male | 1.13 (1.091.70) | 1.05 (1.011.09) |
| Medicare status | ||
| No | Ref. | Ref. |
| Yes | 2.14 (2.062.22) | 1.39 (1.331.47) |
| Race | ||
| Nonblack | Ref. | Ref. |
| Black | 0.57 (0.550.60) | 0.77 (0.730.81) |
| ICU utilization | ||
| No ICU admission | Ref. | Ref. |
| Direct admission to the ICU | 5.56 (5.295.84) | 2.25 (2.132.38) |
| Delayed ICU admission | 5.48 (5.275.69) | 2.46 (2.362.57) |
| 3M APR‐DRG admission ROM score | ||
| Minor | Ref. | Ref. |
| Moderate | 8.71 (7.5510.05) | 6.28 (5.437.25) |
| Major | 43.97 (38.3150.47) | 25.84 (22.4729.71) |
| Extreme | 238.65 (207.69273.80) | 107.17 (93.07123.40) |
| IHT | ||
| No | Ref. | Ref. |
| Yes | 2.36 (2.262.48) | 1.36 (1.29 1.43) |
Subgroup Analyses
Table 4 demonstrates the unadjusted and adjusted results from our analysis stratified by timing of ICU utilization. IHT remained independently associated with in‐hospital mortality regardless of timing of ICU utilization.
| Subgroup | In‐hospital Mortality, n (%) | Unadjusted OR [95% CI] | Adjusted OR [95% CI] |
|---|---|---|---|
| |||
| No ICU admission, n = 552,171 | |||
| ED, n = 519,421 | 4,913 (0.95%) | Ref. | Ref. |
| IHT, n = 32,750 | 590 (1.80%) | 1.92 [1.762.09] | 1.68 [1.531.84] |
| Direct admission to the ICU, n = 44,537 | |||
| ED, n = 35,614 | 1,733 (4.87%) | Ref. | Ref. |
| IHT, n = 8,923 | 628 (7.04%) | 1.48 [1.351.63] | 1.24 [1.121.37] |
| Delayed ICU admission, n = 110,540 | |||
| ED, n = 95,573 | 4,706 (4.92%) | Ref. | Ref. |
| IHT, n = 14,967 | 1,068 (7.14%) | 1.48 [1.391.59] | 1.25 [1.171.35] |
DISCUSSION
Our study of IHT patients ultimately discharged by hospitalists and general internists at US academic referral centers found significantly increased average LOS, costs, and in‐hospital mortality compared with patients admitted from the ED. The increased risk of mortality persisted after adjustment for patient characteristics and variables representing endogenous risk of mortality, and in more homogeneous subgroups after stratification by presence and timing of ICU utilization. These data confirm findings from single‐center studies and suggest that observations about the difference between IHT and ED populations may be generalizable across US academic hospitals.
Our work builds on 2 single‐center studies that examined mixed medical and surgical academic IHT populations from the late 1980s and early 1990s,[9, 10] and 1 studying surgical ICU patients in 2013.[17] These studies demonstrated longer average LOS, higher costs, and higher mortality rates (in both adjusted and unadjusted analyses). Our work confirmed these findings utilizing a more current, multicenter large dataset of IHT patients ultimately discharged by hospitalists and general internists. Our work is unique from a larger, more recent study[7] in that it focuses on patients transferred to academic health systems, and therefore has particular relevance to those settings. In addition, we divided patients into subpopulations based on the timing of ICU utilization, and found that in each of these populations, IHT remained independently associated with in‐hospital mortality.
Our analysis does not explain why the outcomes of IHTs are worse, but plausible contributing factors include that (1) patients chosen for IHT are at higher risk of death in ways uncaptured by established mortality risk scores, (2) referring, transferring, or accepting providers and institutions have provided inadequate care, (3) the transfer process itself involves harm, (4) socioeconomic bias in selection for IHT,[18] or (5) some combination of the above. Regardless of the causes of the worse outcomes observed in these outside‐hospital transfers, as these patients are colloquially known at accepting hospitals, they present challenges to everyone involved. Referring providers may feel a sense of urgency as these patients' needs exceed their management capabilities. The process is often time consuming and burdensome for referring and accepting providers because of poorly developed systems.[19] The transfer often takes patients further from their home and may make it more difficult for family to participate in their care. The transfer may delay care if the accepting institution cannot immediately accept the patient or if the time in transport is prolonged, which could result in decompensation at a critical juncture. For providers inheriting such patients, the stress of caring for these patients is compounded by the difficulty obtaining records about the prior hospitalization.[20] This frustrating experience is often translated into unfounded judgment of the institution that referred the patient and the care provided there.[21] It is important for hospitalists making decisions throughout the transfer process and for hospital leaders who determine staffing levels, measure the quality of care, manage hospital networks, or write hospital policy to appreciate that the transfer process itself may contribute to the challenges and poor outcomes we observe. Furthermore, regardless of the cause for the increased mortality that we observed, our findings imply that IHT patients require careful evaluation, management, and treatment.
Many accepting institutions have transfer centers that facilitate these transitions, utilizing protocols and templates to standardize the process.[22, 23] Future research should focus on the characteristics of these centers to learn which practices are most efficacious. Interventions to mitigate the known challenges of transfer (including patient selection and triage, handoff communication, and information sharing) could be tested by randomized studies at referring and accepting institutions. There may be a role for health information exchange or the development of enhanced pretransfer evaluation processes using telemedicine models; there is evidence that information sharing may reduce redundant imaging.[24] Perhaps targeted review of IHTs admitted to a non‐ICU portion of the hospital and subsequently transferred to the ICU could identify opportunities to improve triaging protocols and thus avert some of the bad outcomes observed in this subpopulation. A related future direction could be to create protected forumsusing the patient safety organization framework[25]to facilitate the discussion of interhospital transfer outcomes among the referring, transporting, and receiving parties. Lastly, future work should investigate the reasons for the different proportions of black patients in the ED versus IHT cohorts. Our finding that black race was associated with lower risk of mortality has been previously reported but may also benefit from more investigation.[26]
There are several limitations of our work. First, despite extensive adjustment for patient characteristics, due to the observational nature of our study it is still possible that IHTs differ from ED admissions in ways that were unaccounted for in our analysis, and which could be associated with increased mortality independent of the transfer process itself. We are unable to characterize features of the transfer process, such as the reason for transfer, differences in transfer processes among hospitals, or the distance and mode of travel, which may influence outcomes.[27] Because we used administrative data, variations in coding could incorrectly estimate the complexity or severity of illness on admission, which is a previously described risk.[28] In addition, although our dataset was very large, it was limited by incomplete charge data, which limited our ability to measure ICU utilization in our full cohort. The hospitals missing ICU charge data are of variable sizes and are distributed around the country, limiting the chance of systematic bias. Finally, in some settings, hospitalists may serve as the discharging physician for patients admitted to other services such as the ICU, introducing heterogeneity and bias to the sample. We attempted to mitigate such bias through our subgroup analysis, which allowed for comparisons within more homogeneous patient groupings.
In conclusion, our large multicenter study of academic health systems confirms the findings of prior single‐center academic studies and a large general population study that interhospital transfer patients have an increased average LOS, costs, and adjusted in‐hospital mortality than patients admitted from the ED. This difference in mortality persisted even after controlling for several other predictors of mortality. Our findings emphasize the need for future studies designed to clarify the reason for the increased risk and identify targets for interventions to improve outcomes for the interhospital transfer population.
Acknowledgements
The authors gratefully acknowledge Zachary Goldberger and Tom Gallagher for their critical reviews of this article.
Disclosures
Dr. Herzig was funded by grant number K23AG042459 from the National Institute on Aging. The funding organization had no involvement in any aspect of the study, including design and conduct of the study; collection, management, analysis, and interpretation of the data; and preparation, review, or approval of the manuscript. The authors report no conflicts of interest.
- . The incomplete infrastructure for interhospital patient transfer. Crit Care Med. 2012;40(8):2470–2478.
- . AHRQ WebM23(1):68–75.
- , . Improving the quality of inter‐hospital transfers. J Qual Assur. 1991;13(4):16–20.
- , . Communication errors in dispatch of air medical transport. Prehosp Emerg Care. 2011;15(1):39–43.
- , , , , . Guidelines for the inter‐ and intrahospital transport of critically ill patients. Crit Care Med. 2004;32(1):256–262.
- , , , . Interhospital facility transfers in the United States: a nationwide outcomes study [published online November 13, 2014]. J Patient Saf. doi: 10.1097/PTS.0000000000000148.
- , , , et al. Patients transferred to academic medical centers and other hospitals: characteristics, resource use, and outcomes. Acad Med. 1997;72(10):921–930.
- , , , , . Comparing the hospitalizations of transfer and non‐transfer patients in an academic medical center. Acad Med. 1996;71(3):262–266.
- , . Impact of interhospital transfers on outcomes in an academic medical center. Implications for profiling hospital quality. Med Care. 1996;34(4):295–309.
- , , , . Comorbidity measures for use with administrative data. Med Care. 1998;36(1):8–27.
- . 3M HIS: APR DRG classification software—overview. Mortality Measurement. Available at: http://archive.ahrq.gov/professionals/quality‐patient‐safety/quality‐resources/tools/mortality/Hughessumm.html. Accessed June 14, 2011.
- , . Risk‐adjusting acute myocardial infarction mortality: are APR‐DRGs the right tool? Health Serv Res. 2000;34(7):1469–1489.
- , , , , . Hospital volume and surgical outcomes after elective hip/knee arthroplasty: a risk‐adjusted analysis of a large regional database. Arthritis Rheum. 2011;63(8):2531–2539.
- , , , . Examination of hospital characteristics and patient quality outcomes using four inpatient quality indicators and 30‐day all‐cause mortality. Am J Med Qual. 2013;28(1):46–55.
- , , , , . Observed and expected outcomes in transfer and nontransfer patients with a hip fracture. J Orthop Trauma. 2011;25(11):666–669.
- , , , et al. Interhospital transfer: an independent risk factor for mortality in the surgical intensive care unit. Am Surg. 2013;79(9):909–913.
- , , , . Insurance status and the transfer of hospitalized patients: an observational study. Ann Intern Med. 2014;160(2):81–90.
- , , . Which patients and where: a qualitative study of patient transfers from community hospitals. Med Care. 2011;49(6):592–598.
- . Overwhelmed and uninspired by lack of coordinated care: a call to action for new physicians. Acad Med. 2013;88(11):1600–1602.
- . The outside hospital. Ann Intern Med. 2013;159(7):500–501.
- , , . Untangling the lines: using a transfer center to assist with interfacility transfers. Nurs Econ. 2003;21(2):94–96.
- , , , et al. Ticket to ride: reducing handoff risk during hospital patient transport. J Nurs Care Qual. 2009;24(2):109–115.
- , , . Outside imaging in emergency department transfer patients: CD import reduces rates of subsequent imaging utilization. Radiology. 2011;260(2):408–413.
- Agency for Healthcare Research and Quality. Patient Safety Organization (PSO) Program. Available at: http://www.pso.ahrq.gov. Accessed July 7, 2011.
- , , , , , . Socioeconomic status, race, and mortality: a prospective cohort study. Am J Public Health. 2014;104(12):e98–e107.
- , , , . Prognostic factors for mortality following interhospital transfers to the medical intensive care unit of a tertiary referral center. Crit Care Med. 2003;31(7):1981–1986.
- , , , . The accuracy of present‐on‐admission reporting in administrative data. Health Serv Res. 2011;46(6 pt 1):1946–1962.
© 2015 Society of Hospital Medicine
Specialties Performing Paracentesis
Cirrhosis affects up to 3% of the population and is 1 of the 10 most common causes of death in the United States.[1, 2, 3, 4] Paracentesis procedures are frequently performed in patients with liver disease and ascites for diagnostic and/or therapeutic purposes. These procedures can be performed safely by trained clinicians at the bedside or referred to interventional radiology (IR).[2, 3, 4]
National practice patterns show that paracentesis procedures are increasingly referred to IR rather than performed at the bedside by internal medicine or gastroenterology clinicians.[5, 6, 7] In fact, a recent study of Medicare beneficiaries showed that inpatient and outpatient paracentesis procedures performed by radiologists increased by 964% from 1993 to 2008.[7] Reasons for the decline in bedside procedures include the increased availability of IR, lack of sufficient reimbursement, and the time required to perform paracentesis procedures.[5, 6, 7, 8] Surveys of internal medicine and family medicine residents and gastroenterology fellows show trainees often lack the confidence and experience needed to perform the procedure safely.[9, 10, 11] Additionally, many clinicians do not have expertise with ultrasound use and may not have access to necessary equipment.
Inconsistent certification requirements may also impact the competence and experience of physicians to perform paracentesis procedures. Internal medicine residents are no longer required by the American Board of Internal Medicine (ABIM) to demonstrate competency in procedures such as paracentesis for certification.[12] However, the Accreditation Council for Graduate Medical Education (ACGME) requirements state that internal medicine programs must offer residents the opportunity to demonstrate competence in the performance of procedures such as paracentesis, thoracentesis, and central venous catheter insertion.[13] The American Board of Family Medicine (ABFM) does not outline specific procedural competence for initial certification.[14] The ACGME states that family medicine residents must receive training to perform those clinical procedures required for their future practices but allows each program to determine which procedures to require.[15] Due to this uncertainty, practicing hospitalists are likely to have variable training and competence in bedside procedures such as paracentesis.
We previously showed that internal medicine residents rotating on the hepatology service of an academic medical center performed 59% of paracentesis procedures at the bedside.[16] These findings are in contrast to national data showing that 74% of paracentesis procedures performed on Medicare beneficiaries were performed by radiologists.[7] Practice patterns at university hospitals may not be reflected in this data because the study was limited to Medicare beneficiaries and included ambulatory patients.[7] In addition to uncertainty about who is performing this procedure in inpatient settings, little is known about the effect of specialty on postparacentesis clinical outcomes.[16, 17]
The current study had 3 aims: (1) evaluate which clinical specialties perform paracentesis procedures at university hospitals; (2) model patient characteristics associated with procedures performed at the bedside versus those referred to IR; and (3) among patients with a similar likelihood of IR referral, evaluate length of stay (LOS) and hospital costs of patients undergoing procedures performed by different specialties.
METHODS
We performed an observational administrative database review of patients who underwent paracentesis procedures in hospitals participating in the University HealthSystem Consortium (UHC) Clinical Database from January 2010 through December 2012. UHC is an alliance of 120 nonprofit academic medical centers and their 290 affiliated hospitals. UHC maintains databases containing clinical, operational, financial, and patient safety data from affiliated hospitals. Using the UHC database, we described the characteristics of all patients who underwent paracentesis procedures by clinical specialty performing the procedure. We then modeled the effects of patient characteristics on decision‐making about IR referral. Finally, among patients with a homogeneous predicted probability of IR referral, we compared LOS and direct costs by specialty performing the procedure. The Northwestern University institutional review board approved this study.
Procedure
We queried the UHC database for all patients over the age of 18 years who underwent paracentesis procedures (International Classification of Disease Revision 9 [ICD‐9] procedure code 54.91) and had at least 1 diagnosis code of liver disease (571.x). We excluded patients admitted to obstetrics. The query included patient and clinical characteristics such as admission, discharge, and procedure date; age, gender, procedure provider specialty, and intensive care unit (ICU) stay. We also obtained all ICD‐9 codes associated with the admission including obesity, severe liver disease, coagulation disorders, blood loss anemia, hyponatremia, hypotension, thrombocytopenia, liver transplant before or during the admission, awaiting liver transplant, and complications of liver transplant. We used ICD‐9 codes to calculate patients' Charlson score[18, 19] to assess severity of illness on admission.
LOS and total direct hospital costs were compared among patients with a paracentesis performed by a single clinical group and among patients with a similar predicted probability of IR referral. UHC generates direct cost estimates by applying Medicare Cost Report ratios of cost to charges with the labor cost further adjusted by the respective area wage index. Hospital costs were not available from 8.3% of UHC hospitals. We therefore based cost estimates on nonmissing data.
Paracentesis provider specialties were divided into 6 general categories: (1) IR (interventional and diagnostic radiology); (2) medicine (family medicine, general medicine, and hospital medicine); (3) subspecialty medicine (infectious disease, cardiology, nephrology, hematology/oncology, endocrinology, pulmonary, and geriatrics); (4) gastroenterology/hepatology (gastroenterology, hepatology, and transplant medicine); (5) general surgery (general surgery and transplant surgery); and (6) all other (included unclassified specialties). We present patient characteristics categorized by these specialty groups and for admissions in which multiple specialties performed procedures.
Study Design
To analyze an individual patient's likelihood of IR referral, we needed to restrict our sample to discharges where only 1 clinical specialty performed a paracentesis. Therefore, we excluded hybrid discharges with procedures performed by more than 1 specialty in a single admission as well as discharges with procedures performed by all other specialties. To compare LOS and direct cost outcomes, and to minimize selection bias among exclusively IR‐treated patients, we excluded hospitals without procedures done by both IR and medicine.
We modeled referral to IR as a function of patients' demographic and clinical variables, which we believed would affect the probability of referral. We then examined the IR referral model predicted probabilities (propensity score).[20] Finally, we examined mean differences in LOS and direct costs among discharges with a single clinical specialty group, while using the predicted probability of referral as a filter to compare these outcomes by specialty. We further tested specialty differences in LOS and direct costs controlling for demographic and clinical variables.
Statistical Analysis
To test the significance of differences between demographic and clinical characteristics of patients across specialties, we used 2 tests for categorical variables and analysis of variance or the Kruskal‐Wallis rank test for continuous variables. Random effects logistic regression, which adjusts standard errors for clustering by hospital, was used to model the likelihood of referral to IR. Independent variables included patient age, gender, obesity, coagulation disorders, blood loss anemia, hyponatremia, hypotension, thrombocytopenia, liver transplant before hospitalization, liver transplant during hospitalization, awaiting transplant, complications of liver transplant, ICU stay, Charlson score, and number of paracentesis procedures performed during the admission. Predicted probabilities derived from this IR referral model were used to investigate selection bias in our subsequent analyses of LOS and costs.[20]
We used random effects multiple linear regression to test the association of procedure specialty with hospital LOS and total direct costs, controlling for the same independent variables listed above. Analyses were conducted using both actual LOS in days and Medicare costs. We also performed a log transformation of LOS and costs to account for rightward skew. We only present actual LOS and cost results because results were virtually identical. We used SAS version 9 (SAS Institute Inc., Cary, NC) to extract data from the UHC Clinical Database. We performed all statistical analyses using Stata version 12 (StataCorp LP, College Station, TX).
RESULTS
Procedure and Discharge Level Results
There were 97,577 paracentesis procedures performed during 70,862 hospital admissions in 204 UHC hospitals during the study period. Table 1 shows specific specialty groups for each procedure. The all other category consisted of 17,558 subspecialty groups including 9,434 with specialty unknown. Twenty‐nine percent of procedures were performed in IR versus 27% by medicine, 11% by gastroenterology/hepatology, and 11% by subspecialty medicine.
| Specialty Group | No. | % |
|---|---|---|
| Interventional radiology | 28,414 | 29.1 |
| Medicine | 26,031 | 26.7 |
| Family medicine | 1,026 | 1.1 |
| General medicine | 21,787 | 22.3 |
| Hospitalist | 3,218 | 3.3 |
| Subspecialty medicine | 10,558 | 10.8 |
| Infectious disease | 848 | 0.9 |
| Nephrology | 615 | 0.6 |
| Cardiology | 991 | 1.0 |
| Hematology oncology | 795 | 0.8 |
| Endocrinology | 359 | 0.4 |
| Pulmonology | 6,605 | 6.8 |
| Geriatrics | 345 | 0.4 |
| Gastroenterology/hepatology | 11,143 | 11.4 |
| Transplant medicine | 99 | 0.1 |
| Hepatology | 874 | 0.9 |
| Gastroenterology | 10,170 | 10.4 |
| General surgery | 3,873 | 4.0 |
| Transplant surgery | 2,146 | 2.2 |
| General surgery | 1,727 | 1.8 |
| All other | 17,558 | 18.0 |
| Specialty unknown | 9,434 | 9.7 |
Table 2 presents patient characteristics for 70,862 hospital discharges with paracentesis procedures grouped by whether single or multiple specialties performed procedures. Patient characteristics were significantly different across specialty groups. Medicine, subspecialty medicine, and gastroenterology/hepatology patients were younger, more likely to be male, and more likely to have severe liver disease, coagulation disorders, hypotension, and hyponatremia than IR patients.
| All Discharges, N=70,862 | Interventional Radiology, n=9,348 | Medicine, n=13,789 | Subspecialty Medicine, n=5,085 | Gastroenterology/Hepatology, n=6,664 | General Surgery, n=1,891 | All Other, n=7,912 | Discharges With Multiple Specialties, n=26,173 | |
|---|---|---|---|---|---|---|---|---|
| ||||||||
| Age group, y (%) | ||||||||
| 1849 | 25.4 | 22.5 | 27.6 | 24.9 | 23.5 | 20.8 | 25.5 | 26.1 |
| 5059 | 39.8 | 39.8 | 40.9 | 39.4 | 41.5 | 40.3 | 40.0 | 38.7 |
| 6069 | 24.7 | 24.9 | 21.6 | 24.7 | 26.5 | 30.0 | 23.6 | 25.8 |
| 70+ | 10.1 | 12.9 | 9.9 | 11.1 | 8.4 | 8.9 | 11.0 | 9.4 |
| Male (%) | 65.5 | 64.2 | 67.6 | 67.5 | 65.7 | 66.6 | 65.7 | 64.2 |
| Severe liver disease (%)a | 73.7 | 65.3 | 67.8 | 71.0 | 75.3 | 66.6 | 67.6 | 82.1 |
| Obesity (BMI 40+) (%) | 6.3 | 6.1 | 5.3 | 5.7 | 5.1 | 5.8 | 5.2 | 7.6 |
| Any intensive care unit stay (%) | 31.0 | 10.9 | 16.8 | 50.5 | 16.9 | 36.7 | 22.3 | 47.8 |
| Coagulation disorders (%) | 24.3 | 14.8 | 20.2 | 29.9 | 16.1 | 19.0 | 17.8 | 33.1 |
| Blood loss anemia (%) | 3.4 | 1.3 | 2.8 | 2.7 | 2.7 | 1.9 | 2.1 | 5.2 |
| Hyponatremia (%) | 29.9 | 27.1 | 29.2 | 28.9 | 28.0 | 26.6 | 27.3 | 33.1 |
| Hypotension (%) | 9.8 | 7.0 | 8.0 | 11.0 | 7.7 | 10.5 | 8.1 | 12.4 |
| Thrombocytopenia (%) | 29.6 | 24.6 | 28.3 | 32.5 | 22.1 | 21.5 | 24.0 | 35.8 |
| Complication of transplant (%) | 3.3 | 2.1 | 1.1 | 2.4 | 4.0 | 10.3 | 2.7 | 4.7 |
| Awaiting liver transplant (%) | 7.6 | 6.4 | 4.0 | 5.4 | 12.8 | 16.0 | 7.8 | 8.2 |
| Prior liver transplant (%) | 0.5 | 0.8 | 0.3 | 0.3 | 0.7 | 0.7 | 0.4 | 0.6 |
| Liver transplant procedure (%) | 2.7 | 0.0 | 0.0 | 0.3 | 0.4 | 15.6 | 1.6 | 5.6 |
| Mean Charlson score (SD) | 4.51 (2.17) | 4.28 (2.26) | 4.16 (2.17) | 4.72 (2.30) | 4.30 (1.98) | 4.26 (2.22) | 4.36 (2.30) | 4.84 (2.07) |
| Mean paracentesis procedures per discharge (SD) | 1.38 (0.88) | 1.21 (0.56) | 1.26 (0.66) | 1.30 (0.76) | 1.31 (0.70) | 1.28 (0.78) | 1.22 (0.61) | 1.58 (1.13) |
IR Referral Model
We first excluded 6030/70,862 discharges (8.5%) from 59 hospitals without both IR and medicine procedures. We then further excluded 24,986/70,862 (35.3%) discharges with procedures performed by multiple specialties during the same admission. Finally, we excluded 5555/70,862 (7.8%) of discharges with procedure specialty coded as all other. Therefore, 34,291 (48.4%) discharges (43,337/97,577; 44.4% procedures) from 145 UHC hospitals with paracentesis procedures performed by a single clinical specialty group remained for the IR referral analysis sample. Among admissions with multiple specialty paracentesis performed within the same admission, 3128/26,606 admissions with any IR procedure (11.8%) had a different specialty ascribed to the first, second, or third paracentesis with a subsequent IR procedure.
Model results (Table 3) indicate that patients who were obese (odds ratio [OR]: 1.25; 95% confidence interval [CI]: 1.10‐1.43) or had a liver transplant on a prior admission (OR: 2.03; 95% CI: 1.40‐2.95) were more likely to be referred to IR. However, male patients (OR: 0.89; 95% CI: 0.83‐0.95), or patients who required an ICU stay (OR: 0.39; 95% CI: 0.36‐0.43) were less likely to have IR procedures. Other patient factors reducing the likelihood of IR referral included characteristics associated with higher severity of illness (coagulation disorders, hyponatremia, hypotension, and thrombocytopenia).
| Odds Ratio | 95% CI | ||
|---|---|---|---|
| Lower | Upper | ||
| |||
| Age group, y | |||
| 1849 | Reference | ||
| 5059 | 1.05 | 0.97 | 1.14 |
| 6069 | 1.12 | 1.02 | 1.22 |
| 70+ | 1.11 | 0.99 | 1.24 |
| Male | 0.89 | 0.83 | 0.95 |
| Obesity, BMI 40+ | 1.25 | 1.10 | 1.43 |
| ICU care | 0.39 | 0.36 | 0.43 |
| Coagulation disorders | 0.68 | 0.63 | 0.75 |
| Blood loss anemia | 0.52 | 0.41 | 0.66 |
| Hyponatremia | 0.85 | 0.80 | 0.92 |
| Hypotension | 0.83 | 0.74 | 0.93 |
| Thrombocytopenia | 0.94 | 0.87 | 1.01 |
| Prior liver transplant | 0.08 | 0.03 | 0.23 |
| Awaiting liver transplant | 0.86 | 0.76 | 0.98 |
| Complication of liver transplant | 1.07 | 0.88 | 1.31 |
| Liver transplant procedure | 2.03 | 1.40 | 2.95 |
| Charlson score | 1.00 | 0.99 | 1.01 |
| Number of paracentesis procedures | 0.90 | 0.85 | 0.95 |
Predicted Probabilities of IR Referral
Figure 1 presents the distribution of predicted probabilities for IR referral. Predicted probabilities were low overall, with very few patients having an equal chance of referralthe standard often used in comparative effectiveness analyses from observational data. Figure 1 indicates that IR referral probabilities were clustered in an unusual bimodal distribution. The cluster on the left, which centers around a 15% predicted probability of IR referral, consists of discharges with patient characteristics that were associated with a very low chance of an IR paracentesis. We therefore used this distribution to conduct comparative analyses of admission outcomes between clinical specialty groups, choosing to examine patients with a 20% or greater chance of IR referral.
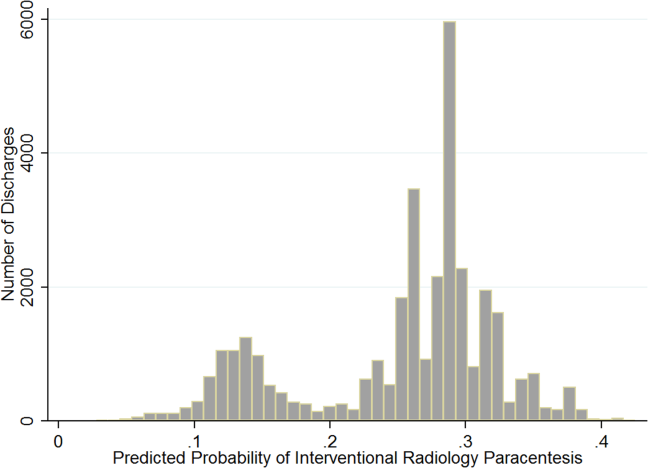
Post hoc analysis revealed that the biggest factor driving low predicted probability of IR referral was whether patients experienced an ICU stay at any time during hospitalization. Among the discharges with a predicted probability 0.2 (n=26,615 discharges), there were only 87 discharges with ICU stays (0.3%). For the discharges with predicted probability <0.2 (n=7676), 91.9% (n=7055) had an ICU admission. We therefore used a threshold of 0.2 or greater to present the most comparable LOS and direct cost differences.
LOS and Cost Comparisons by Specialty
Mean LOS and hospital direct costs by specialty for our final analysis sample can be found in Table 4; differences between specialties were significant (P<0.0001). Patients undergoing IR procedures had equivalent LOS and costs to medicine patients, but lower LOS and costs than other clinical specialty groups. Random effects linear regression showed that neither medicine nor gastroenterology/hepatology patients had significantly different LOS from IR patients, but subspecialty medicine was associated with 0.89 additional days and general surgery with 1.47 additional days (both P<0.0001; R2=0.10). In the direct cost regression model, medicine patients were associated with $1308 lower costs and gastroenterology/hepatology patients with $803 lower costs than IR patients (both P=0.0001), whereas subspecialty medicine and general surgery had higher direct costs per discharge of $1886 and $3039, respectively (both P<0.0001, R2=0.19). Older age, obesity, coagulopathy, hyponatremia, hypotension, thrombocytopenia, liver transplant status, ICU care, higher Charlson score, and higher number of paracentesis procedures performed were all significantly associated with higher LOS and hospital costs in these linear models.
| All Admissions n=26,615 | Interventional Radiology n=7,677 | Medicine n=10,413 | Medicine Subspecialties n=2,210 | Gastroenterology/ Hepatology n=5,182 | General Surgery n=1,133 | |
|---|---|---|---|---|---|---|
| All Admissions n=24,408 | Interventional Radiology n =7,265 | Medicine n=8,965, | Medicine Subspecialties n=2,064 | Gastroenterology/Hepatology n=5,031 | General Surgery n=1,083 | |
| ||||||
| Mean length of stay, d (SD) | 5.57 (5.63) | 5.20 (4.72) | 5.59 (5.85) | 6.28 (6.47) | 5.54 (5.31) | 6.67 (8.16) |
| Mean total direct cost, $ (SD)a | 11,447 (12,247) | 10,975 (9,723) | 10,517 (10,895) | 13,705 (16,591) | 12,000 (11,712) | 15,448 (23,807) |
DISCUSSION
This study showed that internal medicine‐ and family medicine‐trained clinicians perform approximately half of the inpatient paracentesis procedures at university hospitals and their affiliates. This confirms findings from our earlier single‐institution study[16] but contrasts with previously published reports involving Medicare data. The earlier report, using Medicare claims and including ambulatory procedures, revealed that primary care physicians and gastroenterologists only performed approximately 10% of US paracentesis procedures in 2008.[7] Our findings suggest that practices are different at university hospitals, where patients with severe liver disease often seek care. Because we used the UHC database, it was not possible to determine if the clinicians who performed paracentesis procedures in this study were internal medicine or family medicine residents, fellows, or attending physicians. However, findings from our own institution show that the vast majority of bedside paracentesis procedures are performed by internal medicine residents.[16]
Our findings have implications for certification of internal medicine and family medicine trainees. In 2008, the ABIM removed the requirement that internal medicine residents demonstrate competency in paracentesis.[12] This decision was informed by a lack of standardized methods to determine procedural competency and published surveys showing that internal medicine and hospitalist physicians rarely performed bedside procedures.[5, 6] Despite this policy change, our findings show that current clinical practice at university hospitals does not reflect national practice patterns or certification requirements, because many internal medicine‐ and family medicine‐trained clinicians still perform paracentesis procedures. This is concerning because internal medicine and family medicine trainees report variable confidence, experience, expertise, and supervision regarding performance of invasive procedures.[9, 10, 21, 22, 23, 24] Furthermore, earlier research also demonstrates that graduating residents and fellows are not able to competently perform common bedside procedures such as thoracentesis, temporary hemodialysis catheter insertion, and lumbar puncture.[25, 26, 27]
The American Association for the Study of Liver Diseases (AASLD) recommends that trained clinicians perform paracentesis procedures.[3, 4] However, the AASLD provides no definition for how training should occur. Because competency in this procedure is not specifically required by the ABIM, ABFM, or ACGME, a paradoxical situation occurs in which internal medicine and family medicine residents, and internal medicine‐trained fellows and faculty continue to perform paracentesis procedures on highly complex patients, but are no longer required to be competent to do so.
In earlier research we showed that simulation‐based mastery learning (SBML) was an effective method to boost internal medicine residents' paracentesis skills.[28] In SBML, all trainees must meet or exceed a minimum passing score on a simulated procedure before performing one on an actual patient.[29] This approach improves clinical care and outcomes in procedures such as central venous catheter insertion[30, 31] and advanced cardiac life support.[32] SBML‐trained residents also performed safe paracentesis procedures with shorter hospital LOS, fewer ICU transfers, and fewer blood product transfusions than IR procedures.[16] Based on the results of this study, AASLD guidelines regarding training, and our experience with SBML, we recommend that all clinicians complete paracentesis SBML training before performing procedures on patients.
Using our propensity model we identified patient characteristics that were associated with IR referral. Patients with a liver transplant were more likely to be cared for in IR. This may be due to a belief that postoperative procedures are anatomically more complex or because surgical trainees do not commonly perform this procedure. The current study confirms findings from earlier work that obese and female patients are more likely to be referred to IR.[16] IR referral of obese patients is likely to occur because paracentesis procedures are technically more difficult. We have no explanation why female patients were more likely to be referred to IR, because most decisions appear to be discretionary. Prospective studies are needed to determine evidence‐based recommendations regarding paracentesis procedure location. Patients with more comorbidities (eg, ICU stay, awaiting liver transplant, coagulation disorders) were more likely to undergo bedside procedures. The complexity of patients undergoing bedside paracentesis procedures reinforces the need for rigorous skill assessment for clinicians who perform them because complications such as intraperitoneal bleeding can be fatal.
Finally, we showed that LOS was similar but hospital direct costs were $800 to $1300 lower for patients whose paracentesis procedure was performed by medicine or gastroenterology/hepatology compared to IR. Medical subspecialties and surgery procedures were more expensive than IR, consistent with the higher LOS seen in these groups. IR procedures add costs due to facility charges for space, personnel, and equipment.[33] At our institution, the hospital cost of an IR paracentesis in 2012 was $361. If we use this figure, and assume costs are similar across university hospitals, the resultant cost savings would be $10,257,454 (for the procedure alone) if all procedures referred to IR in this 2‐year study were instead performed at the bedside. This estimate is approximate because it does not consider factors such as cost of clinician staffing models, which may differ across UHC hospitals. As hospitals look to reduce costs, potential savings due to appropriate use of bedside and IR procedures should be considered. This is especially important because there is no evidence that the extra expense of IR procedures is justified due to improved patient outcomes.
This study has several limitations. First, this was an observational study. Although the database was large, we were limited by coding accuracy and could not control for all potential confounding factors such as Model for End‐Stage Liver Disease score,[34, 35] other specific laboratory values, amount of ascites fluid removed, or bedside procedure failures later referred to IR. However, we do know that only a small number of second, third, or fourth procedures were subsequently referred to IR after earlier ones were performed at the bedside. Additionally the UHC database does not include patient‐specific data, and therefore we could not adjust for multiple visits or procedures by the same patient. Second, we were unable to determine the level of teaching involvement at each UHC affiliated hospital. Community hospitals where attendings managed most of the patients without trainees could not be differentiated from university hospitals where trainees were involved in most patients' care. Third, we did not have specialty information for 9434 (9.7%) procedures and had to exclude these cases. We also excluded a large number of paracentesis procedures in our final outcomes analysis. However, this was necessary because we needed to perform a patient‐level analysis to ensure the propensity and outcomes models were accurate. Finally, we did not evaluate inpatient mortality or 30‐day hospital readmission rates. Mortality and readmission from complications of a paracentesis procedure are rare events.[3, 4, 36] However, mortality and hospital readmission among patients with liver disease are relatively common.[37, 38] It was impossible to link these outcomes to a paracentesis procedure without the ability to perform medical records review.
In conclusion, paracentesis procedures are performed frequently by internal medicine‐ and family medicine‐trained clinicians in university hospitals. Because of these findings regarding current practice patterns, we believe the ACGME, ABIM, and ABFM should clarify their policies to require that residents are competent to perform paracentesis procedures before performing them on patients. This may improve supervision and training for paracentesis procedures that are already occurring and possibly encourage performance of additional, less costly bedside procedures.
Acknowledgements
The authors acknowledge Drs. Douglas Vaughan and Mark Williams for their support and encouragement of this work.
Disclosure: Nothing to report.
- . A primer on detecting cirrhosis and caring for these patients without causing harm. Int J Hepatol. 2011:801983.
- , , . Diagnosis and epidemiology of cirrhosis. Med Clin North Am. 2009;93(4):787–799.
- ; AASLD Practice Guidelines Committee. Management of adult patients with ascites due to cirrhosis: an update. Hepatology. 2009;49(6):2087–2107.
- ; AASLD Practice Guidelines Committee. Management of adult patients with ascites due to cirrhosis: update 2012. Hepatology. 2009;49:2087–2107. Available at: http://www.aasld.org/practiceguidelines/Documents/ascitesupdate2013.pdf. Accessed October 21, 2013.
- , , , , . Procedures performed by hospitalist and non‐hospitalist general internists. J Gen Intern Med. 2010;25(5):448–452.
- , . The declining number and variety of procedures done by general internists: a resurvey of members of the American College of Physicians. Ann Intern Med. 2007;146(5):355–360.
- , , . National fluid shifts: fifteen‐year trends in paracentesis and thoracentesis procedures. J Am Coll Radiol. 2010;7(11):859–864.
- , . What procedures should internists do? Ann Intern Med. 2007;146(5):392–393.
- , , , , , . Beyond the comfort zone: residents assess their comfort performing inpatient medicine procedures. Am J Med. 2006;119(1)71.e17–e24.
- , , . Perception of competency to perform procedures and future practice intent: a national survey of family practice residents. Acad Med. 2003;78(9):926–932.
- , , , . Utilization of and adherence to the gastroenterology core curriculum on hepatology training during a gastrointestinal fellowship. Clin Gastroenterol Hepatol. 2008;6(6):682–688.
- American Board of Internal Medicine. Internal medicine policies. Available at: http://www.abim.org/certification/policies/imss/im.aspx. Accessed December 21, 2013.
- A CGME program requirements for graduate medical education in internal medicine. Available at: http://acgme.org/acgmeweb/portals/0/PFassets/2013‐PR‐FAQ‐PIF/140_internal_medicine_07012013.pdf. Accessed December 17, 2013.
- American Board of Family Medicine residency requirements. Available at: https://www.theabfm.org/cert/guidelines.aspx. Accessed December 17, 2013.
- ACGME program requirements for graduate medical education in family medicine. Available at: http://www.acgme.org/acgmeweb/Portals/0/PFAssets/ProgramRequirements/120pr07012007.pdf. Accessed December 17, 2013.
- , , , , . Clinical outcomes after bedside and interventional radiology paracentesis procedures. Am J Med. 2013;126(4):349–356.
- , , , et al. Performance standards for therapeutic abdominal paracentesis. Hepatology. 2004;40(2):484–488.
- , , . Adapting a clinical comorbidity index for use with ICD‐9‐CM administrative databases. J Clin Epidemiol. 1992;45(6):613–619.
- , , . Adapting a clinical comorbidity index for use with ICD‐9‐CM administrative data: differing perspectives. J Clin Epidemiol. 1993;46(10):1075–1079; discussion 1081–1090.
- . The role of known effects in observational studies. Biometrics. 1998;45(2):557–569.
- , , , et al. A systematic review: the effect of clinical supervision on patient and residency education outcomes. Acad Med. 2012;87(4):428–442.
- , , , et al. Impact of a bedside procedure service on general medicine inpatients: a firm‐based trial. J Hosp Med. 2007;2(3):143–149.
- , , , , , . Effects of increased overnight supervision on resident education, decision‐making, and autonomy. J Hosp Med. 2012;7(8):606–610.
- , . Performance of procedures by nephrologists and nephrology fellows at U.S. nephrology training programs. Clin J Am Soc Nephrol. 2008;3(4):941–947.
- , , , , . Mastery learning of thoracentesis skills by internal medicine residents using simulation technology and deliberate practice. J Hosp Med. 2008;3:49–54.
- , , , , . Mastery learning of temporary dialysis catheter insertion skills by nephrology fellows using simulation technology and deliberate practice. Am J Kidney Dis. 2009;54:70–76.
- , , , , , . Simulation‐based education with mastery learning improves residents' lumbar puncture skills. Neurology. 2012;79:132–137.
- , , , , , . Simulation‐based education with mastery learning improves paracentesis skills. J Grad Med Educ. 2012;4(1):23–27.
- , , , , . Medical education featuring mastery learning with deliberate practice can lead to better health for individuals and populations. Acad Med. 2011; 86(11):e8–e9.
- , , , , . Simulation‐based mastery learning reduces complications during central venous catheter insertion in a medical intensive care unit. Crit Care Med. 2009;37(10):2697–2701.
- , , , , . Use of simulation‐based education to reduce catheter‐related bloodstream infections. Arch Intern Med. 2009;169(15):1420–1423.
- , , , et al. Progress toward improving the quality of cardiac arrest medical team responses at an academic teaching hospital. J Grad Med Educ. 2011;3(2):211–216.
- , , , et al. Technical cost of radiologic examinations: analysis across imaging modalities. Radiology. 2000;216(1):269–272.
- , , , et al. A model to predict survival in patients with end‐stage liver disease. Hepatology. 2001;33(2):464–470.
- , , , et al. Model for end‐stage liver disease (MELD) and allocation of donor livers. Gastroenterology. 2003;124(1):91–96.
- , , , . Videos in clinical medicine. Paracentesis. N Engl J Med. 2006;355(19):e21.
- Center for Disease Control and Prevention. Chronic liver disease or cirrhosis. National Hospital Discharge Survey: 2010 detailed diagnosis and procedure tables, number of first‐listed diagnoses (see ICD9‐CM code 571). Available at: http://www.cdc.gov/nchs/fastats/liverdis.htm. Accessed October 19, 2013.
- , , , et al. Incidence and predictors of 30‐day readmission among patients hospitalized for advanced liver disease. Clin Gastroenterol Hepatol. 2011;9(3):254–259.
Cirrhosis affects up to 3% of the population and is 1 of the 10 most common causes of death in the United States.[1, 2, 3, 4] Paracentesis procedures are frequently performed in patients with liver disease and ascites for diagnostic and/or therapeutic purposes. These procedures can be performed safely by trained clinicians at the bedside or referred to interventional radiology (IR).[2, 3, 4]
National practice patterns show that paracentesis procedures are increasingly referred to IR rather than performed at the bedside by internal medicine or gastroenterology clinicians.[5, 6, 7] In fact, a recent study of Medicare beneficiaries showed that inpatient and outpatient paracentesis procedures performed by radiologists increased by 964% from 1993 to 2008.[7] Reasons for the decline in bedside procedures include the increased availability of IR, lack of sufficient reimbursement, and the time required to perform paracentesis procedures.[5, 6, 7, 8] Surveys of internal medicine and family medicine residents and gastroenterology fellows show trainees often lack the confidence and experience needed to perform the procedure safely.[9, 10, 11] Additionally, many clinicians do not have expertise with ultrasound use and may not have access to necessary equipment.
Inconsistent certification requirements may also impact the competence and experience of physicians to perform paracentesis procedures. Internal medicine residents are no longer required by the American Board of Internal Medicine (ABIM) to demonstrate competency in procedures such as paracentesis for certification.[12] However, the Accreditation Council for Graduate Medical Education (ACGME) requirements state that internal medicine programs must offer residents the opportunity to demonstrate competence in the performance of procedures such as paracentesis, thoracentesis, and central venous catheter insertion.[13] The American Board of Family Medicine (ABFM) does not outline specific procedural competence for initial certification.[14] The ACGME states that family medicine residents must receive training to perform those clinical procedures required for their future practices but allows each program to determine which procedures to require.[15] Due to this uncertainty, practicing hospitalists are likely to have variable training and competence in bedside procedures such as paracentesis.
We previously showed that internal medicine residents rotating on the hepatology service of an academic medical center performed 59% of paracentesis procedures at the bedside.[16] These findings are in contrast to national data showing that 74% of paracentesis procedures performed on Medicare beneficiaries were performed by radiologists.[7] Practice patterns at university hospitals may not be reflected in this data because the study was limited to Medicare beneficiaries and included ambulatory patients.[7] In addition to uncertainty about who is performing this procedure in inpatient settings, little is known about the effect of specialty on postparacentesis clinical outcomes.[16, 17]
The current study had 3 aims: (1) evaluate which clinical specialties perform paracentesis procedures at university hospitals; (2) model patient characteristics associated with procedures performed at the bedside versus those referred to IR; and (3) among patients with a similar likelihood of IR referral, evaluate length of stay (LOS) and hospital costs of patients undergoing procedures performed by different specialties.
METHODS
We performed an observational administrative database review of patients who underwent paracentesis procedures in hospitals participating in the University HealthSystem Consortium (UHC) Clinical Database from January 2010 through December 2012. UHC is an alliance of 120 nonprofit academic medical centers and their 290 affiliated hospitals. UHC maintains databases containing clinical, operational, financial, and patient safety data from affiliated hospitals. Using the UHC database, we described the characteristics of all patients who underwent paracentesis procedures by clinical specialty performing the procedure. We then modeled the effects of patient characteristics on decision‐making about IR referral. Finally, among patients with a homogeneous predicted probability of IR referral, we compared LOS and direct costs by specialty performing the procedure. The Northwestern University institutional review board approved this study.
Procedure
We queried the UHC database for all patients over the age of 18 years who underwent paracentesis procedures (International Classification of Disease Revision 9 [ICD‐9] procedure code 54.91) and had at least 1 diagnosis code of liver disease (571.x). We excluded patients admitted to obstetrics. The query included patient and clinical characteristics such as admission, discharge, and procedure date; age, gender, procedure provider specialty, and intensive care unit (ICU) stay. We also obtained all ICD‐9 codes associated with the admission including obesity, severe liver disease, coagulation disorders, blood loss anemia, hyponatremia, hypotension, thrombocytopenia, liver transplant before or during the admission, awaiting liver transplant, and complications of liver transplant. We used ICD‐9 codes to calculate patients' Charlson score[18, 19] to assess severity of illness on admission.
LOS and total direct hospital costs were compared among patients with a paracentesis performed by a single clinical group and among patients with a similar predicted probability of IR referral. UHC generates direct cost estimates by applying Medicare Cost Report ratios of cost to charges with the labor cost further adjusted by the respective area wage index. Hospital costs were not available from 8.3% of UHC hospitals. We therefore based cost estimates on nonmissing data.
Paracentesis provider specialties were divided into 6 general categories: (1) IR (interventional and diagnostic radiology); (2) medicine (family medicine, general medicine, and hospital medicine); (3) subspecialty medicine (infectious disease, cardiology, nephrology, hematology/oncology, endocrinology, pulmonary, and geriatrics); (4) gastroenterology/hepatology (gastroenterology, hepatology, and transplant medicine); (5) general surgery (general surgery and transplant surgery); and (6) all other (included unclassified specialties). We present patient characteristics categorized by these specialty groups and for admissions in which multiple specialties performed procedures.
Study Design
To analyze an individual patient's likelihood of IR referral, we needed to restrict our sample to discharges where only 1 clinical specialty performed a paracentesis. Therefore, we excluded hybrid discharges with procedures performed by more than 1 specialty in a single admission as well as discharges with procedures performed by all other specialties. To compare LOS and direct cost outcomes, and to minimize selection bias among exclusively IR‐treated patients, we excluded hospitals without procedures done by both IR and medicine.
We modeled referral to IR as a function of patients' demographic and clinical variables, which we believed would affect the probability of referral. We then examined the IR referral model predicted probabilities (propensity score).[20] Finally, we examined mean differences in LOS and direct costs among discharges with a single clinical specialty group, while using the predicted probability of referral as a filter to compare these outcomes by specialty. We further tested specialty differences in LOS and direct costs controlling for demographic and clinical variables.
Statistical Analysis
To test the significance of differences between demographic and clinical characteristics of patients across specialties, we used 2 tests for categorical variables and analysis of variance or the Kruskal‐Wallis rank test for continuous variables. Random effects logistic regression, which adjusts standard errors for clustering by hospital, was used to model the likelihood of referral to IR. Independent variables included patient age, gender, obesity, coagulation disorders, blood loss anemia, hyponatremia, hypotension, thrombocytopenia, liver transplant before hospitalization, liver transplant during hospitalization, awaiting transplant, complications of liver transplant, ICU stay, Charlson score, and number of paracentesis procedures performed during the admission. Predicted probabilities derived from this IR referral model were used to investigate selection bias in our subsequent analyses of LOS and costs.[20]
We used random effects multiple linear regression to test the association of procedure specialty with hospital LOS and total direct costs, controlling for the same independent variables listed above. Analyses were conducted using both actual LOS in days and Medicare costs. We also performed a log transformation of LOS and costs to account for rightward skew. We only present actual LOS and cost results because results were virtually identical. We used SAS version 9 (SAS Institute Inc., Cary, NC) to extract data from the UHC Clinical Database. We performed all statistical analyses using Stata version 12 (StataCorp LP, College Station, TX).
RESULTS
Procedure and Discharge Level Results
There were 97,577 paracentesis procedures performed during 70,862 hospital admissions in 204 UHC hospitals during the study period. Table 1 shows specific specialty groups for each procedure. The all other category consisted of 17,558 subspecialty groups including 9,434 with specialty unknown. Twenty‐nine percent of procedures were performed in IR versus 27% by medicine, 11% by gastroenterology/hepatology, and 11% by subspecialty medicine.
| Specialty Group | No. | % |
|---|---|---|
| Interventional radiology | 28,414 | 29.1 |
| Medicine | 26,031 | 26.7 |
| Family medicine | 1,026 | 1.1 |
| General medicine | 21,787 | 22.3 |
| Hospitalist | 3,218 | 3.3 |
| Subspecialty medicine | 10,558 | 10.8 |
| Infectious disease | 848 | 0.9 |
| Nephrology | 615 | 0.6 |
| Cardiology | 991 | 1.0 |
| Hematology oncology | 795 | 0.8 |
| Endocrinology | 359 | 0.4 |
| Pulmonology | 6,605 | 6.8 |
| Geriatrics | 345 | 0.4 |
| Gastroenterology/hepatology | 11,143 | 11.4 |
| Transplant medicine | 99 | 0.1 |
| Hepatology | 874 | 0.9 |
| Gastroenterology | 10,170 | 10.4 |
| General surgery | 3,873 | 4.0 |
| Transplant surgery | 2,146 | 2.2 |
| General surgery | 1,727 | 1.8 |
| All other | 17,558 | 18.0 |
| Specialty unknown | 9,434 | 9.7 |
Table 2 presents patient characteristics for 70,862 hospital discharges with paracentesis procedures grouped by whether single or multiple specialties performed procedures. Patient characteristics were significantly different across specialty groups. Medicine, subspecialty medicine, and gastroenterology/hepatology patients were younger, more likely to be male, and more likely to have severe liver disease, coagulation disorders, hypotension, and hyponatremia than IR patients.
| All Discharges, N=70,862 | Interventional Radiology, n=9,348 | Medicine, n=13,789 | Subspecialty Medicine, n=5,085 | Gastroenterology/Hepatology, n=6,664 | General Surgery, n=1,891 | All Other, n=7,912 | Discharges With Multiple Specialties, n=26,173 | |
|---|---|---|---|---|---|---|---|---|
| ||||||||
| Age group, y (%) | ||||||||
| 1849 | 25.4 | 22.5 | 27.6 | 24.9 | 23.5 | 20.8 | 25.5 | 26.1 |
| 5059 | 39.8 | 39.8 | 40.9 | 39.4 | 41.5 | 40.3 | 40.0 | 38.7 |
| 6069 | 24.7 | 24.9 | 21.6 | 24.7 | 26.5 | 30.0 | 23.6 | 25.8 |
| 70+ | 10.1 | 12.9 | 9.9 | 11.1 | 8.4 | 8.9 | 11.0 | 9.4 |
| Male (%) | 65.5 | 64.2 | 67.6 | 67.5 | 65.7 | 66.6 | 65.7 | 64.2 |
| Severe liver disease (%)a | 73.7 | 65.3 | 67.8 | 71.0 | 75.3 | 66.6 | 67.6 | 82.1 |
| Obesity (BMI 40+) (%) | 6.3 | 6.1 | 5.3 | 5.7 | 5.1 | 5.8 | 5.2 | 7.6 |
| Any intensive care unit stay (%) | 31.0 | 10.9 | 16.8 | 50.5 | 16.9 | 36.7 | 22.3 | 47.8 |
| Coagulation disorders (%) | 24.3 | 14.8 | 20.2 | 29.9 | 16.1 | 19.0 | 17.8 | 33.1 |
| Blood loss anemia (%) | 3.4 | 1.3 | 2.8 | 2.7 | 2.7 | 1.9 | 2.1 | 5.2 |
| Hyponatremia (%) | 29.9 | 27.1 | 29.2 | 28.9 | 28.0 | 26.6 | 27.3 | 33.1 |
| Hypotension (%) | 9.8 | 7.0 | 8.0 | 11.0 | 7.7 | 10.5 | 8.1 | 12.4 |
| Thrombocytopenia (%) | 29.6 | 24.6 | 28.3 | 32.5 | 22.1 | 21.5 | 24.0 | 35.8 |
| Complication of transplant (%) | 3.3 | 2.1 | 1.1 | 2.4 | 4.0 | 10.3 | 2.7 | 4.7 |
| Awaiting liver transplant (%) | 7.6 | 6.4 | 4.0 | 5.4 | 12.8 | 16.0 | 7.8 | 8.2 |
| Prior liver transplant (%) | 0.5 | 0.8 | 0.3 | 0.3 | 0.7 | 0.7 | 0.4 | 0.6 |
| Liver transplant procedure (%) | 2.7 | 0.0 | 0.0 | 0.3 | 0.4 | 15.6 | 1.6 | 5.6 |
| Mean Charlson score (SD) | 4.51 (2.17) | 4.28 (2.26) | 4.16 (2.17) | 4.72 (2.30) | 4.30 (1.98) | 4.26 (2.22) | 4.36 (2.30) | 4.84 (2.07) |
| Mean paracentesis procedures per discharge (SD) | 1.38 (0.88) | 1.21 (0.56) | 1.26 (0.66) | 1.30 (0.76) | 1.31 (0.70) | 1.28 (0.78) | 1.22 (0.61) | 1.58 (1.13) |
IR Referral Model
We first excluded 6030/70,862 discharges (8.5%) from 59 hospitals without both IR and medicine procedures. We then further excluded 24,986/70,862 (35.3%) discharges with procedures performed by multiple specialties during the same admission. Finally, we excluded 5555/70,862 (7.8%) of discharges with procedure specialty coded as all other. Therefore, 34,291 (48.4%) discharges (43,337/97,577; 44.4% procedures) from 145 UHC hospitals with paracentesis procedures performed by a single clinical specialty group remained for the IR referral analysis sample. Among admissions with multiple specialty paracentesis performed within the same admission, 3128/26,606 admissions with any IR procedure (11.8%) had a different specialty ascribed to the first, second, or third paracentesis with a subsequent IR procedure.
Model results (Table 3) indicate that patients who were obese (odds ratio [OR]: 1.25; 95% confidence interval [CI]: 1.10‐1.43) or had a liver transplant on a prior admission (OR: 2.03; 95% CI: 1.40‐2.95) were more likely to be referred to IR. However, male patients (OR: 0.89; 95% CI: 0.83‐0.95), or patients who required an ICU stay (OR: 0.39; 95% CI: 0.36‐0.43) were less likely to have IR procedures. Other patient factors reducing the likelihood of IR referral included characteristics associated with higher severity of illness (coagulation disorders, hyponatremia, hypotension, and thrombocytopenia).
| Odds Ratio | 95% CI | ||
|---|---|---|---|
| Lower | Upper | ||
| |||
| Age group, y | |||
| 1849 | Reference | ||
| 5059 | 1.05 | 0.97 | 1.14 |
| 6069 | 1.12 | 1.02 | 1.22 |
| 70+ | 1.11 | 0.99 | 1.24 |
| Male | 0.89 | 0.83 | 0.95 |
| Obesity, BMI 40+ | 1.25 | 1.10 | 1.43 |
| ICU care | 0.39 | 0.36 | 0.43 |
| Coagulation disorders | 0.68 | 0.63 | 0.75 |
| Blood loss anemia | 0.52 | 0.41 | 0.66 |
| Hyponatremia | 0.85 | 0.80 | 0.92 |
| Hypotension | 0.83 | 0.74 | 0.93 |
| Thrombocytopenia | 0.94 | 0.87 | 1.01 |
| Prior liver transplant | 0.08 | 0.03 | 0.23 |
| Awaiting liver transplant | 0.86 | 0.76 | 0.98 |
| Complication of liver transplant | 1.07 | 0.88 | 1.31 |
| Liver transplant procedure | 2.03 | 1.40 | 2.95 |
| Charlson score | 1.00 | 0.99 | 1.01 |
| Number of paracentesis procedures | 0.90 | 0.85 | 0.95 |
Predicted Probabilities of IR Referral
Figure 1 presents the distribution of predicted probabilities for IR referral. Predicted probabilities were low overall, with very few patients having an equal chance of referralthe standard often used in comparative effectiveness analyses from observational data. Figure 1 indicates that IR referral probabilities were clustered in an unusual bimodal distribution. The cluster on the left, which centers around a 15% predicted probability of IR referral, consists of discharges with patient characteristics that were associated with a very low chance of an IR paracentesis. We therefore used this distribution to conduct comparative analyses of admission outcomes between clinical specialty groups, choosing to examine patients with a 20% or greater chance of IR referral.
Post hoc analysis revealed that the biggest factor driving low predicted probability of IR referral was whether patients experienced an ICU stay at any time during hospitalization. Among the discharges with a predicted probability 0.2 (n=26,615 discharges), there were only 87 discharges with ICU stays (0.3%). For the discharges with predicted probability <0.2 (n=7676), 91.9% (n=7055) had an ICU admission. We therefore used a threshold of 0.2 or greater to present the most comparable LOS and direct cost differences.
LOS and Cost Comparisons by Specialty
Mean LOS and hospital direct costs by specialty for our final analysis sample can be found in Table 4; differences between specialties were significant (P<0.0001). Patients undergoing IR procedures had equivalent LOS and costs to medicine patients, but lower LOS and costs than other clinical specialty groups. Random effects linear regression showed that neither medicine nor gastroenterology/hepatology patients had significantly different LOS from IR patients, but subspecialty medicine was associated with 0.89 additional days and general surgery with 1.47 additional days (both P<0.0001; R2=0.10). In the direct cost regression model, medicine patients were associated with $1308 lower costs and gastroenterology/hepatology patients with $803 lower costs than IR patients (both P=0.0001), whereas subspecialty medicine and general surgery had higher direct costs per discharge of $1886 and $3039, respectively (both P<0.0001, R2=0.19). Older age, obesity, coagulopathy, hyponatremia, hypotension, thrombocytopenia, liver transplant status, ICU care, higher Charlson score, and higher number of paracentesis procedures performed were all significantly associated with higher LOS and hospital costs in these linear models.
| All Admissions n=26,615 | Interventional Radiology n=7,677 | Medicine n=10,413 | Medicine Subspecialties n=2,210 | Gastroenterology/ Hepatology n=5,182 | General Surgery n=1,133 | |
|---|---|---|---|---|---|---|
| All Admissions n=24,408 | Interventional Radiology n =7,265 | Medicine n=8,965, | Medicine Subspecialties n=2,064 | Gastroenterology/Hepatology n=5,031 | General Surgery n=1,083 | |
| ||||||
| Mean length of stay, d (SD) | 5.57 (5.63) | 5.20 (4.72) | 5.59 (5.85) | 6.28 (6.47) | 5.54 (5.31) | 6.67 (8.16) |
| Mean total direct cost, $ (SD)a | 11,447 (12,247) | 10,975 (9,723) | 10,517 (10,895) | 13,705 (16,591) | 12,000 (11,712) | 15,448 (23,807) |
DISCUSSION
This study showed that internal medicine‐ and family medicine‐trained clinicians perform approximately half of the inpatient paracentesis procedures at university hospitals and their affiliates. This confirms findings from our earlier single‐institution study[16] but contrasts with previously published reports involving Medicare data. The earlier report, using Medicare claims and including ambulatory procedures, revealed that primary care physicians and gastroenterologists only performed approximately 10% of US paracentesis procedures in 2008.[7] Our findings suggest that practices are different at university hospitals, where patients with severe liver disease often seek care. Because we used the UHC database, it was not possible to determine if the clinicians who performed paracentesis procedures in this study were internal medicine or family medicine residents, fellows, or attending physicians. However, findings from our own institution show that the vast majority of bedside paracentesis procedures are performed by internal medicine residents.[16]
Our findings have implications for certification of internal medicine and family medicine trainees. In 2008, the ABIM removed the requirement that internal medicine residents demonstrate competency in paracentesis.[12] This decision was informed by a lack of standardized methods to determine procedural competency and published surveys showing that internal medicine and hospitalist physicians rarely performed bedside procedures.[5, 6] Despite this policy change, our findings show that current clinical practice at university hospitals does not reflect national practice patterns or certification requirements, because many internal medicine‐ and family medicine‐trained clinicians still perform paracentesis procedures. This is concerning because internal medicine and family medicine trainees report variable confidence, experience, expertise, and supervision regarding performance of invasive procedures.[9, 10, 21, 22, 23, 24] Furthermore, earlier research also demonstrates that graduating residents and fellows are not able to competently perform common bedside procedures such as thoracentesis, temporary hemodialysis catheter insertion, and lumbar puncture.[25, 26, 27]
The American Association for the Study of Liver Diseases (AASLD) recommends that trained clinicians perform paracentesis procedures.[3, 4] However, the AASLD provides no definition for how training should occur. Because competency in this procedure is not specifically required by the ABIM, ABFM, or ACGME, a paradoxical situation occurs in which internal medicine and family medicine residents, and internal medicine‐trained fellows and faculty continue to perform paracentesis procedures on highly complex patients, but are no longer required to be competent to do so.
In earlier research we showed that simulation‐based mastery learning (SBML) was an effective method to boost internal medicine residents' paracentesis skills.[28] In SBML, all trainees must meet or exceed a minimum passing score on a simulated procedure before performing one on an actual patient.[29] This approach improves clinical care and outcomes in procedures such as central venous catheter insertion[30, 31] and advanced cardiac life support.[32] SBML‐trained residents also performed safe paracentesis procedures with shorter hospital LOS, fewer ICU transfers, and fewer blood product transfusions than IR procedures.[16] Based on the results of this study, AASLD guidelines regarding training, and our experience with SBML, we recommend that all clinicians complete paracentesis SBML training before performing procedures on patients.
Using our propensity model we identified patient characteristics that were associated with IR referral. Patients with a liver transplant were more likely to be cared for in IR. This may be due to a belief that postoperative procedures are anatomically more complex or because surgical trainees do not commonly perform this procedure. The current study confirms findings from earlier work that obese and female patients are more likely to be referred to IR.[16] IR referral of obese patients is likely to occur because paracentesis procedures are technically more difficult. We have no explanation why female patients were more likely to be referred to IR, because most decisions appear to be discretionary. Prospective studies are needed to determine evidence‐based recommendations regarding paracentesis procedure location. Patients with more comorbidities (eg, ICU stay, awaiting liver transplant, coagulation disorders) were more likely to undergo bedside procedures. The complexity of patients undergoing bedside paracentesis procedures reinforces the need for rigorous skill assessment for clinicians who perform them because complications such as intraperitoneal bleeding can be fatal.
Finally, we showed that LOS was similar but hospital direct costs were $800 to $1300 lower for patients whose paracentesis procedure was performed by medicine or gastroenterology/hepatology compared to IR. Medical subspecialties and surgery procedures were more expensive than IR, consistent with the higher LOS seen in these groups. IR procedures add costs due to facility charges for space, personnel, and equipment.[33] At our institution, the hospital cost of an IR paracentesis in 2012 was $361. If we use this figure, and assume costs are similar across university hospitals, the resultant cost savings would be $10,257,454 (for the procedure alone) if all procedures referred to IR in this 2‐year study were instead performed at the bedside. This estimate is approximate because it does not consider factors such as cost of clinician staffing models, which may differ across UHC hospitals. As hospitals look to reduce costs, potential savings due to appropriate use of bedside and IR procedures should be considered. This is especially important because there is no evidence that the extra expense of IR procedures is justified due to improved patient outcomes.
This study has several limitations. First, this was an observational study. Although the database was large, we were limited by coding accuracy and could not control for all potential confounding factors such as Model for End‐Stage Liver Disease score,[34, 35] other specific laboratory values, amount of ascites fluid removed, or bedside procedure failures later referred to IR. However, we do know that only a small number of second, third, or fourth procedures were subsequently referred to IR after earlier ones were performed at the bedside. Additionally the UHC database does not include patient‐specific data, and therefore we could not adjust for multiple visits or procedures by the same patient. Second, we were unable to determine the level of teaching involvement at each UHC affiliated hospital. Community hospitals where attendings managed most of the patients without trainees could not be differentiated from university hospitals where trainees were involved in most patients' care. Third, we did not have specialty information for 9434 (9.7%) procedures and had to exclude these cases. We also excluded a large number of paracentesis procedures in our final outcomes analysis. However, this was necessary because we needed to perform a patient‐level analysis to ensure the propensity and outcomes models were accurate. Finally, we did not evaluate inpatient mortality or 30‐day hospital readmission rates. Mortality and readmission from complications of a paracentesis procedure are rare events.[3, 4, 36] However, mortality and hospital readmission among patients with liver disease are relatively common.[37, 38] It was impossible to link these outcomes to a paracentesis procedure without the ability to perform medical records review.
In conclusion, paracentesis procedures are performed frequently by internal medicine‐ and family medicine‐trained clinicians in university hospitals. Because of these findings regarding current practice patterns, we believe the ACGME, ABIM, and ABFM should clarify their policies to require that residents are competent to perform paracentesis procedures before performing them on patients. This may improve supervision and training for paracentesis procedures that are already occurring and possibly encourage performance of additional, less costly bedside procedures.
Acknowledgements
The authors acknowledge Drs. Douglas Vaughan and Mark Williams for their support and encouragement of this work.
Disclosure: Nothing to report.
- . A primer on detecting cirrhosis and caring for these patients without causing harm. Int J Hepatol. 2011:801983.
- , , . Diagnosis and epidemiology of cirrhosis. Med Clin North Am. 2009;93(4):787–799.
- ; AASLD Practice Guidelines Committee. Management of adult patients with ascites due to cirrhosis: an update. Hepatology. 2009;49(6):2087–2107.
- ; AASLD Practice Guidelines Committee. Management of adult patients with ascites due to cirrhosis: update 2012. Hepatology. 2009;49:2087–2107. Available at: http://www.aasld.org/practiceguidelines/Documents/ascitesupdate2013.pdf. Accessed October 21, 2013.
- , , , , . Procedures performed by hospitalist and non‐hospitalist general internists. J Gen Intern Med. 2010;25(5):448–452.
- , . The declining number and variety of procedures done by general internists: a resurvey of members of the American College of Physicians. Ann Intern Med. 2007;146(5):355–360.
- , , . National fluid shifts: fifteen‐year trends in paracentesis and thoracentesis procedures. J Am Coll Radiol. 2010;7(11):859–864.
- , . What procedures should internists do? Ann Intern Med. 2007;146(5):392–393.
- , , , , , . Beyond the comfort zone: residents assess their comfort performing inpatient medicine procedures. Am J Med. 2006;119(1)71.e17–e24.
- , , . Perception of competency to perform procedures and future practice intent: a national survey of family practice residents. Acad Med. 2003;78(9):926–932.
- , , , . Utilization of and adherence to the gastroenterology core curriculum on hepatology training during a gastrointestinal fellowship. Clin Gastroenterol Hepatol. 2008;6(6):682–688.
- American Board of Internal Medicine. Internal medicine policies. Available at: http://www.abim.org/certification/policies/imss/im.aspx. Accessed December 21, 2013.
- A CGME program requirements for graduate medical education in internal medicine. Available at: http://acgme.org/acgmeweb/portals/0/PFassets/2013‐PR‐FAQ‐PIF/140_internal_medicine_07012013.pdf. Accessed December 17, 2013.
- American Board of Family Medicine residency requirements. Available at: https://www.theabfm.org/cert/guidelines.aspx. Accessed December 17, 2013.
- ACGME program requirements for graduate medical education in family medicine. Available at: http://www.acgme.org/acgmeweb/Portals/0/PFAssets/ProgramRequirements/120pr07012007.pdf. Accessed December 17, 2013.
- , , , , . Clinical outcomes after bedside and interventional radiology paracentesis procedures. Am J Med. 2013;126(4):349–356.
- , , , et al. Performance standards for therapeutic abdominal paracentesis. Hepatology. 2004;40(2):484–488.
- , , . Adapting a clinical comorbidity index for use with ICD‐9‐CM administrative databases. J Clin Epidemiol. 1992;45(6):613–619.
- , , . Adapting a clinical comorbidity index for use with ICD‐9‐CM administrative data: differing perspectives. J Clin Epidemiol. 1993;46(10):1075–1079; discussion 1081–1090.
- . The role of known effects in observational studies. Biometrics. 1998;45(2):557–569.
- , , , et al. A systematic review: the effect of clinical supervision on patient and residency education outcomes. Acad Med. 2012;87(4):428–442.
- , , , et al. Impact of a bedside procedure service on general medicine inpatients: a firm‐based trial. J Hosp Med. 2007;2(3):143–149.
- , , , , , . Effects of increased overnight supervision on resident education, decision‐making, and autonomy. J Hosp Med. 2012;7(8):606–610.
- , . Performance of procedures by nephrologists and nephrology fellows at U.S. nephrology training programs. Clin J Am Soc Nephrol. 2008;3(4):941–947.
- , , , , . Mastery learning of thoracentesis skills by internal medicine residents using simulation technology and deliberate practice. J Hosp Med. 2008;3:49–54.
- , , , , . Mastery learning of temporary dialysis catheter insertion skills by nephrology fellows using simulation technology and deliberate practice. Am J Kidney Dis. 2009;54:70–76.
- , , , , , . Simulation‐based education with mastery learning improves residents' lumbar puncture skills. Neurology. 2012;79:132–137.
- , , , , , . Simulation‐based education with mastery learning improves paracentesis skills. J Grad Med Educ. 2012;4(1):23–27.
- , , , , . Medical education featuring mastery learning with deliberate practice can lead to better health for individuals and populations. Acad Med. 2011; 86(11):e8–e9.
- , , , , . Simulation‐based mastery learning reduces complications during central venous catheter insertion in a medical intensive care unit. Crit Care Med. 2009;37(10):2697–2701.
- , , , , . Use of simulation‐based education to reduce catheter‐related bloodstream infections. Arch Intern Med. 2009;169(15):1420–1423.
- , , , et al. Progress toward improving the quality of cardiac arrest medical team responses at an academic teaching hospital. J Grad Med Educ. 2011;3(2):211–216.
- , , , et al. Technical cost of radiologic examinations: analysis across imaging modalities. Radiology. 2000;216(1):269–272.
- , , , et al. A model to predict survival in patients with end‐stage liver disease. Hepatology. 2001;33(2):464–470.
- , , , et al. Model for end‐stage liver disease (MELD) and allocation of donor livers. Gastroenterology. 2003;124(1):91–96.
- , , , . Videos in clinical medicine. Paracentesis. N Engl J Med. 2006;355(19):e21.
- Center for Disease Control and Prevention. Chronic liver disease or cirrhosis. National Hospital Discharge Survey: 2010 detailed diagnosis and procedure tables, number of first‐listed diagnoses (see ICD9‐CM code 571). Available at: http://www.cdc.gov/nchs/fastats/liverdis.htm. Accessed October 19, 2013.
- , , , et al. Incidence and predictors of 30‐day readmission among patients hospitalized for advanced liver disease. Clin Gastroenterol Hepatol. 2011;9(3):254–259.
© 2014 Society of Hospital Medicine
