User login
Automating Measurement of Trainee Work Hours
Across the country, residents are bound to a set of rules from the Accreditation Council for Graduate Medical Education (ACGME) designed to mini mize fatigue, maintain quality of life, and reduce fatigue-related patient safety events. Adherence to work hours regulations is required to maintain accreditation. Among other guidelines, residents are required to work fewer than 80 hours per week on average over 4 consecutive weeks.1 When work hour violations occur, programs risk citation, penalties, and harm to the program’s reputation.
Residents self-report their adherence to program regulations in an annual survey conducted by the ACGME.2 To collect more frequent data, most training programs monitor resident work hours through self-report on an electronic tracking platform.3 These data generally are used internally to identify problems and opportunities for improvement. However, self-report approaches are subject to imperfect recall and incomplete reporting, and require time and effort to complete.4
The widespread adoption of electronic health records (EHRs) brings new opportunity to measure and promote adherence to work hours. EHR log data capture when users log in and out of the system, along with their location and specific actions. These data offer a compelling alternative to self-report because they are already being collected and can be analyzed almost immediately. Recent studies using EHR log data to approximate resident work hours in a pediatric hospital successfully approximated scheduled hours, but the approach was customized to their hospital’s workflows and might not generalize to other settings.5 Furthermore, earlier studies have not captured evening out-of-hospital work, which contributes to total work hours and is associated with physician burnout.6
We developed a computational method that sought to accurately capture work hours, including out-of-hospital work, which could be used as a screening tool to identify at-risk residents and rotations in near real-time. We estimated work hours, including EHR and non-EHR work, from these EHR data and compared these daily estimations to self-report. We then used a heuristic to estimate the frequency of exceeding the 80-hour workweek in a large internal medicine residency program.
METHODS
The population included 82 internal medicine interns (PGY-1) and 121 residents (PGY-2 = 60, PGY-3 = 61) who rotated through University of California, San Francisco Medical Center (UCSFMC) between July 1, 2018, and June 30, 2019, on inpatient rotations. In the UCSF internal medicine residency program, interns spend an average of 5 months per year and residents spend an average of 2 months per year on inpatient rotations at UCSFMC. Scheduled inpatient rotations generally are in 1-month blocks and include general medical wards, cardiology, liver transplant, night-float, and a procedures and jeopardy rotation where interns perform procedures at UCSFMC and serve as backup for their colleagues across sites. Although expected shift duration differs by rotation, types of shifts include regular length days, call days that are not overnight (but expected duration of work is into the late evening), 28-hour overnight call (PGY-2 and PGY-3), and night-float.
Data Source
This computational method was developed at UCSFMC. This study was approved by the University of California, San Francisco institutional review board. Using the UCSF Epic Clarity database, EHR access log data were obtained, including all Epic logins/logoffs, times, and access devices. Access devices identified included medical center computers, personal computers, and mobile devices.
Trainees self-report their work hours in MedHub, a widely used electronic tracking platform for self-report of resident work hours.7 Data were extracted from this database for interns and residents who matched the criteria above. The self-report data were considered the gold standard for comparison, because it is the best available despite its known limitations.
We used data collected from UCSF’s physician scheduling platform, AMiON, to identify interns and residents assigned to rotations at UCSF hospitals.8 AMiON also was used to capture half-days of off-site scheduled clinics and teaching, which count toward the workday but would not be associated with on-campus logins.
Developing a Computational Method to Measure Work Hours
We developed a heuristic to accomplish two goals: (1) infer the duration of continuous in-hospital work hours while providing clinical care and (2) measure “out-of-hospital” work. Logins from medical center computers were considered to be “on-campus” work. Logins from personal computers were considered to be “out-of-hospital.” “Out-of-hospital” login sessions were further subdivided into “out-of-hospital work” and “out-of-hospital study” based on activity during the session; if any work activities listed in Appendix Table 1 were performed, the session was attributed to work. If only chart review was performed, the session was attributed to study and did not count towards total hours worked. Logins from mobile devices also did not count towards total hours worked.
We inferred continuous in-hospital work by linking on-campus EHR sessions from the first on-campus login until the last on-campus logoff (Figure 1). 
If there was overlapping time measurement between on-campus work and personal computer logins (for example, a resident was inferred to be doing on-campus work based on frequent medical center computer logins but there were also logins from personal computers), we inferred this to indicate that a personal device had been brought on-campus and the time was only attributed to on-campus work and was not double counted as out-of-hospital work. Out-of-hospital work that did not overlap with inferred on-campus work time contributed to the total hours worked in a week, consistent with ACGME guidelines.
Our internal medicine residents work at three hospitals: UCSFMC and two affiliated teaching hospitals. Although this study measured work hours while the residents were on an inpatient rotation at UCSFMC, trainees also might have occasional half-day clinics or teaching activities at other sites not captured by these EHR log data. The allocated time for that scheduled activity (extracted from AMiON) was counted as work hours. If the trainee was assigned to a morning half-day of off-site work (eg, didactics), this was counted the same as an 8
Comparison of EHR-Derived Work Hours Heuristic to Self-Report
Because resident adherence with daily self-report is imperfect, we compared EHR-derived work to self-report on days when both were available. We generated scatter plots of EHR-derived work hours compared with self-report and calculated the mean absolute error of estimation. We fit a linear mixed-effect model for each PGY, modeling self-reported hours as a linear function of estimated hours (fixed effect) with a random intercept (random effect) for each trainee to account for variations among individuals. StatsModels, version 0.11.1, was used for statistical analyses.9
We reviewed detailed data from outlier clusters to understand situations where the heuristic might not perform optimally. To assess whether EHR-derived work hours reasonably overlapped with expected shifts, 20 8-day blocks from separate interns and residents were randomly selected for qualitative detail review in comparison with AMiON schedule data.
Estimating Hours Worked and Work Hours Violations
After validating against self-report on a daily basis, we used our heuristic to infer the average rate at which the 80-hour workweek was exceeded across all inpatient rotations at UCSFMC. This was determined both including “out-of-hospital” work as derived from logins on personal computers and excluding it. Using the estimated daily hours worked, we built a near real-time dashboard to assist program leadership with identifying at-risk trainees and trends across the program.
RESULTS
Data from 82 interns (PGY-1) and 121 internal medicine residents (PGY-2 and PGY-3) who rotated at UCSFMC between July 1, 2018, and June 30, 2019, were included in the study. Table 1 shows the number of days and rotations worked at UCSFMC as well as the frequency of self-report of work hours according to program year. 

Qualitative review of EHR-derived data compared with schedule data showed that, although residents often reported homogenous daily work hours, EHR-derived work hours often varied as expected on a day-to-day basis according to the schedule (Appendix Table 2).
Because out-of-hospital EHR use does not count as work if done for educational purposes, we evaluated the proportion of out-of-hospital EHR use that is considered work and found that 67% of PGY-1, 50% of PGY-2, and 53% of PGY-3 out-of-hospital sessions included at least one work activity, as denoted in Appendix Table 1. Out-of-hospital work therefore represented 85% of PGY-1, 66% of PGY-2, and 73% of PGY-3 time spent in the EHR out-of-hospital. These sessions were counted towards work hours in accordance with ACGME rules and included 29% of PGY-1 workdays and 21% of PGY-2 and PGY-3 workdays. This amounted to a median of 1.0 hours per day (95% CI, 0.1-4.6 hours) of out-of-hospital work for PGY-1, 0.9 hours per day (95% CI, 0.1-4.1 hours) for PGY-2, and 0.8 hours per day (95% CI, 0.1-4.7 hours) for PGY-3 residents. Out-of-hospital logins that did not include work activities, as denoted in Appendix Table 1, were labeled out-of-hospital study and did not count towards work hours; this amounted to a median of 0.3 hours per day (95% CI, 0.02-1.6 hours) for PGY-1, 0.5 hours per day (95% CI, 0.04-0.25 hours) for PGY-2, and 0.3 hours per day (95% CI, 0.03-1.7 hours) for PGY-3. Mobile device logins also were not counted towards total work hours, with a median of 3 minutes per day for PGY-1, 6 minutes per day for PGY-2, and 5 minutes per day for PGY-3.
The percentage of rotation months where average hours worked exceeded 80 hours weekly is shown in Table 2. Inclusion of out-of-hospital work hours substantially increased the frequency at which the 80-hour workweek was exceeded. The frequency of individual residents working more than 80 hours weekly on average is shown in Appendix Figure 3. A narrow majority of PGY-1 and PGY-2 trainees and a larger majority of PGY-3 trainees never worked in excess of 80 hours per week when averaged over the course of a rotation, but several trainees did on several occasions.

Estimations from the computational method were built into a dashboard for use as screening tool by residency program directors (Appendix Figure 4).
DISCUSSION
EHR log data can be used to automate measurement of trainee work hours, providing timely data to program directors for identifying residents at risk of exceeding work hours limits. We demonstrated this by developing a data-driven approach to link on-campus logins that can be replicated in other training programs. We further demonstrated that out-of-hospital work substantially contributed to resident work hours and the frequency with which they exceed the 80-hour workweek, making it a critical component of any work hour estimation approach. Inclusive of out-of-hospital work, our computational method found that residents exceeded the 80-hour workweek 10% to 21% of the time, depending on their year in residency, with a small majority of residents never exceeding the 80-hour workweek.
Historically, most ACGME residency programs have relied on resident self-report to determine work hours.3 The validity of this method has been extensively studied and results remain mixed; in some surveys, residents admit to underreporting their hours while other validation studies, including the use of clock-in and clock-out or time-stamped parking data, align with self-report relatively well.10-12 Regardless of the reliability of self-report, it is a cumbersome task that residents have difficulty adhering to, as shown in our study, where only slightly more than one-half of the days worked had associated self-report. By relying on resident self-report, we are adding to the burden of clerical work, which is associated with physician burnout.13 Furthermore, because self-report typically does not happen in real-time, it limits a program’s ability to intervene on recent or impending work-hour violations. Our computational method enabled us to build a dashboard that is updated daily and provides critical insight into resident work hours at any time, without waiting for retrospective self-report.
Our study builds on previous work by Dziorny et al using EHR log data to algorithmically measure in-hospital work.5 In their study, the authors isolated shifts with a login gap of 4 hours and then combined shifts according to a set of heuristics. However, their logic integrated an extensive workflow analysis of trainee shifts, which might limit generalizability.5 Our approach computationally derives the temporal threshold for linking EHR sessions, which in our data was 5 hours but might differ at other sites. Automated derivation of this threshold will support generalizability to other programs and sites, although programs will still need to manually account for off-site work such as didactics. In a subsequent study evaluating the 80-hour workweek, Dziorny et al evaluated shift duration and appropriate time-off between shifts and found systematic underreporting of work.14 In our study, we prioritized evaluation of the 80-hour workweek and found general alignment between self-report and EHR-derived work-hour estimates, with a tendency to underestimate at lower reported work hours and overestimate at higher reported work hours (potentially because of underreporting as illustrated by Dziorny et al). We included the important out-of-hospital logins as discrete work events because out-of-hospital work contributes to the total hours worked and to the number of workweeks that exceed the 80-hour workweek, and might contribute to burnout.15 The incidence of exceeding the 80-hour workweek increased by 7% to 8% across all residents when out-of-hospital work was included, demonstrating that tools such as ResQ (ResQ Medical) that rely primarily on geolocation data might not sufficiently capture the ways in which residents spend their time working.16
Our approach has limitations. We determined on-campus vs out-of-hospital locations based on whether the login device belonged to the medical center or was a personal computer. Consequently, if trainees exclusively used a personal computer while on-campus and never used a medical center computer, we would have captured this work done while logged into the EHR but would not have inferred on-campus work. Although nearly all trainees in our organization use medical center computers throughout the day, this might impact generalizability for programs where trainees use personal computers exclusively in the hospital. Our approach also assumes trainees will use the EHR at the beginning and end of their workdays, which could lead to underestimation of work hours in trainees who do not employ this practice. With regards to work done on personal computers, our heuristic required that at least one work activity (as denoted in Appendix Table 1) be included in the session in order for it to count as work. Although this approach allows us to exclude sessions where trainees might be reviewing charts exclusively for educational purposes, it is difficult to infer the true intent of chart review.
There might be periods of time where residents are doing in-hospital work but more than 5 hours elapsed between EHR user sessions. As we have started adapting this computational method for other residency programs, we have added logic that allows for long periods of time in the operating room to be considered part of a continuous workday. There also are limitations to assigning blocks of time to off-site clinics; clinics that are associated with after-hours work but use a different EHR would not be captured in total out-of-hospital work.
Although correlation with self-report was good, we identified clusters of inaccuracy. This likely resulted from our residency program covering three medical centers, two of which were not included in the data set. For example, if a resident had an off-site clinic that was not accounted for in AMiON, EHR-derived work hours might have been underestimated relative to self-report. Operationally leveraging an automated system for measuring work hours in the form of dashboards and other tools could provide the impetus to ensure accurate documentation of schedule anomalies.
CONCLUSION
Implementation of our EHR-derived work-hour model will allow ACGME residency programs to understand and act upon trainee work-hour violations closer to real time, as the data extraction is daily and automated. Automation will save busy residents a cumbersome task, provide more complete data than self-report, and empower residency programs to intervene quickly to support overworked trainees.
Acknowledgments
The authors thank Drs Bradley Monash, Larissa Thomas, and Rebecca Berman for providing residency program input.
1. Accreditation Council for Graduate Medical Education. Common program requirements. Accessed August 12, 2020. https://www.acgme.org/What-We-Do/Accreditation/Common-Program-Requirements
2. Accreditation Council for Graduate Medical Education. Resident/fellow and faculty surveys. Accessed August 12, 2020. https://www.acgme.org/Data-Collection-Systems/Resident-Fellow-and-Faculty-Surveys
3. Petre M, Geana R, Cipparrone N, et al. Comparing electronic and manual tracking systems for monitoring resident duty hours. Ochsner J. 2016;16(1):16-21.
4. Gonzalo JD, Yang JJ, Ngo L, Clark A, Reynolds EE, Herzig SJ. Accuracy of residents’ retrospective perceptions of 16-hour call admitting shift compliance and characteristics. Grad Med Educ. 2013;5(4):630-633. https://doi.org/10.4300/jgme-d-12-00311.1
5. Dziorny AC, Orenstein EW, Lindell RB, Hames NA, Washington N, Desai B. Automatic detection of front-line clinician hospital shifts: a novel use of electronic health record timestamp data. Appl Clin Inform. 2019;10(1):28-37. https://doi.org/10.1055/s-0038-1676819
6. Gardner RL, Cooper E, Haskell J, et al. Physician stress and burnout: the impact of health information technology. J Am Med Inform Assoc. 2019;26(2):106-114. https://doi.org/10.1093/jamia/ocy145
7. MedHub. Accessed April 7, 2021. https://www.medhub.com
8. AMiON. Accessed April 7, 2021. https://www.amion.com
9. Seabold S, Perktold J. Statsmodels: econometric and statistical modeling with python. Proceedings of the 9th Python in Science Conference. https://conference.scipy.org/proceedings/scipy2010/pdfs/seabold.pdf
10. Todd SR, Fahy BN, Paukert JL, Mersinger D, Johnson ML, Bass BL. How accurate are self-reported resident duty hours? J Surg Educ. 2010;67(2):103-107. https://doi.org/10.1016/j.jsurg.2009.08.004
11. Chadaga SR, Keniston A, Casey D, Albert RK. Correlation between self-reported resident duty hours and time-stamped parking data. J Grad Med Educ. 2012;4(2):254-256. https://doi.org/10.4300/JGME-D-11-00142.1
12. Drolet BC, Schwede M, Bishop KD, Fischer SA. Compliance and falsification of duty hours: reports from residents and program directors. J Grad Med Educ. 2013;5(3):368-373. https://doi.org/10.4300/JGME-D-12-00375.1
13. Shanafelt TD, Dyrbye LN, West CP. Addressing physician burnout: the way forward. JAMA. 2017;317(9):901. https://doi.org/10.1001/jama.2017.0076
14. Dziorny AC, Orenstein EW, Lindell RB, Hames NA, Washington N, Desai B. Pediatric trainees systematically under-report duty hour violations compared to electronic health record defined shifts. PLOS ONE. 2019;14(12):e0226493. https://doi.org/10.1371/journal.pone.0226493
15. Saag HS, Shah K, Jones SA, Testa PA, Horwitz LI. Pajama time: working after work in the electronic health record. J Gen Intern Med. 2019;34(9):1695-1696. https://doi.org/10.1007/s11606-019-05055-x
16. ResQ Medical. Accessed April 7, 2021. https://resqmedical.com
Across the country, residents are bound to a set of rules from the Accreditation Council for Graduate Medical Education (ACGME) designed to mini mize fatigue, maintain quality of life, and reduce fatigue-related patient safety events. Adherence to work hours regulations is required to maintain accreditation. Among other guidelines, residents are required to work fewer than 80 hours per week on average over 4 consecutive weeks.1 When work hour violations occur, programs risk citation, penalties, and harm to the program’s reputation.
Residents self-report their adherence to program regulations in an annual survey conducted by the ACGME.2 To collect more frequent data, most training programs monitor resident work hours through self-report on an electronic tracking platform.3 These data generally are used internally to identify problems and opportunities for improvement. However, self-report approaches are subject to imperfect recall and incomplete reporting, and require time and effort to complete.4
The widespread adoption of electronic health records (EHRs) brings new opportunity to measure and promote adherence to work hours. EHR log data capture when users log in and out of the system, along with their location and specific actions. These data offer a compelling alternative to self-report because they are already being collected and can be analyzed almost immediately. Recent studies using EHR log data to approximate resident work hours in a pediatric hospital successfully approximated scheduled hours, but the approach was customized to their hospital’s workflows and might not generalize to other settings.5 Furthermore, earlier studies have not captured evening out-of-hospital work, which contributes to total work hours and is associated with physician burnout.6
We developed a computational method that sought to accurately capture work hours, including out-of-hospital work, which could be used as a screening tool to identify at-risk residents and rotations in near real-time. We estimated work hours, including EHR and non-EHR work, from these EHR data and compared these daily estimations to self-report. We then used a heuristic to estimate the frequency of exceeding the 80-hour workweek in a large internal medicine residency program.
METHODS
The population included 82 internal medicine interns (PGY-1) and 121 residents (PGY-2 = 60, PGY-3 = 61) who rotated through University of California, San Francisco Medical Center (UCSFMC) between July 1, 2018, and June 30, 2019, on inpatient rotations. In the UCSF internal medicine residency program, interns spend an average of 5 months per year and residents spend an average of 2 months per year on inpatient rotations at UCSFMC. Scheduled inpatient rotations generally are in 1-month blocks and include general medical wards, cardiology, liver transplant, night-float, and a procedures and jeopardy rotation where interns perform procedures at UCSFMC and serve as backup for their colleagues across sites. Although expected shift duration differs by rotation, types of shifts include regular length days, call days that are not overnight (but expected duration of work is into the late evening), 28-hour overnight call (PGY-2 and PGY-3), and night-float.
Data Source
This computational method was developed at UCSFMC. This study was approved by the University of California, San Francisco institutional review board. Using the UCSF Epic Clarity database, EHR access log data were obtained, including all Epic logins/logoffs, times, and access devices. Access devices identified included medical center computers, personal computers, and mobile devices.
Trainees self-report their work hours in MedHub, a widely used electronic tracking platform for self-report of resident work hours.7 Data were extracted from this database for interns and residents who matched the criteria above. The self-report data were considered the gold standard for comparison, because it is the best available despite its known limitations.
We used data collected from UCSF’s physician scheduling platform, AMiON, to identify interns and residents assigned to rotations at UCSF hospitals.8 AMiON also was used to capture half-days of off-site scheduled clinics and teaching, which count toward the workday but would not be associated with on-campus logins.
Developing a Computational Method to Measure Work Hours
We developed a heuristic to accomplish two goals: (1) infer the duration of continuous in-hospital work hours while providing clinical care and (2) measure “out-of-hospital” work. Logins from medical center computers were considered to be “on-campus” work. Logins from personal computers were considered to be “out-of-hospital.” “Out-of-hospital” login sessions were further subdivided into “out-of-hospital work” and “out-of-hospital study” based on activity during the session; if any work activities listed in Appendix Table 1 were performed, the session was attributed to work. If only chart review was performed, the session was attributed to study and did not count towards total hours worked. Logins from mobile devices also did not count towards total hours worked.
We inferred continuous in-hospital work by linking on-campus EHR sessions from the first on-campus login until the last on-campus logoff (Figure 1).
If there was overlapping time measurement between on-campus work and personal computer logins (for example, a resident was inferred to be doing on-campus work based on frequent medical center computer logins but there were also logins from personal computers), we inferred this to indicate that a personal device had been brought on-campus and the time was only attributed to on-campus work and was not double counted as out-of-hospital work. Out-of-hospital work that did not overlap with inferred on-campus work time contributed to the total hours worked in a week, consistent with ACGME guidelines.
Our internal medicine residents work at three hospitals: UCSFMC and two affiliated teaching hospitals. Although this study measured work hours while the residents were on an inpatient rotation at UCSFMC, trainees also might have occasional half-day clinics or teaching activities at other sites not captured by these EHR log data. The allocated time for that scheduled activity (extracted from AMiON) was counted as work hours. If the trainee was assigned to a morning half-day of off-site work (eg, didactics), this was counted the same as an 8
Comparison of EHR-Derived Work Hours Heuristic to Self-Report
Because resident adherence with daily self-report is imperfect, we compared EHR-derived work to self-report on days when both were available. We generated scatter plots of EHR-derived work hours compared with self-report and calculated the mean absolute error of estimation. We fit a linear mixed-effect model for each PGY, modeling self-reported hours as a linear function of estimated hours (fixed effect) with a random intercept (random effect) for each trainee to account for variations among individuals. StatsModels, version 0.11.1, was used for statistical analyses.9
We reviewed detailed data from outlier clusters to understand situations where the heuristic might not perform optimally. To assess whether EHR-derived work hours reasonably overlapped with expected shifts, 20 8-day blocks from separate interns and residents were randomly selected for qualitative detail review in comparison with AMiON schedule data.
Estimating Hours Worked and Work Hours Violations
After validating against self-report on a daily basis, we used our heuristic to infer the average rate at which the 80-hour workweek was exceeded across all inpatient rotations at UCSFMC. This was determined both including “out-of-hospital” work as derived from logins on personal computers and excluding it. Using the estimated daily hours worked, we built a near real-time dashboard to assist program leadership with identifying at-risk trainees and trends across the program.
RESULTS
Data from 82 interns (PGY-1) and 121 internal medicine residents (PGY-2 and PGY-3) who rotated at UCSFMC between July 1, 2018, and June 30, 2019, were included in the study. Table 1 shows the number of days and rotations worked at UCSFMC as well as the frequency of self-report of work hours according to program year.
Qualitative review of EHR-derived data compared with schedule data showed that, although residents often reported homogenous daily work hours, EHR-derived work hours often varied as expected on a day-to-day basis according to the schedule (Appendix Table 2).
Because out-of-hospital EHR use does not count as work if done for educational purposes, we evaluated the proportion of out-of-hospital EHR use that is considered work and found that 67% of PGY-1, 50% of PGY-2, and 53% of PGY-3 out-of-hospital sessions included at least one work activity, as denoted in Appendix Table 1. Out-of-hospital work therefore represented 85% of PGY-1, 66% of PGY-2, and 73% of PGY-3 time spent in the EHR out-of-hospital. These sessions were counted towards work hours in accordance with ACGME rules and included 29% of PGY-1 workdays and 21% of PGY-2 and PGY-3 workdays. This amounted to a median of 1.0 hours per day (95% CI, 0.1-4.6 hours) of out-of-hospital work for PGY-1, 0.9 hours per day (95% CI, 0.1-4.1 hours) for PGY-2, and 0.8 hours per day (95% CI, 0.1-4.7 hours) for PGY-3 residents. Out-of-hospital logins that did not include work activities, as denoted in Appendix Table 1, were labeled out-of-hospital study and did not count towards work hours; this amounted to a median of 0.3 hours per day (95% CI, 0.02-1.6 hours) for PGY-1, 0.5 hours per day (95% CI, 0.04-0.25 hours) for PGY-2, and 0.3 hours per day (95% CI, 0.03-1.7 hours) for PGY-3. Mobile device logins also were not counted towards total work hours, with a median of 3 minutes per day for PGY-1, 6 minutes per day for PGY-2, and 5 minutes per day for PGY-3.
The percentage of rotation months where average hours worked exceeded 80 hours weekly is shown in Table 2. Inclusion of out-of-hospital work hours substantially increased the frequency at which the 80-hour workweek was exceeded. The frequency of individual residents working more than 80 hours weekly on average is shown in Appendix Figure 3. A narrow majority of PGY-1 and PGY-2 trainees and a larger majority of PGY-3 trainees never worked in excess of 80 hours per week when averaged over the course of a rotation, but several trainees did on several occasions.
Estimations from the computational method were built into a dashboard for use as screening tool by residency program directors (Appendix Figure 4).
DISCUSSION
EHR log data can be used to automate measurement of trainee work hours, providing timely data to program directors for identifying residents at risk of exceeding work hours limits. We demonstrated this by developing a data-driven approach to link on-campus logins that can be replicated in other training programs. We further demonstrated that out-of-hospital work substantially contributed to resident work hours and the frequency with which they exceed the 80-hour workweek, making it a critical component of any work hour estimation approach. Inclusive of out-of-hospital work, our computational method found that residents exceeded the 80-hour workweek 10% to 21% of the time, depending on their year in residency, with a small majority of residents never exceeding the 80-hour workweek.
Historically, most ACGME residency programs have relied on resident self-report to determine work hours.3 The validity of this method has been extensively studied and results remain mixed; in some surveys, residents admit to underreporting their hours while other validation studies, including the use of clock-in and clock-out or time-stamped parking data, align with self-report relatively well.10-12 Regardless of the reliability of self-report, it is a cumbersome task that residents have difficulty adhering to, as shown in our study, where only slightly more than one-half of the days worked had associated self-report. By relying on resident self-report, we are adding to the burden of clerical work, which is associated with physician burnout.13 Furthermore, because self-report typically does not happen in real-time, it limits a program’s ability to intervene on recent or impending work-hour violations. Our computational method enabled us to build a dashboard that is updated daily and provides critical insight into resident work hours at any time, without waiting for retrospective self-report.
Our study builds on previous work by Dziorny et al using EHR log data to algorithmically measure in-hospital work.5 In their study, the authors isolated shifts with a login gap of 4 hours and then combined shifts according to a set of heuristics. However, their logic integrated an extensive workflow analysis of trainee shifts, which might limit generalizability.5 Our approach computationally derives the temporal threshold for linking EHR sessions, which in our data was 5 hours but might differ at other sites. Automated derivation of this threshold will support generalizability to other programs and sites, although programs will still need to manually account for off-site work such as didactics. In a subsequent study evaluating the 80-hour workweek, Dziorny et al evaluated shift duration and appropriate time-off between shifts and found systematic underreporting of work.14 In our study, we prioritized evaluation of the 80-hour workweek and found general alignment between self-report and EHR-derived work-hour estimates, with a tendency to underestimate at lower reported work hours and overestimate at higher reported work hours (potentially because of underreporting as illustrated by Dziorny et al). We included the important out-of-hospital logins as discrete work events because out-of-hospital work contributes to the total hours worked and to the number of workweeks that exceed the 80-hour workweek, and might contribute to burnout.15 The incidence of exceeding the 80-hour workweek increased by 7% to 8% across all residents when out-of-hospital work was included, demonstrating that tools such as ResQ (ResQ Medical) that rely primarily on geolocation data might not sufficiently capture the ways in which residents spend their time working.16
Our approach has limitations. We determined on-campus vs out-of-hospital locations based on whether the login device belonged to the medical center or was a personal computer. Consequently, if trainees exclusively used a personal computer while on-campus and never used a medical center computer, we would have captured this work done while logged into the EHR but would not have inferred on-campus work. Although nearly all trainees in our organization use medical center computers throughout the day, this might impact generalizability for programs where trainees use personal computers exclusively in the hospital. Our approach also assumes trainees will use the EHR at the beginning and end of their workdays, which could lead to underestimation of work hours in trainees who do not employ this practice. With regards to work done on personal computers, our heuristic required that at least one work activity (as denoted in Appendix Table 1) be included in the session in order for it to count as work. Although this approach allows us to exclude sessions where trainees might be reviewing charts exclusively for educational purposes, it is difficult to infer the true intent of chart review.
There might be periods of time where residents are doing in-hospital work but more than 5 hours elapsed between EHR user sessions. As we have started adapting this computational method for other residency programs, we have added logic that allows for long periods of time in the operating room to be considered part of a continuous workday. There also are limitations to assigning blocks of time to off-site clinics; clinics that are associated with after-hours work but use a different EHR would not be captured in total out-of-hospital work.
Although correlation with self-report was good, we identified clusters of inaccuracy. This likely resulted from our residency program covering three medical centers, two of which were not included in the data set. For example, if a resident had an off-site clinic that was not accounted for in AMiON, EHR-derived work hours might have been underestimated relative to self-report. Operationally leveraging an automated system for measuring work hours in the form of dashboards and other tools could provide the impetus to ensure accurate documentation of schedule anomalies.
CONCLUSION
Implementation of our EHR-derived work-hour model will allow ACGME residency programs to understand and act upon trainee work-hour violations closer to real time, as the data extraction is daily and automated. Automation will save busy residents a cumbersome task, provide more complete data than self-report, and empower residency programs to intervene quickly to support overworked trainees.
Acknowledgments
The authors thank Drs Bradley Monash, Larissa Thomas, and Rebecca Berman for providing residency program input.
1. Accreditation Council for Graduate Medical Education. Common program requirements. Accessed August 12, 2020. https://www.acgme.org/What-We-Do/Accreditation/Common-Program-Requirements
2. Accreditation Council for Graduate Medical Education. Resident/fellow and faculty surveys. Accessed August 12, 2020. https://www.acgme.org/Data-Collection-Systems/Resident-Fellow-and-Faculty-Surveys
3. Petre M, Geana R, Cipparrone N, et al. Comparing electronic and manual tracking systems for monitoring resident duty hours. Ochsner J. 2016;16(1):16-21.
4. Gonzalo JD, Yang JJ, Ngo L, Clark A, Reynolds EE, Herzig SJ. Accuracy of residents’ retrospective perceptions of 16-hour call admitting shift compliance and characteristics. Grad Med Educ. 2013;5(4):630-633. https://doi.org/10.4300/jgme-d-12-00311.1
5. Dziorny AC, Orenstein EW, Lindell RB, Hames NA, Washington N, Desai B. Automatic detection of front-line clinician hospital shifts: a novel use of electronic health record timestamp data. Appl Clin Inform. 2019;10(1):28-37. https://doi.org/10.1055/s-0038-1676819
6. Gardner RL, Cooper E, Haskell J, et al. Physician stress and burnout: the impact of health information technology. J Am Med Inform Assoc. 2019;26(2):106-114. https://doi.org/10.1093/jamia/ocy145
7. MedHub. Accessed April 7, 2021. https://www.medhub.com
8. AMiON. Accessed April 7, 2021. https://www.amion.com
9. Seabold S, Perktold J. Statsmodels: econometric and statistical modeling with python. Proceedings of the 9th Python in Science Conference. https://conference.scipy.org/proceedings/scipy2010/pdfs/seabold.pdf
10. Todd SR, Fahy BN, Paukert JL, Mersinger D, Johnson ML, Bass BL. How accurate are self-reported resident duty hours? J Surg Educ. 2010;67(2):103-107. https://doi.org/10.1016/j.jsurg.2009.08.004
11. Chadaga SR, Keniston A, Casey D, Albert RK. Correlation between self-reported resident duty hours and time-stamped parking data. J Grad Med Educ. 2012;4(2):254-256. https://doi.org/10.4300/JGME-D-11-00142.1
12. Drolet BC, Schwede M, Bishop KD, Fischer SA. Compliance and falsification of duty hours: reports from residents and program directors. J Grad Med Educ. 2013;5(3):368-373. https://doi.org/10.4300/JGME-D-12-00375.1
13. Shanafelt TD, Dyrbye LN, West CP. Addressing physician burnout: the way forward. JAMA. 2017;317(9):901. https://doi.org/10.1001/jama.2017.0076
14. Dziorny AC, Orenstein EW, Lindell RB, Hames NA, Washington N, Desai B. Pediatric trainees systematically under-report duty hour violations compared to electronic health record defined shifts. PLOS ONE. 2019;14(12):e0226493. https://doi.org/10.1371/journal.pone.0226493
15. Saag HS, Shah K, Jones SA, Testa PA, Horwitz LI. Pajama time: working after work in the electronic health record. J Gen Intern Med. 2019;34(9):1695-1696. https://doi.org/10.1007/s11606-019-05055-x
16. ResQ Medical. Accessed April 7, 2021. https://resqmedical.com
© 2021 Society of Hospital Medicine
Caring for Noncritically Ill Coronavirus Patients
The early days of the coronavirus disease 2019 (COVID-19) pandemic were fraught with uncertainty as hospitalists struggled to develop standards of care for noncritically ill patients. Although data were available from intensive care units (ICUs) in Asia and Europe, it was unclear whether these findings applied to the acute but noncritically ill patients who would ultimately make up most coronavirus admissions. Which therapeutics could benefit these patients? Who needs continuous cardiopulmonary monitoring? And perhaps most importantly, which patients are at risk for clinical deterioration?
In this issue, Nemer et al begin to answer these questions using a retrospective analysis of 350 noncritically ill COVID-19 patients admitted to non-ICU care at Cleveland Clinic hospitals in Ohio and Florida between March 13 and May 1, 2020.1 The primary outcome was a composite of three endpoints: increased respiratory support (high-flow nasal cannula, noninvasive positive pressure ventilation, or intubation), ICU transfer, or death. The primary outcome occurred in 18% of all patients and the risk was greatest among patients with high admission levels of C-reactive protein (CRP). This analysis found that while clinically significant arrhythmias occurred in 14% of patients, 90% of those were in patients with either known cardiac disease or an elevated admission troponin T level and in only one case (<1%) necessitated transition to a higher level of care. Overall mortality for COVID-19 patients initially admitted to non-ICU settings was 3%.
While several tests have been proposed as clinically relevant to coronavirus disease, those recommendations are based on studies performed on critically ill patients outside of the US and have focused on survival, not clinical deterioration.2,3 In their cohort of noncritically ill patients in the US, Nemer et al found that not only is CRP associated with clinical worsening, but that increasing levels of CRP are associated with increasing risk of deterioration. Perhaps even more interesting was the finding that no patient with a normal CRP suffered the composite outcome, including death. The authors did not report levels of other laboratory tests that have been associated with severe coronavirus disease, such as platelets, fibrin degradation products, or prolonged prothrombin time/activated partial thromboplastin time. As many clinicians will note, CRP’s lack of specificity may be its Achilles heel, potentially lowering its prognostic value. Still, given its wide availability, low cost, and rapid turnaround, CRP could serve as a screening tool to risk stratify admitted coronavirus patients, while also providing reassurance when it is normal.
The results of this study could also impact use of hospital resources. The findings regarding the low risk of arrhythmias provide support for limiting the use of continuous cardiac monitoring in noncritically ill patients without previous histories of cardiac disease or elevated admission troponin levels. Patients with normal admission CRP levels could potentially be monitored safely with intermittent pulse oximetry. Continuous pulse oximetry and cardiac monitoring are already overused in many hospitals, and in the case of coronavirus the implications are even more significant given the importance of minimizing unnecessary healthcare worker exposures.
The vast majority (79% to 90%) of patients hospitalized for coronavirus will be cared for in non–ICU settings,4,5 yet most research has thus far focused on ICU patients. Nemer et al provide much-needed information on how to care for the noncritically ill coronavirus patients whom hospitalists are most likely to treat. As a resurgence of infections is expected this winter, this work has the potential to help physicians identify not only those who have the highest probability of deteriorating, but also those who may not. In a world of limited resources, knowing which patient is unlikely to deteriorate may be just as important as recognizing which one is.
1. Nemer D, Wilner BR, Burkle A, et al. Clinical characteristics and outcomes of non-ICU hospitalization for COVID-19 in a nonepicenter, centrally monitored healthcare system. J Hosp Med. 2021;16:7-14. https://doi.org/10.12788/jhm.3510
2. Lippi G, Pleban M, Henry B. Thrombocytopenia is associated with severe coronavirus disease 2019 (COVID-19) infections: A meta-analysis. Clin Chim Acta. 2020;506:145-148. https://doi.org/10.1016/j.cca.2020.03.022
3. Klok FA, Kruip MJHA, van der Meer NJM, et al. Incidence of thrombotic complications in critically ill ICU patients with COVID-19. Thromb Res. 2020;191:145-147. https://doi.org/10.1016/j.thromres.2020.04.013
4. Giannakeas V, Bhatia D, Warkentin M, et al. Estimating the maximum capacity of COVID-19 cases manageable per day given a health care system’s constrained resources. Ann Intern Med. April 16, 2020. https://doi.org/10.7326/M20-1169
5. Tsai T, Jacobson B, Jha A. American hospital capacity and projected need for COVID-19 patient care. Health Affairs blog. March 17, 2020. Accessed October 12, 2020. https://www.healthaffairs.org/do/10.1377/hblog20200317.457910/full/
The early days of the coronavirus disease 2019 (COVID-19) pandemic were fraught with uncertainty as hospitalists struggled to develop standards of care for noncritically ill patients. Although data were available from intensive care units (ICUs) in Asia and Europe, it was unclear whether these findings applied to the acute but noncritically ill patients who would ultimately make up most coronavirus admissions. Which therapeutics could benefit these patients? Who needs continuous cardiopulmonary monitoring? And perhaps most importantly, which patients are at risk for clinical deterioration?
In this issue, Nemer et al begin to answer these questions using a retrospective analysis of 350 noncritically ill COVID-19 patients admitted to non-ICU care at Cleveland Clinic hospitals in Ohio and Florida between March 13 and May 1, 2020.1 The primary outcome was a composite of three endpoints: increased respiratory support (high-flow nasal cannula, noninvasive positive pressure ventilation, or intubation), ICU transfer, or death. The primary outcome occurred in 18% of all patients and the risk was greatest among patients with high admission levels of C-reactive protein (CRP). This analysis found that while clinically significant arrhythmias occurred in 14% of patients, 90% of those were in patients with either known cardiac disease or an elevated admission troponin T level and in only one case (<1%) necessitated transition to a higher level of care. Overall mortality for COVID-19 patients initially admitted to non-ICU settings was 3%.
While several tests have been proposed as clinically relevant to coronavirus disease, those recommendations are based on studies performed on critically ill patients outside of the US and have focused on survival, not clinical deterioration.2,3 In their cohort of noncritically ill patients in the US, Nemer et al found that not only is CRP associated with clinical worsening, but that increasing levels of CRP are associated with increasing risk of deterioration. Perhaps even more interesting was the finding that no patient with a normal CRP suffered the composite outcome, including death. The authors did not report levels of other laboratory tests that have been associated with severe coronavirus disease, such as platelets, fibrin degradation products, or prolonged prothrombin time/activated partial thromboplastin time. As many clinicians will note, CRP’s lack of specificity may be its Achilles heel, potentially lowering its prognostic value. Still, given its wide availability, low cost, and rapid turnaround, CRP could serve as a screening tool to risk stratify admitted coronavirus patients, while also providing reassurance when it is normal.
The results of this study could also impact use of hospital resources. The findings regarding the low risk of arrhythmias provide support for limiting the use of continuous cardiac monitoring in noncritically ill patients without previous histories of cardiac disease or elevated admission troponin levels. Patients with normal admission CRP levels could potentially be monitored safely with intermittent pulse oximetry. Continuous pulse oximetry and cardiac monitoring are already overused in many hospitals, and in the case of coronavirus the implications are even more significant given the importance of minimizing unnecessary healthcare worker exposures.
The vast majority (79% to 90%) of patients hospitalized for coronavirus will be cared for in non–ICU settings,4,5 yet most research has thus far focused on ICU patients. Nemer et al provide much-needed information on how to care for the noncritically ill coronavirus patients whom hospitalists are most likely to treat. As a resurgence of infections is expected this winter, this work has the potential to help physicians identify not only those who have the highest probability of deteriorating, but also those who may not. In a world of limited resources, knowing which patient is unlikely to deteriorate may be just as important as recognizing which one is.
1. Nemer D, Wilner BR, Burkle A, et al. Clinical characteristics and outcomes of non-ICU hospitalization for COVID-19 in a nonepicenter, centrally monitored healthcare system. J Hosp Med. 2021;16:7-14. https://doi.org/10.12788/jhm.3510
2. Lippi G, Pleban M, Henry B. Thrombocytopenia is associated with severe coronavirus disease 2019 (COVID-19) infections: A meta-analysis. Clin Chim Acta. 2020;506:145-148. https://doi.org/10.1016/j.cca.2020.03.022
3. Klok FA, Kruip MJHA, van der Meer NJM, et al. Incidence of thrombotic complications in critically ill ICU patients with COVID-19. Thromb Res. 2020;191:145-147. https://doi.org/10.1016/j.thromres.2020.04.013
4. Giannakeas V, Bhatia D, Warkentin M, et al. Estimating the maximum capacity of COVID-19 cases manageable per day given a health care system’s constrained resources. Ann Intern Med. April 16, 2020. https://doi.org/10.7326/M20-1169
5. Tsai T, Jacobson B, Jha A. American hospital capacity and projected need for COVID-19 patient care. Health Affairs blog. March 17, 2020. Accessed October 12, 2020. https://www.healthaffairs.org/do/10.1377/hblog20200317.457910/full/
© 2021 Society of Hospital Medicine
Telephone: 608-262-2434 Email: fkaiksow@wisc.edu; Twitter: @kaiksow.
ERRATUM: Decreasing Hypoglycemia following Insulin Administration for Inpatient Hyperkalemia
A correction has been made to the Figure. A dosage was incorrect in the Orderset 1.1 (1/1/16-3/19/17) box. The figure listed Insulin 19 Units IV x 1 and should have been Insulin 10 Units IV x 1. Below is the corrected figure..

A correction has been made to the Figure. A dosage was incorrect in the Orderset 1.1 (1/1/16-3/19/17) box. The figure listed Insulin 19 Units IV x 1 and should have been Insulin 10 Units IV x 1. Below is the corrected figure..
A correction has been made to the Figure. A dosage was incorrect in the Orderset 1.1 (1/1/16-3/19/17) box. The figure listed Insulin 19 Units IV x 1 and should have been Insulin 10 Units IV x 1. Below is the corrected figure..
Decreasing Hypoglycemia following Insulin Administration for Inpatient Hyperkalemia
Hyperkalemia (serum potassium ≥5.1 mEq/L), if left untreated, may result in cardiac arrhythmias, severe muscle weakness, or paralysis.1,2 Insulin administration can rapidly correct hyperkalemia by shifting serum potassiufm intracellularly.3 Treatment of hyperkalemia with insulin may lead to hypoglycemia, which, when severe, can cause confusion, seizures, loss of consciousness, and death. The use of regular and short-acting insulins to correct hyperkalemia quickly in hospitalized patients results in the greatest risk of hypoglycemia within three hours of treatment.4 Nonetheless, monitoring blood glucose levels within six hours of postinsulin administration is not a standard part of hyperkalemia treatment guidelines,3 leaving the rates of hypoglycemia in this setting poorly characterized.
Without standardized blood glucose measurement protocols, retrospective studies have reported posttreatment hypoglycemia rates of 8.7%-17.5% among all patients with hyperkalemia,5,6 and 13% among patients with end-stage renal disease.4 These estimates likely underestimate the true hypoglycemia rates as they measure blood glucose sporadically and are often outside the three-hour window of highest risk after insulin administration.
At the University of California, San Francisco Medical Center (UCSFMC), we faced similar issues in measuring the true hypoglycemia rates associated with hyperkalemia treatment. In December 2015, a 12-month retrospective review revealed a 12% hypoglycemia rate among patients treated with insulin for hyperkalemia. This review was limited by the inclusion of only patients treated for hyperkalemia using the standard orderset supplied with the electronic health record system (EHR; EPIC Systems, Verona, Wisconsin) and the absence of specific orders for glucose monitoring. As a result, more than 40% of these inpatients had no documented glucose within six hours of postinsulin administration.
We subsequently designed and implemented an adult inpatient hyperkalemia treatment orderset aimed at reducing iatrogenic hypoglycemia by promoting appropriate insulin use and blood glucose monitoring during the treatment of hyperkalemia. Through rapid improvement cycles, we iteratively revised the orderset to optimally mitigate the risk of hypoglycemia that was associated with insulin use. We describe implementation and outcomes of weight-based insulin dosing,7 automated alerts to identify patients at greatest risk for hypoglycemia, and clinical decision support based on the preinsulin blood glucose level. We report the rates of iatrogenic hypoglycemia after the implementation of these order-set changes.
METHODS
Design Overview
EHR data were extracted from Epic Clarity. We analyzed data following Orderset 1.1 implementation (January 1, 2016-March 19, 2017) when hypoglycemia rates were reliably quantifiable and following orderset revision 1.2 (March 20, 2017-September 30, 2017) to evaluate the impact of the orderset intervention. The data collection was approved by the Institutional Review Board at the University of California, San Francisco.
Additionally, we explored the frequency in which providers ordered insulin through the hyperkalemia orderset for each version of the orderset via two-month baseline reviews. Investigation for Orderset 1.1 was from January 1, 2017 to February 28, 2017 and for Orderset 1.2 was from August 1, 2017 to September 30, 2017. Insulin ordering frequency through the hyperkalemia orderset was defined as ordering insulin through the adult inpatient hyperkalemia orderset versus ordering insulin in and outside of the hyperkalemia orderset.
Last, we measured the nursing point of care testing (POCT) blood glucose measurement compliance with the hyperkalemia orderset. Nursing utilization acceptance of the hyperkalemia orderset was defined as adequate POCT blood glucose levels monitored in comparison to all insulin treatments via the hyperkalemia orderset.
Setting and Participants
We evaluated nonobstetric adult inpatients admitted to UCSF Medical Center between January 2016 and September 2017. All medical and surgical wards and intensive care units were included in the analysis.
Intervention
In June 2012, an EHR developed by Epic Systems was introduced at UCSFMC. In January 2016, we designed a new EHR-based hyperkalemia treatment orderset (Orderset 1.1), which added standard POCT blood glucose checks before and at one, two, four, and six hours after insulin injection (Appendix 1). In March 2017, a newly designed orderset (Orderset 1.2) replaced the previous hyperkalemia treatment orderset (Appendix 2). Orderset 1.2 included three updates. First, providers were now presented the option of ordering insulin as a
CORRECTED FIGURE PER ERRATUM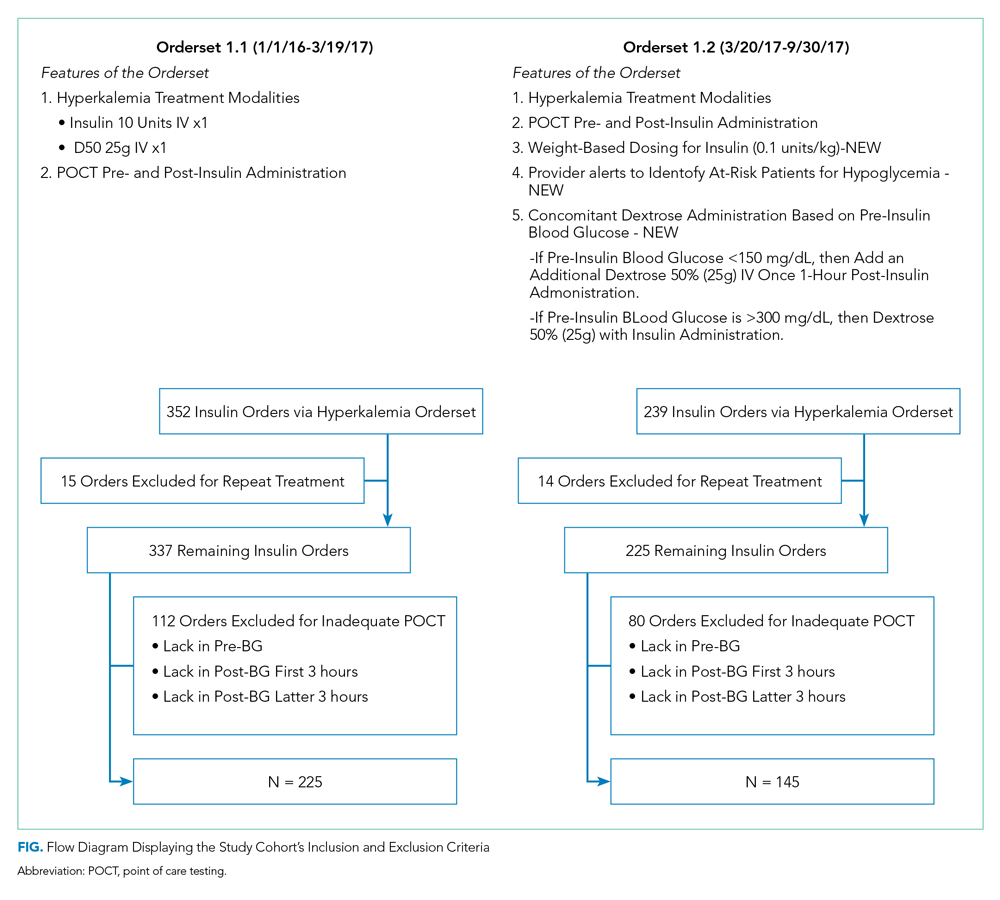
Inclusion and exclusion criteria are shown in the Figure. All patients who had insulin ordered via a hyperkalemia orderset were included in an intention-to-treat analysis. A further analysis was performed for patients for whom orderset compliance was achieved (ie, insulin ordered through the ordersets with adequate blood glucose monitoring). These patients were required to have a POCT blood glucose check preinsulin administration and postinsulin administration as follows: (1) between 30 to 180 minutes (0.5 to three hours) after insulin administration, and (2) between 180 and 360 minutes (three to six hours) after insulin administration. For patients receiving repeated insulin treatments for hyperkalemia within six hours, the first treatment data points were excluded to prevent duplication.
Outcomes
We extracted data on all nonobstetric adult patients admitted to UCSFMC between January 1, 2016 and March 19, 2017 (Orderset 1.1) and between March 20, 2017 and September 30, 2017 (Orderset 1.2).
We measured unique insulin administrations given that each insulin injection poses a risk of iatrogenic hypoglycemia. Hypoglycemia was defined as glucose <70 mg/dL and severe hypoglycemia was defined as glucose <40 mg/dL. Covariates included time and date of insulin administration; blood glucose levels before and at one, two, four, and six hours after insulin injection (if available); sex; weight; dose of insulin given for hyperkalemia treatment; creatinine; known diagnosis of diabetes; concomitant use of albuterol; and concomitant use of corticosteroids. Hyperglycemia was defined as glucose >180 mg/dL. We collected potassium levels pre- and postinsulin treatment. The responsible team’s discipline and the location of the patient (eg, medical/surgical unit, intensive care unit, emergency department) where the insulin orderset was used were recorded.
Statistical Analysis
Statistical analysis for our data included the χ2 test for categorical data and Student t test for continuous data. The bivariate analysis identified potential risk factors and protective factors for hypoglycemia, and logistic regression was used to determine independent predictors of hypoglycemia. Through bivariate analyses, any factor with a P value below .05 was included in the multivariable analyses to investigate a significant contribution to hypoglycemia outcomes. Analyses for hypoglycemia and severe hypoglycemia rates, potassium levels pre- and postinsulin treatment, and hyperglycemia rates were done for both the intention-to-treat group and the group with all criteria met. All analyses were rendered utilizing Stata version 14 (Stata Corp LLC, College Station, Texas).
RESULTS
Baseline patient characteristics, initial insulin dosing, the treatment team, and the location are shown in Table 1. With the implementation of weight-based dosing, a lower dose of insulin was administered with Orderset 1.2 compared with Orderset 1.1.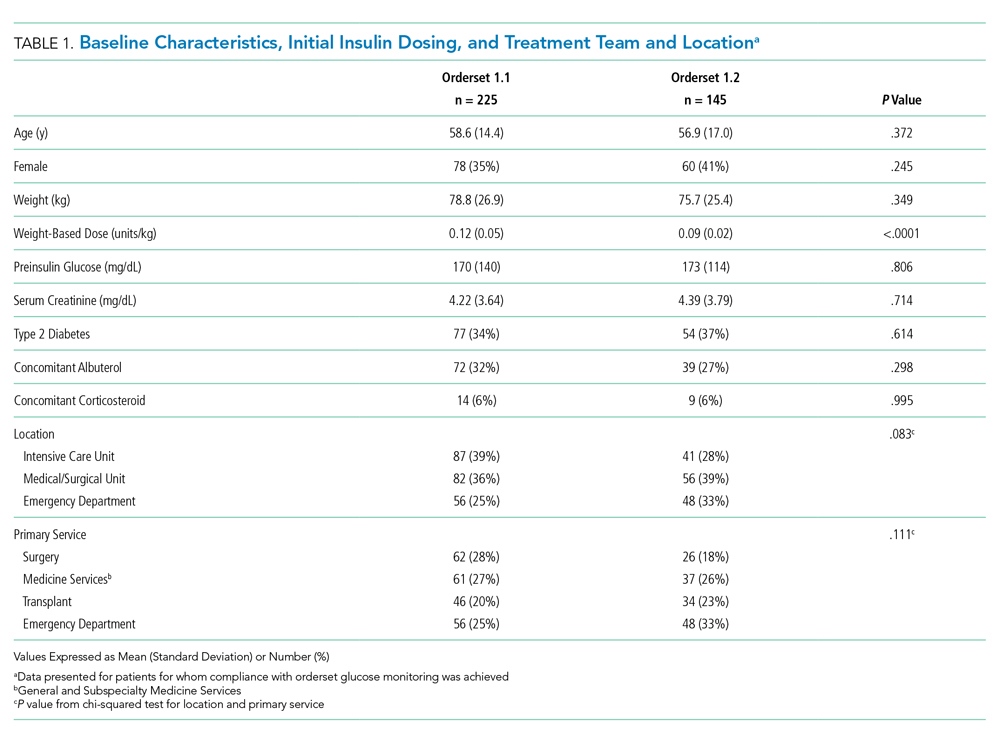
Orderset adherence rates for Orderset 1.1 and 1.2 were as follows: Acute Care Floor 65% (70%), Intensive Care Unit 63% (66%), and Emergency Department 60% (55%). A two-month audit of orderset usage and compliance revealed that 73% (70 of 96) of insulin treatments were ordered through Orderset 1.1, and 77% (71 of 92) of insulin treatments were ordered through Orderset 1.2. The distribution of orderset usage across location and primary service are shown in Table 1.
The patient distribution is shown in the Figure. In the Orderset 1.1 period, there were 352 total insulin treatments utilizing the newly revised UCSFMC adult inpatient hyperkalemia orderset that were used for the intention-to-treat analysis, and there were 225 patients for whom compliance with orderset monitoring was achieved. Notably, 112 treatments were excluded for the lack of adequate blood glucose monitoring. In the Orderset 1.2 period, there were 239 total insulin treatments utilizing the newly revised UCSFMC adult inpatient hyperkalemia orderset that were used for the intention-to-treat analysis, and there were 145 patients for whom compliance with orderset monitoring was achieved. During this phase, 80 treatments were excluded for inadequate blood glucose monitoring.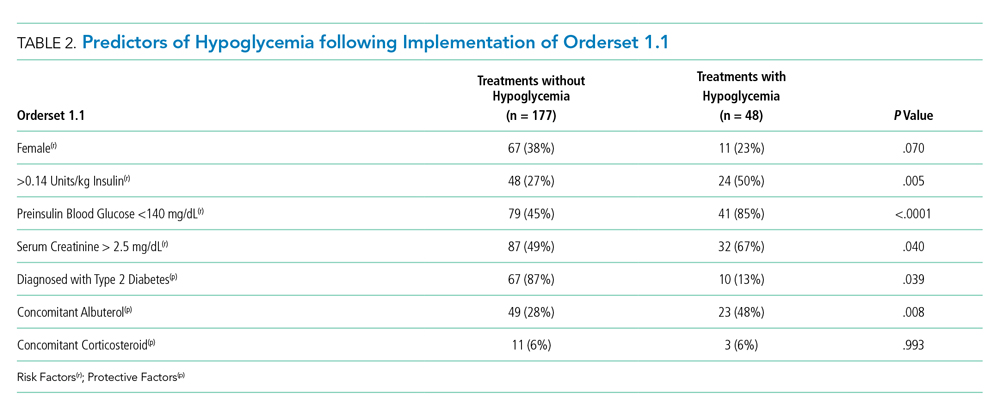
Predictors of hypoglycemia following the implementation of Orderset 1.1 are shown in Table 2, and the logistic regression model of these risks is shown in Appendix Table 1. Female gender, weight-based dosing of insulin exceeding 0.14 units/kg, preinsulin blood glucose less than 140 mg/dL, and serum creatinine greater than 2.5 mg/dl were associated with an increased risk of hypoglycemia. A known diagnosis of Type 2 diabetes, concomitant albuterol within one hour of insulin administration, and corticosteroid administration within two hours of insulin administration were associated with a decreased risk of hypoglycemia.
The rates of hypoglycemia (<70 mg/dl) and severe hypoglycemia (<40 mg/dl) are shown in Table 3. During the Orderset 1.1 period,
During the Orderset 1.2 period, for patients with all criteria met, 14 of 145 (10%) had hypoglycemia, and three of 145 (2%) had severe hypoglycemia. Ten of 14 (72%) of these hypoglycemic events occurred in the first three hours, with the remaining four hypoglycemic events (28%) occurring in the last three hours.
An intention-to-treat analysis for hyperglycemia, defined as glucose >180 mg/dl, revealed that during the Orderset 1.1 period, 80 of 352 (23%) had hyperglycemia before insulin administration, and 38 of 352 (11%) had hyperglycemia after insulin administration. During the Orderset 1.2 period, 52 of 239 (22%) had hyperglycemia before insulin administration, and 15 of 239 (6%) had hyperglycemia after insulin administration. Results can be found in Table 3.
Pre- and posttreatment potassium levels are shown in Table 3. An intention-to-treat analysis for potassium reduction postinsulin administration revealed that during the Orderset 1.1 period, there was an absolute reduction of 0.73 mmol/L, while during the Orderset 1.2 period, there was an absolute reduction of 0.95 mmol/L.
DISCUSSION
Treatment of hyperkalemia with insulin may result in significant iatrogenic hypoglycemia. Prior studies have likely underestimated the incidence of hyperkalemia treatment-associated hypoglycemia as glucose levels are rarely checked within three hours of insulin administration.8 In our study, which was designed to ensure appropriate blood glucose measurement, 21% of insulin treatments for hyperkalemia resulted in hypoglycemia, with 92% of hypoglycemic events occurring within the first three hours.
For the Orderset 1.1 period, patient risk factors identified for iatrogenic hypoglycemia postinsulin administration were female sex, doses of regular insulin greater than 0.14 units/kg, preinsulin blood glucose less than 140 mg/dL, and serum creatinine greater than 2.5 mg/dL. These results are consistent with studies suggesting that preinsulin blood glucose levels less than 140 mg/dL and the standard 10 units of insulin for hyperkalemia treatment may increase the risk of hypoglycemia.4,7,9
To decrease the risk of iatrogenic hypoglycemia, we redesigned our hyperkalemia insulin orderset to address the strongest predictors of hypoglycemia (doses of regular insulin greater than 0.14 units/kg and preinsulin blood glucose less than 140 mg/dL). The main changes were weight-based insulin dosing (based on previously published data)10 and adjustment of glucose administration based on the patient’s glucose levels.11 Following these changes, the rates of both hypoglycemia and severe hypoglycemia were statistically significantly reduced. In addition, of the 14 hypoglycemia events identified after the introduction of Orderset 1.2, five could have been prevented (36%) had the protocol been strictly followed. These five hypoglycemia events occurred later than one-hour postinsulin administration in patients with blood sugars < 150 mg/dL prior to insulin administration. In each of these cases, Orderset 1.2 called for an additional dextrose 50% (50 mL) IV bolus, which likely would have prevented the subsequently recorded hypoglycemia. In other words, our orderset indicated that these patients received an additional bolus of dextrose. However, they did not receive their glucose at the appropriate time, contributing to the hypoglycemia events. The orderset did not include a best practice alert (BPA) to remind providers about the extra dextrose bolus. In the future, we plan to add this BPA.
The hypoglycemia rate identified by Orderset 1.1 was 21% and the hypoglycemia rate identified by the Orderset 1.2 was 10%. The severe hypoglycemia rate identified by Orderset 1.1 was 5% and the severe hypoglycemia rate identified by Orderset 1.2 was 2%. The hypoglycemia and severe hypoglycemia rates significantly decreased after the introduction of Orderset 1.2. To mimic a real-world clinical setting, where monitoring of blood glucose is not always achieved multiple times within a six-hour timeframe of postinsulin treatment for hyperkalemia, we conducted an intention-to-treat analysis. Even when including patients for whom full blood glucose monitoring was not achieved, the introduction of Orderset 1.2 was associated with a significant decrease in the hypoglycemia rate.
To demonstrate whether weight-based dosing of insulin was as effective as a standard dose for hyperkalemia treatment, we compared the impact of Orderset 1.1, which only had the option for single standard doses of insulin, with the impact of Orderset 1.2, which included weight-based dosing options. With the introduction of Orderset 1.2, there was a significant decrease in serum potassium, indicating that weight-based dosing options may not only prevent hypoglycemia but may potentially provide more effective hyperkalemia treatment.
We also compared the rate of hyperglycemia (a glucose >180 mg/dl) pre- and posttreatment (Table 3). Although not statistically significant, the rate of hyperglycemia decreased from 11% to 6%, suggesting a trend toward decreased hyperglycemia with orderset usage.
As orderset usage for hyperkalemia management only occurred approximately 75% of the time, likely, forcing the use of these ordersets would further reduce the incidence of treatment-associated hypoglycemia. To encourage the use of ordersets for hyperkalemia management, our medical center has largely restricted insulin ordering so that it can only be done through ordersets with the proper precautions in place, regardless of the indication. Furthermore, adherence to all the blood glucose monitoring orders embedded in the ordersets remained suboptimal irrespective of managing the service or clinical setting
Finally, development and implementation of these hyperkalemia treatment ordersets required an experienced multidisciplinary team, including pharmacists, nurses, hospitalists, endocrinologists, and EHR system programmers.12,13 We, therefore, encourage interprofessional collaboration for any institutions seeking to establish innovative clinical protocols.
This analysis was limited to the insulin administration meeting our inclusion criteria. Thus, we could not identify a true hypoglycemia rate for treatments that were not followed by adequate blood glucose monitoring postinsulin administration, or for insulin administration ordered outside of the hyperkalemia ordersets.
CONCLUSION
The use of a comprehensive EHR orderset for the treatment of hyperkalemia with predefined times for blood glucose monitoring, weight-based insulin dosing, and prompts to warn providers of an individual patient’s risk for hypoglycemia may significantly reduce the incidence of iatrogenic hypoglycemia.
1. Acker CG, Johnson JP, Palevsky PM, Greenberg A. Hyperkalemia in hospitalized patients: causes, adequacy of treatment, and results of an attempt to improve physician compliance with published therapy guidelines. Arch Intern Med. 1998;158(8):917-924. https://doi.org/10.1001/archinte.158.8.917.
2. Fordjour KN, Walton T, Doran JJ. Management of hyperkalemia in hospitalized patients. Am J Med Sci. 2014;347(2):93-100. https://doi.org/10.1097/MAJ.0b013e318279b105.
3. Part-10-Special-Circumstances-of-Resuscitation.pdf. https://eccguidelines.heart.org/wp-content/themes/eccstaging/dompdf-master/pdffiles/part-10-special-circumstances-of-resuscitation.pdf. Accessed December 16, 2017.
4. Apel J, Reutrakul S, Baldwin D. Hypoglycemia in the treatment of hyperkalemia with insulin in patients with end-stage renal disease. Clin Kidney J. 2014;7(3):248-250. https://doi.org/10.1093/ckj/sfu026.
5. Schafers S, Naunheim R, Vijayan A, Tobin G. Incidence of hypoglycemia following insulin-based acute stabilization of hyperkalemia treatment. J Hosp Med. 2012;7(3):239-242. https://doi.org/10.1002/jhm.977.
6. Boughton CK, Dixon D, Goble E, et al. Preventing hypoglycemia following treatment of hyperkalemia in hospitalized patients. J Hosp Med. 2019;14:E1-E4. https://doi.org/10.12788/jhm.3145.
7. Wheeler DT, Schafers SJ, Horwedel TA, Deal EN, Tobin GS. Weight-based insulin dosing for acute hyperkalemia results in less hypoglycemia. J Hosp Med. 2016;11(5):355-357. https://doi.org/10.1002/jhm.2545.
8. Coca A, Valencia AL, Bustamante J, Mendiluce A, Floege J. Hypoglycemia following intravenous insulin plus glucose for hyperkalemia in patients with impaired renal function. PLoS ONE. 2017;12(2):e0172961. https://doi.org/10.1371/journal.pone.0172961.
9. LaRue HA, Peksa GD, Shah SC. A comparison of insulin doses for the treatment of hyperkalemia in patients with renal insufficiency. Pharmacotherapy. 2017;37(12):1516-1522. https://doi.org/10.1002/phar.2038.
10. Brown K, Setji TL, Hale SL, et al. Assessing the impact of an order panel utilizing weight-based insulin and standardized monitoring of blood glucose for patients with hyperkalemia. Am J Med Qual. 2018;33(6):598-603. https://doi.org/10.1177/1062860618764610.
11. Farina N, Anderson C. Impact of dextrose dose on hypoglycemia development following treatment of hyperkalemia. Ther Adv Drug Saf. 2018;9(6):323-329. https://doi.org/10.1177/2042098618768725.
12. Neinstein A, MacMaster HW, Sullivan MM, Rushakoff R. A detailed description of the implementation of inpatient insulin orders with a commercial electronic health record system. J Diabetes Sci Technol. 2014;8(4):641-651. https://doi.org/10.1177/1932296814536290.
13. MacMaster HW, Gonzalez S, Maruoka A, et al. Development and implementation of a subcutaneous Insulin pen label bar code scanning protocol to prevent wrong-patient insulin pen errors. Jt Comm J Qual Patient Saf. 2019;45(5):380-386. https://doi.org/10.1016/j.jcjq.2018.08.006.
Hyperkalemia (serum potassium ≥5.1 mEq/L), if left untreated, may result in cardiac arrhythmias, severe muscle weakness, or paralysis.1,2 Insulin administration can rapidly correct hyperkalemia by shifting serum potassiufm intracellularly.3 Treatment of hyperkalemia with insulin may lead to hypoglycemia, which, when severe, can cause confusion, seizures, loss of consciousness, and death. The use of regular and short-acting insulins to correct hyperkalemia quickly in hospitalized patients results in the greatest risk of hypoglycemia within three hours of treatment.4 Nonetheless, monitoring blood glucose levels within six hours of postinsulin administration is not a standard part of hyperkalemia treatment guidelines,3 leaving the rates of hypoglycemia in this setting poorly characterized.
Without standardized blood glucose measurement protocols, retrospective studies have reported posttreatment hypoglycemia rates of 8.7%-17.5% among all patients with hyperkalemia,5,6 and 13% among patients with end-stage renal disease.4 These estimates likely underestimate the true hypoglycemia rates as they measure blood glucose sporadically and are often outside the three-hour window of highest risk after insulin administration.
At the University of California, San Francisco Medical Center (UCSFMC), we faced similar issues in measuring the true hypoglycemia rates associated with hyperkalemia treatment. In December 2015, a 12-month retrospective review revealed a 12% hypoglycemia rate among patients treated with insulin for hyperkalemia. This review was limited by the inclusion of only patients treated for hyperkalemia using the standard orderset supplied with the electronic health record system (EHR; EPIC Systems, Verona, Wisconsin) and the absence of specific orders for glucose monitoring. As a result, more than 40% of these inpatients had no documented glucose within six hours of postinsulin administration.
We subsequently designed and implemented an adult inpatient hyperkalemia treatment orderset aimed at reducing iatrogenic hypoglycemia by promoting appropriate insulin use and blood glucose monitoring during the treatment of hyperkalemia. Through rapid improvement cycles, we iteratively revised the orderset to optimally mitigate the risk of hypoglycemia that was associated with insulin use. We describe implementation and outcomes of weight-based insulin dosing,7 automated alerts to identify patients at greatest risk for hypoglycemia, and clinical decision support based on the preinsulin blood glucose level. We report the rates of iatrogenic hypoglycemia after the implementation of these order-set changes.
METHODS
Design Overview
EHR data were extracted from Epic Clarity. We analyzed data following Orderset 1.1 implementation (January 1, 2016-March 19, 2017) when hypoglycemia rates were reliably quantifiable and following orderset revision 1.2 (March 20, 2017-September 30, 2017) to evaluate the impact of the orderset intervention. The data collection was approved by the Institutional Review Board at the University of California, San Francisco.
Additionally, we explored the frequency in which providers ordered insulin through the hyperkalemia orderset for each version of the orderset via two-month baseline reviews. Investigation for Orderset 1.1 was from January 1, 2017 to February 28, 2017 and for Orderset 1.2 was from August 1, 2017 to September 30, 2017. Insulin ordering frequency through the hyperkalemia orderset was defined as ordering insulin through the adult inpatient hyperkalemia orderset versus ordering insulin in and outside of the hyperkalemia orderset.
Last, we measured the nursing point of care testing (POCT) blood glucose measurement compliance with the hyperkalemia orderset. Nursing utilization acceptance of the hyperkalemia orderset was defined as adequate POCT blood glucose levels monitored in comparison to all insulin treatments via the hyperkalemia orderset.
Setting and Participants
We evaluated nonobstetric adult inpatients admitted to UCSF Medical Center between January 2016 and September 2017. All medical and surgical wards and intensive care units were included in the analysis.
Intervention
In June 2012, an EHR developed by Epic Systems was introduced at UCSFMC. In January 2016, we designed a new EHR-based hyperkalemia treatment orderset (Orderset 1.1), which added standard POCT blood glucose checks before and at one, two, four, and six hours after insulin injection (Appendix 1). In March 2017, a newly designed orderset (Orderset 1.2) replaced the previous hyperkalemia treatment orderset (Appendix 2). Orderset 1.2 included three updates. First, providers were now presented the option of ordering insulin as a
CORRECTED FIGURE PER ERRATUM
Inclusion and exclusion criteria are shown in the Figure. All patients who had insulin ordered via a hyperkalemia orderset were included in an intention-to-treat analysis. A further analysis was performed for patients for whom orderset compliance was achieved (ie, insulin ordered through the ordersets with adequate blood glucose monitoring). These patients were required to have a POCT blood glucose check preinsulin administration and postinsulin administration as follows: (1) between 30 to 180 minutes (0.5 to three hours) after insulin administration, and (2) between 180 and 360 minutes (three to six hours) after insulin administration. For patients receiving repeated insulin treatments for hyperkalemia within six hours, the first treatment data points were excluded to prevent duplication.
Outcomes
We extracted data on all nonobstetric adult patients admitted to UCSFMC between January 1, 2016 and March 19, 2017 (Orderset 1.1) and between March 20, 2017 and September 30, 2017 (Orderset 1.2).
We measured unique insulin administrations given that each insulin injection poses a risk of iatrogenic hypoglycemia. Hypoglycemia was defined as glucose <70 mg/dL and severe hypoglycemia was defined as glucose <40 mg/dL. Covariates included time and date of insulin administration; blood glucose levels before and at one, two, four, and six hours after insulin injection (if available); sex; weight; dose of insulin given for hyperkalemia treatment; creatinine; known diagnosis of diabetes; concomitant use of albuterol; and concomitant use of corticosteroids. Hyperglycemia was defined as glucose >180 mg/dL. We collected potassium levels pre- and postinsulin treatment. The responsible team’s discipline and the location of the patient (eg, medical/surgical unit, intensive care unit, emergency department) where the insulin orderset was used were recorded.
Statistical Analysis
Statistical analysis for our data included the χ2 test for categorical data and Student t test for continuous data. The bivariate analysis identified potential risk factors and protective factors for hypoglycemia, and logistic regression was used to determine independent predictors of hypoglycemia. Through bivariate analyses, any factor with a P value below .05 was included in the multivariable analyses to investigate a significant contribution to hypoglycemia outcomes. Analyses for hypoglycemia and severe hypoglycemia rates, potassium levels pre- and postinsulin treatment, and hyperglycemia rates were done for both the intention-to-treat group and the group with all criteria met. All analyses were rendered utilizing Stata version 14 (Stata Corp LLC, College Station, Texas).
RESULTS
Baseline patient characteristics, initial insulin dosing, the treatment team, and the location are shown in Table 1. With the implementation of weight-based dosing, a lower dose of insulin was administered with Orderset 1.2 compared with Orderset 1.1.
Orderset adherence rates for Orderset 1.1 and 1.2 were as follows: Acute Care Floor 65% (70%), Intensive Care Unit 63% (66%), and Emergency Department 60% (55%). A two-month audit of orderset usage and compliance revealed that 73% (70 of 96) of insulin treatments were ordered through Orderset 1.1, and 77% (71 of 92) of insulin treatments were ordered through Orderset 1.2. The distribution of orderset usage across location and primary service are shown in Table 1.
The patient distribution is shown in the Figure. In the Orderset 1.1 period, there were 352 total insulin treatments utilizing the newly revised UCSFMC adult inpatient hyperkalemia orderset that were used for the intention-to-treat analysis, and there were 225 patients for whom compliance with orderset monitoring was achieved. Notably, 112 treatments were excluded for the lack of adequate blood glucose monitoring. In the Orderset 1.2 period, there were 239 total insulin treatments utilizing the newly revised UCSFMC adult inpatient hyperkalemia orderset that were used for the intention-to-treat analysis, and there were 145 patients for whom compliance with orderset monitoring was achieved. During this phase, 80 treatments were excluded for inadequate blood glucose monitoring.
Predictors of hypoglycemia following the implementation of Orderset 1.1 are shown in Table 2, and the logistic regression model of these risks is shown in Appendix Table 1. Female gender, weight-based dosing of insulin exceeding 0.14 units/kg, preinsulin blood glucose less than 140 mg/dL, and serum creatinine greater than 2.5 mg/dl were associated with an increased risk of hypoglycemia. A known diagnosis of Type 2 diabetes, concomitant albuterol within one hour of insulin administration, and corticosteroid administration within two hours of insulin administration were associated with a decreased risk of hypoglycemia.
The rates of hypoglycemia (<70 mg/dl) and severe hypoglycemia (<40 mg/dl) are shown in Table 3. During the Orderset 1.1 period,
During the Orderset 1.2 period, for patients with all criteria met, 14 of 145 (10%) had hypoglycemia, and three of 145 (2%) had severe hypoglycemia. Ten of 14 (72%) of these hypoglycemic events occurred in the first three hours, with the remaining four hypoglycemic events (28%) occurring in the last three hours.
An intention-to-treat analysis for hyperglycemia, defined as glucose >180 mg/dl, revealed that during the Orderset 1.1 period, 80 of 352 (23%) had hyperglycemia before insulin administration, and 38 of 352 (11%) had hyperglycemia after insulin administration. During the Orderset 1.2 period, 52 of 239 (22%) had hyperglycemia before insulin administration, and 15 of 239 (6%) had hyperglycemia after insulin administration. Results can be found in Table 3.
Pre- and posttreatment potassium levels are shown in Table 3. An intention-to-treat analysis for potassium reduction postinsulin administration revealed that during the Orderset 1.1 period, there was an absolute reduction of 0.73 mmol/L, while during the Orderset 1.2 period, there was an absolute reduction of 0.95 mmol/L.
DISCUSSION
Treatment of hyperkalemia with insulin may result in significant iatrogenic hypoglycemia. Prior studies have likely underestimated the incidence of hyperkalemia treatment-associated hypoglycemia as glucose levels are rarely checked within three hours of insulin administration.8 In our study, which was designed to ensure appropriate blood glucose measurement, 21% of insulin treatments for hyperkalemia resulted in hypoglycemia, with 92% of hypoglycemic events occurring within the first three hours.
For the Orderset 1.1 period, patient risk factors identified for iatrogenic hypoglycemia postinsulin administration were female sex, doses of regular insulin greater than 0.14 units/kg, preinsulin blood glucose less than 140 mg/dL, and serum creatinine greater than 2.5 mg/dL. These results are consistent with studies suggesting that preinsulin blood glucose levels less than 140 mg/dL and the standard 10 units of insulin for hyperkalemia treatment may increase the risk of hypoglycemia.4,7,9
To decrease the risk of iatrogenic hypoglycemia, we redesigned our hyperkalemia insulin orderset to address the strongest predictors of hypoglycemia (doses of regular insulin greater than 0.14 units/kg and preinsulin blood glucose less than 140 mg/dL). The main changes were weight-based insulin dosing (based on previously published data)10 and adjustment of glucose administration based on the patient’s glucose levels.11 Following these changes, the rates of both hypoglycemia and severe hypoglycemia were statistically significantly reduced. In addition, of the 14 hypoglycemia events identified after the introduction of Orderset 1.2, five could have been prevented (36%) had the protocol been strictly followed. These five hypoglycemia events occurred later than one-hour postinsulin administration in patients with blood sugars < 150 mg/dL prior to insulin administration. In each of these cases, Orderset 1.2 called for an additional dextrose 50% (50 mL) IV bolus, which likely would have prevented the subsequently recorded hypoglycemia. In other words, our orderset indicated that these patients received an additional bolus of dextrose. However, they did not receive their glucose at the appropriate time, contributing to the hypoglycemia events. The orderset did not include a best practice alert (BPA) to remind providers about the extra dextrose bolus. In the future, we plan to add this BPA.
The hypoglycemia rate identified by Orderset 1.1 was 21% and the hypoglycemia rate identified by the Orderset 1.2 was 10%. The severe hypoglycemia rate identified by Orderset 1.1 was 5% and the severe hypoglycemia rate identified by Orderset 1.2 was 2%. The hypoglycemia and severe hypoglycemia rates significantly decreased after the introduction of Orderset 1.2. To mimic a real-world clinical setting, where monitoring of blood glucose is not always achieved multiple times within a six-hour timeframe of postinsulin treatment for hyperkalemia, we conducted an intention-to-treat analysis. Even when including patients for whom full blood glucose monitoring was not achieved, the introduction of Orderset 1.2 was associated with a significant decrease in the hypoglycemia rate.
To demonstrate whether weight-based dosing of insulin was as effective as a standard dose for hyperkalemia treatment, we compared the impact of Orderset 1.1, which only had the option for single standard doses of insulin, with the impact of Orderset 1.2, which included weight-based dosing options. With the introduction of Orderset 1.2, there was a significant decrease in serum potassium, indicating that weight-based dosing options may not only prevent hypoglycemia but may potentially provide more effective hyperkalemia treatment.
We also compared the rate of hyperglycemia (a glucose >180 mg/dl) pre- and posttreatment (Table 3). Although not statistically significant, the rate of hyperglycemia decreased from 11% to 6%, suggesting a trend toward decreased hyperglycemia with orderset usage.
As orderset usage for hyperkalemia management only occurred approximately 75% of the time, likely, forcing the use of these ordersets would further reduce the incidence of treatment-associated hypoglycemia. To encourage the use of ordersets for hyperkalemia management, our medical center has largely restricted insulin ordering so that it can only be done through ordersets with the proper precautions in place, regardless of the indication. Furthermore, adherence to all the blood glucose monitoring orders embedded in the ordersets remained suboptimal irrespective of managing the service or clinical setting
Finally, development and implementation of these hyperkalemia treatment ordersets required an experienced multidisciplinary team, including pharmacists, nurses, hospitalists, endocrinologists, and EHR system programmers.12,13 We, therefore, encourage interprofessional collaboration for any institutions seeking to establish innovative clinical protocols.
This analysis was limited to the insulin administration meeting our inclusion criteria. Thus, we could not identify a true hypoglycemia rate for treatments that were not followed by adequate blood glucose monitoring postinsulin administration, or for insulin administration ordered outside of the hyperkalemia ordersets.
CONCLUSION
The use of a comprehensive EHR orderset for the treatment of hyperkalemia with predefined times for blood glucose monitoring, weight-based insulin dosing, and prompts to warn providers of an individual patient’s risk for hypoglycemia may significantly reduce the incidence of iatrogenic hypoglycemia.
1. Acker CG, Johnson JP, Palevsky PM, Greenberg A. Hyperkalemia in hospitalized patients: causes, adequacy of treatment, and results of an attempt to improve physician compliance with published therapy guidelines. Arch Intern Med. 1998;158(8):917-924. https://doi.org/10.1001/archinte.158.8.917.
2. Fordjour KN, Walton T, Doran JJ. Management of hyperkalemia in hospitalized patients. Am J Med Sci. 2014;347(2):93-100. https://doi.org/10.1097/MAJ.0b013e318279b105.
3. Part-10-Special-Circumstances-of-Resuscitation.pdf. https://eccguidelines.heart.org/wp-content/themes/eccstaging/dompdf-master/pdffiles/part-10-special-circumstances-of-resuscitation.pdf. Accessed December 16, 2017.
4. Apel J, Reutrakul S, Baldwin D. Hypoglycemia in the treatment of hyperkalemia with insulin in patients with end-stage renal disease. Clin Kidney J. 2014;7(3):248-250. https://doi.org/10.1093/ckj/sfu026.
5. Schafers S, Naunheim R, Vijayan A, Tobin G. Incidence of hypoglycemia following insulin-based acute stabilization of hyperkalemia treatment. J Hosp Med. 2012;7(3):239-242. https://doi.org/10.1002/jhm.977.
6. Boughton CK, Dixon D, Goble E, et al. Preventing hypoglycemia following treatment of hyperkalemia in hospitalized patients. J Hosp Med. 2019;14:E1-E4. https://doi.org/10.12788/jhm.3145.
7. Wheeler DT, Schafers SJ, Horwedel TA, Deal EN, Tobin GS. Weight-based insulin dosing for acute hyperkalemia results in less hypoglycemia. J Hosp Med. 2016;11(5):355-357. https://doi.org/10.1002/jhm.2545.
8. Coca A, Valencia AL, Bustamante J, Mendiluce A, Floege J. Hypoglycemia following intravenous insulin plus glucose for hyperkalemia in patients with impaired renal function. PLoS ONE. 2017;12(2):e0172961. https://doi.org/10.1371/journal.pone.0172961.
9. LaRue HA, Peksa GD, Shah SC. A comparison of insulin doses for the treatment of hyperkalemia in patients with renal insufficiency. Pharmacotherapy. 2017;37(12):1516-1522. https://doi.org/10.1002/phar.2038.
10. Brown K, Setji TL, Hale SL, et al. Assessing the impact of an order panel utilizing weight-based insulin and standardized monitoring of blood glucose for patients with hyperkalemia. Am J Med Qual. 2018;33(6):598-603. https://doi.org/10.1177/1062860618764610.
11. Farina N, Anderson C. Impact of dextrose dose on hypoglycemia development following treatment of hyperkalemia. Ther Adv Drug Saf. 2018;9(6):323-329. https://doi.org/10.1177/2042098618768725.
12. Neinstein A, MacMaster HW, Sullivan MM, Rushakoff R. A detailed description of the implementation of inpatient insulin orders with a commercial electronic health record system. J Diabetes Sci Technol. 2014;8(4):641-651. https://doi.org/10.1177/1932296814536290.
13. MacMaster HW, Gonzalez S, Maruoka A, et al. Development and implementation of a subcutaneous Insulin pen label bar code scanning protocol to prevent wrong-patient insulin pen errors. Jt Comm J Qual Patient Saf. 2019;45(5):380-386. https://doi.org/10.1016/j.jcjq.2018.08.006.
© 2020 Society of Hospital Medicine