User login
Macrolides for Mycoplasmal Pneumonia
Mycoplasma pneumoniae is a common cause of community‐acquired pneumonia (CAP), among school‐age children and adolescents.14 Though pneumonia caused by M. pneumoniae is typically self‐limited, severe illness may occur.5 M. pneumoniae has also been implicated in airway inflammation, which may lead to the onset and development of chronic pulmonary disease.610 Few studies have directly addressed appropriate treatment strategies for M. pneumoniae pneumonia,11 and, despite its high prevalence and potential for causing severe complications, treatment recommendations remain inconsistent.
The efficacy of macrolide therapy in particular for M. pneumoniae remains unclear. In vitro susceptibility studies have shown bacteriostatic activity of erythromycin, clarithromycin, and azithromycin against M. pneumoniae.1218 Additionally, several small retrospective studies have shown that among children with atypical CAP (including M. pneumoniae pneumonia), those treated with macrolides were less likely to have persistence or progression of signs and symptoms after 3 days of therapy.19, 20 Lu et al21 found a shorter duration of fever among macrolide recipients compared with non‐recipients. In adults, Shames et al22 found a shorter duration of fever and hospitalization among erythromycin recipients compared with controls. Other randomized controlled trials have also addressed the use of macrolides in treatment of M. pneumoniae, but the ability to draw meaningful conclusions is limited by small samples sizes and by lack of details about the number of patients with M. pneumoniae.11
In addition to their antimicrobial effect, macrolides also have anti‐inflammatory properties.2327 The importance of these anti‐inflammatory properties is supported by studies showing clinical cure in patients treated with macrolides despite persistence of M. pneumoniae organisms,2831 clinical improvement despite the administration of doses that provide tissue levels below the minimum inhibitory concentration of the organism,3234 and clinical cure in patients with macrolide‐resistant M. pneumoniae.18, 35
The objectives of the current study were to examine the impact of macrolide therapy on the length of stay (LOS) and short‐ and longer‐term readmissions, including longer‐term asthma‐related readmissions, in children hospitalized with M. pneumoniae pneumonia.
METHODS
Data Source
Data for this retrospective cohort study were obtained from the Pediatric Health Information System (PHIS), which contains administrative data from 38 freestanding children's hospitals. Data quality and reliability are assured through a joint effort by the Child Health Corporation of America (Shawnee Mission, KS) and PHIS‐participating hospitals as described previously.36, 37 Encrypted medical record numbers allow for tracking of individual patients across hospitalizations. This study was reviewed and approved by the Committees for the Protection of Human Subjects at The Children's Hospital of Philadelphia (Philadelphia, PA).
Patients
Children 6‐18 years of age with CAP were eligible if they were discharged from a participating hospital between January 1, 2006 and December 31, 2008. Subjects were included if they received antibiotic therapy on the first day of hospitalization and if they satisfied one of the following International Classification of Diseases, 9th revision (ICD‐9) discharge diagnosis code criteria: 1) Principal diagnosis of M. pneumoniae pneumonia (483.0); 2) Principal diagnosis of a pneumonia‐related symptom (eg, fever, cough) (780.6 or 786.00‐786.52 [except 786.1]) and a secondary diagnosis of M. pneumoniae pneumonia; or 3) Principal diagnosis of pneumonia (481‐483.8 [except 483.0], 485‐486) and a secondary diagnosis of Mycoplasma (041.81).
Children younger than 6 years of age were excluded due to the low prevalence of M. pneumoniae infection.2, 38 Patients with comorbid conditions predisposing to severe or recurrent pneumonia (eg, cystic fibrosis, malignancy) were excluded using a previously reported classification scheme.39 In addition, we excluded patient data from 2 hospitals due to incomplete reporting of discharge information; thus data from 36 hospitals were included in this study.
Validation of Discharge Diagnosis Codes for Mycoplasma pneumoniae
To assess for misclassification of the diagnosis of M. pneumoniae, we reviewed records of a randomly selected subset of subjects from The Children's Hospital of Philadelphia; 14 of 15 patients had signs of lower respiratory tract infection in conjunction with a positive M. pneumoniae polymerase chain reaction test from nasopharyngeal washings to confirm the diagnosis of M. pneumoniae pneumonia. Hence, the positive predictive value of our algorithm for diagnosing M. pneumoniae pneumonia was 93.3%.
Study Definitions
We identified children with asthma in 2 ways. Asthma‐related hospitalizations were identified by an ICD‐9 code for asthma (493.0‐493.92) in any discharge diagnosis field during any hospitalization in the 24 months prior to the current hospitalization. Baseline controller medications were identified by receipt of inhaled corticosteroids (eg, fluticasone) or leukotriene receptor antagonists on the first day of hospitalization.
Systemic corticosteroids (either oral or intravenous) included dexamethasone, hydrocortisone, methylprednisolone, prednisolone, and prednisone. Measures of disease severity included admission to the intensive care unit within 48 hours of hospitalization, and administration of vancomycin or clindamycin, vasoactive infusions (epinephrine, norepinephrine, dopamine, and dobutamine), and invasive (endotracheal intubation) and noninvasive (continuous positive airway pressure) mechanical ventilation within 24 hours of hospitalization, as previously described.40, 41 Viral respiratory season was defined as October through March.
Measured Outcomes
The primary outcomes of interest were hospital LOS and all‐cause readmission within 28 days and 15 months after index discharge. We examined readmissions for asthma 15 months after index discharge as a secondary outcome measure because of the potential role for M. pneumoniae infection in long‐term lung dysfunction, including asthma.42 The 15‐month time frame was selected based on longitudinal data available in PHIS for the entire study cohort.
Measured Exposures
The main exposure was early initiation of macrolide therapy, defined as receipt of erythromycin, clarithromycin, or azithromycin on the first day of hospitalization.
Data Analysis
Continuous variables were described using median and interquartile range (IQR) or range values, and compared using the Wilcoxon rank‐sum test. Categorical variables were described using counts and frequencies, and compared using the chi‐square test. Multivariable linear (for LOS) and logistic (for readmission) regression analyses were performed to assess the independent association of macrolide therapy with the primary outcomes. Because the LOS data had a skewed distribution, our analyses were performed using logarithmically transformed LOS values as the dependent variable. The resulting beta‐coefficients were transformed to reflect the percent difference in LOS between subjects receiving and not receiving macrolide therapy.
Building of the multivariable models began with the inclusion of macrolide therapy. Variables associated with primary outcomes on univariate analysis (P < 0.20) were also considered for inclusion as potential confounders.43 These variables were included in the final multivariable model if they remained significant after adjusting for other factors, or if their inclusion in the model resulted in a 15% or greater change in the effect size of the primary association of interest (ie, macrolide therapy).44 Because corticosteroids also have anti‐inflammatory properties, we assessed for interactions with macrolide therapy. There was no interaction between macrolide and systemic corticosteroid therapy (P = 0.26, Likelihood ratio test), therefore our primary model adjusted for systemic corticosteroids.
Despite adjusting for systemic corticosteroid therapy in our primary analysis, residual confounding by indication for corticosteroid therapy might exist. We therefore repeated the analysis after stratifying by receipt or non‐receipt of systemic corticosteroid therapy. Because the benefit of macrolides in preventing long‐term dysfunction may be limited to those without a prior diagnosis of asthma, we repeated the analysis of readmissions within 15 months of index discharge (any readmission and asthma‐related readmissions) while limiting the cohort to those without evidence of asthma (ie, no prior asthma‐related hospitalizations and no chronic asthma medications). Because children with underlying conditions or circumstances that would predispose to prolonged hospitalizations may have been included, despite our restriction of the cohort to those without an identified chronic complex condition, we also repeated the analysis while limiting the cohort to those with a LOS 7 days. Finally, all analyses were clustered on hospital using the robust standard errors of Huber and White to account for the correlation of exposures and outcomes among children within centers.
Data were analyzed using Stata version 11 (Stata Corporation, College Station, TX). Statistical significance was determined a priori as a two‐tailed P value <0.05.
RESULTS
Patient Characteristics
During the study, 690 children ages 6 to 18 years met inclusion criteria. Characteristics of these patients are shown in Table 1. The median age was 10 years (IQR, 7‐13 years). Ten patients (1.4%) also had a concomitant discharge diagnosis of pneumococcal pneumonia, while 19 patients (2.7%) had a concomitant discharge diagnosis of viral pneumonia; 1 of these patients had discharge diagnoses of both viral and pneumococcal pneumonia.
| Empiric Macrolide Therapy | ||||
|---|---|---|---|---|
| Variable | All Subjects | Yes | No | P |
| ||||
| Demographics | ||||
| Male sex | 356 (51.6) | 200 (49.4) | 156 (54.7) | 0.166 |
| Race | ||||
| Black | 135 (19.6) | 81 (20.0) | 54 (19.0) | 0.506 |
| White | 484 (70.1) | 287 (70.9) | 197 (69.1) | |
| Other | 62 (9.0) | 31 (7.7) | 31 (10.9) | |
| Missing | 9 (1.3) | 6 (1.5) | 3 (1.1) | |
| Presentation during viral respiratory season | 420 (60.9) | 242 (59.8) | 178 (62.5) | |
| Prior asthma hospitalization | 41 (5.9) | 31 (7.7) | 10 (3.5) | 0.023 |
| Intensive care unit admission | 127 (18.4) | 74 (18.3) | 53 (18.6) | 0.914 |
| Laboratory tests and procedures | ||||
| Additional radiologic imaging* | 24 (3.5) | 13 (3.2) | 11 (3.9) | 0.646 |
| Arterial blood gas | 116 (17.3) | 72 (18.5) | 44 (15.6) | 0.316 |
| Complete blood count | 433 (64.4) | 249 (64.0) | 184 (65.0) | 0.788 |
| Blood culture | 280 (41.7) | 167 (42.9) | 113 (39.9) | 0.436 |
| Mechanical ventilation | 16 (2.3) | 5 (1.2) | 11 (3.86) | 0.024 |
| Medications | ||||
| Chronic asthma medication | 116 (16.8) | 72 (17.8) | 44 (15.4) | 0.419 |
| Beta‐agonist therapy | 328 (47.5) | 215 (53.1) | 113 (39.7) | 0.001 |
| Vasoactive infusions | 22 (3.2) | 13 (3.2) | 9 (3.2) | 0.969 |
| Systemic corticosteroids | 252 (36.5) | 191 (47.2) | 61 (21.4) | <0.001 |
| Clindamycin or vancomycin | 86 (12.5) | 24 (5.9) | 62 (21.8) | <0.001 |
Macrolide therapy was administered to 405 (58.7%) patients. Systemic corticosteroid therapy was administered to 252 (36.5%) patients. Overall, 191 (27.7%) of the 690 patients received both macrolides and systemic corticosteroids empirically, while 224 (32.5%) received neither; 61 (8.8%) received corticosteroids but not macrolides, while 214 (31.0%) received macrolides but not corticosteroids. Asthma hospitalization within the 24 months prior to admission was more common among those receiving macrolides (N = 60/405, 14.8%) than among those not receiving macrolides (N = 30/285, 10.5%) (P = 0.023). Macrolide recipients also more commonly received concomitant systemic corticosteroids (N = 191/405, 47.2%) than macrolide non‐recipients (N = 61/285, 21.4%) (P < 0.001) and more commonly received beta‐agonist therapy (N = 215/405, 53.1%) than macrolide non‐recipients (N = 113/285, 39.7%) (P = 0.001).
Length of Stay
The overall median LOS was 3 days (IQR, 2‐6 days); the median LOS was 3 days (IQR, 2‐5 days) for empiric macrolide recipients and 4 days (IQR, 2‐9 days) for non‐recipients (P < 0.001). Overall, 22.9% (N = 158) of children had an LOS 7 days and 8.8% (N = 61) of children had an LOS 14 days. The LOS was 7 days for 15.3% (N = 62) of macrolide recipients and 33.7% (N = 96) of non‐recipients. LOS was 7 days for 17.5% (N = 44) of systemic steroid recipients and 26% (N = 114) of non‐recipients. In unadjusted analysis, macrolide therapy (beta‐coefficient, 0.49; 95% confidence interval [CI]: 0.72 to 0.25; P < 0.001) and systemic corticosteroid administration (beta‐coefficient, 0.26; CI: 0.37 to 0.14; P < 0.001) were associated with shorter hospital LOS (Appendix 1).
In multivariable analysis, macrolide therapy remained associated with a shorter LOS (Table 2; Appendix 2). Systemic corticosteroid administration was associated with a 23% shorter LOS (adjusted beta‐coefficient, 0.26; 95% CI: 0.39 to 0.14; P < 0.001). In contrast, previous hospitalization for asthma was associated with a 31% longer LOS (adjusted beta‐coefficient, 0.27; 95% CI: 0.09‐0.045; P = 0.004). Receipt of beta‐agonist therapy or chronic asthma medications were not associated with significant differences in LOS. In analysis stratified by receipt or non‐receipt of concomitant systemic corticosteroid therapy, empiric macrolide therapy remained associated with a significantly shorter LOS in both systemic corticosteroid recipients and non‐recipient (Table 4). When the cohort was restricted to subjects with a LOS 7 days, macrolide therapy remained significantly associated with a shorter LOS (adjusted percent change, 20%; 95% CI: 32% to 5%; P = 0.015).
| Association of Empiric Macrolide Therapy With Outcomes* | |
|---|---|
| |
| Length of stay (days) | |
| Adjusted beta‐coefficient (95 % CI) | 0.38 (0.59 to 0.17) |
| Adjusted percent change (95% CI) | 32% (45% to 15%) |
| P value | 0.001 |
| Any readmission within 28 days | |
| Adjusted odds ratio (95% CI) | 1.12 (0.22 to 5.78) |
| P value | 0.890 |
| Any readmission within 15 mo | |
| Adjusted odds ratio (95% CI) | 1.00 (0.59 to 1.70) |
| P value | 0.991 |
| Asthma hospitalization within 15 mo | |
| Adjusted odds ratio (95% CI) | 1.09 (0.54 to 2.17) |
| P value | 0.820 |
Readmission
Overall, 8 children (1.2%) were readmitted for pneumonia‐associated conditions within 28 days of index discharge. Readmission occurred in 1.2% of macrolide recipients and 1.1% of non‐recipients (P = 0.83) (Table 4). In unadjusted analysis, neither macrolide therapy (odds ratio [OR], 1.18; 95% CI: 0.25‐5.45; P = 0.84) nor systemic corticosteroid administration (OR, 1.04; 95% CI: 0.27‐4.10; P = 0.95) was associated with 28‐day readmission (Appendix 3). In multivariable analysis, empiric macrolide therapy was not associated with 28‐day readmission in the overall cohort (Table 2; Appendix 4)), or when the analysis was stratified by receipt or non‐receipt of concomitant systemic corticosteroid therapy (Table 3).
| Concomitant Systemic Corticosteroid Therapy* | ||
|---|---|---|
| Yes | No | |
| ||
| Length of stay | ||
| Adjusted beta‐coefficient (95% CI) | 0.40 (0.74 to 0.07) | 0.37 (0.58 to 0.16) |
| Adjusted percent change (95% CI) | 33% (52% to 7%) | 31% (44% to 15%) |
| P value | 0.020 | 0.001 |
| Readmission within 28 days | ||
| Adjusted odds ratio (95% CI) | 1.09 (0.05 to 26.7) | 1.50 (0.21 to 10.8) |
| P value | 0.960 | 0.687 |
| Readmission within 15 mo | ||
| Adjusted odds ratio (95% CI) | 1.57 (0.65 to 3.82) | 0.81 (0.45 to 1.46) |
| P value | 0.32 | 0.49 |
| Asthma hospitalization within 15 mo | ||
| Adjusted odds ratio (95% CI) | 1.51 (0.58 to 3.93) | 0.85 (0.36 to 1.97) |
| P value | 0.395 | 0.700 |
| Empiric Macrolide Therapy | ||
|---|---|---|
| N/Total (%) | ||
| Readmission | Yes | No |
| Any readmission within 28 days | ||
| Overall | 5/405 (1.2) | 3/285 (1.1) |
| Systemic corticosteroid therapy | 2/186 (1.1) | 1/66 (1.5) |
| No systemic corticosteroid therapy | 3/177 (1.7) | 2/261 (0.8) |
| Any readmission within 15 mo | ||
| Overall | 96/405 (23.7) | 64/285 (22.5) |
| Systemic corticosteroid therapy | 52/186 (28.0) | 17/66 (25.8) |
| No systemic corticosteroid therapy | 32/177 (18.1) | 59/261 (22.6) |
| Asthma hospitalization within 15 mo | ||
| Overall | 61/405 (15.1) | 34/285 (11.9) |
| Systemic corticosteroid therapy | 39/186 (21.0) | 13/66 (19.7) |
| No systemic corticosteroid therapy | 14/177 (7.9) | 29/261 (11.1) |
Overall, 160 children (23.2%) were readmitted within 15 months of index discharge; 95 were readmitted for asthma during this time (Table 3). Overall readmission occurred in 23.7% of macrolide recipients and 22.5% of macrolide non‐recipients (P = 0.702). Asthma readmission occurred in 15.1% of macrolide recipients and 11.9% of macrolide non‐recipients (P = 0.240). In unadjusted analysis, empiric macrolide therapy was not significantly associated with any readmission within 15 months (OR, 1.07; 95% CI: 0.69‐1.68; P = 0.759) or with asthma‐related readmission within 15 months (OR, 1.31; 95% CI: 0.73‐ 2.36; P = 0.369). In multivariable analysis, neither any readmission nor asthma readmission within 15 months was associated with empiric macrolide therapy overall (Table 2) or when stratified by receipt or non‐receipt of concomitant systemic corticosteroid therapy (Table 3).
The analyses for readmissions within 15 months of index discharge were repeated while limiting the cohort to those without prior asthma hospitalizations or chronic asthma medications. In this subset of patients, readmissions for any reason occurred in 55 (18.6%) of 295 macrolide recipients and 50 (22.0%) of 227 non‐recipients. The difference was not statistically significant in multivariable analysis (adjusted odds ratio, 0.79; 95% CI: 0.41‐1.51; P = 0.47). Readmissions for asthma occurred in 30 (10.2%) of 295 macrolide recipients and 26 (11.5%) of 227 non‐recipients; this difference was also not significant in multivariable analysis (adjusted odds ratio, 0.83; 95% CI: 0.36‐1.93; P = 0.83). The magnitude of the estimate of effect for 28‐day and 15‐month readmissions, and 15‐month asthma hospitalizations, was similar to the primary analysis when the cohort was restricted to subjects with a LOS 7 days.
DISCUSSION
This multicenter study examined the role of macrolide therapy in children hospitalized with M. pneumoniae pneumonia. Empiric macrolide therapy was associated with an approximately 30% shorter hospital LOS and, in stratified analysis, remained associated with a significantly shorter hospital LOS in both systemic corticosteroid recipients and non‐recipients. Empiric macrolide therapy was not associated with short‐ or longer‐term hospital readmission.
Previous small randomized trials have been inconclusive regarding the potential benefit of macrolide therapy in M. pneumoniae pneumonia.11 Our study, which demonstrated a shorter LOS among macrolides recipients compared with non‐recipients, has several advantages over prior studies including a substantively larger sample size and multicenter design. Animal models support our observations regarding the potential beneficial antimicrobial role of macrolides. M. pneumoniae concentrations in bronchoalveolar lavage specimens were significantly lower among experimentally infected mice treated with clarithromycin, a macolide‐class antibiotic, compared with either placebo or dexamethasone.45 Combination therapy with clarithromycin and dexamethasone reduced histopathologic inflammation to a greater degree than dexamethasone alone.45
While the relative importance of the antimicrobial and anti‐inflammatory properties of macrolides is not known, observational studies of children infected with macrolide‐resistant M. pneumoniae suggest that the antimicrobial properties of macrolides may provide disproportionate clinical benefit. The duration of fever in macrolide recipients with macrolide‐resistant M. pneumoniae (median duration, 9 days) reported by Suzuki et al46 was significantly longer than those with macrolide‐susceptible infections (median duration, 5 days), and similar to the duration of fever in patients with M. pneumoniae infection treated with placebo (median duration, 8 days) reported by Kingston et al.47 Additionally, macrolide therapy was associated with significant improvements in lung function in patients with asthma and concomitant M. pneumoniae infection, but not in patients with asthma without documented M. pneumoniae infection.9 As corticosteroids also have anti‐inflammatory properties, we expect that any anti‐inflammatory benefit of macrolide therapy would be mitigated by the concomitant administration of corticosteroids. The shorter LOS associated with empiric macrolide therapy in our study was comparable among corticosteroid recipients and non‐recipients.
Atypical bacterial pathogens, including M. pneumoniae, are associated with diffuse lower airway inflammation6, 48 and airway hyperresponsiveness,6 and have been implicated as a cause of acute asthma exacerbations.7, 4954 Among patients with previously diagnosed asthma, acute M. pneumoniae infection was identified in up to 20% of those having acute exacerbations.7, 54 Macrolide therapy has a beneficial effect on lung function and airway hyperresponsiveness in adults with asthma.9, 55 Among mice infected with M. pneumoniae, 3 days of macrolide therapy resulted in a significant reduction in airway hyperresponsiveness compared with placebo or dexamethasone; however, after 6 days of therapy, there was no significant difference in airway hyperresponsiveness between those receiving macrolides, dexamethasone, or placebo, suggesting that the benefit of macrolides on airway hyperresponsiveness may be brief. Our findings of a shorter LOS but no difference in readmissions at 28 days or longer, for macrolide recipients compared with non‐recipients, support the limited benefit of macrolide therapy beyond the initial reduction in bacterial load seen in the first few days of therapy.
M. pneumoniae infection has also been implicated as a cause of chronic pulmonary disease, including asthma.610 In the mouse model, peribronchial and perivascular mononuclear infiltrates, increased airway methacholine reactivity, and increased airway obstruction were observed 530 days after M. pneumoniae inoculation.6 M. pneumoniae has been identified in 26 (50%) of 51 children experiencing their first asthma attack,7 and 23 (42%) of 55 adults with chronic, stable asthma.9 Nevertheless, results of other studies addressing the issue are inconsistent, and the role of M. pneumoniae in the development of asthma remains unclear.56 In order to investigate the impact of macrolide therapy on the development of chronic pulmonary disease requiring hospitalization, we examined the readmission rates in the 15 months following index discharge. The proportion of children hospitalized with asthma following the hospitalization for M. pneumoniae pneumonia was higher for both macrolide recipients and non‐recipients compared with the 24‐months prior to infection. These results support a possible role for M. pneumoniae in chronic pulmonary disease. However, macrolide therapy was not associated with long‐term overall hospital readmission or long‐term asthma readmission, either in the entire cohort or in the subset of patients without prior asthma hospitalizations or medications.
This study had several limitations. First, because the identification of children with M. pneumoniae pneumonia relied on ICD‐9 discharge diagnosis codes, it is possible that there was misclassification of disease. We minimized the inclusion of children without M. pneumoniae by including only children who received antibiotic therapy on the first day of hospitalization and by excluding patients younger than 6 years of age, a group at relatively low‐risk for M. pneumoniae infection. Further, our algorithm for identification of M. pneumoniae pneumonia was validated through review of the medical records at 1 institution and was found to have a high positive predictive value. However, the positive predictive value of these ICD‐9 codes may vary across institutions. Additionally, the sensitivity of ICD‐9 codes for identifying children with M. pneumoniae pneumonia is not known. Also, not all children with pneumonia undergo testing for M. pneumoniae, and different tests have varying sensitivity and specificity.57, 58 Thus, some children with M. pneumoniae pneumonia were not diagnosed and so were not included in our study. It is not known how inclusion of these children would affect our results.
Second, the antibiotic information used in this study was limited to empiric antibiotic therapy. It is possible that some patients received macrolide therapy before admission. It is also likely that identification of M. pneumoniae during the hospitalization prompted the addition or substitution of macrolide therapy for some patients. If this therapy was initiated beyond the first day of hospitalization, these children would be classified as macrolide non‐recipients. Since macrolide administration was associated with a shorter hospital LOS, such misclassification would bias our results towards finding no difference in LOS between macrolide recipients and non‐recipients. It is therefore possible that the benefit of macrolide therapy is even greater than found in our study.
Third, there may be unmeasured confounding or residual confounding by indication for adjunct corticosteroid therapy related to clinical presentation. We expect that corticosteroid recipients would be sicker than non‐recipients. We included variables associated with a greater severity of illness (such as intensive care unit admission) in the multivariable analysis. Additionally, the shorter LOS among macrolide recipients remained when the analysis was stratified by receipt or non‐receipt of systemic corticosteroid therapy.
Fourth, we were only able to record readmissions occurring at the same hospital as the index admission; any readmission presenting to a different hospital following their index admission did not appear in our records, and was therefore not counted. It is thus possible that the true number of readmissions is higher than that represented here. Finally, despite the large number of patients included in this study, the number of short‐term readmissions was relatively small. Thus, we may have been underpowered to detect small but significant differences in short‐term readmission rates.
In conclusion, macrolide therapy was associated with shorter hospital LOS, but not with short‐term or longer‐term readmission in children presenting with M. pneumoniae pneumonia.
Appendix
| Variable | Beta Coefficient | Confidence Interval | P Value |
|---|---|---|---|
| Demographics | |||
| Sex | 0.12 | (0.22, 0.02) | 0.022 |
| Race | |||
| Blackreference category | |||
| White | 0.01 | (0.21, 0.23) | 0.933 |
| Other | 0.13 | (0.39, 0.13) | 0.323 |
| Missing | 0.46 | (0.81, 0.11) | 0.012 |
| Presentation during viral respiratory season | 0.05 | (0.19, 0.09) | 0.462 |
| Prior asthma hospitalization | 0.36 | (0.64, 0.08) | 0.015 |
| Intensive care unit admission | 1.05 | (0.87, 1.23) | <0.001 |
| Labs and procedures performed | |||
| Additional radiologic imaging | 0.23 | (0.20, 0.67) | 0.287 |
| Arterial blood gas | 0.69 | (0.50, 0.87) | <0.001 |
| Complete blood count | 0.34 | (0.24, 0.45) | <0.001 |
| Blood culture | 0.17 | (0.98, 0.44) | 0.204 |
| Mechanical ventilation | 1.15 | (0.68, 1.63) | <0.001 |
| Therapies received | |||
| Empiric macrolide therapy | 0.49 | (0.72, 0.25) | <0.001 |
| Systemic steroids | 0.26 | (0.38, 0.14) | <0.001 |
| Chronic asthma medications | 0.20 | (0.38, 0.013) | 0.037 |
| Beta‐agonist therapy | 0.07 | (0.21, 0.08) | 0.357 |
| Vasoactive infusion | 1.08 | (0.727, 1.45) | <0.001 |
| Clindamycin or vancomycin | 0.55 | (0.34, 0.75) | <0.001 |
| Variable | Odds Ratio* | Confidence Interval | P Value |
|---|---|---|---|
| |||
| Demographics | |||
| Sex | 0.56 | (0.23, 1.33) | 0.190 |
| Race | |||
| Blackreference category | |||
| White | 0.46 | (0.19, 1.14) | 0.093 |
| Other | |||
| Missing | |||
| Presentation during viral respiratory season | 0.64 | (0.09, 4.75) | 0.662 |
| Prior asthma hospitalization | |||
| Intensive care unit admission | 4.54 | (1.21, 17.03) | 0.025 |
| Laboratory tests and procedures | |||
| Additional radiologic imaging | 10.00 | (2.25, 44.47) | 0.002 |
| Arterial blood gas | |||
| Complete blood count | 0.92 | (0.24, 3.48) | 0.901 |
| Blood culture | 0.85 | (0.30, 2.36) | 0.738 |
| Mechanical ventilation | |||
| Medications | |||
| Macrolide therapy | 1.18 | (0.25, 5.45) | 0.837 |
| Systemic corticosteroids | 1.04 | (0.276, 4.09) | 0.951 |
| Chronic asthma medication | 1.66 | (0.71, 3.88) | 0.242 |
| Beta‐agonist therapy | 0.66 | (0.16, 2.65) | 0.557 |
| Vasoactive infusions | |||
| Clindamycin or vancomycin | 1.00 | (0.10, 9.90) | 0.998 |
| Variable | Coefficient | Confidence Interval | P Value | % Change | Confidence Interval for % Change |
|---|---|---|---|---|---|
| Demographics | |||||
| Age | 0.287 | (0.012, 0.045) | 0.001 | 2.9 | (1.2, 4.6) |
| Prior asthma hospitalization | 0.272 | (0.094, 0.45) | 0.004 | 31.3 | (9.9, 56.8) |
| Intensive care unit admission | 1.015 | (0.802, 1.23) | <0.001 | 175.9 | (123.0, 241.3) |
| Therapies received | |||||
| Macrolide therapy | 0.379 | (0.59, 0.166) | 0.001 | 31.6 | (44.6, 15.3) |
| Systemic corticosteroids | 0.264 | (0.391, 0.138) | <0.001 | 23.2 | (32.3, 12.9) |
| Chronic asthma medications | 0.056 | (0.255, 0.142) | 0.568 | 5.5 | (22.5, 15.2) |
| Albuterol | 0.07 | (0.059, 0.199) | 0.281 | 7.2 | (5.8, 22.0) |
| Clindamycin or vancomycin | 0.311 | (0.063, 0.559) | 0.015 | 36.5 | (6.5, 74.9) |
| Variable | Adjusted Odds Ratio | Confidence Interval | P Value |
|---|---|---|---|
| Demographics | |||
| Age | 0.91 | 0.72, 1.15 | 0.423 |
| Prior asthma hospitalization | 1.94 | 0.42, 8.90 | 0.394 |
| Intensive care unit admission | 5.73 | 2.03, 16.20 | 0.001 |
| Therapies received | |||
| Macrolide therapy | 1.12 | 0.22, 5.78 | 0.890 |
| Systemic corticosteroids | 0.696 | 0.10, 4.70 | 0.710 |
| Chronic asthma medications | 1.98 | 0.32, 12.20 | 0.460 |
| Albuterol | 0.519 | 0.081, 3.31 | 0.488 |
| Clindamycin or vancomycin | 0.904 | 0.07, 11.13 | 0.937 |
- ,,, et al.Prospective surveillance for atypical pathogens in children with community‐acquired pneumonia in Japan.J Infect Chemother.2006;12:36–41.
- ,,.Incidence of community‐acquired pneumonia in children caused by Mycoplasma pneumoniae: serological results of a prospective, population‐based study in primary health care.Respirology.2004;9:109–114.
- ,,.Mycoplasma pneumoniae infections in University of Wisconsin students.Am Rev Respir Dis.1967;96:237–244.
- .Infections caused by Mycoplasma pneumoniae and possible carrier state in different populations of patients.Clin Infect Dis.1993;17(suppl 1):S37–S46.
- .Mycoplasma pneumoniae. In: Long SS, Pickering LK, Prober CG, eds.Principles and Practice of Pediatric Infectious Diseases.3rd ed.Philadelphia, PA:Churchill Livingstone;2008:979–985.
- ,,, et al.Mycoplasma pneumoniae induces chronic respiratory infection, airway hyperreactivity, and pulmonary inflammation: a murine model of infection‐associated chronic reactive airway disease.Infect Immun.2002;70:649–654.
- ,,, et al.Mycoplasma pneumoniae and asthma in children.Clin Infect Dis.2004;38:1341–1346.
- ,,,.Isolation of Mycoplasma pneumoniae from asthmatic patients.Ann Allergy.1993;70:23–25.
- ,,,.Mycoplasma pneumoniae and Chlamydia pneumoniae in asthma: effect of clarithromycin.Chest.2002;121:1782–1788.
- ,,,,.A link between chronic asthma and chronic infection.J Allergy Clin Immunol.2001;107:595–601.
- ,,.Antibiotics for community‐acquired lower respiratory tract infections secondary to Mycoplasma pneumoniae in children.Cochrane Database Syst Rev.2010;7:CD004875.
- ,,,.In vitro susceptibilities of mycoplasmas and ureaplasmas to new macrolides and aryl‐fluoroquinolones.Antimicrob Agents Chemother.1988;32:1500–1502.
- ,,.Inhibitory and bactericidal activities of gemifloxacin and other antimicrobials against Mycoplasma pneumoniae.Int J Antimicrob Agents.2003;21:574–577.
- ,,,,.The in vitro activity of some 14‐, 15‐ and 16‐ membered macrolides against Staphylococcus spp., Legionella spp., Mycoplasma spp. and Ureaplasma urealyticum.Drugs Exp Clin Res.1991;17:91–99.
- ,,, et al.In vitro and in vivo activities of macrolides against Mycoplasma pneumoniae.Antimicrob Agents Chemother.1994;38:790–798.
- ,.Comparative in vitro activity of azithromycin, clarithromycin, erythromycin and lomefloxacin against Mycoplasma pneumoniae, Mycoplasma hominis and Ureaplasma urealyticum.Eur J Clin Microbiol Infect Dis.1990;9:838–841.
- ,,, et al.Characteristics of macrolide‐resistant Mycoplasma pneumoniae strains isolated from patients and induced with erythromycin in vitro.Microbiol Immunol.2001;45:617–620.
- ,,, et al.Characterization and molecular analysis of macrolide‐resistant Mycoplasma pneumoniae clinical isolates obtained in Japan.Antimicrob Agents Chemother.2004;48:4624–4630.
- ,,,.Role of Mycoplasma pneumoniae and Chlamydia pneumoniae in children with community‐acquired lower respiratory tract infections.Clin Infect Dis.2001;32:1281–1289.
- ,,, et al.Characteristics of Streptococcus pneumoniae and atypical bacterial infections in children 2–5 years of age with community‐acquired pneumonia.Clin Infect Dis.2002;35:1345–1352.
- ,,,,.Macrolide use shortens fever duration in Mycoplasma pneumoniae infection in children: a 2‐year experience.J Microbiol Immunol Infect.2008;41:307–310.
- ,,,,.Comparison of antibiotics in the treatment of mycoplasmal pneumonia.Arch Intern Med.1970;125:680–684.
- ,,, et al.Antimicrobial and immunologic activities of clarithromycin in a murine model of Mycoplasma pneumoniae‐induced pneumonia.Antimicrob Agents Chemother.2003;47:1614–1620.
- ,.Antibiotics in asthma.Curr Allergy Asthma Rep.2004;4:132–138.
- ,.Immunomodulatory activity and effectiveness of macrolides in chronic airway disease.Chest.2004;125:70S–78S.
- ,,, et al.Interleukin‐8 gene repression by clarithromycin is mediated by the activator protein‐1 binding site in human bronchial epithelial cells.Am J Respir Cell Mol Biol.2000;22:51–60.
- ,,, et al.Clarithromycin inhibits NF‐kappaB activation in human peripheral blood mononuclear cells and pulmonary epithelial cells.Antimicrob Agents Chemother.2001;45:44–47.
- ,,,,.Epidemiology of Mycoplasma pneumoniae infection in families.JAMA.1966;197:859–866.
- ,,.Shedding of Mycoplasma pneumoniae after tetracycline and erythromycin therapy.N Engl J Med.1967;276:1172–1175.
- ,,.Mycoplasma pneumoniae disease: clinical spectrum, pathophysiology, epidemiology, and control.J Infect Dis.1971;123:74–92.
- .Is there a role for antibiotics in the treatment of asthma? Involvement of atypical organisms.BioDrugs.2000;14:349–354.
- ,.Diffuse panbronchiolitis: role of macrolides in therapy.Am J Respir Med.2002;1:119–131.
- ,,,,,.Long‐term low‐dose administration of erythromycin to patients with diffuse panbronchiolitis.Respiration.1991;58:145–149.
- ,,,,,.[Long‐term therapeutic effects of erythromycin and newquinolone antibacterial agents on diffuse panbronchiolitis].Nihon Kyobu Shikkan Gakkai Zasshi.1990;28:1305–1313.
- ,,, et al.A comparative clinical study of macrolide‐sensitive and macrolide‐resistant Mycoplasma pneumoniae infections in pediatric patients.J Infect Chemother.2009;15:380–383.
- ,,,.Corticosteroids and mortality in children with bacterial meningitis.JAMA.2008;299:2048–2055.
- ,,,,.Intravenous immunoglobulin in children with streptococcal toxic shock syndrome.Clin Infect Dis.2009;49:1369–1376.
- ,,, et al.Etiology of childhood pneumonia: serologic results of a prospective, population‐based study.Pediatr Infect Dis J.1998;17:986–991.
- ,,,,,.Deaths attributed to pediatric complex chronic conditions: national trends and implications for supportive care services.Pediatrics.2001;107:E99.
- ,,,,,.Adjunct corticosteroids in children hospitalized with community‐acquired pneumonia.Pediatrics.2011;127:e255–e263.
- ,,, et al.Comparative effectiveness of pleural drainage procedures for the treatment of complicated pneumonia in childhood.J Hosp Med.2011;6:256–263.
- ,,, et al.Detection of Mycoplasma pneumoniae in the airways of adults with chronic asthma.Am J Respir Crit Care Med.1998;158:998–1001.
- ,.The impact of confounder selection criteria on effect estimation.Am J Epidemiol.1989;129:125–137.
- ,,.The risk of determining risk with multivariable models.Ann Intern Med.1993;118:201–210.
- ,,, et al.The impact of steroids given with macrolide therapy on experimental Mycoplasma pneumoniae respiratory infection.J Infect Dis.2008;198:1180–1188.
- ,,, et al.Clinical evaluation of macrolide‐resistant Mycoplasma pneumoniae.Antimicrob Agents Chemother.2006;50:709–712.
- ,,, et al.Eaton agent pneumonia.JAMA.1961;176:118–123.
- .The role of viral and atypical bacterial pathogens in asthma pathogenesis.Pediatr Pulmonol Suppl.1999;18:141–143.
- ,,.The association of viral and mycoplasma infections with recurrence of wheezing in the asthmatic child.Ann Allergy.1970;28:43–49.
- ,,,.Association of viral and mycoplasma infections with exacerbations of asthma.Ann Allergy.1974;33:145–149.
- ,,, et al.Acute Chlamydia pneumoniae and Mycoplasma pneumoniae infections in community‐acquired pneumonia and exacerbations of COPD or asthma: therapeutic considerations.J Chemother.2004;16:70–76.
- ,,, et al.Mycoplasma pneumoniae is a frequent cause of exacerbation of bronchial asthma in adults.Ann Allergy.1986;57:263–265.
- ,,, et al.Acute exacerbations of asthma in adults: role of Chlamydia pneumoniae infection.Eur Respir J.1994;7:2165–2168.
- ,,, et al.Atypical pathogen infection in adults with acute exacerbation of bronchial asthma.Am J Respir Crit Care Med.2003;167:406–410.
- ,,,,,.Erythromycin reduces the severity of bronchial hyperresponsiveness in asthma.Chest.1991;99:670–673.
- ,,,,.Atypical bacteria and macrolides in asthma.Allergy Asthma Clin Immunol.2008;4:111–116.
- ,,.Acute respiratory infection due to Mycoplasma pneumoniae: current status of diagnostic methods.Eur J Clin Microbiol Infect Dis.2010;29:1055–1069.
- ,,,,,.A multicenter pilot external quality assessment programme to assess the quality of molecular detection of Chlamydophila pneumoniae and Mycoplasma pneumoniae.J Microbiol Methods.2010;82:131–135.
Mycoplasma pneumoniae is a common cause of community‐acquired pneumonia (CAP), among school‐age children and adolescents.14 Though pneumonia caused by M. pneumoniae is typically self‐limited, severe illness may occur.5 M. pneumoniae has also been implicated in airway inflammation, which may lead to the onset and development of chronic pulmonary disease.610 Few studies have directly addressed appropriate treatment strategies for M. pneumoniae pneumonia,11 and, despite its high prevalence and potential for causing severe complications, treatment recommendations remain inconsistent.
The efficacy of macrolide therapy in particular for M. pneumoniae remains unclear. In vitro susceptibility studies have shown bacteriostatic activity of erythromycin, clarithromycin, and azithromycin against M. pneumoniae.1218 Additionally, several small retrospective studies have shown that among children with atypical CAP (including M. pneumoniae pneumonia), those treated with macrolides were less likely to have persistence or progression of signs and symptoms after 3 days of therapy.19, 20 Lu et al21 found a shorter duration of fever among macrolide recipients compared with non‐recipients. In adults, Shames et al22 found a shorter duration of fever and hospitalization among erythromycin recipients compared with controls. Other randomized controlled trials have also addressed the use of macrolides in treatment of M. pneumoniae, but the ability to draw meaningful conclusions is limited by small samples sizes and by lack of details about the number of patients with M. pneumoniae.11
In addition to their antimicrobial effect, macrolides also have anti‐inflammatory properties.2327 The importance of these anti‐inflammatory properties is supported by studies showing clinical cure in patients treated with macrolides despite persistence of M. pneumoniae organisms,2831 clinical improvement despite the administration of doses that provide tissue levels below the minimum inhibitory concentration of the organism,3234 and clinical cure in patients with macrolide‐resistant M. pneumoniae.18, 35
The objectives of the current study were to examine the impact of macrolide therapy on the length of stay (LOS) and short‐ and longer‐term readmissions, including longer‐term asthma‐related readmissions, in children hospitalized with M. pneumoniae pneumonia.
METHODS
Data Source
Data for this retrospective cohort study were obtained from the Pediatric Health Information System (PHIS), which contains administrative data from 38 freestanding children's hospitals. Data quality and reliability are assured through a joint effort by the Child Health Corporation of America (Shawnee Mission, KS) and PHIS‐participating hospitals as described previously.36, 37 Encrypted medical record numbers allow for tracking of individual patients across hospitalizations. This study was reviewed and approved by the Committees for the Protection of Human Subjects at The Children's Hospital of Philadelphia (Philadelphia, PA).
Patients
Children 6‐18 years of age with CAP were eligible if they were discharged from a participating hospital between January 1, 2006 and December 31, 2008. Subjects were included if they received antibiotic therapy on the first day of hospitalization and if they satisfied one of the following International Classification of Diseases, 9th revision (ICD‐9) discharge diagnosis code criteria: 1) Principal diagnosis of M. pneumoniae pneumonia (483.0); 2) Principal diagnosis of a pneumonia‐related symptom (eg, fever, cough) (780.6 or 786.00‐786.52 [except 786.1]) and a secondary diagnosis of M. pneumoniae pneumonia; or 3) Principal diagnosis of pneumonia (481‐483.8 [except 483.0], 485‐486) and a secondary diagnosis of Mycoplasma (041.81).
Children younger than 6 years of age were excluded due to the low prevalence of M. pneumoniae infection.2, 38 Patients with comorbid conditions predisposing to severe or recurrent pneumonia (eg, cystic fibrosis, malignancy) were excluded using a previously reported classification scheme.39 In addition, we excluded patient data from 2 hospitals due to incomplete reporting of discharge information; thus data from 36 hospitals were included in this study.
Validation of Discharge Diagnosis Codes for Mycoplasma pneumoniae
To assess for misclassification of the diagnosis of M. pneumoniae, we reviewed records of a randomly selected subset of subjects from The Children's Hospital of Philadelphia; 14 of 15 patients had signs of lower respiratory tract infection in conjunction with a positive M. pneumoniae polymerase chain reaction test from nasopharyngeal washings to confirm the diagnosis of M. pneumoniae pneumonia. Hence, the positive predictive value of our algorithm for diagnosing M. pneumoniae pneumonia was 93.3%.
Study Definitions
We identified children with asthma in 2 ways. Asthma‐related hospitalizations were identified by an ICD‐9 code for asthma (493.0‐493.92) in any discharge diagnosis field during any hospitalization in the 24 months prior to the current hospitalization. Baseline controller medications were identified by receipt of inhaled corticosteroids (eg, fluticasone) or leukotriene receptor antagonists on the first day of hospitalization.
Systemic corticosteroids (either oral or intravenous) included dexamethasone, hydrocortisone, methylprednisolone, prednisolone, and prednisone. Measures of disease severity included admission to the intensive care unit within 48 hours of hospitalization, and administration of vancomycin or clindamycin, vasoactive infusions (epinephrine, norepinephrine, dopamine, and dobutamine), and invasive (endotracheal intubation) and noninvasive (continuous positive airway pressure) mechanical ventilation within 24 hours of hospitalization, as previously described.40, 41 Viral respiratory season was defined as October through March.
Measured Outcomes
The primary outcomes of interest were hospital LOS and all‐cause readmission within 28 days and 15 months after index discharge. We examined readmissions for asthma 15 months after index discharge as a secondary outcome measure because of the potential role for M. pneumoniae infection in long‐term lung dysfunction, including asthma.42 The 15‐month time frame was selected based on longitudinal data available in PHIS for the entire study cohort.
Measured Exposures
The main exposure was early initiation of macrolide therapy, defined as receipt of erythromycin, clarithromycin, or azithromycin on the first day of hospitalization.
Data Analysis
Continuous variables were described using median and interquartile range (IQR) or range values, and compared using the Wilcoxon rank‐sum test. Categorical variables were described using counts and frequencies, and compared using the chi‐square test. Multivariable linear (for LOS) and logistic (for readmission) regression analyses were performed to assess the independent association of macrolide therapy with the primary outcomes. Because the LOS data had a skewed distribution, our analyses were performed using logarithmically transformed LOS values as the dependent variable. The resulting beta‐coefficients were transformed to reflect the percent difference in LOS between subjects receiving and not receiving macrolide therapy.
Building of the multivariable models began with the inclusion of macrolide therapy. Variables associated with primary outcomes on univariate analysis (P < 0.20) were also considered for inclusion as potential confounders.43 These variables were included in the final multivariable model if they remained significant after adjusting for other factors, or if their inclusion in the model resulted in a 15% or greater change in the effect size of the primary association of interest (ie, macrolide therapy).44 Because corticosteroids also have anti‐inflammatory properties, we assessed for interactions with macrolide therapy. There was no interaction between macrolide and systemic corticosteroid therapy (P = 0.26, Likelihood ratio test), therefore our primary model adjusted for systemic corticosteroids.
Despite adjusting for systemic corticosteroid therapy in our primary analysis, residual confounding by indication for corticosteroid therapy might exist. We therefore repeated the analysis after stratifying by receipt or non‐receipt of systemic corticosteroid therapy. Because the benefit of macrolides in preventing long‐term dysfunction may be limited to those without a prior diagnosis of asthma, we repeated the analysis of readmissions within 15 months of index discharge (any readmission and asthma‐related readmissions) while limiting the cohort to those without evidence of asthma (ie, no prior asthma‐related hospitalizations and no chronic asthma medications). Because children with underlying conditions or circumstances that would predispose to prolonged hospitalizations may have been included, despite our restriction of the cohort to those without an identified chronic complex condition, we also repeated the analysis while limiting the cohort to those with a LOS 7 days. Finally, all analyses were clustered on hospital using the robust standard errors of Huber and White to account for the correlation of exposures and outcomes among children within centers.
Data were analyzed using Stata version 11 (Stata Corporation, College Station, TX). Statistical significance was determined a priori as a two‐tailed P value <0.05.
RESULTS
Patient Characteristics
During the study, 690 children ages 6 to 18 years met inclusion criteria. Characteristics of these patients are shown in Table 1. The median age was 10 years (IQR, 7‐13 years). Ten patients (1.4%) also had a concomitant discharge diagnosis of pneumococcal pneumonia, while 19 patients (2.7%) had a concomitant discharge diagnosis of viral pneumonia; 1 of these patients had discharge diagnoses of both viral and pneumococcal pneumonia.
| Empiric Macrolide Therapy | ||||
|---|---|---|---|---|
| Variable | All Subjects | Yes | No | P |
| ||||
| Demographics | ||||
| Male sex | 356 (51.6) | 200 (49.4) | 156 (54.7) | 0.166 |
| Race | ||||
| Black | 135 (19.6) | 81 (20.0) | 54 (19.0) | 0.506 |
| White | 484 (70.1) | 287 (70.9) | 197 (69.1) | |
| Other | 62 (9.0) | 31 (7.7) | 31 (10.9) | |
| Missing | 9 (1.3) | 6 (1.5) | 3 (1.1) | |
| Presentation during viral respiratory season | 420 (60.9) | 242 (59.8) | 178 (62.5) | |
| Prior asthma hospitalization | 41 (5.9) | 31 (7.7) | 10 (3.5) | 0.023 |
| Intensive care unit admission | 127 (18.4) | 74 (18.3) | 53 (18.6) | 0.914 |
| Laboratory tests and procedures | ||||
| Additional radiologic imaging* | 24 (3.5) | 13 (3.2) | 11 (3.9) | 0.646 |
| Arterial blood gas | 116 (17.3) | 72 (18.5) | 44 (15.6) | 0.316 |
| Complete blood count | 433 (64.4) | 249 (64.0) | 184 (65.0) | 0.788 |
| Blood culture | 280 (41.7) | 167 (42.9) | 113 (39.9) | 0.436 |
| Mechanical ventilation | 16 (2.3) | 5 (1.2) | 11 (3.86) | 0.024 |
| Medications | ||||
| Chronic asthma medication | 116 (16.8) | 72 (17.8) | 44 (15.4) | 0.419 |
| Beta‐agonist therapy | 328 (47.5) | 215 (53.1) | 113 (39.7) | 0.001 |
| Vasoactive infusions | 22 (3.2) | 13 (3.2) | 9 (3.2) | 0.969 |
| Systemic corticosteroids | 252 (36.5) | 191 (47.2) | 61 (21.4) | <0.001 |
| Clindamycin or vancomycin | 86 (12.5) | 24 (5.9) | 62 (21.8) | <0.001 |
Macrolide therapy was administered to 405 (58.7%) patients. Systemic corticosteroid therapy was administered to 252 (36.5%) patients. Overall, 191 (27.7%) of the 690 patients received both macrolides and systemic corticosteroids empirically, while 224 (32.5%) received neither; 61 (8.8%) received corticosteroids but not macrolides, while 214 (31.0%) received macrolides but not corticosteroids. Asthma hospitalization within the 24 months prior to admission was more common among those receiving macrolides (N = 60/405, 14.8%) than among those not receiving macrolides (N = 30/285, 10.5%) (P = 0.023). Macrolide recipients also more commonly received concomitant systemic corticosteroids (N = 191/405, 47.2%) than macrolide non‐recipients (N = 61/285, 21.4%) (P < 0.001) and more commonly received beta‐agonist therapy (N = 215/405, 53.1%) than macrolide non‐recipients (N = 113/285, 39.7%) (P = 0.001).
Length of Stay
The overall median LOS was 3 days (IQR, 2‐6 days); the median LOS was 3 days (IQR, 2‐5 days) for empiric macrolide recipients and 4 days (IQR, 2‐9 days) for non‐recipients (P < 0.001). Overall, 22.9% (N = 158) of children had an LOS 7 days and 8.8% (N = 61) of children had an LOS 14 days. The LOS was 7 days for 15.3% (N = 62) of macrolide recipients and 33.7% (N = 96) of non‐recipients. LOS was 7 days for 17.5% (N = 44) of systemic steroid recipients and 26% (N = 114) of non‐recipients. In unadjusted analysis, macrolide therapy (beta‐coefficient, 0.49; 95% confidence interval [CI]: 0.72 to 0.25; P < 0.001) and systemic corticosteroid administration (beta‐coefficient, 0.26; CI: 0.37 to 0.14; P < 0.001) were associated with shorter hospital LOS (Appendix 1).
In multivariable analysis, macrolide therapy remained associated with a shorter LOS (Table 2; Appendix 2). Systemic corticosteroid administration was associated with a 23% shorter LOS (adjusted beta‐coefficient, 0.26; 95% CI: 0.39 to 0.14; P < 0.001). In contrast, previous hospitalization for asthma was associated with a 31% longer LOS (adjusted beta‐coefficient, 0.27; 95% CI: 0.09‐0.045; P = 0.004). Receipt of beta‐agonist therapy or chronic asthma medications were not associated with significant differences in LOS. In analysis stratified by receipt or non‐receipt of concomitant systemic corticosteroid therapy, empiric macrolide therapy remained associated with a significantly shorter LOS in both systemic corticosteroid recipients and non‐recipient (Table 4). When the cohort was restricted to subjects with a LOS 7 days, macrolide therapy remained significantly associated with a shorter LOS (adjusted percent change, 20%; 95% CI: 32% to 5%; P = 0.015).
| Association of Empiric Macrolide Therapy With Outcomes* | |
|---|---|
| |
| Length of stay (days) | |
| Adjusted beta‐coefficient (95 % CI) | 0.38 (0.59 to 0.17) |
| Adjusted percent change (95% CI) | 32% (45% to 15%) |
| P value | 0.001 |
| Any readmission within 28 days | |
| Adjusted odds ratio (95% CI) | 1.12 (0.22 to 5.78) |
| P value | 0.890 |
| Any readmission within 15 mo | |
| Adjusted odds ratio (95% CI) | 1.00 (0.59 to 1.70) |
| P value | 0.991 |
| Asthma hospitalization within 15 mo | |
| Adjusted odds ratio (95% CI) | 1.09 (0.54 to 2.17) |
| P value | 0.820 |
Readmission
Overall, 8 children (1.2%) were readmitted for pneumonia‐associated conditions within 28 days of index discharge. Readmission occurred in 1.2% of macrolide recipients and 1.1% of non‐recipients (P = 0.83) (Table 4). In unadjusted analysis, neither macrolide therapy (odds ratio [OR], 1.18; 95% CI: 0.25‐5.45; P = 0.84) nor systemic corticosteroid administration (OR, 1.04; 95% CI: 0.27‐4.10; P = 0.95) was associated with 28‐day readmission (Appendix 3). In multivariable analysis, empiric macrolide therapy was not associated with 28‐day readmission in the overall cohort (Table 2; Appendix 4)), or when the analysis was stratified by receipt or non‐receipt of concomitant systemic corticosteroid therapy (Table 3).
| Concomitant Systemic Corticosteroid Therapy* | ||
|---|---|---|
| Yes | No | |
| ||
| Length of stay | ||
| Adjusted beta‐coefficient (95% CI) | 0.40 (0.74 to 0.07) | 0.37 (0.58 to 0.16) |
| Adjusted percent change (95% CI) | 33% (52% to 7%) | 31% (44% to 15%) |
| P value | 0.020 | 0.001 |
| Readmission within 28 days | ||
| Adjusted odds ratio (95% CI) | 1.09 (0.05 to 26.7) | 1.50 (0.21 to 10.8) |
| P value | 0.960 | 0.687 |
| Readmission within 15 mo | ||
| Adjusted odds ratio (95% CI) | 1.57 (0.65 to 3.82) | 0.81 (0.45 to 1.46) |
| P value | 0.32 | 0.49 |
| Asthma hospitalization within 15 mo | ||
| Adjusted odds ratio (95% CI) | 1.51 (0.58 to 3.93) | 0.85 (0.36 to 1.97) |
| P value | 0.395 | 0.700 |
| Empiric Macrolide Therapy | ||
|---|---|---|
| N/Total (%) | ||
| Readmission | Yes | No |
| Any readmission within 28 days | ||
| Overall | 5/405 (1.2) | 3/285 (1.1) |
| Systemic corticosteroid therapy | 2/186 (1.1) | 1/66 (1.5) |
| No systemic corticosteroid therapy | 3/177 (1.7) | 2/261 (0.8) |
| Any readmission within 15 mo | ||
| Overall | 96/405 (23.7) | 64/285 (22.5) |
| Systemic corticosteroid therapy | 52/186 (28.0) | 17/66 (25.8) |
| No systemic corticosteroid therapy | 32/177 (18.1) | 59/261 (22.6) |
| Asthma hospitalization within 15 mo | ||
| Overall | 61/405 (15.1) | 34/285 (11.9) |
| Systemic corticosteroid therapy | 39/186 (21.0) | 13/66 (19.7) |
| No systemic corticosteroid therapy | 14/177 (7.9) | 29/261 (11.1) |
Overall, 160 children (23.2%) were readmitted within 15 months of index discharge; 95 were readmitted for asthma during this time (Table 3). Overall readmission occurred in 23.7% of macrolide recipients and 22.5% of macrolide non‐recipients (P = 0.702). Asthma readmission occurred in 15.1% of macrolide recipients and 11.9% of macrolide non‐recipients (P = 0.240). In unadjusted analysis, empiric macrolide therapy was not significantly associated with any readmission within 15 months (OR, 1.07; 95% CI: 0.69‐1.68; P = 0.759) or with asthma‐related readmission within 15 months (OR, 1.31; 95% CI: 0.73‐ 2.36; P = 0.369). In multivariable analysis, neither any readmission nor asthma readmission within 15 months was associated with empiric macrolide therapy overall (Table 2) or when stratified by receipt or non‐receipt of concomitant systemic corticosteroid therapy (Table 3).
The analyses for readmissions within 15 months of index discharge were repeated while limiting the cohort to those without prior asthma hospitalizations or chronic asthma medications. In this subset of patients, readmissions for any reason occurred in 55 (18.6%) of 295 macrolide recipients and 50 (22.0%) of 227 non‐recipients. The difference was not statistically significant in multivariable analysis (adjusted odds ratio, 0.79; 95% CI: 0.41‐1.51; P = 0.47). Readmissions for asthma occurred in 30 (10.2%) of 295 macrolide recipients and 26 (11.5%) of 227 non‐recipients; this difference was also not significant in multivariable analysis (adjusted odds ratio, 0.83; 95% CI: 0.36‐1.93; P = 0.83). The magnitude of the estimate of effect for 28‐day and 15‐month readmissions, and 15‐month asthma hospitalizations, was similar to the primary analysis when the cohort was restricted to subjects with a LOS 7 days.
DISCUSSION
This multicenter study examined the role of macrolide therapy in children hospitalized with M. pneumoniae pneumonia. Empiric macrolide therapy was associated with an approximately 30% shorter hospital LOS and, in stratified analysis, remained associated with a significantly shorter hospital LOS in both systemic corticosteroid recipients and non‐recipients. Empiric macrolide therapy was not associated with short‐ or longer‐term hospital readmission.
Previous small randomized trials have been inconclusive regarding the potential benefit of macrolide therapy in M. pneumoniae pneumonia.11 Our study, which demonstrated a shorter LOS among macrolides recipients compared with non‐recipients, has several advantages over prior studies including a substantively larger sample size and multicenter design. Animal models support our observations regarding the potential beneficial antimicrobial role of macrolides. M. pneumoniae concentrations in bronchoalveolar lavage specimens were significantly lower among experimentally infected mice treated with clarithromycin, a macolide‐class antibiotic, compared with either placebo or dexamethasone.45 Combination therapy with clarithromycin and dexamethasone reduced histopathologic inflammation to a greater degree than dexamethasone alone.45
While the relative importance of the antimicrobial and anti‐inflammatory properties of macrolides is not known, observational studies of children infected with macrolide‐resistant M. pneumoniae suggest that the antimicrobial properties of macrolides may provide disproportionate clinical benefit. The duration of fever in macrolide recipients with macrolide‐resistant M. pneumoniae (median duration, 9 days) reported by Suzuki et al46 was significantly longer than those with macrolide‐susceptible infections (median duration, 5 days), and similar to the duration of fever in patients with M. pneumoniae infection treated with placebo (median duration, 8 days) reported by Kingston et al.47 Additionally, macrolide therapy was associated with significant improvements in lung function in patients with asthma and concomitant M. pneumoniae infection, but not in patients with asthma without documented M. pneumoniae infection.9 As corticosteroids also have anti‐inflammatory properties, we expect that any anti‐inflammatory benefit of macrolide therapy would be mitigated by the concomitant administration of corticosteroids. The shorter LOS associated with empiric macrolide therapy in our study was comparable among corticosteroid recipients and non‐recipients.
Atypical bacterial pathogens, including M. pneumoniae, are associated with diffuse lower airway inflammation6, 48 and airway hyperresponsiveness,6 and have been implicated as a cause of acute asthma exacerbations.7, 4954 Among patients with previously diagnosed asthma, acute M. pneumoniae infection was identified in up to 20% of those having acute exacerbations.7, 54 Macrolide therapy has a beneficial effect on lung function and airway hyperresponsiveness in adults with asthma.9, 55 Among mice infected with M. pneumoniae, 3 days of macrolide therapy resulted in a significant reduction in airway hyperresponsiveness compared with placebo or dexamethasone; however, after 6 days of therapy, there was no significant difference in airway hyperresponsiveness between those receiving macrolides, dexamethasone, or placebo, suggesting that the benefit of macrolides on airway hyperresponsiveness may be brief. Our findings of a shorter LOS but no difference in readmissions at 28 days or longer, for macrolide recipients compared with non‐recipients, support the limited benefit of macrolide therapy beyond the initial reduction in bacterial load seen in the first few days of therapy.
M. pneumoniae infection has also been implicated as a cause of chronic pulmonary disease, including asthma.610 In the mouse model, peribronchial and perivascular mononuclear infiltrates, increased airway methacholine reactivity, and increased airway obstruction were observed 530 days after M. pneumoniae inoculation.6 M. pneumoniae has been identified in 26 (50%) of 51 children experiencing their first asthma attack,7 and 23 (42%) of 55 adults with chronic, stable asthma.9 Nevertheless, results of other studies addressing the issue are inconsistent, and the role of M. pneumoniae in the development of asthma remains unclear.56 In order to investigate the impact of macrolide therapy on the development of chronic pulmonary disease requiring hospitalization, we examined the readmission rates in the 15 months following index discharge. The proportion of children hospitalized with asthma following the hospitalization for M. pneumoniae pneumonia was higher for both macrolide recipients and non‐recipients compared with the 24‐months prior to infection. These results support a possible role for M. pneumoniae in chronic pulmonary disease. However, macrolide therapy was not associated with long‐term overall hospital readmission or long‐term asthma readmission, either in the entire cohort or in the subset of patients without prior asthma hospitalizations or medications.
This study had several limitations. First, because the identification of children with M. pneumoniae pneumonia relied on ICD‐9 discharge diagnosis codes, it is possible that there was misclassification of disease. We minimized the inclusion of children without M. pneumoniae by including only children who received antibiotic therapy on the first day of hospitalization and by excluding patients younger than 6 years of age, a group at relatively low‐risk for M. pneumoniae infection. Further, our algorithm for identification of M. pneumoniae pneumonia was validated through review of the medical records at 1 institution and was found to have a high positive predictive value. However, the positive predictive value of these ICD‐9 codes may vary across institutions. Additionally, the sensitivity of ICD‐9 codes for identifying children with M. pneumoniae pneumonia is not known. Also, not all children with pneumonia undergo testing for M. pneumoniae, and different tests have varying sensitivity and specificity.57, 58 Thus, some children with M. pneumoniae pneumonia were not diagnosed and so were not included in our study. It is not known how inclusion of these children would affect our results.
Second, the antibiotic information used in this study was limited to empiric antibiotic therapy. It is possible that some patients received macrolide therapy before admission. It is also likely that identification of M. pneumoniae during the hospitalization prompted the addition or substitution of macrolide therapy for some patients. If this therapy was initiated beyond the first day of hospitalization, these children would be classified as macrolide non‐recipients. Since macrolide administration was associated with a shorter hospital LOS, such misclassification would bias our results towards finding no difference in LOS between macrolide recipients and non‐recipients. It is therefore possible that the benefit of macrolide therapy is even greater than found in our study.
Third, there may be unmeasured confounding or residual confounding by indication for adjunct corticosteroid therapy related to clinical presentation. We expect that corticosteroid recipients would be sicker than non‐recipients. We included variables associated with a greater severity of illness (such as intensive care unit admission) in the multivariable analysis. Additionally, the shorter LOS among macrolide recipients remained when the analysis was stratified by receipt or non‐receipt of systemic corticosteroid therapy.
Fourth, we were only able to record readmissions occurring at the same hospital as the index admission; any readmission presenting to a different hospital following their index admission did not appear in our records, and was therefore not counted. It is thus possible that the true number of readmissions is higher than that represented here. Finally, despite the large number of patients included in this study, the number of short‐term readmissions was relatively small. Thus, we may have been underpowered to detect small but significant differences in short‐term readmission rates.
In conclusion, macrolide therapy was associated with shorter hospital LOS, but not with short‐term or longer‐term readmission in children presenting with M. pneumoniae pneumonia.
Appendix
| Variable | Beta Coefficient | Confidence Interval | P Value |
|---|---|---|---|
| Demographics | |||
| Sex | 0.12 | (0.22, 0.02) | 0.022 |
| Race | |||
| Blackreference category | |||
| White | 0.01 | (0.21, 0.23) | 0.933 |
| Other | 0.13 | (0.39, 0.13) | 0.323 |
| Missing | 0.46 | (0.81, 0.11) | 0.012 |
| Presentation during viral respiratory season | 0.05 | (0.19, 0.09) | 0.462 |
| Prior asthma hospitalization | 0.36 | (0.64, 0.08) | 0.015 |
| Intensive care unit admission | 1.05 | (0.87, 1.23) | <0.001 |
| Labs and procedures performed | |||
| Additional radiologic imaging | 0.23 | (0.20, 0.67) | 0.287 |
| Arterial blood gas | 0.69 | (0.50, 0.87) | <0.001 |
| Complete blood count | 0.34 | (0.24, 0.45) | <0.001 |
| Blood culture | 0.17 | (0.98, 0.44) | 0.204 |
| Mechanical ventilation | 1.15 | (0.68, 1.63) | <0.001 |
| Therapies received | |||
| Empiric macrolide therapy | 0.49 | (0.72, 0.25) | <0.001 |
| Systemic steroids | 0.26 | (0.38, 0.14) | <0.001 |
| Chronic asthma medications | 0.20 | (0.38, 0.013) | 0.037 |
| Beta‐agonist therapy | 0.07 | (0.21, 0.08) | 0.357 |
| Vasoactive infusion | 1.08 | (0.727, 1.45) | <0.001 |
| Clindamycin or vancomycin | 0.55 | (0.34, 0.75) | <0.001 |
| Variable | Odds Ratio* | Confidence Interval | P Value |
|---|---|---|---|
| |||
| Demographics | |||
| Sex | 0.56 | (0.23, 1.33) | 0.190 |
| Race | |||
| Blackreference category | |||
| White | 0.46 | (0.19, 1.14) | 0.093 |
| Other | |||
| Missing | |||
| Presentation during viral respiratory season | 0.64 | (0.09, 4.75) | 0.662 |
| Prior asthma hospitalization | |||
| Intensive care unit admission | 4.54 | (1.21, 17.03) | 0.025 |
| Laboratory tests and procedures | |||
| Additional radiologic imaging | 10.00 | (2.25, 44.47) | 0.002 |
| Arterial blood gas | |||
| Complete blood count | 0.92 | (0.24, 3.48) | 0.901 |
| Blood culture | 0.85 | (0.30, 2.36) | 0.738 |
| Mechanical ventilation | |||
| Medications | |||
| Macrolide therapy | 1.18 | (0.25, 5.45) | 0.837 |
| Systemic corticosteroids | 1.04 | (0.276, 4.09) | 0.951 |
| Chronic asthma medication | 1.66 | (0.71, 3.88) | 0.242 |
| Beta‐agonist therapy | 0.66 | (0.16, 2.65) | 0.557 |
| Vasoactive infusions | |||
| Clindamycin or vancomycin | 1.00 | (0.10, 9.90) | 0.998 |
| Variable | Coefficient | Confidence Interval | P Value | % Change | Confidence Interval for % Change |
|---|---|---|---|---|---|
| Demographics | |||||
| Age | 0.287 | (0.012, 0.045) | 0.001 | 2.9 | (1.2, 4.6) |
| Prior asthma hospitalization | 0.272 | (0.094, 0.45) | 0.004 | 31.3 | (9.9, 56.8) |
| Intensive care unit admission | 1.015 | (0.802, 1.23) | <0.001 | 175.9 | (123.0, 241.3) |
| Therapies received | |||||
| Macrolide therapy | 0.379 | (0.59, 0.166) | 0.001 | 31.6 | (44.6, 15.3) |
| Systemic corticosteroids | 0.264 | (0.391, 0.138) | <0.001 | 23.2 | (32.3, 12.9) |
| Chronic asthma medications | 0.056 | (0.255, 0.142) | 0.568 | 5.5 | (22.5, 15.2) |
| Albuterol | 0.07 | (0.059, 0.199) | 0.281 | 7.2 | (5.8, 22.0) |
| Clindamycin or vancomycin | 0.311 | (0.063, 0.559) | 0.015 | 36.5 | (6.5, 74.9) |
| Variable | Adjusted Odds Ratio | Confidence Interval | P Value |
|---|---|---|---|
| Demographics | |||
| Age | 0.91 | 0.72, 1.15 | 0.423 |
| Prior asthma hospitalization | 1.94 | 0.42, 8.90 | 0.394 |
| Intensive care unit admission | 5.73 | 2.03, 16.20 | 0.001 |
| Therapies received | |||
| Macrolide therapy | 1.12 | 0.22, 5.78 | 0.890 |
| Systemic corticosteroids | 0.696 | 0.10, 4.70 | 0.710 |
| Chronic asthma medications | 1.98 | 0.32, 12.20 | 0.460 |
| Albuterol | 0.519 | 0.081, 3.31 | 0.488 |
| Clindamycin or vancomycin | 0.904 | 0.07, 11.13 | 0.937 |
- ,,, et al.Prospective surveillance for atypical pathogens in children with community‐acquired pneumonia in Japan.J Infect Chemother.2006;12:36–41.
- ,,.Incidence of community‐acquired pneumonia in children caused by Mycoplasma pneumoniae: serological results of a prospective, population‐based study in primary health care.Respirology.2004;9:109–114.
- ,,.Mycoplasma pneumoniae infections in University of Wisconsin students.Am Rev Respir Dis.1967;96:237–244.
- .Infections caused by Mycoplasma pneumoniae and possible carrier state in different populations of patients.Clin Infect Dis.1993;17(suppl 1):S37–S46.
- .Mycoplasma pneumoniae. In: Long SS, Pickering LK, Prober CG, eds.Principles and Practice of Pediatric Infectious Diseases.3rd ed.Philadelphia, PA:Churchill Livingstone;2008:979–985.
- ,,, et al.Mycoplasma pneumoniae induces chronic respiratory infection, airway hyperreactivity, and pulmonary inflammation: a murine model of infection‐associated chronic reactive airway disease.Infect Immun.2002;70:649–654.
- ,,, et al.Mycoplasma pneumoniae and asthma in children.Clin Infect Dis.2004;38:1341–1346.
- ,,,.Isolation of Mycoplasma pneumoniae from asthmatic patients.Ann Allergy.1993;70:23–25.
- ,,,.Mycoplasma pneumoniae and Chlamydia pneumoniae in asthma: effect of clarithromycin.Chest.2002;121:1782–1788.
- ,,,,.A link between chronic asthma and chronic infection.J Allergy Clin Immunol.2001;107:595–601.
- ,,.Antibiotics for community‐acquired lower respiratory tract infections secondary to Mycoplasma pneumoniae in children.Cochrane Database Syst Rev.2010;7:CD004875.
- ,,,.In vitro susceptibilities of mycoplasmas and ureaplasmas to new macrolides and aryl‐fluoroquinolones.Antimicrob Agents Chemother.1988;32:1500–1502.
- ,,.Inhibitory and bactericidal activities of gemifloxacin and other antimicrobials against Mycoplasma pneumoniae.Int J Antimicrob Agents.2003;21:574–577.
- ,,,,.The in vitro activity of some 14‐, 15‐ and 16‐ membered macrolides against Staphylococcus spp., Legionella spp., Mycoplasma spp. and Ureaplasma urealyticum.Drugs Exp Clin Res.1991;17:91–99.
- ,,, et al.In vitro and in vivo activities of macrolides against Mycoplasma pneumoniae.Antimicrob Agents Chemother.1994;38:790–798.
- ,.Comparative in vitro activity of azithromycin, clarithromycin, erythromycin and lomefloxacin against Mycoplasma pneumoniae, Mycoplasma hominis and Ureaplasma urealyticum.Eur J Clin Microbiol Infect Dis.1990;9:838–841.
- ,,, et al.Characteristics of macrolide‐resistant Mycoplasma pneumoniae strains isolated from patients and induced with erythromycin in vitro.Microbiol Immunol.2001;45:617–620.
- ,,, et al.Characterization and molecular analysis of macrolide‐resistant Mycoplasma pneumoniae clinical isolates obtained in Japan.Antimicrob Agents Chemother.2004;48:4624–4630.
- ,,,.Role of Mycoplasma pneumoniae and Chlamydia pneumoniae in children with community‐acquired lower respiratory tract infections.Clin Infect Dis.2001;32:1281–1289.
- ,,, et al.Characteristics of Streptococcus pneumoniae and atypical bacterial infections in children 2–5 years of age with community‐acquired pneumonia.Clin Infect Dis.2002;35:1345–1352.
- ,,,,.Macrolide use shortens fever duration in Mycoplasma pneumoniae infection in children: a 2‐year experience.J Microbiol Immunol Infect.2008;41:307–310.
- ,,,,.Comparison of antibiotics in the treatment of mycoplasmal pneumonia.Arch Intern Med.1970;125:680–684.
- ,,, et al.Antimicrobial and immunologic activities of clarithromycin in a murine model of Mycoplasma pneumoniae‐induced pneumonia.Antimicrob Agents Chemother.2003;47:1614–1620.
- ,.Antibiotics in asthma.Curr Allergy Asthma Rep.2004;4:132–138.
- ,.Immunomodulatory activity and effectiveness of macrolides in chronic airway disease.Chest.2004;125:70S–78S.
- ,,, et al.Interleukin‐8 gene repression by clarithromycin is mediated by the activator protein‐1 binding site in human bronchial epithelial cells.Am J Respir Cell Mol Biol.2000;22:51–60.
- ,,, et al.Clarithromycin inhibits NF‐kappaB activation in human peripheral blood mononuclear cells and pulmonary epithelial cells.Antimicrob Agents Chemother.2001;45:44–47.
- ,,,,.Epidemiology of Mycoplasma pneumoniae infection in families.JAMA.1966;197:859–866.
- ,,.Shedding of Mycoplasma pneumoniae after tetracycline and erythromycin therapy.N Engl J Med.1967;276:1172–1175.
- ,,.Mycoplasma pneumoniae disease: clinical spectrum, pathophysiology, epidemiology, and control.J Infect Dis.1971;123:74–92.
- .Is there a role for antibiotics in the treatment of asthma? Involvement of atypical organisms.BioDrugs.2000;14:349–354.
- ,.Diffuse panbronchiolitis: role of macrolides in therapy.Am J Respir Med.2002;1:119–131.
- ,,,,,.Long‐term low‐dose administration of erythromycin to patients with diffuse panbronchiolitis.Respiration.1991;58:145–149.
- ,,,,,.[Long‐term therapeutic effects of erythromycin and newquinolone antibacterial agents on diffuse panbronchiolitis].Nihon Kyobu Shikkan Gakkai Zasshi.1990;28:1305–1313.
- ,,, et al.A comparative clinical study of macrolide‐sensitive and macrolide‐resistant Mycoplasma pneumoniae infections in pediatric patients.J Infect Chemother.2009;15:380–383.
- ,,,.Corticosteroids and mortality in children with bacterial meningitis.JAMA.2008;299:2048–2055.
- ,,,,.Intravenous immunoglobulin in children with streptococcal toxic shock syndrome.Clin Infect Dis.2009;49:1369–1376.
- ,,, et al.Etiology of childhood pneumonia: serologic results of a prospective, population‐based study.Pediatr Infect Dis J.1998;17:986–991.
- ,,,,,.Deaths attributed to pediatric complex chronic conditions: national trends and implications for supportive care services.Pediatrics.2001;107:E99.
- ,,,,,.Adjunct corticosteroids in children hospitalized with community‐acquired pneumonia.Pediatrics.2011;127:e255–e263.
- ,,, et al.Comparative effectiveness of pleural drainage procedures for the treatment of complicated pneumonia in childhood.J Hosp Med.2011;6:256–263.
- ,,, et al.Detection of Mycoplasma pneumoniae in the airways of adults with chronic asthma.Am J Respir Crit Care Med.1998;158:998–1001.
- ,.The impact of confounder selection criteria on effect estimation.Am J Epidemiol.1989;129:125–137.
- ,,.The risk of determining risk with multivariable models.Ann Intern Med.1993;118:201–210.
- ,,, et al.The impact of steroids given with macrolide therapy on experimental Mycoplasma pneumoniae respiratory infection.J Infect Dis.2008;198:1180–1188.
- ,,, et al.Clinical evaluation of macrolide‐resistant Mycoplasma pneumoniae.Antimicrob Agents Chemother.2006;50:709–712.
- ,,, et al.Eaton agent pneumonia.JAMA.1961;176:118–123.
- .The role of viral and atypical bacterial pathogens in asthma pathogenesis.Pediatr Pulmonol Suppl.1999;18:141–143.
- ,,.The association of viral and mycoplasma infections with recurrence of wheezing in the asthmatic child.Ann Allergy.1970;28:43–49.
- ,,,.Association of viral and mycoplasma infections with exacerbations of asthma.Ann Allergy.1974;33:145–149.
- ,,, et al.Acute Chlamydia pneumoniae and Mycoplasma pneumoniae infections in community‐acquired pneumonia and exacerbations of COPD or asthma: therapeutic considerations.J Chemother.2004;16:70–76.
- ,,, et al.Mycoplasma pneumoniae is a frequent cause of exacerbation of bronchial asthma in adults.Ann Allergy.1986;57:263–265.
- ,,, et al.Acute exacerbations of asthma in adults: role of Chlamydia pneumoniae infection.Eur Respir J.1994;7:2165–2168.
- ,,, et al.Atypical pathogen infection in adults with acute exacerbation of bronchial asthma.Am J Respir Crit Care Med.2003;167:406–410.
- ,,,,,.Erythromycin reduces the severity of bronchial hyperresponsiveness in asthma.Chest.1991;99:670–673.
- ,,,,.Atypical bacteria and macrolides in asthma.Allergy Asthma Clin Immunol.2008;4:111–116.
- ,,.Acute respiratory infection due to Mycoplasma pneumoniae: current status of diagnostic methods.Eur J Clin Microbiol Infect Dis.2010;29:1055–1069.
- ,,,,,.A multicenter pilot external quality assessment programme to assess the quality of molecular detection of Chlamydophila pneumoniae and Mycoplasma pneumoniae.J Microbiol Methods.2010;82:131–135.
Copyright © 2012 Society of Hospital Medicine
Diagnosis of Complicated Pneumonia
Community‐acquired pneumonia (CAP), the most common serious bacterial infection in childhood, may be complicated by parapneumonic effusion (ie, complicated pneumonia).1, 2 The clinical outcome of children with complicated pneumonia is directly influenced by the causative organism, and precise identification of the infectious agent has the potential to improve clinical management.35 The incidence of complicated pneumonia has recently increased, highlighting the need to better understand the reasons for this changing epidemiology.68 However, using conventional bacterial culture, bacteria are isolated from clinical samples obtained from children with complicated pneumonia in only 17%42% of cases.1, 9, 10 The low rate of positive culture results may be related to stringent bacterial growth requirements or to administration of broad‐spectrum antibiotics before obtaining blood or pleural fluid samples for culture.
Unlike bacterial culture, polymerase chain reaction (PCR) relies on the detection of bacterial DNA rather than on the recovery of viable bacteria and is therefore less affected by the prior administration of antibiotics. Broad‐range or universal primer 16S rRNA PCR detects a conserved region of the 16S ribosomal RNA (rRNA) gene and can detect a wide range of bacterial species with a single assay.11 However, few studies have evaluated the role of 16S rRNA PCR in detecting bacteria in the pleural fluid of children with complicated pneumonia.12, 13 The purpose of this study was to determine the frequency of positive blood and pleural fluid cultures in children with complicated pneumonia, and to determine whether broad‐range 16S rRNA PCR can increase the proportion of children with an identifiable microbiologic cause of complicated pneumonia.
Methods
Study Design, Setting, and Participants
This prospective cohort study was conducted at The Children's Hospital of Philadelphia (CHOP), an urban tertiary care children's hospital. The proposal was approved by the CHOP Committees for the Protection of Human Subjects. Patients were eligible for participation if they were 18 years of age, admitted to the hospital between October 1, 2007 and March 31, 2010, and diagnosed with complicated pneumonia. Parental informed consent was obtained for all patients, and verbal assent was obtained for all children over seven years of age. Patients with chronic medical conditions predisposing them to severe or recurrent pneumonia, such as human immunodeficiency virus, malignancy, and sickle cell disease, were excluded. The study team had no role in the clinical management of study patients. As this test is still considered experimental, pleural fluid 16S rRNA PCR was not performed until the patient was discharged from the hospital; these test results were not shared with the treating physicians.
Study Definition
Complicated pneumonia was defined by a temperature >38.0C, and the presence of lung parenchymal infiltrates and pleural effusions of any size or character on chest radiography or computed tomography.
Microbiologic MethodsConventional Culture
Pleural fluid or blood (4 mL) was inoculated onto a single pediatric BacT/Alert FAN bottle (BioMrieux, Durham, NC) which was immediately transported to the laboratory at room temperature. Additional pleural fluid was also submitted to the laboratory for a cytospin Gram stain. Once received in the laboratory, the bottles were immediately loaded into the BacT/Alert instrument. Bottles were automatically checked by the instrument for production of CO2 every ten minutes, and remained in the instrument for a total of five days. Bottles flagged as positive by the BacT/Alert system were removed from the instrument, subcultured to agar plates, and Gram stained. Bacterial isolates were identified and the antibiotic susceptibility tested by conventional methods following Clinical and Laboratory Standards Institute guidelines.
Microbiological Methods16S rRNA PCR
The 16S rRNA primers and probe used in this study have been validated previously and have been used extensively for the identification of organisms from the Domain Bacteria.14 Escherichia coli (ATCC 25922) and Staphylococcus aureus (ATCC 29213) were used as Gram‐negative and Gram‐positive controls, respectively. DNA extraction was performed on a 300 l aliquot of pleural fluid using the MagMAX Total Nucleic Acid Isolation Kit (Applied Biosystems, Foster City, CA). Samples were disrupted using a Vortex adapter for 15 minutes at the highest setting. Tubes were then centrifuged at 16,000 relative centrifugal force (RCF) for three minutes, and DNA extraction was performed using the KingFisher Flex Automated Purification System (Thermo Scientific, Waltham, MA). All DNA extracts were frozen at 20C prior to use. Details of the 16S rRNA PCR assay optimization and validation appear in the Appendix.
DNA was amplified on an Applied Biosystems 7500 thermal cycler (ABI, Foster City, CA) using the primers, 16S F: 5‐GCT GTC ATC TCT TGT GGG CTG T‐3, 16S R: 5‐AAA CTC ATG GGA GCT GCT GGT T‐3, and the fluorescent labeled TaqMan probe, 16s Probe: 5‐Cy5/CCT GTC ATG CCC ACA CAA ATC TCT CC/BHQ‐2‐3. Human DNA (0.5 nanograms) was added to each assay as a standardized internal amplification control. The primers, AlbICF: 5‐GCT GTC ATC TCT TGT GGG CTG T‐3, AlbICR: 5‐AAA CTC ATG GGA GCT GCT GGT T‐3, and the TaqMan probe, AlbICP: 5‐Cy5/CCT GTC ATG CCC ACA CAA ATC TCT CC/BHQ‐2‐3 detect a region of the human albumin gene. Amplification was performed as follows: initial denaturation of 94C for 20 seconds, followed by 35 cycles of 94C for 10 seconds, 61C for 31 seconds, and 72C for 5 seconds. Each run included positive (E. coli ATCC 25922 DNA) and negative (nuclease free water) controls. A cycle threshold value of 30 or less indicated a positive sample. All positive samples were confirmed using the MicroSeq 500 16S rDNA Bacterial Identification kit (Applied Biosystems).
DNA Sequencing
DNA sequencing was performed directly on PCR products using an ABI 3730 with the BigDye Taq FS Terminator V3.1. Sequencing was completed at the University of Pennsylvania DNA Sequencing Facility, and sequence identification was performed by BLAST at the National Center for Biotechnology Information web site (
Statistical Analysis
Data were analyzed using STATA 10.0 (Stata Corp., College Station, TX). Categorical variables were described using frequencies and percentages, and were compared using the chi‐square test. Continuous variables were described using mean, median, intraquartile range (IQR), and range values. Binomial exact 95% confidence intervals (CIs) were calculated for the proportion of positive blood and pleural fluid cultures and pleural fluid 16S rRNA PCR tests.
Results
During the study period, 124 patients with complicated pneumonia were identified; the median age was 4.9 years (IQR, 2.78.8 years) and the ratio of female to male patients was 1:1. The racial distribution was as follows: non‐Hispanic white, 62 (50%); non‐Hispanic black, 43 (34%); and Hispanic, 7 (6%). The median length of stay was 11 days (range, 240 days; IQR, 811 days). Forty‐one (33.1%) patients were admitted to the intensive care unit, and nine (7.3%) patients required mechanical ventilation. Overall, 5 of the 71 blood cultures performed (7.0%; 95% CI: 2.3%15.7%) were positive.
Pleural fluid drainage was performed in 64 (51.6%) patients. The median duration of antibiotic treatment before pleural fluid drainage was two days (IQR, 04 days). Differences in duration of antibiotic pretreatment between those with and without pleural fluid drainage were not significant. Patients received beta‐lactam agents (76.6%), clindamycin (51.6%), and vancomycin (23.4%) before pleural drainage. Blood cultures were performed in 27 (45.0%) of 60 patients not undergoing pleural fluid drainage; 2 of these 27 (7.4%; 95% CI: 0.9%24.3%) blood cultures were positive, and Streptococcus pneumoniae was isolated in both cases.
Using a combination of pleural fluid culture, blood culture, and broad‐range PCR, a microbiologic cause of infection was identified in 11 of 64 (17.2%; 95% CI: 8.9%28.7%) patients undergoing pleural fluid drainage (Figure 1). Patients with an identified bacterial cause were younger than those without an identified bacterial cause (Table 1). However, there were no statistically significant differences between the groups with and without identified bacteria with respect to sex, race, clinical examination findings and laboratory results at admission, duration of antibiotic therapy before pleural fluid drainage, or length of stay (Table 1). The median pleural fluid white blood cell count was 6880 per mm3 (IQR, 154227,918 per mm3).
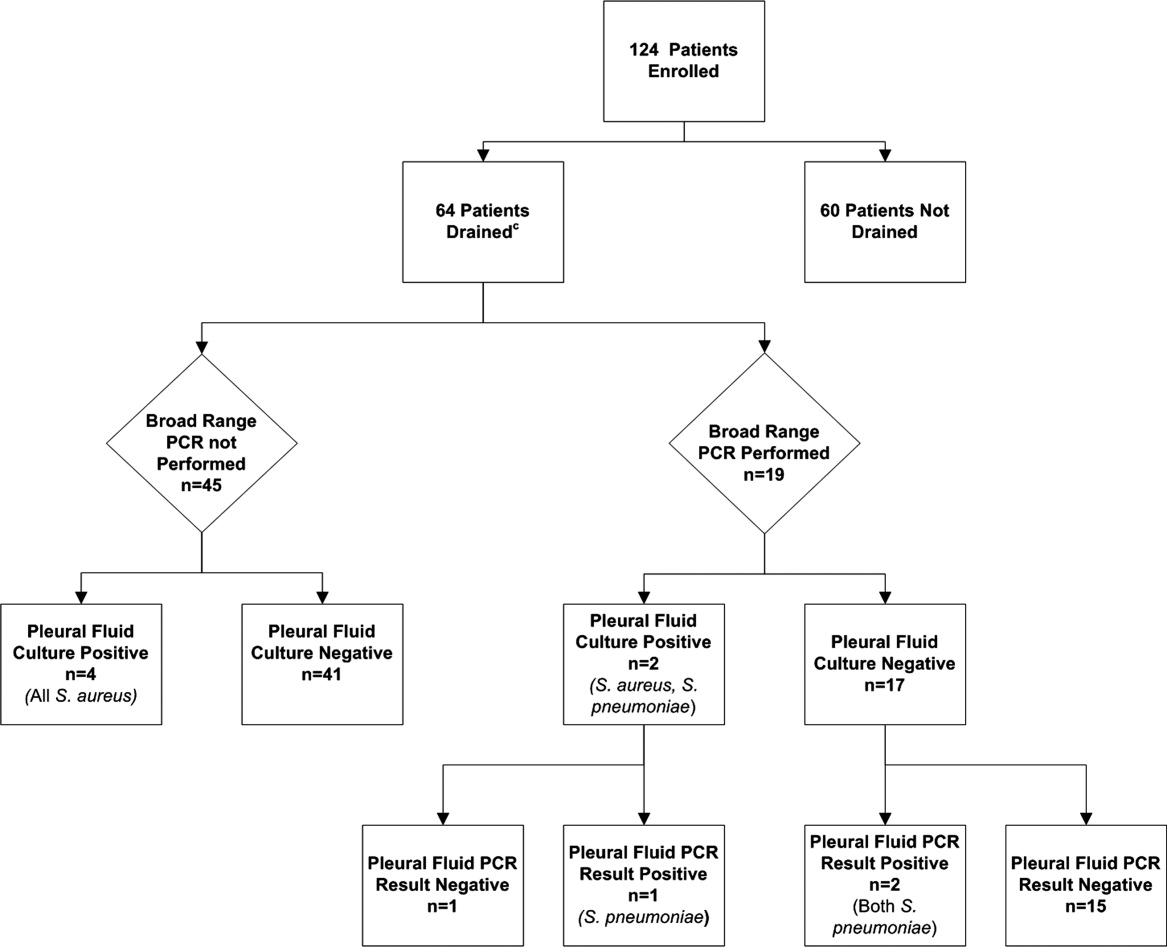
| Causative Bacteria Identified | |||
|---|---|---|---|
| Demographics | Yes (n = 11) | No (n = 53) | P Value |
| |||
| Female sex | 3 (27.3%) | 29 (54.7%) | 0.10 |
| Age (years) | 2 (1.34.50) | 4.3 (3.1 8.1) | 0.03 |
| Race | 0.09 | ||
| Non‐Hispanic white | 3 (27.3%) | 29 (54.7%) | |
| Non‐Hispanic black | 7 (63.6%) | 13 (24.5%) | |
| Hispanic | 0 (0.0%) | 3 (5.6%) | |
| Other | 1 (9.1%) | 8 (15.1%) | |
| History of asthma | 2 (18.2%%) | 12 (22.6%) | 0.75 |
| Duration of antibiotics before drainage (days) | 0.5 (03) | 2 (04) | 0.43 |
| Intensive care unit admission | 7 (63.6%) | 25 (47.2%) | 0.32 |
| Initial temperature (C) | 37.8 (37.239.5) | 38.1 (37.639.3) | 0.76 |
| Initial oxygen saturation (%) | 94 (9397) | 95 (9396) | 0.97 |
| Peripheral white blood cell count (per mm3) | 21.4 (14.028.4) | 16.3 (10.922.6) | 0.12 |
| Platelet count (per mm3) | 434 (298546) | 402 (312575) | 0.95 |
Blood was obtained for culture from 44 (68.8%) of 64 patients that underwent pleural fluid drainage. Blood cultures were positive in three (6.8%; 95% CI: 1.4%18.7%) of these patients; causative bacteria were S. pneumoniae (n = 1), Haemophilus influenzae (n = 1), and Staphylococcus aureus (n = 1). Pleural fluid cultures were positive from 6 of 64 patients (9.3%; 95% CI: 3.5%19.3%) that underwent pleural fluid drainage; causative bacteria were Staphylococcus aureus (n = 5) and Streptococcus pneumoniae (n = 1). Three of the 19 pleural fluid samples (15.8%, CI 3.4%39.6%) tested by 16S rRNA PCR yielded positive results; S. pneumoniae was identified by DNA sequencing in all three of these samples (Figure 1). Of these three specimens, two had both negative Gram stains and negative pleural fluid cultures, while one specimen had Gram‐positive cocci in pairs identified on Gram stain along with a pleural fluid culture‐positive for S. pneumoniae. Of the 16 patients with negative PCR results, one was found to have a pleural fluid culture‐positive for S. aureus; no bacteria were detected on the pleural fluid Gram stain (Figure 1). Differences in the demographic characteristics between patients in whom broad‐range PCR was performed and not performed were not statistically significant (Table 2). Differences in the median length of hospital stay between patients who had PCR performed (9 days; IQR, 712 days) and those who did not (11 days; IQR, 914 days) were not statistically significant (P = 0.19). Antibiotic therapy was simplified from treatment with multiple antibiotics to a single antibiotic in each instance of a positive culture, though the number of positive cultures was too small to lead to meaningful reductions in antibiotic use or spectrum.
| PCR Performed | |||
|---|---|---|---|
| Demographics | Yes (N = 19) | No (N = 45) | P Value |
| |||
| Female sex | 9 (47.4) | 23 (51.1) | 0.78 |
| Age (years) | 4.9 (2.78.8) | 4.0 (2.88.1) | 0.76 |
| Race | 0.42 | ||
| Non‐Hispanic white | 10 (52.6%) | 22 (48.9%) | |
| Non‐Hispanic black | 5 (26.3%) | 15 (33.3%) | |
| Hispanic | 0 (0.0%) | 3 (6.7%) | |
| Other | 4 (21.1%) | 5 (11.1%) | |
| History of asthma | 5 (26.32%) | 9 (20.0%) | 0.58 |
| Duration of antibiotics before drainage (days) | 2 (03) | 1.5 (04) | 0.65 |
| Intensive care unit admission | 8 (42.1%) | 24 (53.3%) | 0.41 |
| Initial temperature (C) | 38.1 (37.339.4) | 38.0 (37.639.4) | 0.86 |
| Initial pulse oximetry (%) | 96 (9497) | 94 (9296) | 0.34 |
| Initial white blood cell count (1000 per mm3) | 16.1 (9.527.4) | 17.8 (12.622.8) | 0.93 |
| Platelet count (1000 per mm3) | 397 (312575) | 431 (303597) | 0.73 |
Discussion
Identification of the causative organism can improve the treatment of children with complicated pneumonia by enabling clinicians to target the infection with effective, narrow‐spectrum antibiotics. However, broad‐spectrum antibiotics are typically given before blood or pleural fluid samples are obtained, lowering the yield of conventional bacterial cultures. In our study, pleural fluid and blood cultures were infrequently positive. However, the use of 16S rRNA broad‐range PCR and DNA sequencing as ancillary tests only modestly improved our diagnostic yield.
Two prior studies have shown that broad‐range PCR analysis of pleural fluid can detect pathogenic organisms from pleural fluid even after the administration of antibiotics. Saglani et al.12 used bacterial culture and broad‐range PCR to analyze pleural fluid from 32 children with complicated pneumonia. Although the cohort had received a median of eight days of antibiotic therapy prior to fluid aspiration, a combination of broad‐range PCR and DNA sequencing identified organisms, predominantly S. pneumoniae, in 17 of 26 (65.4%) pleural fluid samples with negative culture. Five of the six culture‐positive samples also had positive PCR results, suggesting that a low proportion of the PCR results were false‐negatives. Le Monnier et al.13 cultured the pleural fluid from 78 children with complicated pneumonia; 15 samples were excluded from PCR testing because they grew bacteria other than S. pneumoniae. Broad‐range 16S rRNA PCR detected bacteria in 22 of 40 (55.0%) samples that were culture‐negative; subsequent DNA sequencing identified S. pneumoniae (n = 17), S. pyogenes (n = 3), S. aureus (n = 1), and H. influenzae (n = 1). S. pneumoniae was identified by 16S rRNA PCR followed by DNA sequencing in 20 of the 23 (87.0%) pleural fluid samples that grew S. pneumoniae on culture.
PCR with organism‐specific primers has also been shown to detect pathogenic bacteria in 35%70% of pleural fluid samples from patients with complicated pneumonia.15, 16 These rates of detection are comparable to the results of prior studies that used broad‐range PCR, and suggest that 16S rRNA and organism‐specific PCR are similarly sensitive tests.
Our study found that the proportion of positive results with broad‐range PCR was greater than the proportion observed with conventional pleural fluid culture. We were also able to identify S. pneumoniae by broad‐range PCR in two culture‐negative pleural fluid samples. The detection of S. pneumoniae by PCR in the setting of negative pleural fluid culture is not surprising, as most patients received empiric antibiotic therapy against S. pneumoniae before undergoing pleural fluid drainage. This prior antibiotic therapy would be expected to decrease the yield of pleural fluid culture but have a less significant impact on PCR. The reason for the failure to detect S. aureus by PCR from our clinical samples is not known. We explored whether this issue could be attributable to test characteristics during validation of our assay (as described in the technical Appendix), and S. aureus was consistently identified in pleural fluid samples spiked with S. aureus. While our diagnostic yield was low compared with prior studies that used broad‐range PCR, the distribution of causative bacteria was similar to prior studies of complicated pneumonia.9, 10 There were too few positive cultures among the specimens available for broad‐range PCR testing for us to reliably assess 16S rRNA PCR sensitivity and specificity. Thus, it was not possible to reliably assess the value of 16S rRNA PCR as an ancillary test in culture‐negative complicated pneumonia.
Several factors may have contributed to the low yield of broad‐range PCR in our study. First, all patients in our study received broad‐spectrum antibiotics prior to pleural fluid drainage; most patients received treatment with a beta‐lactam agent in combination with either clindamycin or vancomycin. Although PCR is less affected than culture by the prior administration of antibiotics, it is still possible that exposure to antibiotics accelerated degradation of the bacterial genome, thus decreasing the sensitivity of broad‐range PCR. The median duration of antibiotic therapy prior to drainage was shorter for patients in whom a bacterial pathogen was identified, compared with those in whom a pathogen was not identified. Though this difference was not statistically significant, this difference emphasizes that early pleural fluid collection may improve bacterial detection. The median duration of prior antibiotic therapy was eight days, in the study by Saglani et al.,12 however details regarding anti‐staphylococcal therapy were not reported. Second, several studies using 16S rRNA PCR in blood or cerebrospinal fluid (CSF) specimens for children with sepsis or meningitis, respectively, have noted decreased sensitivity for detection of Gram‐positive bacteria.1720 The cell wall composition makes Gram‐positive bacteria particularly difficult to lyse for DNA extraction. Prior studies used a different approach to DNA extraction compared with our study. Saglani et al.12 used the QIAmp minikit for DNA extraction (Qiagen Ltd, West Sussex, UK) and Le Monnier et al.13 used the MagnaPure System (Roche Diagnostics, Indianapolis, IN) for DNA extraction; additionally Saglani et al.12 included an additional 15 minutes of incubation at 95C following Proteinase K digestion to ensure complete lysis of the bacterial cells. We used the MagMAX Total Nucleic Acid Isolation Kit with a bead beating step to degrade the samples prior to lysis. It is unlikely that any of these differences contributed to differences in our study results. Third, human DNA may cause a nonspecific background signal, which could decrease PCR sensitivity. This issue may be particularly important in complicated pneumonia where the pleural fluid white blood cell counts are substantially elevated. Human DNA from white blood cells might be present at much higher concentrations than bacterial DNA, which would create a competitive advantage for binding of human, rather than bacterial, DNA on to the bead matrix.21 Saglani et al.12 did not report pleural fluid white blood cell counts for comparison. However, Le Monnier et al.13 reported pleural fluid white blood cell counts slightly higher than those observed in our patients. Thus, differences in pleural fluid white blood cell counts do not necessarily explain the differences in yield across studies. Fourth, while the universal primers used in our study have been validated, including for detection of S. aureus, in previous studies,14 Saglani et al.12 and Le Monnier et al.13 each used a different set of primers. It is unclear whether or not the choice of different primers affected the microbiologic yield.
An important limitation of this study is the relatively small number of patients with pleural fluid available for PCR testing combined with the low PCR yield. This limitation may have caused us to underestimate the true benefit of 16S rRNA PCR as an ancillary diagnostic test, as suggested by the wide confidence intervals around the estimates of PCR yield. Additionally, not all patients underwent pleural drainage, and not all patients undergoing pleural drainage had pleural fluid available for PCR testing. The latter issue would likely have only minimal impact on our study results, as there were no differences in demographics or clinical or laboratory features among those with and without pleural fluid available for PCR testing. However, differences among physicians, and across institutions, may play an important role in the decision to perform pleural drainage. We do not know whether patients undergoing pleural drainage at our institution were more or less likely to have bacteria detected by PCR than patients not undergoing drainage. If they were more likely to have bacteria detected, then our study would underestimate the benefit of PCR as an adjunct diagnostic test. However, there was no difference in the duration of antibiotic pretreatment between these two groups, and the yield from blood culture was similar.
In conclusion, blood and pleural fluid cultures infrequently identify the causative bacteria in children with complicated pneumonia. The use of broad‐range PCR increased the microbiologic yield only modestly. Further refinements to improve the diagnostic accuracy of broad‐range PCR testing are needed before this technique can be recommended for widespread use in clinical practice.
Appendix
Optimization and Validation of The 16S Assay
The assay was optimized for use with pleural fluid samples as follows. E. coli (ATCC 25922) and S. aureus (ATCC 29213) were grown overnight in 100 ml Brain Heart Infusion (BHI) broth. A suspension equivalent to a 0.5 MacFarland standard was prepared and was taken to represent approximately 1 108 colony‐forming units/mL. To prepare standard PCR curves, 1 in 10 dilutions were prepared in PBS (pH, 7.4) and DNA was extracted, in triplicate, using two different DNA extraction methods: the MagMAX Total Nucleic Acid Isolation Kit and the PrepMan Ultra Sample Preparation reagent system (Applied Biosystems, Foster City, CA), as described by the manufacturer. For the MagMax extraction, a 300 microliter sample was added to 200 microliters of lysis/binding solution in a bead tube. Samples were disrupted using a vortex adapter for 15 minutes at the highest setting. Tubes were then centrifuged at 16,000 relative centrifugal force (RCF) for three minutes. DNA extraction was performed using the KingFisher Flex Automated Purification System (Thermo Scientific). For the PrepMan Ultra extraction, a 300‐l sample was centrifuged for three minutes at 16,000 RCF. The supernatant fluid was discarded and the pellet was resuspended in 100 microliters of PrepMan Ultra Lysis Buffer and incubated at 100C for ten minutes. The sample was centrifuged for three minutes at 16,000 RCF, and a 10‐microliter aliquot of supernatant fluid was added to 90 microliters of nuclease free water. All DNA extracts were frozen at 20C prior to use. Plate counts, performed from the bacterial suspensions in triplicate, revealed approximately 1.3 108 colony‐forming units/mL in the original suspensions.
Pleural fluid samples were spiked with known concentrations (1, 3, 10, 30, 100, 300, and 1000 colony‐forming units/mL) of E. coli and S. aureus, and each sample was extracted five times with both DNA extraction systems. Each DNA extract was amplified on an Applied Biosystems 7500 thermal cycler (ABI) and a SmartCycler (Cepheid, Sunnyvale, CA). Analysis of the results obtained from the preliminary experiments indicated that the following combination of DNA extraction and PCR was optimal, and these conditions were used for all patient samples.
DNA was extracted from a 300‐microliter aliquot of pleural fluid using the MagMAX Total Nucleic Acid Isolation Kit (Ambion, Applied Biosystems) as described by the manufacturer. PCR was performed on an Applied Biosystems 7500 thermal cycler (ABI) using the primers, 16S F: 5‐GCT GTC ATC TCT TGT GGG CTG T‐3, 16S R: 5‐AAA CTC ATG GGA GCT GCT GGT T‐3, and the fluorescent labeled TaqMan probe, 16s Probe: 5‐Cy5/CCT GTC ATG CCC ACA CAA ATC TCT CC/BHQ‐2‐3. Human DNA (0.5 nanograms) was added to each assay to ensure that an adequate amount of human DNA was available to act as an internal amplification control. The primers, AlbICF: 5‐GCT GTC ATC TCT TGT GGG CTG T‐3, AlbICR: 5‐AAA CTC ATG GGA GCT GCT GGT T‐3, and the TaqMan probe, AlbICP: 5‐Cy5/CCT GTC ATG CCC ACA CAA ATC TCT CC/BHQ‐2‐3 detect a region of the human albumin gene. Amplification was performed as follows: initial denaturation of 94C for 20 seconds, followed by 35 cycles of 94C for 10 seconds, 61C for 31 seconds, and 72C for 5 seconds. Each run included positive (E. coli ATCC 25922 DNA) and negative (nuclease free water) controls. A cycle threshold value of 30 or less indicated a positive sample. All positive samples were confirmed using the MicroSeq 500 16S rDNA Bacterial Identification kit (Applied Biosystems).
- ,,, et al.An epidemiological investigation of a sustained high rate of pediatric parapneumonic empyema: risk factors and microbiological associations.Clin Infect Dis.2002;34:434–440.
- ,,,,.Primary early thoracoscopy and reduction in length of hospital stay and additional procedures among children with complicated pneumonia: results of a multicenter retrospective cohort study.Arch Pediatr Adolesc Med.2008;162:675–681.
- ,,, et al.Pulmonary manifestations in children with invasive community‐acquired Staphylococcus aureus infection.Clin Infect Dis.2005;41:583–590.
- ,,, et al.Association between Staphylococcus aureus strains carrying gene for Panton‐Valentine leukocidin and highly lethal necrotising pneumonia in young immunocompetent patients.Lancet.2002;359:753–759.
- ,,, et al.Severe community‐onset pneumonia in healthy adults caused by methicillin‐resistant Staphylococcus aureus carrying the Panton‐Valentine leukocidin genes.Clin Infect Dis.2005;40:100–107.
- ,.Empyema hospitalizations increased in US children despite pneumococcal conjugate vaccine.Pediatrics.2010;125:26–33.
- ,,,.Increasing incidence of empyema complicating childhood community‐acquired pneumonia in the United States.Clin Infect Dis.2010;50:805–813.
- ,,,,.National hospitalization trends for pediatric pneumonia and associated complications.Pediatrics.2010;126:204–213.
- ,,, et al.Thoracoscopic decortication vs tube thoracostomy with fibrinolysis for empyema in children: a prospective, randomized trial.J Pediatr Surg.2009;44:106–111.
- ,,, et al.Comparison of urokinase and video‐assisted thoracoscopic surgery for treatment of childhood empyema.Am J Respir Crit Care Med.2006;174:221–227.
- ,.Development of broad‐range 16S rDNA PCR for use in the routine diagnostic clinical microbiology service.J Med Microbiol.2003;52:685–691.
- ,,,.Empyema: the use of broad range 16S rDNA PCR for pathogen detection.Arch Dis Child.2005;90:70–73.
- ,,, et al.Microbiological diagnosis of empyema in children: comparative evaluations by culture, polymerase chain reaction, and pneumococcal antigen detection in pleural fluids.Clin Infect Dis.2006;42:1135–1140.
- ,,,.Determination of bacterial load by real‐time PCR using a broad‐range (universal) probe and primers set.Microbiology.2002;148:257–266.
- ,,,,,.Pneumolysin polymerase chain reaction for diagnosis of pneumococcal pneumonia and empyema in children.Eur J Clin Microbiol Infect Dis.2006;25:783–789.
- ,,, et al.Pleural fluid PCR method for detection of Staphylococcus aureus, Streptococcus pneumoniae and Haemophilus influenzae in pediatric parapneumonic effusions.Respiration.2008;75:437–442.
- ,.16S rRNA gene sequencing for bacterial identification in the diagnostic laboratory: pluses, perils, and pitfalls.J Clin Microbiol.2007;45:2761–2764.
- ,,,,.Evaluating the near‐term infant for early onset sepsis: progress and challenges to consider with 16S rDNA polymerase chain reaction testing.J Mol Diagn.2006;8:357–363.
- ,,,,.Preanalytic removal of human DNA eliminates false signals in general 16S rDNA PCR monitoring of bacterial pathogens in blood.Comp Immunol Microbiol Infect Dis.2009;32:207–219.
- ,,,,.Use of broad range16S rDNA PCR in clinical microbiology.J Microbiol Methods.2009;76:217–225.
- ,.Real‐time polymerase chain reaction for detecting bacterial DNA directly from blood of neonates being evaluated for sepsis.J Mol Diagn.2005;7:575–581.
Community‐acquired pneumonia (CAP), the most common serious bacterial infection in childhood, may be complicated by parapneumonic effusion (ie, complicated pneumonia).1, 2 The clinical outcome of children with complicated pneumonia is directly influenced by the causative organism, and precise identification of the infectious agent has the potential to improve clinical management.35 The incidence of complicated pneumonia has recently increased, highlighting the need to better understand the reasons for this changing epidemiology.68 However, using conventional bacterial culture, bacteria are isolated from clinical samples obtained from children with complicated pneumonia in only 17%42% of cases.1, 9, 10 The low rate of positive culture results may be related to stringent bacterial growth requirements or to administration of broad‐spectrum antibiotics before obtaining blood or pleural fluid samples for culture.
Unlike bacterial culture, polymerase chain reaction (PCR) relies on the detection of bacterial DNA rather than on the recovery of viable bacteria and is therefore less affected by the prior administration of antibiotics. Broad‐range or universal primer 16S rRNA PCR detects a conserved region of the 16S ribosomal RNA (rRNA) gene and can detect a wide range of bacterial species with a single assay.11 However, few studies have evaluated the role of 16S rRNA PCR in detecting bacteria in the pleural fluid of children with complicated pneumonia.12, 13 The purpose of this study was to determine the frequency of positive blood and pleural fluid cultures in children with complicated pneumonia, and to determine whether broad‐range 16S rRNA PCR can increase the proportion of children with an identifiable microbiologic cause of complicated pneumonia.
Methods
Study Design, Setting, and Participants
This prospective cohort study was conducted at The Children's Hospital of Philadelphia (CHOP), an urban tertiary care children's hospital. The proposal was approved by the CHOP Committees for the Protection of Human Subjects. Patients were eligible for participation if they were 18 years of age, admitted to the hospital between October 1, 2007 and March 31, 2010, and diagnosed with complicated pneumonia. Parental informed consent was obtained for all patients, and verbal assent was obtained for all children over seven years of age. Patients with chronic medical conditions predisposing them to severe or recurrent pneumonia, such as human immunodeficiency virus, malignancy, and sickle cell disease, were excluded. The study team had no role in the clinical management of study patients. As this test is still considered experimental, pleural fluid 16S rRNA PCR was not performed until the patient was discharged from the hospital; these test results were not shared with the treating physicians.
Study Definition
Complicated pneumonia was defined by a temperature >38.0C, and the presence of lung parenchymal infiltrates and pleural effusions of any size or character on chest radiography or computed tomography.
Microbiologic MethodsConventional Culture
Pleural fluid or blood (4 mL) was inoculated onto a single pediatric BacT/Alert FAN bottle (BioMrieux, Durham, NC) which was immediately transported to the laboratory at room temperature. Additional pleural fluid was also submitted to the laboratory for a cytospin Gram stain. Once received in the laboratory, the bottles were immediately loaded into the BacT/Alert instrument. Bottles were automatically checked by the instrument for production of CO2 every ten minutes, and remained in the instrument for a total of five days. Bottles flagged as positive by the BacT/Alert system were removed from the instrument, subcultured to agar plates, and Gram stained. Bacterial isolates were identified and the antibiotic susceptibility tested by conventional methods following Clinical and Laboratory Standards Institute guidelines.
Microbiological Methods16S rRNA PCR
The 16S rRNA primers and probe used in this study have been validated previously and have been used extensively for the identification of organisms from the Domain Bacteria.14 Escherichia coli (ATCC 25922) and Staphylococcus aureus (ATCC 29213) were used as Gram‐negative and Gram‐positive controls, respectively. DNA extraction was performed on a 300 l aliquot of pleural fluid using the MagMAX Total Nucleic Acid Isolation Kit (Applied Biosystems, Foster City, CA). Samples were disrupted using a Vortex adapter for 15 minutes at the highest setting. Tubes were then centrifuged at 16,000 relative centrifugal force (RCF) for three minutes, and DNA extraction was performed using the KingFisher Flex Automated Purification System (Thermo Scientific, Waltham, MA). All DNA extracts were frozen at 20C prior to use. Details of the 16S rRNA PCR assay optimization and validation appear in the Appendix.
DNA was amplified on an Applied Biosystems 7500 thermal cycler (ABI, Foster City, CA) using the primers, 16S F: 5‐GCT GTC ATC TCT TGT GGG CTG T‐3, 16S R: 5‐AAA CTC ATG GGA GCT GCT GGT T‐3, and the fluorescent labeled TaqMan probe, 16s Probe: 5‐Cy5/CCT GTC ATG CCC ACA CAA ATC TCT CC/BHQ‐2‐3. Human DNA (0.5 nanograms) was added to each assay as a standardized internal amplification control. The primers, AlbICF: 5‐GCT GTC ATC TCT TGT GGG CTG T‐3, AlbICR: 5‐AAA CTC ATG GGA GCT GCT GGT T‐3, and the TaqMan probe, AlbICP: 5‐Cy5/CCT GTC ATG CCC ACA CAA ATC TCT CC/BHQ‐2‐3 detect a region of the human albumin gene. Amplification was performed as follows: initial denaturation of 94C for 20 seconds, followed by 35 cycles of 94C for 10 seconds, 61C for 31 seconds, and 72C for 5 seconds. Each run included positive (E. coli ATCC 25922 DNA) and negative (nuclease free water) controls. A cycle threshold value of 30 or less indicated a positive sample. All positive samples were confirmed using the MicroSeq 500 16S rDNA Bacterial Identification kit (Applied Biosystems).
DNA Sequencing
DNA sequencing was performed directly on PCR products using an ABI 3730 with the BigDye Taq FS Terminator V3.1. Sequencing was completed at the University of Pennsylvania DNA Sequencing Facility, and sequence identification was performed by BLAST at the National Center for Biotechnology Information web site (
Statistical Analysis
Data were analyzed using STATA 10.0 (Stata Corp., College Station, TX). Categorical variables were described using frequencies and percentages, and were compared using the chi‐square test. Continuous variables were described using mean, median, intraquartile range (IQR), and range values. Binomial exact 95% confidence intervals (CIs) were calculated for the proportion of positive blood and pleural fluid cultures and pleural fluid 16S rRNA PCR tests.
Results
During the study period, 124 patients with complicated pneumonia were identified; the median age was 4.9 years (IQR, 2.78.8 years) and the ratio of female to male patients was 1:1. The racial distribution was as follows: non‐Hispanic white, 62 (50%); non‐Hispanic black, 43 (34%); and Hispanic, 7 (6%). The median length of stay was 11 days (range, 240 days; IQR, 811 days). Forty‐one (33.1%) patients were admitted to the intensive care unit, and nine (7.3%) patients required mechanical ventilation. Overall, 5 of the 71 blood cultures performed (7.0%; 95% CI: 2.3%15.7%) were positive.
Pleural fluid drainage was performed in 64 (51.6%) patients. The median duration of antibiotic treatment before pleural fluid drainage was two days (IQR, 04 days). Differences in duration of antibiotic pretreatment between those with and without pleural fluid drainage were not significant. Patients received beta‐lactam agents (76.6%), clindamycin (51.6%), and vancomycin (23.4%) before pleural drainage. Blood cultures were performed in 27 (45.0%) of 60 patients not undergoing pleural fluid drainage; 2 of these 27 (7.4%; 95% CI: 0.9%24.3%) blood cultures were positive, and Streptococcus pneumoniae was isolated in both cases.
Using a combination of pleural fluid culture, blood culture, and broad‐range PCR, a microbiologic cause of infection was identified in 11 of 64 (17.2%; 95% CI: 8.9%28.7%) patients undergoing pleural fluid drainage (Figure 1). Patients with an identified bacterial cause were younger than those without an identified bacterial cause (Table 1). However, there were no statistically significant differences between the groups with and without identified bacteria with respect to sex, race, clinical examination findings and laboratory results at admission, duration of antibiotic therapy before pleural fluid drainage, or length of stay (Table 1). The median pleural fluid white blood cell count was 6880 per mm3 (IQR, 154227,918 per mm3).
| Causative Bacteria Identified | |||
|---|---|---|---|
| Demographics | Yes (n = 11) | No (n = 53) | P Value |
| |||
| Female sex | 3 (27.3%) | 29 (54.7%) | 0.10 |
| Age (years) | 2 (1.34.50) | 4.3 (3.1 8.1) | 0.03 |
| Race | 0.09 | ||
| Non‐Hispanic white | 3 (27.3%) | 29 (54.7%) | |
| Non‐Hispanic black | 7 (63.6%) | 13 (24.5%) | |
| Hispanic | 0 (0.0%) | 3 (5.6%) | |
| Other | 1 (9.1%) | 8 (15.1%) | |
| History of asthma | 2 (18.2%%) | 12 (22.6%) | 0.75 |
| Duration of antibiotics before drainage (days) | 0.5 (03) | 2 (04) | 0.43 |
| Intensive care unit admission | 7 (63.6%) | 25 (47.2%) | 0.32 |
| Initial temperature (C) | 37.8 (37.239.5) | 38.1 (37.639.3) | 0.76 |
| Initial oxygen saturation (%) | 94 (9397) | 95 (9396) | 0.97 |
| Peripheral white blood cell count (per mm3) | 21.4 (14.028.4) | 16.3 (10.922.6) | 0.12 |
| Platelet count (per mm3) | 434 (298546) | 402 (312575) | 0.95 |
Blood was obtained for culture from 44 (68.8%) of 64 patients that underwent pleural fluid drainage. Blood cultures were positive in three (6.8%; 95% CI: 1.4%18.7%) of these patients; causative bacteria were S. pneumoniae (n = 1), Haemophilus influenzae (n = 1), and Staphylococcus aureus (n = 1). Pleural fluid cultures were positive from 6 of 64 patients (9.3%; 95% CI: 3.5%19.3%) that underwent pleural fluid drainage; causative bacteria were Staphylococcus aureus (n = 5) and Streptococcus pneumoniae (n = 1). Three of the 19 pleural fluid samples (15.8%, CI 3.4%39.6%) tested by 16S rRNA PCR yielded positive results; S. pneumoniae was identified by DNA sequencing in all three of these samples (Figure 1). Of these three specimens, two had both negative Gram stains and negative pleural fluid cultures, while one specimen had Gram‐positive cocci in pairs identified on Gram stain along with a pleural fluid culture‐positive for S. pneumoniae. Of the 16 patients with negative PCR results, one was found to have a pleural fluid culture‐positive for S. aureus; no bacteria were detected on the pleural fluid Gram stain (Figure 1). Differences in the demographic characteristics between patients in whom broad‐range PCR was performed and not performed were not statistically significant (Table 2). Differences in the median length of hospital stay between patients who had PCR performed (9 days; IQR, 712 days) and those who did not (11 days; IQR, 914 days) were not statistically significant (P = 0.19). Antibiotic therapy was simplified from treatment with multiple antibiotics to a single antibiotic in each instance of a positive culture, though the number of positive cultures was too small to lead to meaningful reductions in antibiotic use or spectrum.
| PCR Performed | |||
|---|---|---|---|
| Demographics | Yes (N = 19) | No (N = 45) | P Value |
| |||
| Female sex | 9 (47.4) | 23 (51.1) | 0.78 |
| Age (years) | 4.9 (2.78.8) | 4.0 (2.88.1) | 0.76 |
| Race | 0.42 | ||
| Non‐Hispanic white | 10 (52.6%) | 22 (48.9%) | |
| Non‐Hispanic black | 5 (26.3%) | 15 (33.3%) | |
| Hispanic | 0 (0.0%) | 3 (6.7%) | |
| Other | 4 (21.1%) | 5 (11.1%) | |
| History of asthma | 5 (26.32%) | 9 (20.0%) | 0.58 |
| Duration of antibiotics before drainage (days) | 2 (03) | 1.5 (04) | 0.65 |
| Intensive care unit admission | 8 (42.1%) | 24 (53.3%) | 0.41 |
| Initial temperature (C) | 38.1 (37.339.4) | 38.0 (37.639.4) | 0.86 |
| Initial pulse oximetry (%) | 96 (9497) | 94 (9296) | 0.34 |
| Initial white blood cell count (1000 per mm3) | 16.1 (9.527.4) | 17.8 (12.622.8) | 0.93 |
| Platelet count (1000 per mm3) | 397 (312575) | 431 (303597) | 0.73 |
Discussion
Identification of the causative organism can improve the treatment of children with complicated pneumonia by enabling clinicians to target the infection with effective, narrow‐spectrum antibiotics. However, broad‐spectrum antibiotics are typically given before blood or pleural fluid samples are obtained, lowering the yield of conventional bacterial cultures. In our study, pleural fluid and blood cultures were infrequently positive. However, the use of 16S rRNA broad‐range PCR and DNA sequencing as ancillary tests only modestly improved our diagnostic yield.
Two prior studies have shown that broad‐range PCR analysis of pleural fluid can detect pathogenic organisms from pleural fluid even after the administration of antibiotics. Saglani et al.12 used bacterial culture and broad‐range PCR to analyze pleural fluid from 32 children with complicated pneumonia. Although the cohort had received a median of eight days of antibiotic therapy prior to fluid aspiration, a combination of broad‐range PCR and DNA sequencing identified organisms, predominantly S. pneumoniae, in 17 of 26 (65.4%) pleural fluid samples with negative culture. Five of the six culture‐positive samples also had positive PCR results, suggesting that a low proportion of the PCR results were false‐negatives. Le Monnier et al.13 cultured the pleural fluid from 78 children with complicated pneumonia; 15 samples were excluded from PCR testing because they grew bacteria other than S. pneumoniae. Broad‐range 16S rRNA PCR detected bacteria in 22 of 40 (55.0%) samples that were culture‐negative; subsequent DNA sequencing identified S. pneumoniae (n = 17), S. pyogenes (n = 3), S. aureus (n = 1), and H. influenzae (n = 1). S. pneumoniae was identified by 16S rRNA PCR followed by DNA sequencing in 20 of the 23 (87.0%) pleural fluid samples that grew S. pneumoniae on culture.
PCR with organism‐specific primers has also been shown to detect pathogenic bacteria in 35%70% of pleural fluid samples from patients with complicated pneumonia.15, 16 These rates of detection are comparable to the results of prior studies that used broad‐range PCR, and suggest that 16S rRNA and organism‐specific PCR are similarly sensitive tests.
Our study found that the proportion of positive results with broad‐range PCR was greater than the proportion observed with conventional pleural fluid culture. We were also able to identify S. pneumoniae by broad‐range PCR in two culture‐negative pleural fluid samples. The detection of S. pneumoniae by PCR in the setting of negative pleural fluid culture is not surprising, as most patients received empiric antibiotic therapy against S. pneumoniae before undergoing pleural fluid drainage. This prior antibiotic therapy would be expected to decrease the yield of pleural fluid culture but have a less significant impact on PCR. The reason for the failure to detect S. aureus by PCR from our clinical samples is not known. We explored whether this issue could be attributable to test characteristics during validation of our assay (as described in the technical Appendix), and S. aureus was consistently identified in pleural fluid samples spiked with S. aureus. While our diagnostic yield was low compared with prior studies that used broad‐range PCR, the distribution of causative bacteria was similar to prior studies of complicated pneumonia.9, 10 There were too few positive cultures among the specimens available for broad‐range PCR testing for us to reliably assess 16S rRNA PCR sensitivity and specificity. Thus, it was not possible to reliably assess the value of 16S rRNA PCR as an ancillary test in culture‐negative complicated pneumonia.
Several factors may have contributed to the low yield of broad‐range PCR in our study. First, all patients in our study received broad‐spectrum antibiotics prior to pleural fluid drainage; most patients received treatment with a beta‐lactam agent in combination with either clindamycin or vancomycin. Although PCR is less affected than culture by the prior administration of antibiotics, it is still possible that exposure to antibiotics accelerated degradation of the bacterial genome, thus decreasing the sensitivity of broad‐range PCR. The median duration of antibiotic therapy prior to drainage was shorter for patients in whom a bacterial pathogen was identified, compared with those in whom a pathogen was not identified. Though this difference was not statistically significant, this difference emphasizes that early pleural fluid collection may improve bacterial detection. The median duration of prior antibiotic therapy was eight days, in the study by Saglani et al.,12 however details regarding anti‐staphylococcal therapy were not reported. Second, several studies using 16S rRNA PCR in blood or cerebrospinal fluid (CSF) specimens for children with sepsis or meningitis, respectively, have noted decreased sensitivity for detection of Gram‐positive bacteria.1720 The cell wall composition makes Gram‐positive bacteria particularly difficult to lyse for DNA extraction. Prior studies used a different approach to DNA extraction compared with our study. Saglani et al.12 used the QIAmp minikit for DNA extraction (Qiagen Ltd, West Sussex, UK) and Le Monnier et al.13 used the MagnaPure System (Roche Diagnostics, Indianapolis, IN) for DNA extraction; additionally Saglani et al.12 included an additional 15 minutes of incubation at 95C following Proteinase K digestion to ensure complete lysis of the bacterial cells. We used the MagMAX Total Nucleic Acid Isolation Kit with a bead beating step to degrade the samples prior to lysis. It is unlikely that any of these differences contributed to differences in our study results. Third, human DNA may cause a nonspecific background signal, which could decrease PCR sensitivity. This issue may be particularly important in complicated pneumonia where the pleural fluid white blood cell counts are substantially elevated. Human DNA from white blood cells might be present at much higher concentrations than bacterial DNA, which would create a competitive advantage for binding of human, rather than bacterial, DNA on to the bead matrix.21 Saglani et al.12 did not report pleural fluid white blood cell counts for comparison. However, Le Monnier et al.13 reported pleural fluid white blood cell counts slightly higher than those observed in our patients. Thus, differences in pleural fluid white blood cell counts do not necessarily explain the differences in yield across studies. Fourth, while the universal primers used in our study have been validated, including for detection of S. aureus, in previous studies,14 Saglani et al.12 and Le Monnier et al.13 each used a different set of primers. It is unclear whether or not the choice of different primers affected the microbiologic yield.
An important limitation of this study is the relatively small number of patients with pleural fluid available for PCR testing combined with the low PCR yield. This limitation may have caused us to underestimate the true benefit of 16S rRNA PCR as an ancillary diagnostic test, as suggested by the wide confidence intervals around the estimates of PCR yield. Additionally, not all patients underwent pleural drainage, and not all patients undergoing pleural drainage had pleural fluid available for PCR testing. The latter issue would likely have only minimal impact on our study results, as there were no differences in demographics or clinical or laboratory features among those with and without pleural fluid available for PCR testing. However, differences among physicians, and across institutions, may play an important role in the decision to perform pleural drainage. We do not know whether patients undergoing pleural drainage at our institution were more or less likely to have bacteria detected by PCR than patients not undergoing drainage. If they were more likely to have bacteria detected, then our study would underestimate the benefit of PCR as an adjunct diagnostic test. However, there was no difference in the duration of antibiotic pretreatment between these two groups, and the yield from blood culture was similar.
In conclusion, blood and pleural fluid cultures infrequently identify the causative bacteria in children with complicated pneumonia. The use of broad‐range PCR increased the microbiologic yield only modestly. Further refinements to improve the diagnostic accuracy of broad‐range PCR testing are needed before this technique can be recommended for widespread use in clinical practice.
Appendix
Optimization and Validation of The 16S Assay
The assay was optimized for use with pleural fluid samples as follows. E. coli (ATCC 25922) and S. aureus (ATCC 29213) were grown overnight in 100 ml Brain Heart Infusion (BHI) broth. A suspension equivalent to a 0.5 MacFarland standard was prepared and was taken to represent approximately 1 108 colony‐forming units/mL. To prepare standard PCR curves, 1 in 10 dilutions were prepared in PBS (pH, 7.4) and DNA was extracted, in triplicate, using two different DNA extraction methods: the MagMAX Total Nucleic Acid Isolation Kit and the PrepMan Ultra Sample Preparation reagent system (Applied Biosystems, Foster City, CA), as described by the manufacturer. For the MagMax extraction, a 300 microliter sample was added to 200 microliters of lysis/binding solution in a bead tube. Samples were disrupted using a vortex adapter for 15 minutes at the highest setting. Tubes were then centrifuged at 16,000 relative centrifugal force (RCF) for three minutes. DNA extraction was performed using the KingFisher Flex Automated Purification System (Thermo Scientific). For the PrepMan Ultra extraction, a 300‐l sample was centrifuged for three minutes at 16,000 RCF. The supernatant fluid was discarded and the pellet was resuspended in 100 microliters of PrepMan Ultra Lysis Buffer and incubated at 100C for ten minutes. The sample was centrifuged for three minutes at 16,000 RCF, and a 10‐microliter aliquot of supernatant fluid was added to 90 microliters of nuclease free water. All DNA extracts were frozen at 20C prior to use. Plate counts, performed from the bacterial suspensions in triplicate, revealed approximately 1.3 108 colony‐forming units/mL in the original suspensions.
Pleural fluid samples were spiked with known concentrations (1, 3, 10, 30, 100, 300, and 1000 colony‐forming units/mL) of E. coli and S. aureus, and each sample was extracted five times with both DNA extraction systems. Each DNA extract was amplified on an Applied Biosystems 7500 thermal cycler (ABI) and a SmartCycler (Cepheid, Sunnyvale, CA). Analysis of the results obtained from the preliminary experiments indicated that the following combination of DNA extraction and PCR was optimal, and these conditions were used for all patient samples.
DNA was extracted from a 300‐microliter aliquot of pleural fluid using the MagMAX Total Nucleic Acid Isolation Kit (Ambion, Applied Biosystems) as described by the manufacturer. PCR was performed on an Applied Biosystems 7500 thermal cycler (ABI) using the primers, 16S F: 5‐GCT GTC ATC TCT TGT GGG CTG T‐3, 16S R: 5‐AAA CTC ATG GGA GCT GCT GGT T‐3, and the fluorescent labeled TaqMan probe, 16s Probe: 5‐Cy5/CCT GTC ATG CCC ACA CAA ATC TCT CC/BHQ‐2‐3. Human DNA (0.5 nanograms) was added to each assay to ensure that an adequate amount of human DNA was available to act as an internal amplification control. The primers, AlbICF: 5‐GCT GTC ATC TCT TGT GGG CTG T‐3, AlbICR: 5‐AAA CTC ATG GGA GCT GCT GGT T‐3, and the TaqMan probe, AlbICP: 5‐Cy5/CCT GTC ATG CCC ACA CAA ATC TCT CC/BHQ‐2‐3 detect a region of the human albumin gene. Amplification was performed as follows: initial denaturation of 94C for 20 seconds, followed by 35 cycles of 94C for 10 seconds, 61C for 31 seconds, and 72C for 5 seconds. Each run included positive (E. coli ATCC 25922 DNA) and negative (nuclease free water) controls. A cycle threshold value of 30 or less indicated a positive sample. All positive samples were confirmed using the MicroSeq 500 16S rDNA Bacterial Identification kit (Applied Biosystems).
- ,,, et al.An epidemiological investigation of a sustained high rate of pediatric parapneumonic empyema: risk factors and microbiological associations.Clin Infect Dis.2002;34:434–440.
- ,,,,.Primary early thoracoscopy and reduction in length of hospital stay and additional procedures among children with complicated pneumonia: results of a multicenter retrospective cohort study.Arch Pediatr Adolesc Med.2008;162:675–681.
- ,,, et al.Pulmonary manifestations in children with invasive community‐acquired Staphylococcus aureus infection.Clin Infect Dis.2005;41:583–590.
- ,,, et al.Association between Staphylococcus aureus strains carrying gene for Panton‐Valentine leukocidin and highly lethal necrotising pneumonia in young immunocompetent patients.Lancet.2002;359:753–759.
- ,,, et al.Severe community‐onset pneumonia in healthy adults caused by methicillin‐resistant Staphylococcus aureus carrying the Panton‐Valentine leukocidin genes.Clin Infect Dis.2005;40:100–107.
- ,.Empyema hospitalizations increased in US children despite pneumococcal conjugate vaccine.Pediatrics.2010;125:26–33.
- ,,,.Increasing incidence of empyema complicating childhood community‐acquired pneumonia in the United States.Clin Infect Dis.2010;50:805–813.
- ,,,,.National hospitalization trends for pediatric pneumonia and associated complications.Pediatrics.2010;126:204–213.
- ,,, et al.Thoracoscopic decortication vs tube thoracostomy with fibrinolysis for empyema in children: a prospective, randomized trial.J Pediatr Surg.2009;44:106–111.
- ,,, et al.Comparison of urokinase and video‐assisted thoracoscopic surgery for treatment of childhood empyema.Am J Respir Crit Care Med.2006;174:221–227.
- ,.Development of broad‐range 16S rDNA PCR for use in the routine diagnostic clinical microbiology service.J Med Microbiol.2003;52:685–691.
- ,,,.Empyema: the use of broad range 16S rDNA PCR for pathogen detection.Arch Dis Child.2005;90:70–73.
- ,,, et al.Microbiological diagnosis of empyema in children: comparative evaluations by culture, polymerase chain reaction, and pneumococcal antigen detection in pleural fluids.Clin Infect Dis.2006;42:1135–1140.
- ,,,.Determination of bacterial load by real‐time PCR using a broad‐range (universal) probe and primers set.Microbiology.2002;148:257–266.
- ,,,,,.Pneumolysin polymerase chain reaction for diagnosis of pneumococcal pneumonia and empyema in children.Eur J Clin Microbiol Infect Dis.2006;25:783–789.
- ,,, et al.Pleural fluid PCR method for detection of Staphylococcus aureus, Streptococcus pneumoniae and Haemophilus influenzae in pediatric parapneumonic effusions.Respiration.2008;75:437–442.
- ,.16S rRNA gene sequencing for bacterial identification in the diagnostic laboratory: pluses, perils, and pitfalls.J Clin Microbiol.2007;45:2761–2764.
- ,,,,.Evaluating the near‐term infant for early onset sepsis: progress and challenges to consider with 16S rDNA polymerase chain reaction testing.J Mol Diagn.2006;8:357–363.
- ,,,,.Preanalytic removal of human DNA eliminates false signals in general 16S rDNA PCR monitoring of bacterial pathogens in blood.Comp Immunol Microbiol Infect Dis.2009;32:207–219.
- ,,,,.Use of broad range16S rDNA PCR in clinical microbiology.J Microbiol Methods.2009;76:217–225.
- ,.Real‐time polymerase chain reaction for detecting bacterial DNA directly from blood of neonates being evaluated for sepsis.J Mol Diagn.2005;7:575–581.
Copyright © 2011 Society of Hospital Medicine

Insurance and LOS for Children With CAP
Disparities in patterns of care and outcomes for ambulatory‐care sensitive conditions remain a persistent problem for children.19 Many studies have focused on disparities in hospitalization rates and length of stay (LOS) related to asthma, however, few studies have focused on community‐acquired pneumonia (CAP) despite the fact that pneumonia is the most common, preventable, and potentially serious infection in childhood.10 Providers, payers, and families have a common interest in minimizing hospital LOS for different reasons (eg, minimizing costs, lost wages, exposure to antibiotic‐resistant bacteria), however, this interest is balanced against the potentially greater risk of readmission and adverse outcomes if LOS is inappropriately short. To date, the relationship between insurance status and LOS for CAP remains unexplored.
As in other conditions, substantial variation exists with respect to patterns of care and outcomes for children hospitalized with CAP.11 For example, children hospitalized in rural settings have a shorter LOS for pneumonia than those hospitalized in large urban settings.12 Children from racial/ethnic minorities tend to have higher rates of CAP‐associated complications, including death.11 Decades of prior studies have documented that uninsured children are less likely than insured children to make preventive care visits and obtain prescription medications, but differences in LOS or hospitalization rates between insured and uninsured children with CAP have not been studied.6, 8, 13, 14 Though imperfect, insurance status is 1 proxy for healthcare access, and current healthcare reform efforts aim to improve healthcare access and decrease socioeconomic gradients in health by increasing the number of insured American children. Nonetheless, quantifying the relationship between insurance status on LOS for children hospitalized with CAP is a first step towards understanding the influence of ambulatory care access on hospitalization for ambulatory‐care sensitive conditions.
The purpose of this study was to investigate the influence of insurance status and type on LOS for children hospitalized with CAP. In addition, we sought to determine if there were consistent trends over time in the association between insurance status and type with LOS for children hospitalized with CAP.
METHODS
Study Design and Data Source
This retrospective cross‐sectional study used data from the 1997, 2000, 2003, and 2006 Kids' Inpatient Database (KID). The KID is part of the Healthcare Cost and Utilization Project sponsored by the Agency for Healthcare Research and Quality (AHRQ). It is the only dataset on hospital use and outcomes specifically designed to study children's use of hospital services in the United States. The KID samples pediatric discharges from all community non‐rehabilitation hospitals in states participating in the Healthcare Cost and Utilization Project, using a complex stratification system, across pediatric discharge type and hospital characteristics. Community hospitals in the KID are defined as all non‐federal, short‐term, general and other specialty hospitals, including academic medical centers, obstetrics‐gynecology, otolaryngology, orthopedic, and children's hospitals. Federal hospitals, long‐term hospitals, psychiatric hospitals, alcohol/chemical dependency treatment facilities and hospitals units within institutions are excluded. Discharge‐level weights assigned to discharges within the stratum permit calculation of national estimates. Datasets, which each contain approximately 3 million discharges (unweighted), are released every 3 years beginning with 1997. The 2006 KID is the most recently available dataset and contains hospital administrative data from 38 states, representing 88.8% of the estimated US population.15 This study was considered exempt from review by the Committees for the Protection of Human Subjects at The Children's Hospital of Philadelphia.
Study Participants
Patients 18 years of age and younger were eligible for inclusion if they required hospitalization for CAP in 1997, 2000, 2003, or 2006. Using a previously validated algorithm, patients were considered as having CAP if they met 1 of 2 criteria: 1) International Classification of Diseases, 9th Revision, Clinical Modification (ICD‐9 CM) primary diagnosis code indicating pneumonia (480‐483, 485‐486), empyema (510), or pleurisy (511.0‐1, 511.9); or 2) primary diagnosis of pneumonia‐related symptom (eg, cough, fever, tachypnea) and secondary diagnosis of pneumonia, empyema or pleurisy. Pneumonia‐related symptoms included fever, respiratory abnormality unspecified, shortness of breath, tachypnea, wheezing, cough, hemoptysis, abnormal sputum, chest pain, and abnormal chest sounds.16 Because there is no specific ICD‐9 code for nosocomial pneumonia, this previously validated approach minimized such misclassification16 (eg, a child hospitalized following traumatic injury who then develops ventilator‐associated pneumonia is likely to have trauma, rather than pneumonia or a pneumonia‐related symptom, listed as the primary diagnosis). Patients with the following comorbid conditions (identified by KID data elements and ICD‐9 CM codes) were excluded as these comorbidities are characterized by risk factors not reflective of the general pediatric population: acquired and congenital immunologic disorders, malignancy, collagen vascular disease, sickle cell disease, cystic fibrosis, organ transplant, congenital heart defects, and heart failure. Patients identified as in‐hospital births were excluded to minimize the inclusion of perinatally acquired and nosocomial infections occurring in neonates. Patients with a secondary diagnosis code indicating trauma were also excluded, as a diagnosis of pneumonia in this population likely reflects nosocomial etiology. CAP‐related complications (eg, effusion, abscess; for complete list, see Supporting Appendix A in the online version of this article) were identified using ICD‐9 CM diagnosis and procedure codes. Asthma‐related hospitalizations were identified using ICD‐9 CM diagnosis code 493 in any secondary diagnosis field.
Primary Exposure
The primary exposure was insurance type, categorized as private, public, uninsured, or other (eg, Civilian Health and Medical Program Uniform Service (CHAMPUS), worker's compensation, union‐based insurance, but definition varies by state precluding categorization as purely public or private).
Primary Outcome
The primary outcome was the hospital LOS calculated in days.
Statistical Analysis
Consistent with prior work,12 subjects were characterized by age, race, sex, the presence or absence of a pneumonia‐associated complication, discharge status (discharge from hospital vs in‐hospital death), hospital type (rural, urban non‐teaching, urban teaching non‐children's, urban teaching children's), and hospital region (Northeast, Midwest, South, West). Age groups for analysis were defined as <1 year (infant), 1 to 5 years (preschool age), 6 to 11 years (school‐age), and 12 to 18 years old (adolescent). Race was recorded as a single variable (white, black, other, and missing). Patient information for race was missing from 32% of discharges in 1997, 18% in 2000, 29% in 2003, and 26% in 2006. Patients with missing race data were included to preserve the integrity of our estimates. Categorical variables were summarized by frequencies and percents. Continuous variables were summarized by mean and standard deviation values.
All analyses accounted for the complex sampling design with the survey commands included in STATA, version 10 (College Station, TX) to produce weighted estimates. To determine the adjusted impact of patient and hospital‐level characteristics in our cohort, we constructed multivariable negative binomial regression models using all available covariates for LOS because of its rightward‐skewed distribution. The negative binomial model produced an incident rate ratio (IRR) for LOS (IRR >1 indicates that the risk factor is associated with a longer length of stay). As recommended in the AHRQ technical documentation, variance estimates for each model accounted for the clustering of data at the hospital level. To address the impact of missing race data on outcome, we constructed additional multivariable negative binomial regression models while varying the underlying assumptions about race classification. In these secondary analyses, children with race coded as missing were sequentially excluded, assumed to be white, and assumed to be black. These analyses were repeated after excluding insurance from the multivariable model.
RESULTS
The more than 10.5 million children sampled (unweighted) in KID during these 4 time periods (1997, 2000, 2003, and 2006) are representative of the more than 28.9 million children hospitalized in the United States. In each of these sample years, there were approximately 150,000 children hospitalized with pneumonia across the United States (Table 1). Of those hospitalized, 23% to 28% had a concomitant diagnosis of asthma; 6% to 8% had a pneumonia‐associated complication; and mortality was <0.01% in each sample year for patients hospitalized with pneumonia. In all years, among those with racial/ethnic data, the sample population was predominantly white boys less than 6 years old. The greatest proportion of children were hospitalized in urban non‐teaching settings, and also those children living in the southern regions of the United States.
| 1997 | 2000 | 2003 | 2006 | |
|---|---|---|---|---|
| N = 148,702 | N = 157,847 | N = 157,743 | N = 156,810 | |
| ||||
| Race | ||||
| White | 56,348 (38) | 68,643 (44) | 54,903 (35) | 56,108 (36) |
| Black | 22,864 (15) | 22,580 (14) | 17,960 (11) | 18,800 (12) |
| Other | 22,203 (15) | 38,448 (24) | 39,138 (25) | 40,803 (26) |
| Missing | 47,287 (32) | 28,175 (18) | 45,588 (29) | 41,099 (26) |
| Age category | ||||
| <1 year | 43,851 (29) | 44,470 (28) | 37,798 (24) | 37,705 (24) |
| 1 through 5 years | 75,033 (50) | 76,385 (48) | 77,530 (49) | 79,519 (51) |
| 6 through 11 years | 19,372 (13) | 21,403 (14) | 23,126 (15) | 23,494 (15) |
| >12 years | 10,446 (7) | 15,589 (9) | 19,289 (12) | 16,092 (10) |
| Hospital type | ||||
| Urban non‐teaching | 52,756 (35) | 50,718 (32) | 52,552 (34) | 50,718 (32) |
| Rural | 47,910 (32) | 41,715 (27) | 39,605 (26) | 31,947 (21) |
| Urban teaching non‐children's | 20,378 (14) | 30,981 (20) | 28,432 (18) | 30,194 (20) |
| Urban teaching children's | 27,658 (19) | 34,021 (22) | 34,454 (22) | 41,035 (27) |
| Male sex | 83,291 (56) | 8,783 (56) | 86,034 (55) | 85,508 (55) |
| Region* | ||||
| Northeast | 19,750 (13) | 26,092 (17) | 23,867 (15) | 23,832 (15) |
| Midwest | 33,053 (22) | 30,706 (19) | 35,714 (23) | 35,900 (23) |
| South | 68,958 (46) | 68,663 (44) | 65,994 (42) | 65,460 (42) |
| West | 26,741 (18) | 32,385 (21) | 32,169 (20) | 31,618 (20) |
| Asthma | 26,971 (24) | 31,746 (28) | 27,729 (24) | 26,822 (23) |
| Pneumonia‐associated complication | 8,831 (6) | 11,084 (7) | 12,005 (8) | 11,724 (7) |
| Died | 334 (0.002) | 394 (0.002) | 270 (0.002) | 193 (0.001) |
| Insurance | ||||
| Private | 65,428 (44) | 73,528 (47) | 68,720 (44) | 63,997 (41) |
| Public | 68,024 (46) | 71,698 (45) | 76,779 (49) | 80,226 (51) |
| Uninsured | 9,922 (7) | 8,336 (5) | 6,381 (4) | 6,912 (4) |
| Other | 4,964 (3) | 4,285 (3) | 5,391 (3) | 5,283 (3) |
There was little variation in the insurance status of children hospitalized with CAP between 1997 and 2006. In each of the sampled years, at least 40% of sampled children were privately insured, at least 40% were publicly insured, and approximately 5% were uninsured (Table 1). In all years, there were significant racial/ethnic disparities in insurance coverage such that whites were 4 to 6 times more likely to have private insurance than blacks, however, the large amount of missing race/ethnicity data warrant caution in interpreting this finding (Table 2; also see Supporting Information Appendix B in the online version of this article). We also found that children less than 1 year old were the most likely to be publicly insured in all years (see Supporting Appendix C in the online version of this article). There were also regional differences related to insurance coverage such that a greater proportion of children hospitalized in facilities located in the southern part of the United States were publicly insured. Notably, there were no significant differences in CAP‐associated mortality or asthma related to insurance coverage (Table 2). In 2006, CAP‐associated complications occurred in 8.5% of children with private insurance, 6.5% of children with public insurance, and 7.7% of uninsured children; the relative distribution of complications by insurance type were similar in previous years of the KID survey.
| Private | Public | Uninsured | Other Insurance | P | |
|---|---|---|---|---|---|
| |||||
| No. of children (%) | 63,997 (41) | 80,226 (51) | 6,912 (4) | 5,283 (3) | |
| Male sex | 34,639 (41) | 44,140 (52) | 3,727 (4) | 2,808 (3) | 0.092 |
| Race | |||||
| White | 30,707 (55) | 21,282 (38) | 2,241 (4) | 1,774 (3) | <0.001 |
| Black* | 5,112 (27) | 12,239 (65) | 988 (5) | 426 (3) | |
| Other | 11,033 (27) | 26,489 (65) | 2,112 (5) | 1,076 (3) | |
| Missing | 17,145 (42) | 20,216 (49) | 1,572 (4) | 2,007 (4) | |
| Age category | |||||
| <1 year | 10,788 (29) | 24,762 (65) | 1,164 (3) | 880 (3) | <0.001 |
| 1 through 5 years | 33,664 (42) | 39,531 (50) | 3,442 (4) | 2,673 (3) | |
| 6 through 11 years | 11,660 (50) | 9,684 (41) | 1,085 (5) | 1,015 (4) | |
| >12 years | 7,885 (49) | 6,249 (39) | 1,221 (8) | 714 (4) | |
| Hospital type | |||||
| Urban non‐teaching | 22,429 (44) | 24,241 (49) | 2,440 (5) | 1,555 (2) | <0.001 |
| Rural | 10,880 (34) | 18,396 (58) | 1,290 (4) | 1,109 (3) | |
| Urban teaching non‐children's | 13,130 (44) | 14,542 (48) | 1,721 (6) | 750 (2) | |
| Urban teaching children's | 16,591 (40) | 21,544 (53) | 1,417 (3) | 1,465 (4) | |
| Region | |||||
| Northeast | 12,364 (52) | 9,620 (40) | 1,466 (6) | 377 (2) | <0.001 |
| Midwest∥ | 17,891 (50) | 15,573 (43) | 1,160 (3) | 1,215 (3) | |
| South∥ | 21,479 (33) | 38,112 (58) | 3,108 (5) | 2,495 (4) | |
| West∥ | 12,263 (39) | 16,921 (44) | 1,178 (5) | 1,195 (5) | |
| Asthma | 10,829 (41) | 13,923 (52) | 1,119 (4) | 866 (3) | 0.193 |
| Pneumonia‐associated complication | 5,416 (46) | 5,206 (45) | 532 (4) | 556 (5) | <0.001 |
| Died | 66 (34) | 115 (60) | 3 (1) | 8 (5) | 0.131 |
After examining the general and demographic characteristics, we then examined mean LOS for all children with CAP in each sample year (Table 3). The mean LOS for children with CAP was 3.44 days in 1997, with marginal decreases in subsequent years to a mean LOS of 3.18 days in 2006. The distribution of LOS for children with CAP revealed that nearly 70% of children were hospitalized for fewer than 3 days, another 22% to 28% were hospitalized for less than 1 week, and only 3% were hospitalized for more than 1 week. This distribution did not change substantially between 1997 and 2006. Next, we compared mean LOS by insurance type and race/ethnicity in unadjusted analyses. In each sample year, publicly insured children hospitalized with CAP had significantly longer LOS than privately insured children (P < 0.001). Similarly, in all years excepting 1997, uninsured children hospitalized with CAP had significantly shorter LOS than privately insured children. There were also significant racial differences in LOS for children with CAP, such that black children had longer LOS than white children with CAP. However, the large amount of missing data for race/ethnicity limited the robustness of this finding, and subsequent sensitivity analyses demonstrated that there were no consistent racial/ethnic disparities in LOS (see Supporting Appendix B in the online version of this article). These sensitivity analyses for missing race data did not alter our primary finding of shorter LOS for uninsured versus publicly or privately insured children.
| 1997 | P | 2000 | P | 2003 | P | 2006 | P | |
|---|---|---|---|---|---|---|---|---|
| ||||||||
| Overall | 3.44 (0.04) | 3.35 (0.05) | 3.27 (0.05) | 3.18 (0.04) | ||||
| Insurance type | ||||||||
| Private | 3.21 (0.04) | 3.19 (0.04) | 3.09 (0.04) | 3.00 (0.03) | ||||
| Public | 3.71 (0.06) | <0.001 | 3.57 (0.06) | <0.001 | 3.44 (0.06) | <0.001 | 3.34 (0.05) | <0.001 |
| Uninsured | 3.18 (0.14) | 0.792 | 2.92 (0.07) | <0.001 | 2.80 (0.05) | <0.001 | 2.82 (0.05) | <0.001 |
| Other | 3.32 (0.11) | 0.319 | 3.55 (0.14) | 0.0134 | 3.54 (0.21) | 0.037 | 3.42 (0.13) | 0.001 |
| Race | ||||||||
| White | 3.31 (0.05) | 3.18 (0.04) | 3.19 (0.05) | 3.10 (0.04) | ||||
| Black | 3.61 (0.08) | <0.001 | 3.32 (0.07) | <0.001 | 3.36 (0.08) | <0.001 | 3.31 (0.07) | <0.001 |
| Other | 3.96 (0.11) | <0.001 | 3.81 (0.09) | <0.001 | 3.67 (0.10) | <0.001 | 3.56 (0.08) | <0.001 |
| Missing | 3.27 (0.08) | 0.645 | 3.18 (0.08) | 0.926 | 2.99 (0.06) | 0.0134 | 2.86 (0.04) | <0.001 |
After controlling for child age, race/ethnicity, gender, hospital type, transfer status, and presence of asthma or pneumonia‐associated complications, our multivariable analyses examining the relationship between insurance coverage and hospital LOS yielded the following results (Table 4). First, publicly insured children had significantly longer hospital stays than privately insured children, and uninsured children had significantly shorter hospital stays than privately insured children in all years except 1997. Second, children admitted with CAP at urban teaching children's hospitals had significantly longer LOS than those admitted to urban non‐teaching hospitals, and, in 2003, children admitted with CAP to rural hospitals had significantly shorter LOS than those admitted to urban non‐teaching hospitals. Third, children older than 1 year consistently had shorter hospital stays than infants less than 1 year old. Finally, though concomitant diagnosis of asthma did not consistently influence LOS, children who developed any complications had significantly longer LOS than those who did not. The cumulative impact of seemingly small differences in LOS is great. For example, in 2006, our model suggests that, for every 1000 children hospitalized with CAP in a given year, after adjusting for differences in sex, age, race, hospital‐type, region, transfer status, and diagnosis of asthma or complications, publicly insured children spend 90 to 130 more days in the hospital than privately insured children, whereas uninsured children spend between 40 to 90 fewer days in the hospital than privately insured children.
| 1997 | 2000 | 2003 | 2006 | |
|---|---|---|---|---|
| Variable | IRR (95% CI) | IRR (95% CI) | IRR (95% CI) | IRR (95% CI) |
| ||||
| Age category | ||||
| <1 year | ||||
| 15 years | 0.82 (0.81, 0.84) | 0.83 (0.88, 0.95) | 0.86 (0.85, 0.88) | 0.87 (0.86, 0.89) |
| 611 years | 0.91 (0.87, 0.95) | 0.91 (0.88, 0.94) | 0.93 (0.91, 0.95) | 0.93 (0.90, 0.95) |
| >12 years | 1.03 (0.99, 1.07) | 1.17 (1.11, 1.22) | 1.09 (1.06, 1.13) | 1.13 (1.09, 1.16) |
| Race | ||||
| White | ||||
| Black | 1.04 (0.99, 1.08) | 1.00 (0.95, 1.03) | 1.00 (0.98, 1.03) | 1.02 (0.98, 1.06) |
| Other | 1.09 (1.05, 1.13) | 1.11 (1.08, 1.15) | 1.09 (1.06, 1.12) | 1.08 (1.05, 1.11) |
| Missing | 1.00 (0.94, 1.06) | 1.01 (0.96, 1.06) | 0.95 (0.92, 0.99)* | 0.96 (0.93, 0.99) |
| Sex | ||||
| Female | 1.02 (0.94, 1.06) | 1.01 (0.99, 1.02) | 1.01(0.93, 100) | 1.01 (1.00, 1.02) |
| Insurance type | ||||
| Private | ||||
| Public | 1.13 (1.11, 1.16) | 1.11 (1.09, 1.14) | 1.11 (1.09, 1.13) | 1.11 (1.09, 1.13) |
| Uninsured | 1.01 (0.91, 1.11) | 0.93 (0.89, 0.96) | 0.92 (0.90, 0.96) | 0.94 (0.91, 0.96) |
| Other | 1.01 (0.96, 1.06) | 1.10 (1.03, 1.18) | 1.10 (1.02, 1.19)* | 1.07 (1.02, 1.13) |
| Hospital type | ||||
| Urban non‐teaching | ||||
| Rural | 0.98 (0.92, 1.04) | 0.96 (0.92, 1.00) | 0.97 (0.94, 1.00) | 0.97 (0.93, 1.00) |
| Urban teaching (non‐children's) | 0.99 (0.95, 1.04) | 1.06 (1.02, 1.10) | 1.06 (1.02, 1.10) | 1.03 (0.99, 1.07) |
| Urban teaching children's | 1.2 (1.14, 1.26) | 1.23 (1.16, 1.30) | 1.28 (1.21, 1.37) | 1.25 (1.19, 1.31) |
| Region | ||||
| Northeast | ||||
| Midwest | 0.93 (0.88, 0.98)* | 0.96 (0.92, 1.00) | 0.95 (0.91, 0.99)* | 0.95 (0.91, 0.99)* |
| South | 0.98 (0.94, 1.02) | 1.06 (1.02, 1.10)* | 1.04 (1.00, 1.09) | 1.03 (0.98, 1.08) |
| West | 0.97 (0.92, 1.01) | 1.22 (1.16, 1.30)* | 1.02 (0.97, 1.08) | 1.06 (1.00, 1.12)* |
| Transfer status | ||||
| Transfer | 1.35 (1.25, 1.46) | 1.39 (1.27, 1.52) | 1.31 (1.23, 1.37 ) | 1.16 (1.10, 1.23) |
| Asthma | 0.99 (0.96, 1.03) | 0.97 (0.95, 0.99) | 0.98 (0.96, 1.00) | 0.98 (0.97, 1.00)* |
| Pneumonia Complications | 0.99 (0.96, 1.03) | 0.97 (0.95, 0.99)* | 0.98 (0.96, 1.0) | 0.98 (0.97, 1.00)* |
| Any complication | 2.20 (2.07, 2.34) | 2.23 (2.07, 2.40) | 2.22 (2.22, 2.44) | 2.37 (2.27, 2.47) |
DISCUSSION
In this nationally representative sample selected over the past 10 years, we found that publicly insured children hospitalized with CAP have significantly longer LOS than those who are privately insured, and that, since 2000, uninsured children hospitalized with CAP have significantly shorter LOS than those who are privately insured. Though these observed differences are small, they are consistent across all 4 sampled years and, because CAP is one of the most common pediatric inpatient diagnoses, the cumulative impact of the observed differences on hospital LOS is great. Insurance status is often considered a proxy for access to preventive and ambulatory healthcare services or socioeconomic status. However, the underlying mechanisms relating insurance status to healthcare access, utilization, and ultimately, health outcomes are highly complex and difficult to elucidate.17 The observed variation in this study raises questions about the potential influence of insurance status on hospital discharge practices. Additional research is necessary to understand whether there are differences in processes of care (eg, performance of blood cultures or chest radiographs), quality of care, or other outcomes, such as readmissions, related to CAP inpatient management for children with different insurance coverage.
Apart from differences in hospital discharge practices, another possible explanation for uninsured children with CAP having shorter LOS is that these children have less severe disease than privately insured. This may occur if uninsured children with CAP are evaluated in the emergency department rather than the office setting, because emergency department providers may be more likely to admit children with CAP who lack a consistent access to ambulatory primary care services. Countering this alternative, prior studies have shown that uninsured groups are more likely to have greater disease severity than privately insured groups at the time of hospital admission.18, 19 In this study, we attempted to identify children with greater severity of disease using ICD‐9 codes for CAP‐associated complications. Though this is a relatively crude method that might lead to an underestimate of the total number of children with complications, we found that there were no significant differences in the prevalence of CAP‐associated complications between uninsured and insured groups in all sampled years.
On the other hand, uninsured patients may be released earlier by providers in order to reduce the amount of uncompensated care provided, or possibly because parents may urge providers to discharge their children, given their inability to pay forthcoming hospital bills and/or avoid further lost wages due to work absence.20, 21 In California, Bindman et al. demonstrated that decreasing the frequency of Medicaid recertification, and consequently increasing the likelihood of continuous insurance coverage, was associated with a decreased risk of hospitalization for ambulatory‐care sensitive conditions.5
We also found that children admitted to urban teaching children's hospitals with CAP had significantly longer LOS than those admitted to urban non‐teaching hospitals, whereas children in rural hospitals had significantly shorter LOS than those in urban non‐teaching hospitals in 2003. These findings are consistent with prior data from 1996 to1998 demonstrating that children admitted to rural hospitals in New York and Pennsylvania had significantly shorter LOS than large urban hospitals for 19 medical and 9 surgical conditions, including pneumonia.12 These findings may reflect underlying differences in between rural and urban hospital transfer practices, whereby rural hospitals may be more likely than urban hospitals to transfer children with relatively more severe illness to urban referral centers and retain children with less severe illness, leading to shorter LOS.12 Though our empiric understanding of differences in LOS between teaching and non‐teaching hospitals is currently limited, clinical experience supports the notion that there may be decreases in efficiency that occur in teaching hospitals, and are a result of the supervision required for care provided by trainees. It is also possible that, despite our exclusion of comorbid conditions, some children with complex or chronic medical conditions were included in this study. These children are often cared for at teaching hospitals, regardless of the primary cause for admission, and are more likely to have public insurance than other children, thus confounding the relationship between hospital type, insurance type and status, and LOS for children with CAP. The limitations of this dataset preclude further examination of this issue.
There are some limitations to this study. First, the KID data are cross‐sectional and causal inferences are limited. However, our results demonstrating that uninsured children hospitalized with CAP had shorter LOS than privately insured children were quite consistent in each sample year, suggesting that our results are a true association. Additionally, insurance status in KID is typically collected at admission, however, it is not possible to determine whether specific changes to insurance status that occurred during the hospitalization were applied to the data. The impact of this limitation would depend on the type of insurance obtained by the patient. If uninsured patients obtained public insurance, our study would underestimate the increased LOS for publicly insured patients, compared with privately insured patients, but have no effect on the difference in LOS between uninsured and privately insured patients. In the unlikely event that uninsured patients obtained private insurance, then our study would underestimate the difference for uninsured patients, compared with privately insured patients, biasing our current study results towards the null. Second, a substantial proportion of sampled children had missing data for race/ethnicity. To assess the impact of the missing race/ethnicity data on our results, we conducted sensitivity analyses and found that, though difficult to make any definitive conclusions about the relationship between race/ethnicity and LOS for children with CAP, there were no changes to our primary findings regarding differences in LOS between children with different insurance status and type. Third, KID does not include data about other unmeasured confounders (eg, parent income, parent education, regular source of care) that might be related to LOS, as well as a broad spectrum of pediatric outcomes. Serious consideration of expanding KID to include these variables is warranted. Fourth, the other category of insurance is not uniformly coded across states in the KID database. While some states use this category to classify public insurance options other than Medicare and Medicaid, other states include private insurance options in this group. Thus, it is possible that some patients with public insurance are misclassified as having other insurance. We would expect such misclassification to bias our findings towards the null hypothesis. Finally, we focused on the relationship between child health insurance status and CAP, only 1 ambulatory care‐sensitive condition. Additional research examining the relationship between insurance type and other ambulatory care‐sensitive conditions is warranted.
In summary, we found that, after multivariable adjustment, uninsured children hospitalized with community‐acquired pneumonia had significantly shorter LOS than privately insured children, and publicly insured children had a significantly longer hospital stay than privately insured children in these 4 nationally representative samples from 1997 to 2006. Current federal and state efforts to increase enrollment of children into insurance programs are a first step in reducing healthcare disparities. However, insurance coverage alone does not guarantee access to healthcare, thus, these efforts in isolation will likely be insufficient to achieve optimal health for the children of our country. As healthcare reform legislation is implemented, these findings provide hospitals and policy makers additional impetus to develop ways to achieve the ideal length of stay for every child; this ideal state will be achieved when clinical status and course, rather than nonclinical factors such as insurance type or provider's unease with ambulatory follow‐up, determine the duration of hospitalization for every child.
- ,,,,,.Recurrent urinary tract infections in children: risk factors and association with prophylactic antimicrobials.JAMA.2007;298:179–186.
- ,.Factors associated with variability in outcomes for children hospitalized with urinary tract infection.J Pediatr.2009;154:789–796.
- ,,,,.Intravenous immunoglobulin in children with streptococcal toxic shock syndrome.Clin Infect Dis.2009;49:1369–1376.
- ,,.Pediatric hospital adherence to the standard of care for acute gastroenteritis.Pediatrics.2009;124:e1081–e1087.
- ,,.Medicaid re‐enrollment policies and children's risk of hospitalizations for ambulatory care sensitive conditions.Med Care.2008;46:1049–1054.
- ,.Differences associated with age, transfer status, and insurance coverage in end‐of‐life hospital care for children.J Hosp Med.2008;3:376–383.
- ,,,,,.Health care for children and youth in the United States: annual report on patterns of coverage, utilization, quality, and expenditures by a county level of urban influence.Ambul Pediatr.2006;6:241–264.
- ,,.Lengths of stay and costs associated with children's hospitals.Pediatrics.2005;115:839–844.
- ,.Variation in hospital discharges for ambulatory care‐sensitive conditions among children.Pediatrics.2000;106:942–948.
- ,,,,,.Ambulatory visit rates and antibiotic prescribing for children with pneumonia, 1994–2007.Pediatrics.2011;127:411–418.
- ,,,,.Patterns of hospital‐based pediatric care across diverse ethnicities: the case of pneumonia.J Health Care Poor Underserved.2004;15:462–473.
- ,,,,.Equivalent lengths of stay of pediatric patients hospitalized in rural and nonrural hospitals.Pediatrics.2004;114:e400–e408.
- ,.Effect of Child Health Insurance Plan enrollment on the utilization of health care services by children using a public safety net system.Pediatrics.2002;110:940–945.
- ,,,,,.Relationships between welfare status, health insurance status, and health and medical care among children with asthma.Am J Public Health.2002;92:1446–1452.
- HCUP Kids' Inpatient Database (KID). Healthcare Cost and Utilization Project (HCUP), 1997, 2000, 2003, 2006. Agency for Healthcare Research and Quality. Available at: http://www.hcup‐us.ahrq.gov/kidoverview.jsp. Accessed May 17,2010.
- ,,, et al.Community‐acquired pneumonia: can it be defined with claims data?Am J Med Qual.1997;12:187–193.
- .Sicker and poorer—the consequences of being uninsured: a review of the research on the relationship between health insurance, medical care use, health, work, and income.Med Care Res Rev.2003;60:3S–75S; discussion76S–112S.
- ,,,,,.Socioeconomic variation in asthma hospitalization: excess utilization or greater need?Pediatrics.1999;103:e75.
- ,,, et al.Analysis of 23 million US hospitalizations: uninsured children have higher all‐cause in‐hospital mortality.J Public Health (Oxf).2010;32(2)236–244.
- ,.The impact of welfare reform on parents' ability to care for their children's health.Am J Public Health.1999;89:502–505.
- ,,.Knowledge of welfare reform program provisions among families of children with chronic conditions.Am J Public Health.2002;92:228–230.
Disparities in patterns of care and outcomes for ambulatory‐care sensitive conditions remain a persistent problem for children.19 Many studies have focused on disparities in hospitalization rates and length of stay (LOS) related to asthma, however, few studies have focused on community‐acquired pneumonia (CAP) despite the fact that pneumonia is the most common, preventable, and potentially serious infection in childhood.10 Providers, payers, and families have a common interest in minimizing hospital LOS for different reasons (eg, minimizing costs, lost wages, exposure to antibiotic‐resistant bacteria), however, this interest is balanced against the potentially greater risk of readmission and adverse outcomes if LOS is inappropriately short. To date, the relationship between insurance status and LOS for CAP remains unexplored.
As in other conditions, substantial variation exists with respect to patterns of care and outcomes for children hospitalized with CAP.11 For example, children hospitalized in rural settings have a shorter LOS for pneumonia than those hospitalized in large urban settings.12 Children from racial/ethnic minorities tend to have higher rates of CAP‐associated complications, including death.11 Decades of prior studies have documented that uninsured children are less likely than insured children to make preventive care visits and obtain prescription medications, but differences in LOS or hospitalization rates between insured and uninsured children with CAP have not been studied.6, 8, 13, 14 Though imperfect, insurance status is 1 proxy for healthcare access, and current healthcare reform efforts aim to improve healthcare access and decrease socioeconomic gradients in health by increasing the number of insured American children. Nonetheless, quantifying the relationship between insurance status on LOS for children hospitalized with CAP is a first step towards understanding the influence of ambulatory care access on hospitalization for ambulatory‐care sensitive conditions.
The purpose of this study was to investigate the influence of insurance status and type on LOS for children hospitalized with CAP. In addition, we sought to determine if there were consistent trends over time in the association between insurance status and type with LOS for children hospitalized with CAP.
METHODS
Study Design and Data Source
This retrospective cross‐sectional study used data from the 1997, 2000, 2003, and 2006 Kids' Inpatient Database (KID). The KID is part of the Healthcare Cost and Utilization Project sponsored by the Agency for Healthcare Research and Quality (AHRQ). It is the only dataset on hospital use and outcomes specifically designed to study children's use of hospital services in the United States. The KID samples pediatric discharges from all community non‐rehabilitation hospitals in states participating in the Healthcare Cost and Utilization Project, using a complex stratification system, across pediatric discharge type and hospital characteristics. Community hospitals in the KID are defined as all non‐federal, short‐term, general and other specialty hospitals, including academic medical centers, obstetrics‐gynecology, otolaryngology, orthopedic, and children's hospitals. Federal hospitals, long‐term hospitals, psychiatric hospitals, alcohol/chemical dependency treatment facilities and hospitals units within institutions are excluded. Discharge‐level weights assigned to discharges within the stratum permit calculation of national estimates. Datasets, which each contain approximately 3 million discharges (unweighted), are released every 3 years beginning with 1997. The 2006 KID is the most recently available dataset and contains hospital administrative data from 38 states, representing 88.8% of the estimated US population.15 This study was considered exempt from review by the Committees for the Protection of Human Subjects at The Children's Hospital of Philadelphia.
Study Participants
Patients 18 years of age and younger were eligible for inclusion if they required hospitalization for CAP in 1997, 2000, 2003, or 2006. Using a previously validated algorithm, patients were considered as having CAP if they met 1 of 2 criteria: 1) International Classification of Diseases, 9th Revision, Clinical Modification (ICD‐9 CM) primary diagnosis code indicating pneumonia (480‐483, 485‐486), empyema (510), or pleurisy (511.0‐1, 511.9); or 2) primary diagnosis of pneumonia‐related symptom (eg, cough, fever, tachypnea) and secondary diagnosis of pneumonia, empyema or pleurisy. Pneumonia‐related symptoms included fever, respiratory abnormality unspecified, shortness of breath, tachypnea, wheezing, cough, hemoptysis, abnormal sputum, chest pain, and abnormal chest sounds.16 Because there is no specific ICD‐9 code for nosocomial pneumonia, this previously validated approach minimized such misclassification16 (eg, a child hospitalized following traumatic injury who then develops ventilator‐associated pneumonia is likely to have trauma, rather than pneumonia or a pneumonia‐related symptom, listed as the primary diagnosis). Patients with the following comorbid conditions (identified by KID data elements and ICD‐9 CM codes) were excluded as these comorbidities are characterized by risk factors not reflective of the general pediatric population: acquired and congenital immunologic disorders, malignancy, collagen vascular disease, sickle cell disease, cystic fibrosis, organ transplant, congenital heart defects, and heart failure. Patients identified as in‐hospital births were excluded to minimize the inclusion of perinatally acquired and nosocomial infections occurring in neonates. Patients with a secondary diagnosis code indicating trauma were also excluded, as a diagnosis of pneumonia in this population likely reflects nosocomial etiology. CAP‐related complications (eg, effusion, abscess; for complete list, see Supporting Appendix A in the online version of this article) were identified using ICD‐9 CM diagnosis and procedure codes. Asthma‐related hospitalizations were identified using ICD‐9 CM diagnosis code 493 in any secondary diagnosis field.
Primary Exposure
The primary exposure was insurance type, categorized as private, public, uninsured, or other (eg, Civilian Health and Medical Program Uniform Service (CHAMPUS), worker's compensation, union‐based insurance, but definition varies by state precluding categorization as purely public or private).
Primary Outcome
The primary outcome was the hospital LOS calculated in days.
Statistical Analysis
Consistent with prior work,12 subjects were characterized by age, race, sex, the presence or absence of a pneumonia‐associated complication, discharge status (discharge from hospital vs in‐hospital death), hospital type (rural, urban non‐teaching, urban teaching non‐children's, urban teaching children's), and hospital region (Northeast, Midwest, South, West). Age groups for analysis were defined as <1 year (infant), 1 to 5 years (preschool age), 6 to 11 years (school‐age), and 12 to 18 years old (adolescent). Race was recorded as a single variable (white, black, other, and missing). Patient information for race was missing from 32% of discharges in 1997, 18% in 2000, 29% in 2003, and 26% in 2006. Patients with missing race data were included to preserve the integrity of our estimates. Categorical variables were summarized by frequencies and percents. Continuous variables were summarized by mean and standard deviation values.
All analyses accounted for the complex sampling design with the survey commands included in STATA, version 10 (College Station, TX) to produce weighted estimates. To determine the adjusted impact of patient and hospital‐level characteristics in our cohort, we constructed multivariable negative binomial regression models using all available covariates for LOS because of its rightward‐skewed distribution. The negative binomial model produced an incident rate ratio (IRR) for LOS (IRR >1 indicates that the risk factor is associated with a longer length of stay). As recommended in the AHRQ technical documentation, variance estimates for each model accounted for the clustering of data at the hospital level. To address the impact of missing race data on outcome, we constructed additional multivariable negative binomial regression models while varying the underlying assumptions about race classification. In these secondary analyses, children with race coded as missing were sequentially excluded, assumed to be white, and assumed to be black. These analyses were repeated after excluding insurance from the multivariable model.
RESULTS
The more than 10.5 million children sampled (unweighted) in KID during these 4 time periods (1997, 2000, 2003, and 2006) are representative of the more than 28.9 million children hospitalized in the United States. In each of these sample years, there were approximately 150,000 children hospitalized with pneumonia across the United States (Table 1). Of those hospitalized, 23% to 28% had a concomitant diagnosis of asthma; 6% to 8% had a pneumonia‐associated complication; and mortality was <0.01% in each sample year for patients hospitalized with pneumonia. In all years, among those with racial/ethnic data, the sample population was predominantly white boys less than 6 years old. The greatest proportion of children were hospitalized in urban non‐teaching settings, and also those children living in the southern regions of the United States.
| 1997 | 2000 | 2003 | 2006 | |
|---|---|---|---|---|
| N = 148,702 | N = 157,847 | N = 157,743 | N = 156,810 | |
| ||||
| Race | ||||
| White | 56,348 (38) | 68,643 (44) | 54,903 (35) | 56,108 (36) |
| Black | 22,864 (15) | 22,580 (14) | 17,960 (11) | 18,800 (12) |
| Other | 22,203 (15) | 38,448 (24) | 39,138 (25) | 40,803 (26) |
| Missing | 47,287 (32) | 28,175 (18) | 45,588 (29) | 41,099 (26) |
| Age category | ||||
| <1 year | 43,851 (29) | 44,470 (28) | 37,798 (24) | 37,705 (24) |
| 1 through 5 years | 75,033 (50) | 76,385 (48) | 77,530 (49) | 79,519 (51) |
| 6 through 11 years | 19,372 (13) | 21,403 (14) | 23,126 (15) | 23,494 (15) |
| >12 years | 10,446 (7) | 15,589 (9) | 19,289 (12) | 16,092 (10) |
| Hospital type | ||||
| Urban non‐teaching | 52,756 (35) | 50,718 (32) | 52,552 (34) | 50,718 (32) |
| Rural | 47,910 (32) | 41,715 (27) | 39,605 (26) | 31,947 (21) |
| Urban teaching non‐children's | 20,378 (14) | 30,981 (20) | 28,432 (18) | 30,194 (20) |
| Urban teaching children's | 27,658 (19) | 34,021 (22) | 34,454 (22) | 41,035 (27) |
| Male sex | 83,291 (56) | 8,783 (56) | 86,034 (55) | 85,508 (55) |
| Region* | ||||
| Northeast | 19,750 (13) | 26,092 (17) | 23,867 (15) | 23,832 (15) |
| Midwest | 33,053 (22) | 30,706 (19) | 35,714 (23) | 35,900 (23) |
| South | 68,958 (46) | 68,663 (44) | 65,994 (42) | 65,460 (42) |
| West | 26,741 (18) | 32,385 (21) | 32,169 (20) | 31,618 (20) |
| Asthma | 26,971 (24) | 31,746 (28) | 27,729 (24) | 26,822 (23) |
| Pneumonia‐associated complication | 8,831 (6) | 11,084 (7) | 12,005 (8) | 11,724 (7) |
| Died | 334 (0.002) | 394 (0.002) | 270 (0.002) | 193 (0.001) |
| Insurance | ||||
| Private | 65,428 (44) | 73,528 (47) | 68,720 (44) | 63,997 (41) |
| Public | 68,024 (46) | 71,698 (45) | 76,779 (49) | 80,226 (51) |
| Uninsured | 9,922 (7) | 8,336 (5) | 6,381 (4) | 6,912 (4) |
| Other | 4,964 (3) | 4,285 (3) | 5,391 (3) | 5,283 (3) |
There was little variation in the insurance status of children hospitalized with CAP between 1997 and 2006. In each of the sampled years, at least 40% of sampled children were privately insured, at least 40% were publicly insured, and approximately 5% were uninsured (Table 1). In all years, there were significant racial/ethnic disparities in insurance coverage such that whites were 4 to 6 times more likely to have private insurance than blacks, however, the large amount of missing race/ethnicity data warrant caution in interpreting this finding (Table 2; also see Supporting Information Appendix B in the online version of this article). We also found that children less than 1 year old were the most likely to be publicly insured in all years (see Supporting Appendix C in the online version of this article). There were also regional differences related to insurance coverage such that a greater proportion of children hospitalized in facilities located in the southern part of the United States were publicly insured. Notably, there were no significant differences in CAP‐associated mortality or asthma related to insurance coverage (Table 2). In 2006, CAP‐associated complications occurred in 8.5% of children with private insurance, 6.5% of children with public insurance, and 7.7% of uninsured children; the relative distribution of complications by insurance type were similar in previous years of the KID survey.
| Private | Public | Uninsured | Other Insurance | P | |
|---|---|---|---|---|---|
| |||||
| No. of children (%) | 63,997 (41) | 80,226 (51) | 6,912 (4) | 5,283 (3) | |
| Male sex | 34,639 (41) | 44,140 (52) | 3,727 (4) | 2,808 (3) | 0.092 |
| Race | |||||
| White | 30,707 (55) | 21,282 (38) | 2,241 (4) | 1,774 (3) | <0.001 |
| Black* | 5,112 (27) | 12,239 (65) | 988 (5) | 426 (3) | |
| Other | 11,033 (27) | 26,489 (65) | 2,112 (5) | 1,076 (3) | |
| Missing | 17,145 (42) | 20,216 (49) | 1,572 (4) | 2,007 (4) | |
| Age category | |||||
| <1 year | 10,788 (29) | 24,762 (65) | 1,164 (3) | 880 (3) | <0.001 |
| 1 through 5 years | 33,664 (42) | 39,531 (50) | 3,442 (4) | 2,673 (3) | |
| 6 through 11 years | 11,660 (50) | 9,684 (41) | 1,085 (5) | 1,015 (4) | |
| >12 years | 7,885 (49) | 6,249 (39) | 1,221 (8) | 714 (4) | |
| Hospital type | |||||
| Urban non‐teaching | 22,429 (44) | 24,241 (49) | 2,440 (5) | 1,555 (2) | <0.001 |
| Rural | 10,880 (34) | 18,396 (58) | 1,290 (4) | 1,109 (3) | |
| Urban teaching non‐children's | 13,130 (44) | 14,542 (48) | 1,721 (6) | 750 (2) | |
| Urban teaching children's | 16,591 (40) | 21,544 (53) | 1,417 (3) | 1,465 (4) | |
| Region | |||||
| Northeast | 12,364 (52) | 9,620 (40) | 1,466 (6) | 377 (2) | <0.001 |
| Midwest∥ | 17,891 (50) | 15,573 (43) | 1,160 (3) | 1,215 (3) | |
| South∥ | 21,479 (33) | 38,112 (58) | 3,108 (5) | 2,495 (4) | |
| West∥ | 12,263 (39) | 16,921 (44) | 1,178 (5) | 1,195 (5) | |
| Asthma | 10,829 (41) | 13,923 (52) | 1,119 (4) | 866 (3) | 0.193 |
| Pneumonia‐associated complication | 5,416 (46) | 5,206 (45) | 532 (4) | 556 (5) | <0.001 |
| Died | 66 (34) | 115 (60) | 3 (1) | 8 (5) | 0.131 |
After examining the general and demographic characteristics, we then examined mean LOS for all children with CAP in each sample year (Table 3). The mean LOS for children with CAP was 3.44 days in 1997, with marginal decreases in subsequent years to a mean LOS of 3.18 days in 2006. The distribution of LOS for children with CAP revealed that nearly 70% of children were hospitalized for fewer than 3 days, another 22% to 28% were hospitalized for less than 1 week, and only 3% were hospitalized for more than 1 week. This distribution did not change substantially between 1997 and 2006. Next, we compared mean LOS by insurance type and race/ethnicity in unadjusted analyses. In each sample year, publicly insured children hospitalized with CAP had significantly longer LOS than privately insured children (P < 0.001). Similarly, in all years excepting 1997, uninsured children hospitalized with CAP had significantly shorter LOS than privately insured children. There were also significant racial differences in LOS for children with CAP, such that black children had longer LOS than white children with CAP. However, the large amount of missing data for race/ethnicity limited the robustness of this finding, and subsequent sensitivity analyses demonstrated that there were no consistent racial/ethnic disparities in LOS (see Supporting Appendix B in the online version of this article). These sensitivity analyses for missing race data did not alter our primary finding of shorter LOS for uninsured versus publicly or privately insured children.
| 1997 | P | 2000 | P | 2003 | P | 2006 | P | |
|---|---|---|---|---|---|---|---|---|
| ||||||||
| Overall | 3.44 (0.04) | 3.35 (0.05) | 3.27 (0.05) | 3.18 (0.04) | ||||
| Insurance type | ||||||||
| Private | 3.21 (0.04) | 3.19 (0.04) | 3.09 (0.04) | 3.00 (0.03) | ||||
| Public | 3.71 (0.06) | <0.001 | 3.57 (0.06) | <0.001 | 3.44 (0.06) | <0.001 | 3.34 (0.05) | <0.001 |
| Uninsured | 3.18 (0.14) | 0.792 | 2.92 (0.07) | <0.001 | 2.80 (0.05) | <0.001 | 2.82 (0.05) | <0.001 |
| Other | 3.32 (0.11) | 0.319 | 3.55 (0.14) | 0.0134 | 3.54 (0.21) | 0.037 | 3.42 (0.13) | 0.001 |
| Race | ||||||||
| White | 3.31 (0.05) | 3.18 (0.04) | 3.19 (0.05) | 3.10 (0.04) | ||||
| Black | 3.61 (0.08) | <0.001 | 3.32 (0.07) | <0.001 | 3.36 (0.08) | <0.001 | 3.31 (0.07) | <0.001 |
| Other | 3.96 (0.11) | <0.001 | 3.81 (0.09) | <0.001 | 3.67 (0.10) | <0.001 | 3.56 (0.08) | <0.001 |
| Missing | 3.27 (0.08) | 0.645 | 3.18 (0.08) | 0.926 | 2.99 (0.06) | 0.0134 | 2.86 (0.04) | <0.001 |
After controlling for child age, race/ethnicity, gender, hospital type, transfer status, and presence of asthma or pneumonia‐associated complications, our multivariable analyses examining the relationship between insurance coverage and hospital LOS yielded the following results (Table 4). First, publicly insured children had significantly longer hospital stays than privately insured children, and uninsured children had significantly shorter hospital stays than privately insured children in all years except 1997. Second, children admitted with CAP at urban teaching children's hospitals had significantly longer LOS than those admitted to urban non‐teaching hospitals, and, in 2003, children admitted with CAP to rural hospitals had significantly shorter LOS than those admitted to urban non‐teaching hospitals. Third, children older than 1 year consistently had shorter hospital stays than infants less than 1 year old. Finally, though concomitant diagnosis of asthma did not consistently influence LOS, children who developed any complications had significantly longer LOS than those who did not. The cumulative impact of seemingly small differences in LOS is great. For example, in 2006, our model suggests that, for every 1000 children hospitalized with CAP in a given year, after adjusting for differences in sex, age, race, hospital‐type, region, transfer status, and diagnosis of asthma or complications, publicly insured children spend 90 to 130 more days in the hospital than privately insured children, whereas uninsured children spend between 40 to 90 fewer days in the hospital than privately insured children.
| 1997 | 2000 | 2003 | 2006 | |
|---|---|---|---|---|
| Variable | IRR (95% CI) | IRR (95% CI) | IRR (95% CI) | IRR (95% CI) |
| ||||
| Age category | ||||
| <1 year | ||||
| 15 years | 0.82 (0.81, 0.84) | 0.83 (0.88, 0.95) | 0.86 (0.85, 0.88) | 0.87 (0.86, 0.89) |
| 611 years | 0.91 (0.87, 0.95) | 0.91 (0.88, 0.94) | 0.93 (0.91, 0.95) | 0.93 (0.90, 0.95) |
| >12 years | 1.03 (0.99, 1.07) | 1.17 (1.11, 1.22) | 1.09 (1.06, 1.13) | 1.13 (1.09, 1.16) |
| Race | ||||
| White | ||||
| Black | 1.04 (0.99, 1.08) | 1.00 (0.95, 1.03) | 1.00 (0.98, 1.03) | 1.02 (0.98, 1.06) |
| Other | 1.09 (1.05, 1.13) | 1.11 (1.08, 1.15) | 1.09 (1.06, 1.12) | 1.08 (1.05, 1.11) |
| Missing | 1.00 (0.94, 1.06) | 1.01 (0.96, 1.06) | 0.95 (0.92, 0.99)* | 0.96 (0.93, 0.99) |
| Sex | ||||
| Female | 1.02 (0.94, 1.06) | 1.01 (0.99, 1.02) | 1.01(0.93, 100) | 1.01 (1.00, 1.02) |
| Insurance type | ||||
| Private | ||||
| Public | 1.13 (1.11, 1.16) | 1.11 (1.09, 1.14) | 1.11 (1.09, 1.13) | 1.11 (1.09, 1.13) |
| Uninsured | 1.01 (0.91, 1.11) | 0.93 (0.89, 0.96) | 0.92 (0.90, 0.96) | 0.94 (0.91, 0.96) |
| Other | 1.01 (0.96, 1.06) | 1.10 (1.03, 1.18) | 1.10 (1.02, 1.19)* | 1.07 (1.02, 1.13) |
| Hospital type | ||||
| Urban non‐teaching | ||||
| Rural | 0.98 (0.92, 1.04) | 0.96 (0.92, 1.00) | 0.97 (0.94, 1.00) | 0.97 (0.93, 1.00) |
| Urban teaching (non‐children's) | 0.99 (0.95, 1.04) | 1.06 (1.02, 1.10) | 1.06 (1.02, 1.10) | 1.03 (0.99, 1.07) |
| Urban teaching children's | 1.2 (1.14, 1.26) | 1.23 (1.16, 1.30) | 1.28 (1.21, 1.37) | 1.25 (1.19, 1.31) |
| Region | ||||
| Northeast | ||||
| Midwest | 0.93 (0.88, 0.98)* | 0.96 (0.92, 1.00) | 0.95 (0.91, 0.99)* | 0.95 (0.91, 0.99)* |
| South | 0.98 (0.94, 1.02) | 1.06 (1.02, 1.10)* | 1.04 (1.00, 1.09) | 1.03 (0.98, 1.08) |
| West | 0.97 (0.92, 1.01) | 1.22 (1.16, 1.30)* | 1.02 (0.97, 1.08) | 1.06 (1.00, 1.12)* |
| Transfer status | ||||
| Transfer | 1.35 (1.25, 1.46) | 1.39 (1.27, 1.52) | 1.31 (1.23, 1.37 ) | 1.16 (1.10, 1.23) |
| Asthma | 0.99 (0.96, 1.03) | 0.97 (0.95, 0.99) | 0.98 (0.96, 1.00) | 0.98 (0.97, 1.00)* |
| Pneumonia Complications | 0.99 (0.96, 1.03) | 0.97 (0.95, 0.99)* | 0.98 (0.96, 1.0) | 0.98 (0.97, 1.00)* |
| Any complication | 2.20 (2.07, 2.34) | 2.23 (2.07, 2.40) | 2.22 (2.22, 2.44) | 2.37 (2.27, 2.47) |
DISCUSSION
In this nationally representative sample selected over the past 10 years, we found that publicly insured children hospitalized with CAP have significantly longer LOS than those who are privately insured, and that, since 2000, uninsured children hospitalized with CAP have significantly shorter LOS than those who are privately insured. Though these observed differences are small, they are consistent across all 4 sampled years and, because CAP is one of the most common pediatric inpatient diagnoses, the cumulative impact of the observed differences on hospital LOS is great. Insurance status is often considered a proxy for access to preventive and ambulatory healthcare services or socioeconomic status. However, the underlying mechanisms relating insurance status to healthcare access, utilization, and ultimately, health outcomes are highly complex and difficult to elucidate.17 The observed variation in this study raises questions about the potential influence of insurance status on hospital discharge practices. Additional research is necessary to understand whether there are differences in processes of care (eg, performance of blood cultures or chest radiographs), quality of care, or other outcomes, such as readmissions, related to CAP inpatient management for children with different insurance coverage.
Apart from differences in hospital discharge practices, another possible explanation for uninsured children with CAP having shorter LOS is that these children have less severe disease than privately insured. This may occur if uninsured children with CAP are evaluated in the emergency department rather than the office setting, because emergency department providers may be more likely to admit children with CAP who lack a consistent access to ambulatory primary care services. Countering this alternative, prior studies have shown that uninsured groups are more likely to have greater disease severity than privately insured groups at the time of hospital admission.18, 19 In this study, we attempted to identify children with greater severity of disease using ICD‐9 codes for CAP‐associated complications. Though this is a relatively crude method that might lead to an underestimate of the total number of children with complications, we found that there were no significant differences in the prevalence of CAP‐associated complications between uninsured and insured groups in all sampled years.
On the other hand, uninsured patients may be released earlier by providers in order to reduce the amount of uncompensated care provided, or possibly because parents may urge providers to discharge their children, given their inability to pay forthcoming hospital bills and/or avoid further lost wages due to work absence.20, 21 In California, Bindman et al. demonstrated that decreasing the frequency of Medicaid recertification, and consequently increasing the likelihood of continuous insurance coverage, was associated with a decreased risk of hospitalization for ambulatory‐care sensitive conditions.5
We also found that children admitted to urban teaching children's hospitals with CAP had significantly longer LOS than those admitted to urban non‐teaching hospitals, whereas children in rural hospitals had significantly shorter LOS than those in urban non‐teaching hospitals in 2003. These findings are consistent with prior data from 1996 to1998 demonstrating that children admitted to rural hospitals in New York and Pennsylvania had significantly shorter LOS than large urban hospitals for 19 medical and 9 surgical conditions, including pneumonia.12 These findings may reflect underlying differences in between rural and urban hospital transfer practices, whereby rural hospitals may be more likely than urban hospitals to transfer children with relatively more severe illness to urban referral centers and retain children with less severe illness, leading to shorter LOS.12 Though our empiric understanding of differences in LOS between teaching and non‐teaching hospitals is currently limited, clinical experience supports the notion that there may be decreases in efficiency that occur in teaching hospitals, and are a result of the supervision required for care provided by trainees. It is also possible that, despite our exclusion of comorbid conditions, some children with complex or chronic medical conditions were included in this study. These children are often cared for at teaching hospitals, regardless of the primary cause for admission, and are more likely to have public insurance than other children, thus confounding the relationship between hospital type, insurance type and status, and LOS for children with CAP. The limitations of this dataset preclude further examination of this issue.
There are some limitations to this study. First, the KID data are cross‐sectional and causal inferences are limited. However, our results demonstrating that uninsured children hospitalized with CAP had shorter LOS than privately insured children were quite consistent in each sample year, suggesting that our results are a true association. Additionally, insurance status in KID is typically collected at admission, however, it is not possible to determine whether specific changes to insurance status that occurred during the hospitalization were applied to the data. The impact of this limitation would depend on the type of insurance obtained by the patient. If uninsured patients obtained public insurance, our study would underestimate the increased LOS for publicly insured patients, compared with privately insured patients, but have no effect on the difference in LOS between uninsured and privately insured patients. In the unlikely event that uninsured patients obtained private insurance, then our study would underestimate the difference for uninsured patients, compared with privately insured patients, biasing our current study results towards the null. Second, a substantial proportion of sampled children had missing data for race/ethnicity. To assess the impact of the missing race/ethnicity data on our results, we conducted sensitivity analyses and found that, though difficult to make any definitive conclusions about the relationship between race/ethnicity and LOS for children with CAP, there were no changes to our primary findings regarding differences in LOS between children with different insurance status and type. Third, KID does not include data about other unmeasured confounders (eg, parent income, parent education, regular source of care) that might be related to LOS, as well as a broad spectrum of pediatric outcomes. Serious consideration of expanding KID to include these variables is warranted. Fourth, the other category of insurance is not uniformly coded across states in the KID database. While some states use this category to classify public insurance options other than Medicare and Medicaid, other states include private insurance options in this group. Thus, it is possible that some patients with public insurance are misclassified as having other insurance. We would expect such misclassification to bias our findings towards the null hypothesis. Finally, we focused on the relationship between child health insurance status and CAP, only 1 ambulatory care‐sensitive condition. Additional research examining the relationship between insurance type and other ambulatory care‐sensitive conditions is warranted.
In summary, we found that, after multivariable adjustment, uninsured children hospitalized with community‐acquired pneumonia had significantly shorter LOS than privately insured children, and publicly insured children had a significantly longer hospital stay than privately insured children in these 4 nationally representative samples from 1997 to 2006. Current federal and state efforts to increase enrollment of children into insurance programs are a first step in reducing healthcare disparities. However, insurance coverage alone does not guarantee access to healthcare, thus, these efforts in isolation will likely be insufficient to achieve optimal health for the children of our country. As healthcare reform legislation is implemented, these findings provide hospitals and policy makers additional impetus to develop ways to achieve the ideal length of stay for every child; this ideal state will be achieved when clinical status and course, rather than nonclinical factors such as insurance type or provider's unease with ambulatory follow‐up, determine the duration of hospitalization for every child.
- ,,,,,.Recurrent urinary tract infections in children: risk factors and association with prophylactic antimicrobials.JAMA.2007;298:179–186.
- ,.Factors associated with variability in outcomes for children hospitalized with urinary tract infection.J Pediatr.2009;154:789–796.
- ,,,,.Intravenous immunoglobulin in children with streptococcal toxic shock syndrome.Clin Infect Dis.2009;49:1369–1376.
- ,,.Pediatric hospital adherence to the standard of care for acute gastroenteritis.Pediatrics.2009;124:e1081–e1087.
- ,,.Medicaid re‐enrollment policies and children's risk of hospitalizations for ambulatory care sensitive conditions.Med Care.2008;46:1049–1054.
- ,.Differences associated with age, transfer status, and insurance coverage in end‐of‐life hospital care for children.J Hosp Med.2008;3:376–383.
- ,,,,,.Health care for children and youth in the United States: annual report on patterns of coverage, utilization, quality, and expenditures by a county level of urban influence.Ambul Pediatr.2006;6:241–264.
- ,,.Lengths of stay and costs associated with children's hospitals.Pediatrics.2005;115:839–844.
- ,.Variation in hospital discharges for ambulatory care‐sensitive conditions among children.Pediatrics.2000;106:942–948.
- ,,,,,.Ambulatory visit rates and antibiotic prescribing for children with pneumonia, 1994–2007.Pediatrics.2011;127:411–418.
- ,,,,.Patterns of hospital‐based pediatric care across diverse ethnicities: the case of pneumonia.J Health Care Poor Underserved.2004;15:462–473.
- ,,,,.Equivalent lengths of stay of pediatric patients hospitalized in rural and nonrural hospitals.Pediatrics.2004;114:e400–e408.
- ,.Effect of Child Health Insurance Plan enrollment on the utilization of health care services by children using a public safety net system.Pediatrics.2002;110:940–945.
- ,,,,,.Relationships between welfare status, health insurance status, and health and medical care among children with asthma.Am J Public Health.2002;92:1446–1452.
- HCUP Kids' Inpatient Database (KID). Healthcare Cost and Utilization Project (HCUP), 1997, 2000, 2003, 2006. Agency for Healthcare Research and Quality. Available at: http://www.hcup‐us.ahrq.gov/kidoverview.jsp. Accessed May 17,2010.
- ,,, et al.Community‐acquired pneumonia: can it be defined with claims data?Am J Med Qual.1997;12:187–193.
- .Sicker and poorer—the consequences of being uninsured: a review of the research on the relationship between health insurance, medical care use, health, work, and income.Med Care Res Rev.2003;60:3S–75S; discussion76S–112S.
- ,,,,,.Socioeconomic variation in asthma hospitalization: excess utilization or greater need?Pediatrics.1999;103:e75.
- ,,, et al.Analysis of 23 million US hospitalizations: uninsured children have higher all‐cause in‐hospital mortality.J Public Health (Oxf).2010;32(2)236–244.
- ,.The impact of welfare reform on parents' ability to care for their children's health.Am J Public Health.1999;89:502–505.
- ,,.Knowledge of welfare reform program provisions among families of children with chronic conditions.Am J Public Health.2002;92:228–230.
Copyright © 2011 Society of Hospital Medicine